Rab5 and Alsin regulate stress-activated cytoprotective signaling on mitochondria
- Max Planck Institute of Molecular Cell Biology and Genetics, Germany
- University of Queensland, Australia
Figures
Figure 1
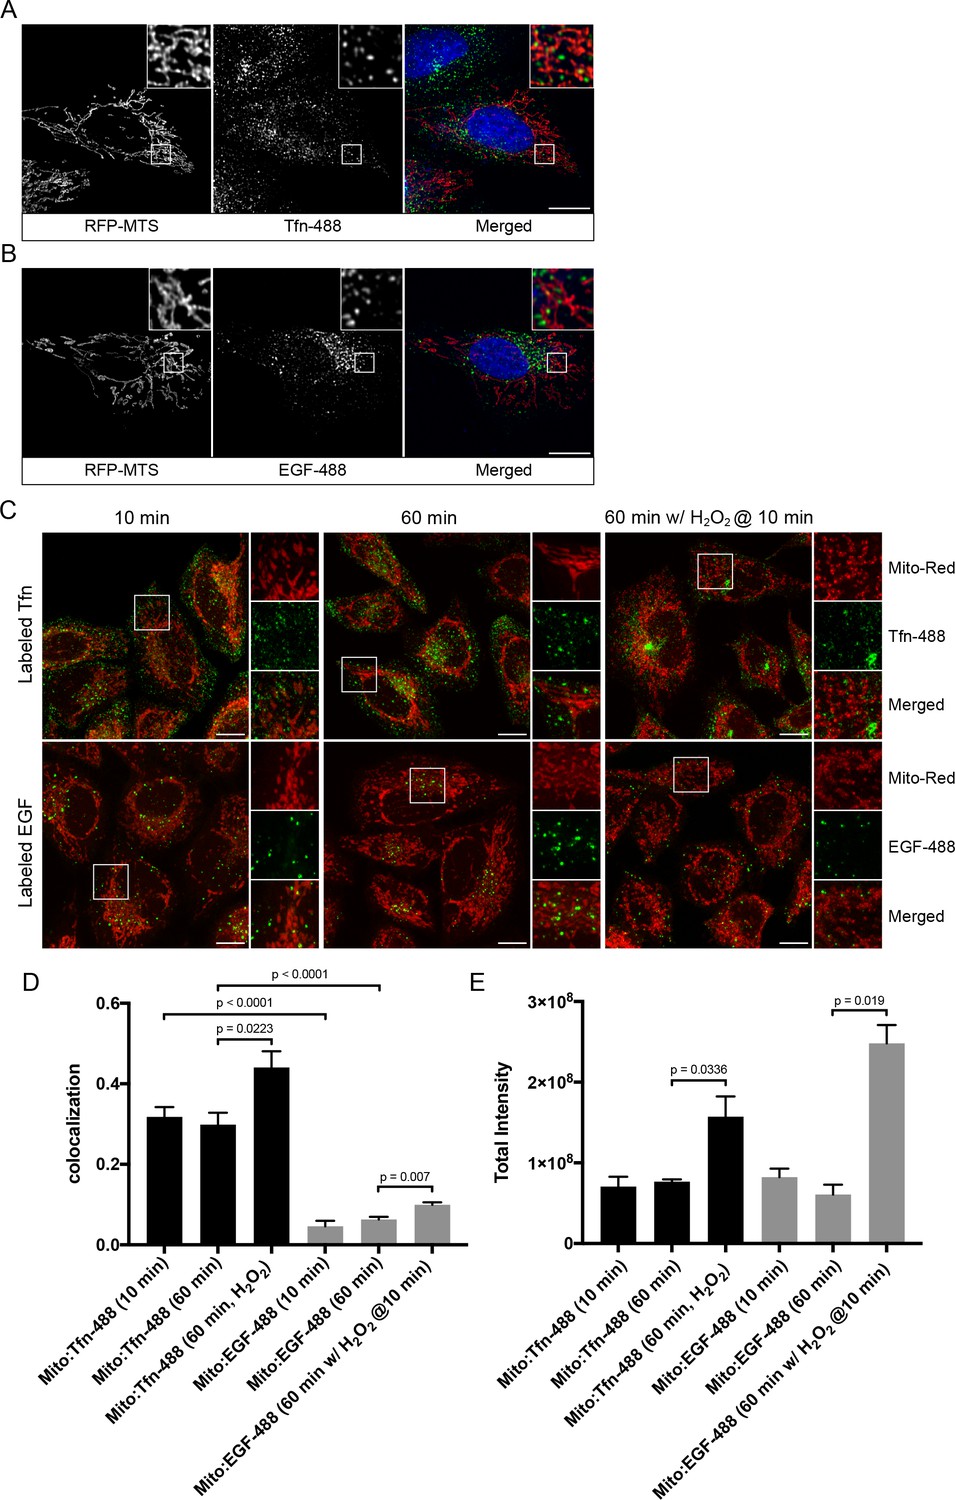
Endosomal contacts with mitochondria.
(A) and (B) HeLa cells were transfected with TagRFP-MTS (mitochondria targeting sequence) and labeled with either Alexa-488 transferrin (Tfn) or epidermal growth factor (EGF) at 37°C for 10 min, respectively. (C) HeLa cells stained with Mito-Red were labeled with Tfn-488 or EGF-488 at 37°C for 10, 60 min, or treated with 250 µM H2O2 after 10 min labeling followed by additional 50-min incubation. Inset regions are shown. Scale bars, 10 μm. (D) Colocalization analysis based on subtraction of random colocalization was performed between Mito-Red and Tfn-488 or EGF-488 from images obtained in Figure 1C, n = 50. (E) Quantification of total intensity per cell, n = 50. Error bars represent SEMs. p Values based on two-tailed t-tests.
-
Figure 1—source data 1
Numerical data corresponding to the graphs presented in Figure 1D,E.
- https://doi.org/10.7554/eLife.32282.004
Figure 2 with 2 supplements
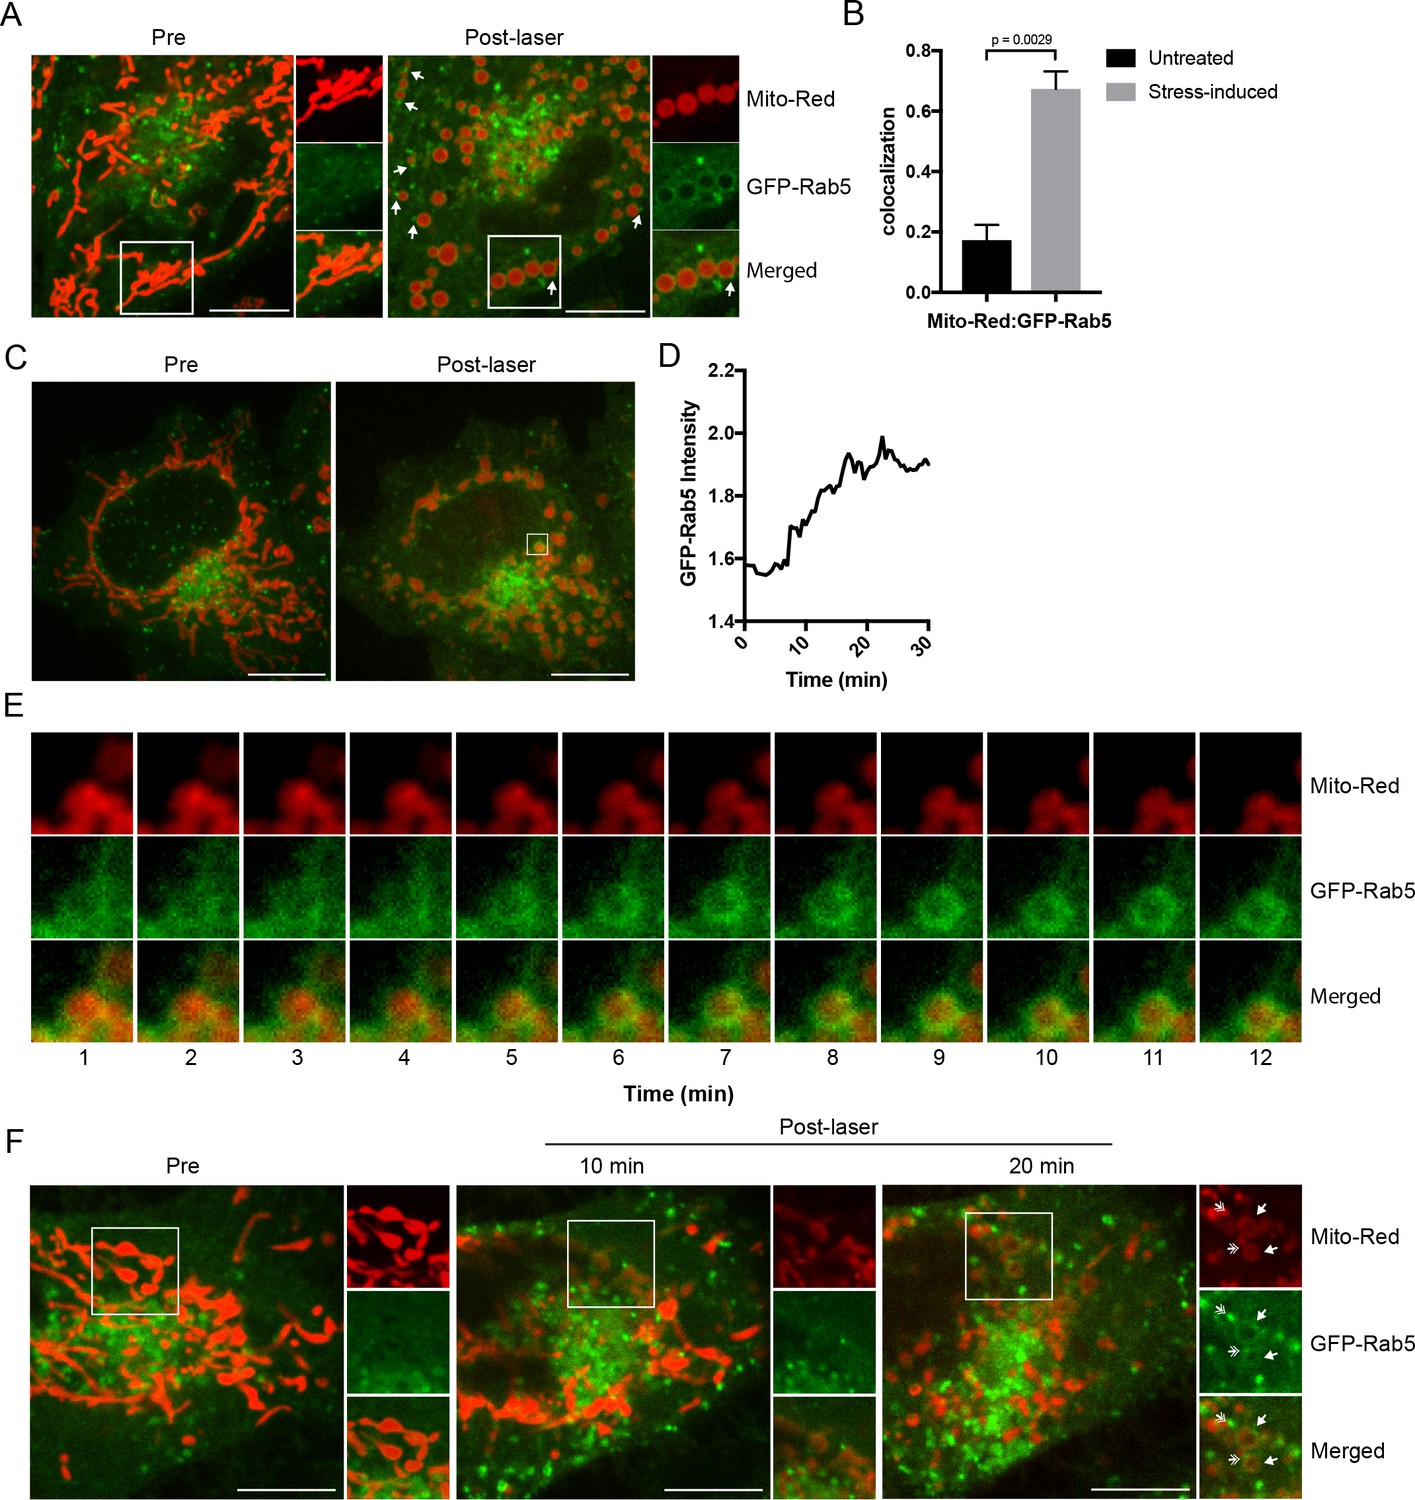
Recruitment of Rab5 to mitochondria upon laser-induced stress.
(A) Live BAC GFP-Rab5 HeLa cells were labeled with 100 nM Mito-Red at 37°C for 30 min. Cells were photoirradiated with a low dosage of 561 nm laser (~5 J/cm2) for 60 s. A snapshot of a cell before (Pre) and 20 min post-laser were taken. Arrowheads indicate GFP-Rab5-positive endosomes that are in close proximity to mitochondria. (B) Colocalization analysis between Mito-Red and GFP-Rab5 after photoirradiation as performed in (A), n = 5. Error bars represent SEMs. p Values based on two-tailed t-tests. (C) Live-cell imaging of a BAC GFP-Rab5 HeLa cell treated the same way as in (A). (D) Quantification of the GFP fluorescent signal over a period of 30 min from the inset region in (C). (E) Time-lapsed images of Mito-Red, GFP-Rab5, and merged from the inset region in (C). (F) Live-cell imaging of a BAC GFP-Rab5 HeLa cell photoirradiated only to the marked region (white box). The cell before laser irradiation is shown (Pre). Snapshots of the cell were taken at 10 min and 20 min post-laser. Inset images show the effect of laser treatment on mitochondrial morphology and network. Arrowheads indicate the recruitment of GFP-Rab5 (filled) and GFP-Rab5-positive endosomes near mitochondria (double-head). Scale bars, 10 μm.
-
Figure 2—source data 1
Numerical data corresponding to the bar graphs presented in Figure B.
- https://doi.org/10.7554/eLife.32282.011
-
Figure 2—source data 2
Numerical data corresponding to the line trace presented in Figure 2D.
- https://doi.org/10.7554/eLife.32282.012
Figure 2—figure supplement 1

Rab5 recruitment to mitochondria is specific to Mito-Red.
(A) HeLa cells were labeled with 100 nM MitoTracker-Green FM (Mito-Green) at 37°C for 30 min and photoirradiated with 561 nm laser (~10 J/cm2) for 60 s. Image was taken at 20 min post-laser treatment. Mitochondrial network remained tubular. (B) HeLa BAC GFP-Rab5 cells were transfected with TagRFP-MTS and photoirradiated with 561 nm laser (~10 J/cm2) for 60 s. Image was taken at 20 min post-laser treatment. (C) BAC GFP-Rab5 cells were seeded on gridded glass dishes, labeled with Mito-Red for 30 min, photoirradiated as before, and fixed after 30 min post-laser. Cells were immunostained with specific antibodies against Rab5 or TOM20. Inset regions are shown. Scale bars, 10 μm.
Figure 2—figure supplement 2
GFP-Rab5 enrichment on mitochondria persist for <60 min.
Time-lapse images of a cell following laser treatment as in Figure 2F. Inset images are shown at different time points (min). Arrowheads indicate the recruitment of GFP-Rab5 to mitochondria within 15 min, which sustain for at least 60 min. Scale bars, 10 μm.
Figure 3
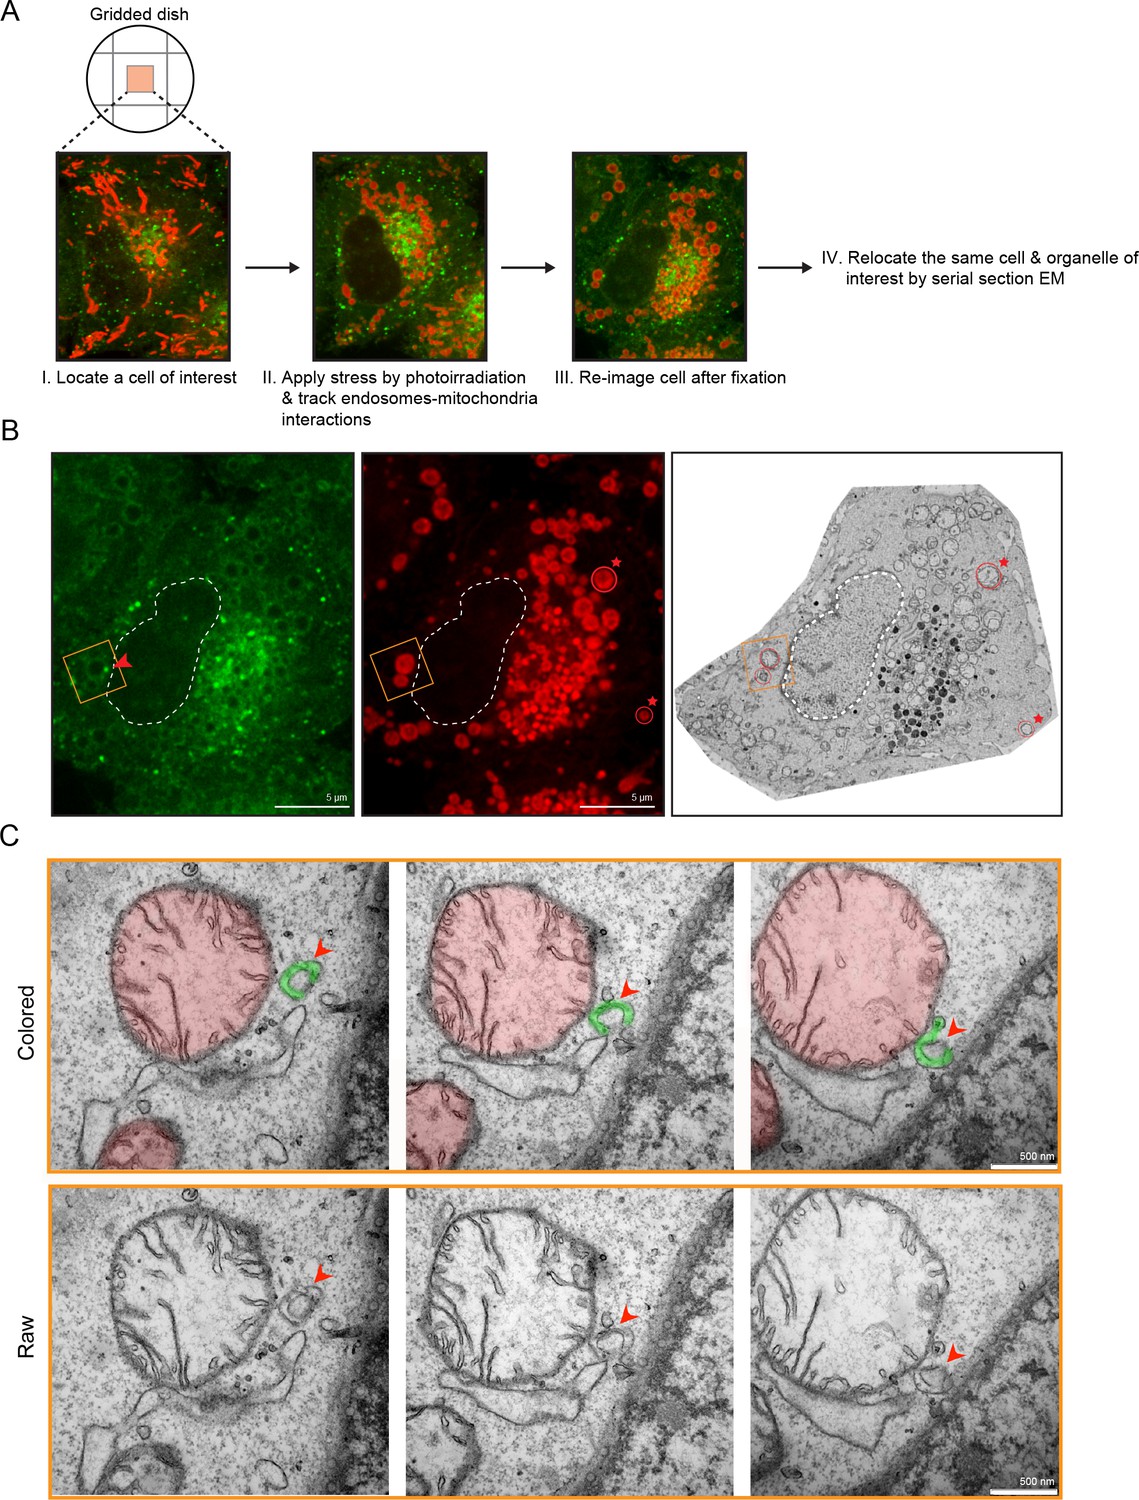
Membrane contacts between Rab5-positive mitochondria and endosomes.
Ultrastructural analysis of cells upon laser-induced stress. (A) Flow chart of the experimental set up. BAC GFP-Rab5 cells were seeded on gridded dishes, labeled with 100 nM Mito-Red at 37°C for 30 min. A cell of interest was then photoirradiated with a low dosage of 561 nm laser (~5 J/cm2) for 60 s. Live-cell imaging between GFP-Rab5-positive endosomes and mitochondria was assessed for organelle dynamics. The same cell was re-imaged for post-fixation analysis before processing for EM. (B) Fluorescent images of GFP-Rab5 and (Mito-Red) after fixation with glutaraldehyde. Box region shows a GFP-Rab5 endosome (red arrowhead) next to a swollen Rab5-positive mitochondrion. The transmission electron micrograph (TEM) of the same cell is shown (right panel). The nuclear membrane (dotted line) and mitochondria (red star) were used as fiducial markers. (C) Zoom-in images of the box region in (B). Colored images indicate the GFP-Rab5-positive structure in green and mitochondrion in red. Raw images are shown below. Mitochondrial cristae are visible. The membranous structure adjacent to the mitochondrion likely corresponds to ER. Scale bars, 500 nm.
Figure 4 with 4 supplements
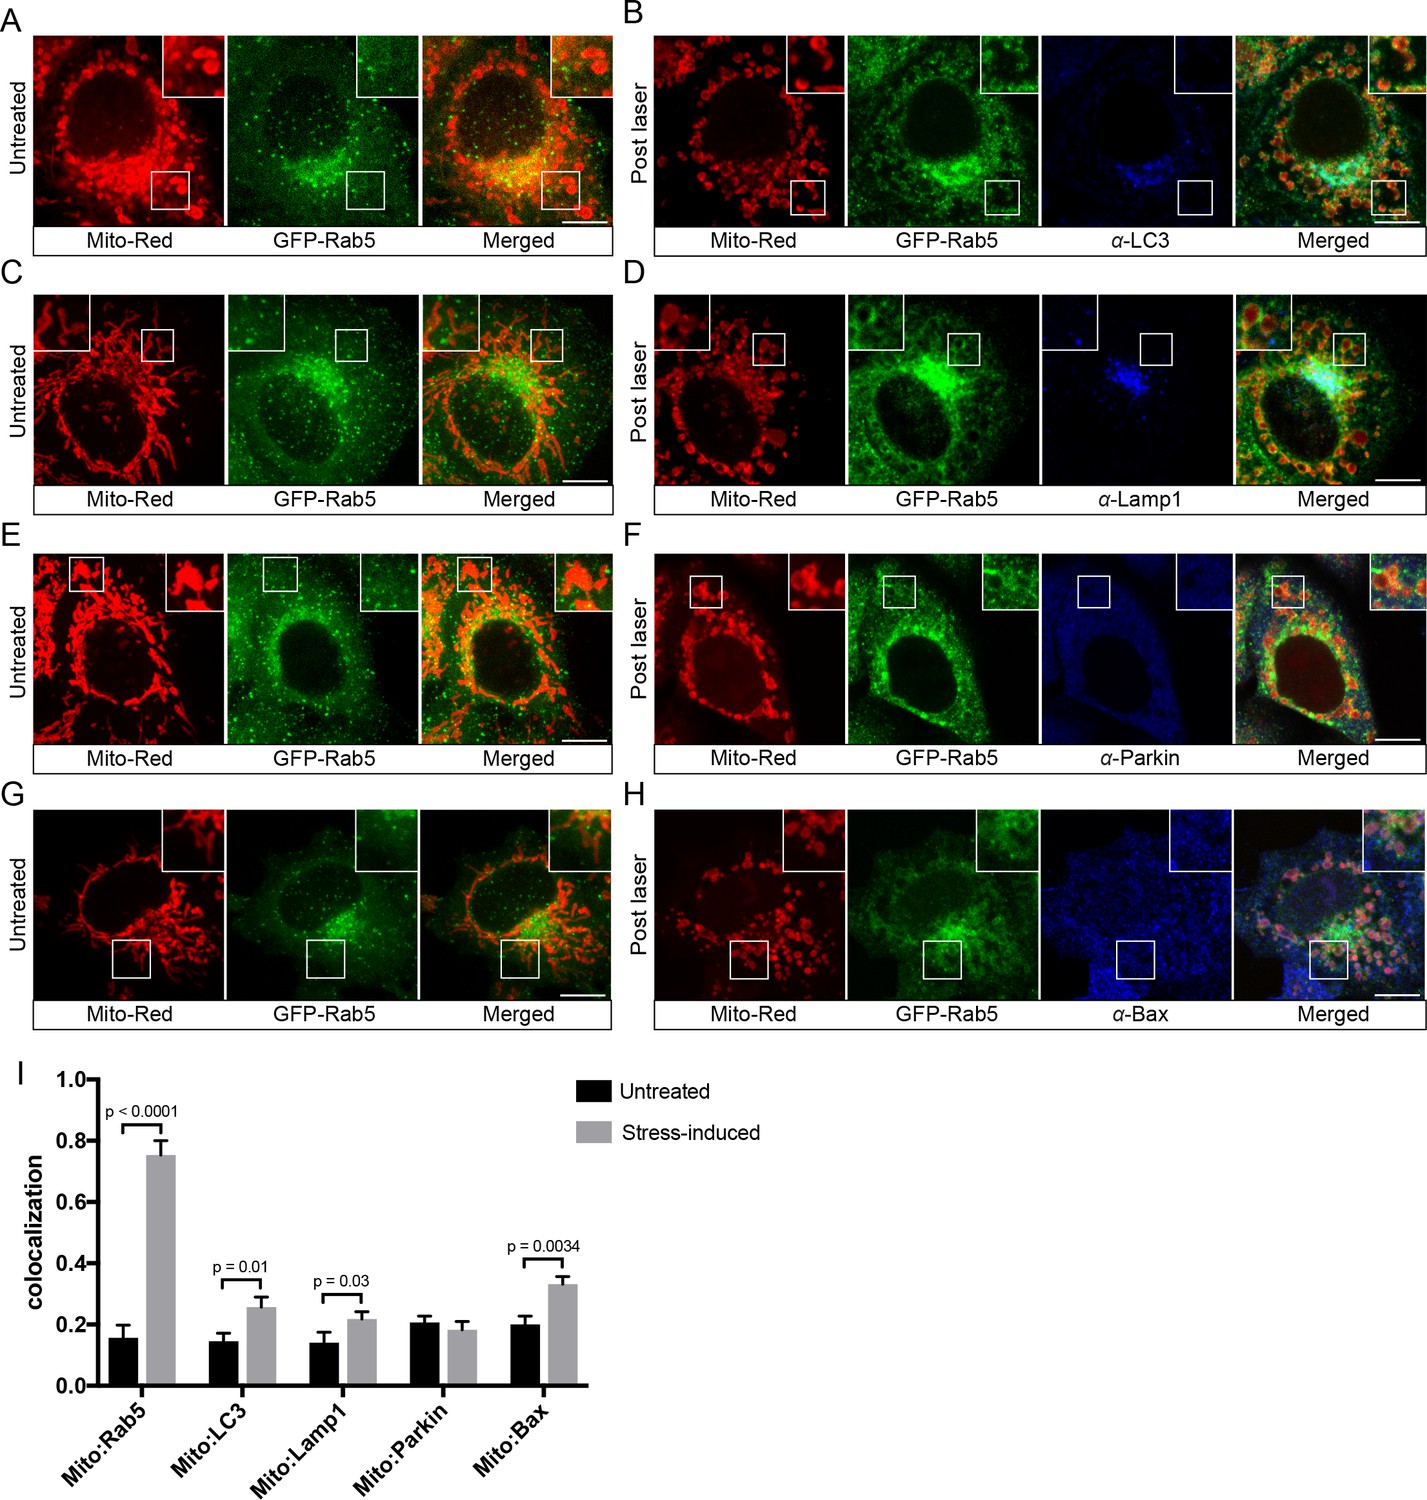
Localization of endogenous LC3, Lamp1, Parkin, and Bax upon laser-induced stress.
BAC GFP-Rab5 cells were labeled with 100 nM Mito-Red at 37°C for 30 min. Cells were acquired prior to laser irradiation as controls (Untreated) (A), (C), (E), and (G). Same cells were photoirradiated as before, fixed after 60 min post-laser treatment, and immunostained with specific antibodies against LC3 (B), Lamp1 (D), Parkin (F), and Bax (H). Inset images show the area before and after laser treatment. (I) Colocalization analysis of Mito-Red to Rab5, LC3, Lamp1, Parkin, and Bax, in untreated vs laser-induced conditions (n = 3). Untreated cells correspond to cells outside of the laser treated area. Error bars represent SEMs. p Values based on two-tailed t-tests. Scale bars, 10 μm.
-
Figure 4—source data 1
Numerical data corresponding to the bar graphs presented in Figure 4I.
- https://doi.org/10.7554/eLife.32282.024
Figure 4—figure supplement 1
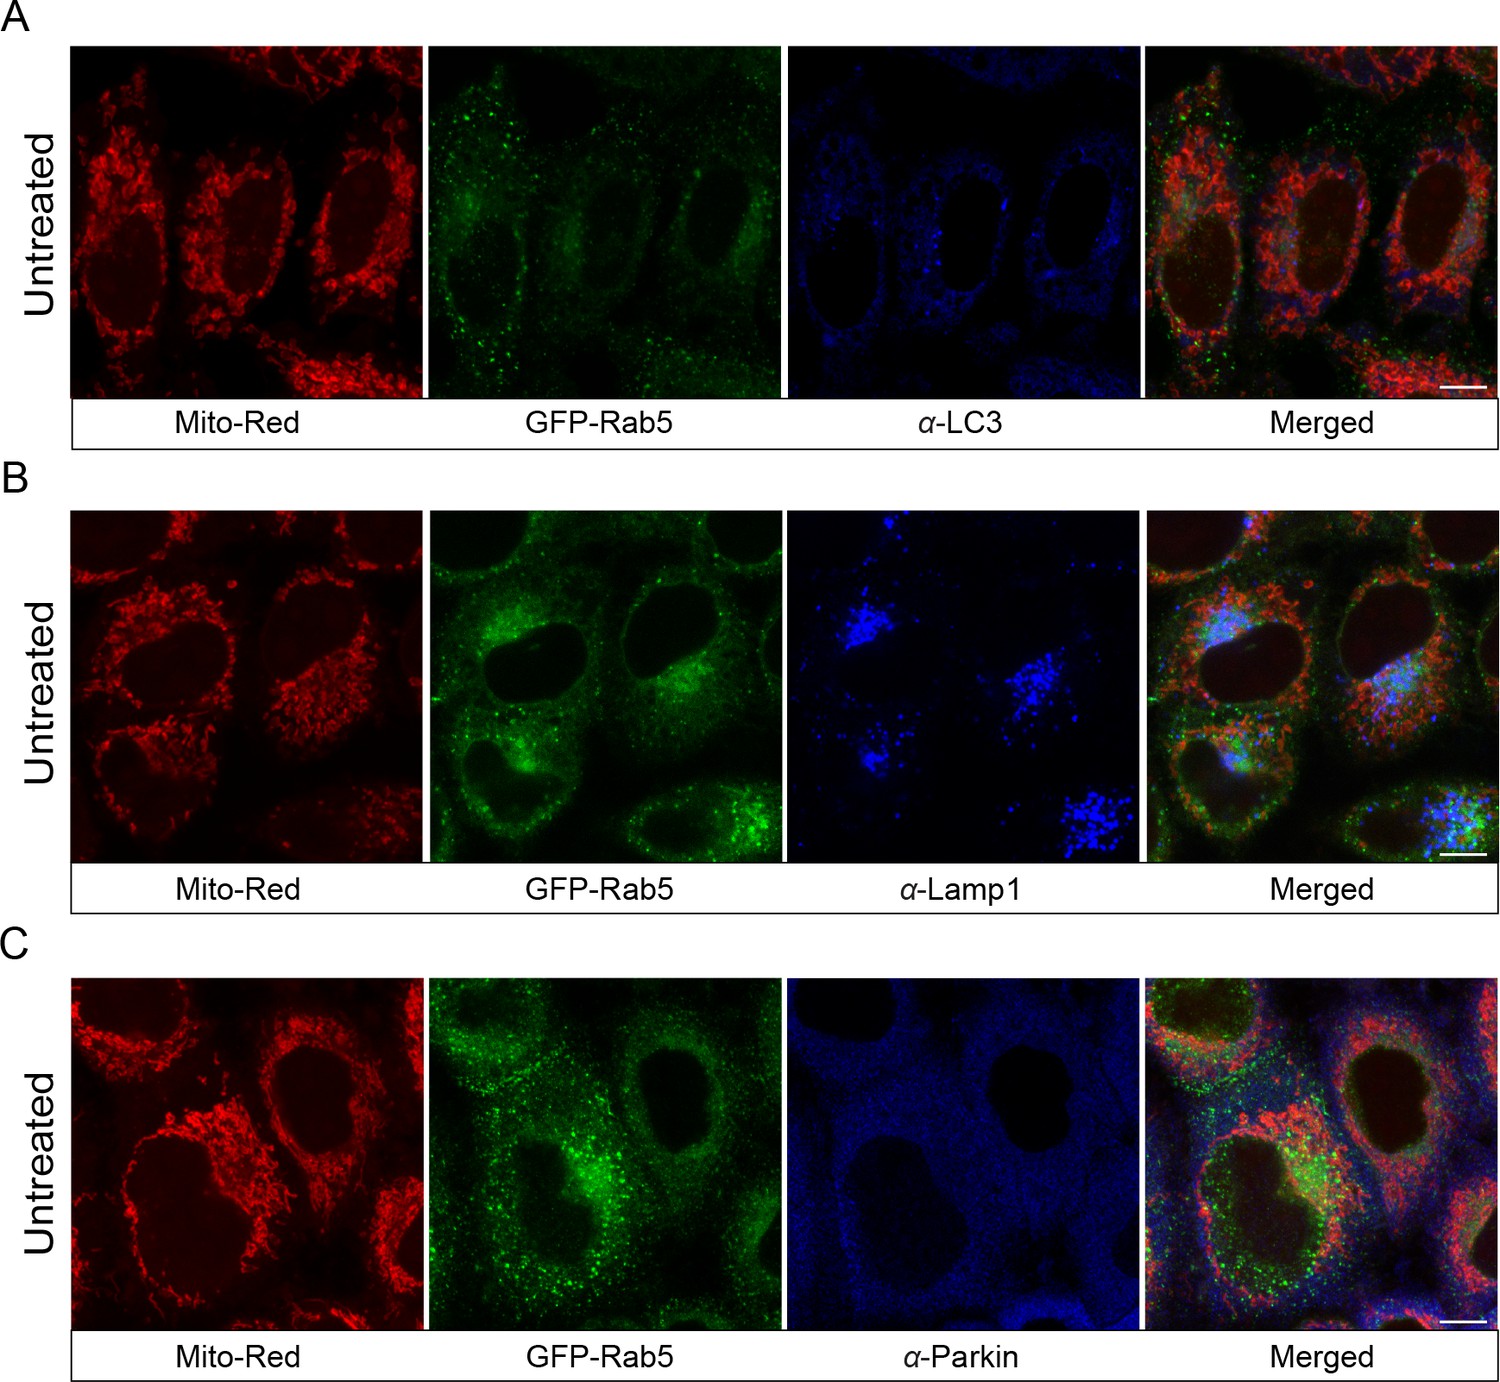
Localization of endogenous LC3, Lamp1, and Parkin in untreated cells.
BAC GFP-Rab5 cells were seeded on gridded glass dishes and labeled with 100 nM Mito-Red at 37°C for 30 min. Cells were fixed and immunostained with antibodies against LC3, Lamp1, and Parkin. Images were taken from the area outside of laser-treated cells. Scale bars, 10 μm.
Figure 4—figure supplement 2
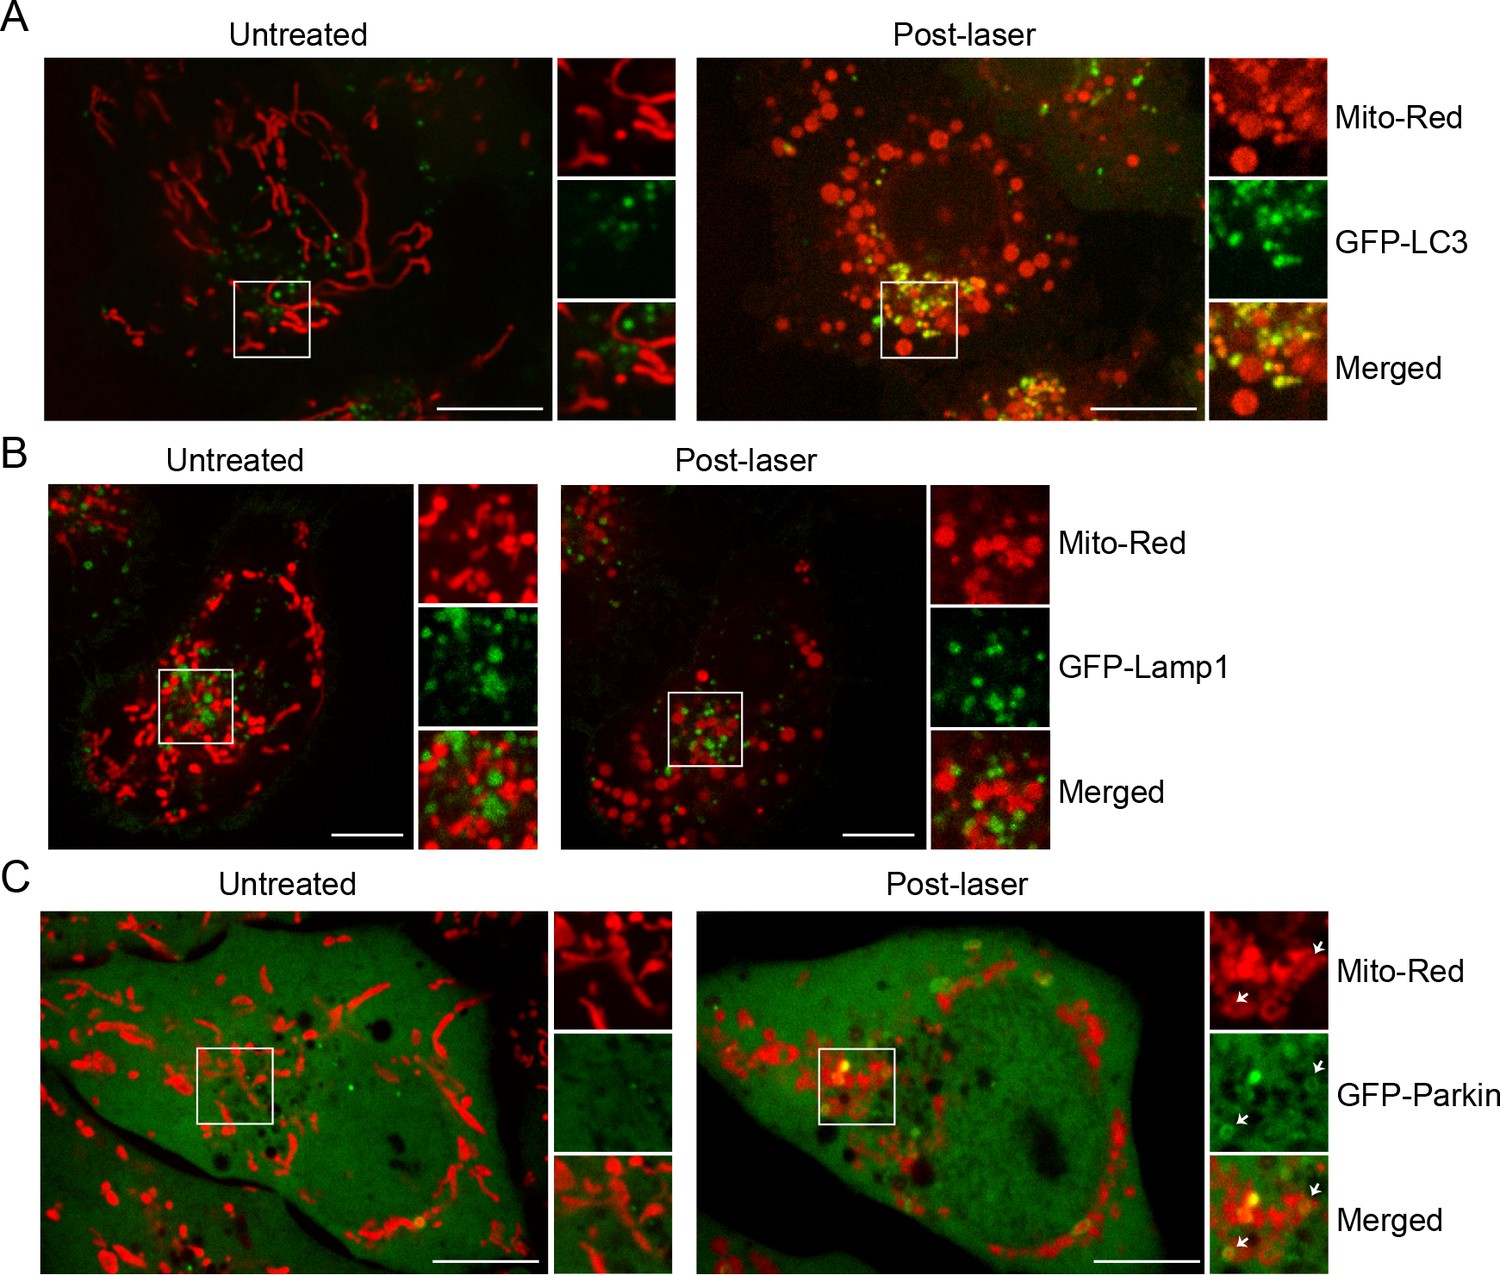
BAC GFP -LC3, -Lamp1, and -Parkin localization upon laser-induced stress.
Live-cell imaging of BAC GFP-LC3 (A), GFP-LAMP1 (B), and GFP-Parkin (C) cells. Cells were labeled with 100 nM Mito-Red at 37°C for 30 min and photoirradiated as before. Images of the same cell before (untreated) and 60 min post-laser treatment are shown. Inset images indicate the approximate area before and after laser treatment.
Figure 4—figure supplement 3
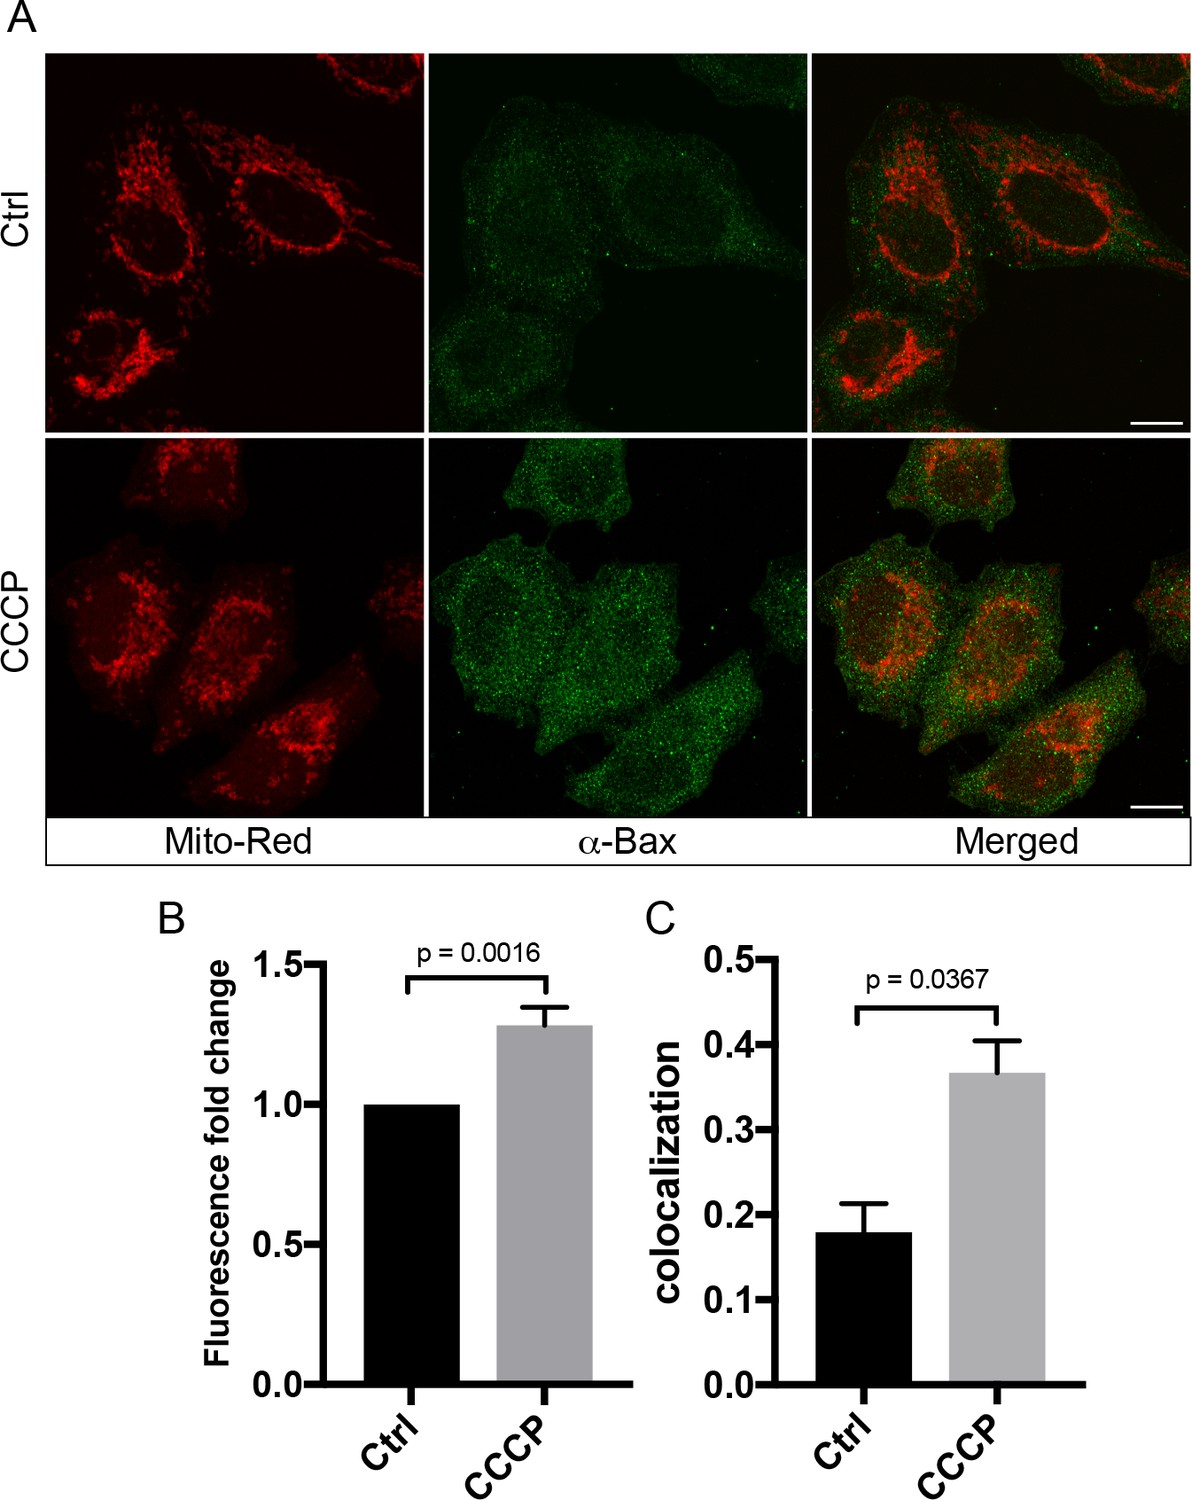
CCCP induces Bax protein expression and localization on mitochondria.
(A) HeLa cells labeled with 100 nM Mito-Red were treated with either DMSO (Ctrl) or 10 µM CCCP at 37°C for 2 hr. Cells were fixed and immunostained with antibody against Bax. Scale bars, 10 μm. (B) Fluorescence fold change of Bax signals between Ctrl and CCCP-treated cells; n = 50. Values in controls cells are normalized to one. (C) Colocalization analysis between Mito-Red and Bax in Ctrl vs CCCP. Error bars represent SEMs. p Values based on two-tailed t-tests.
-
Figure 4—figure supplement 3—source data 1
Numerical data corresponding to the bar graphs presented in Figure 4—figure supplement 3B,C.
- https://doi.org/10.7554/eLife.32282.022
Figure 4—figure supplement 4
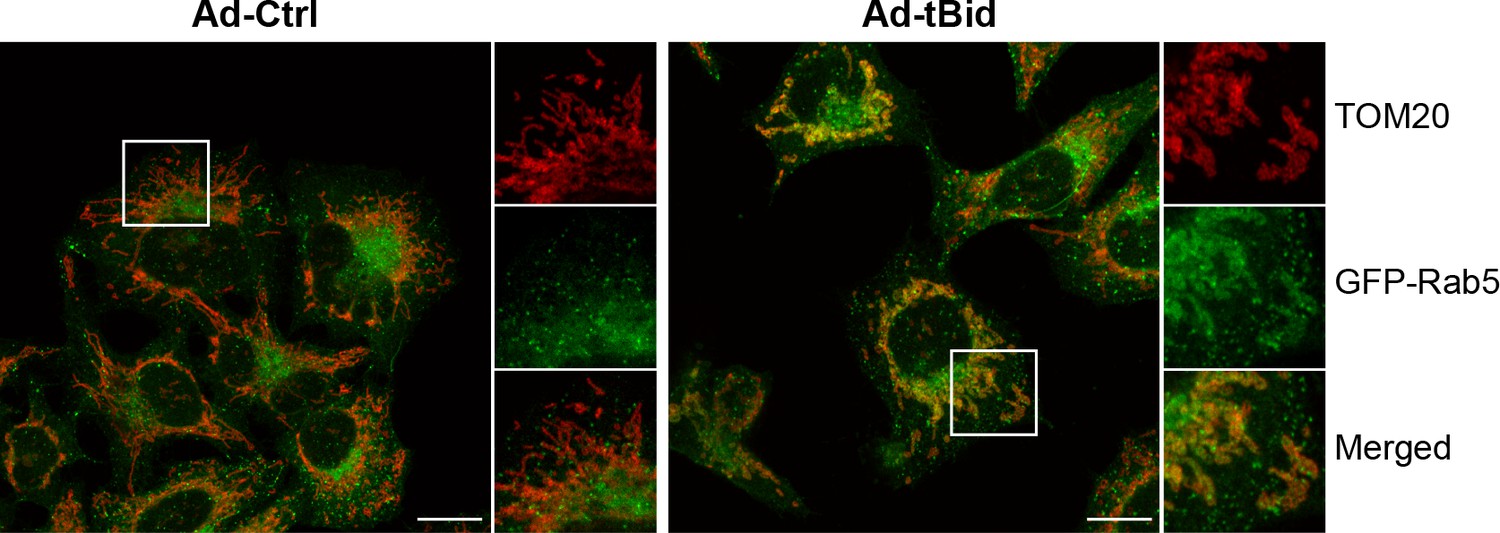
tBid over-expression leads to Rab5 enrichment on mitochondria.
BAC GFP-Rab5 cells were infected with control adenovirus (Ad-Ctrl) or Ad-tBid at 37°C for 12 hr. Cells were fixed and immunostained with TOM20 antibody. Inset regions are shown. Scale bars, 10 μm.
Figure 5 with 1 supplement
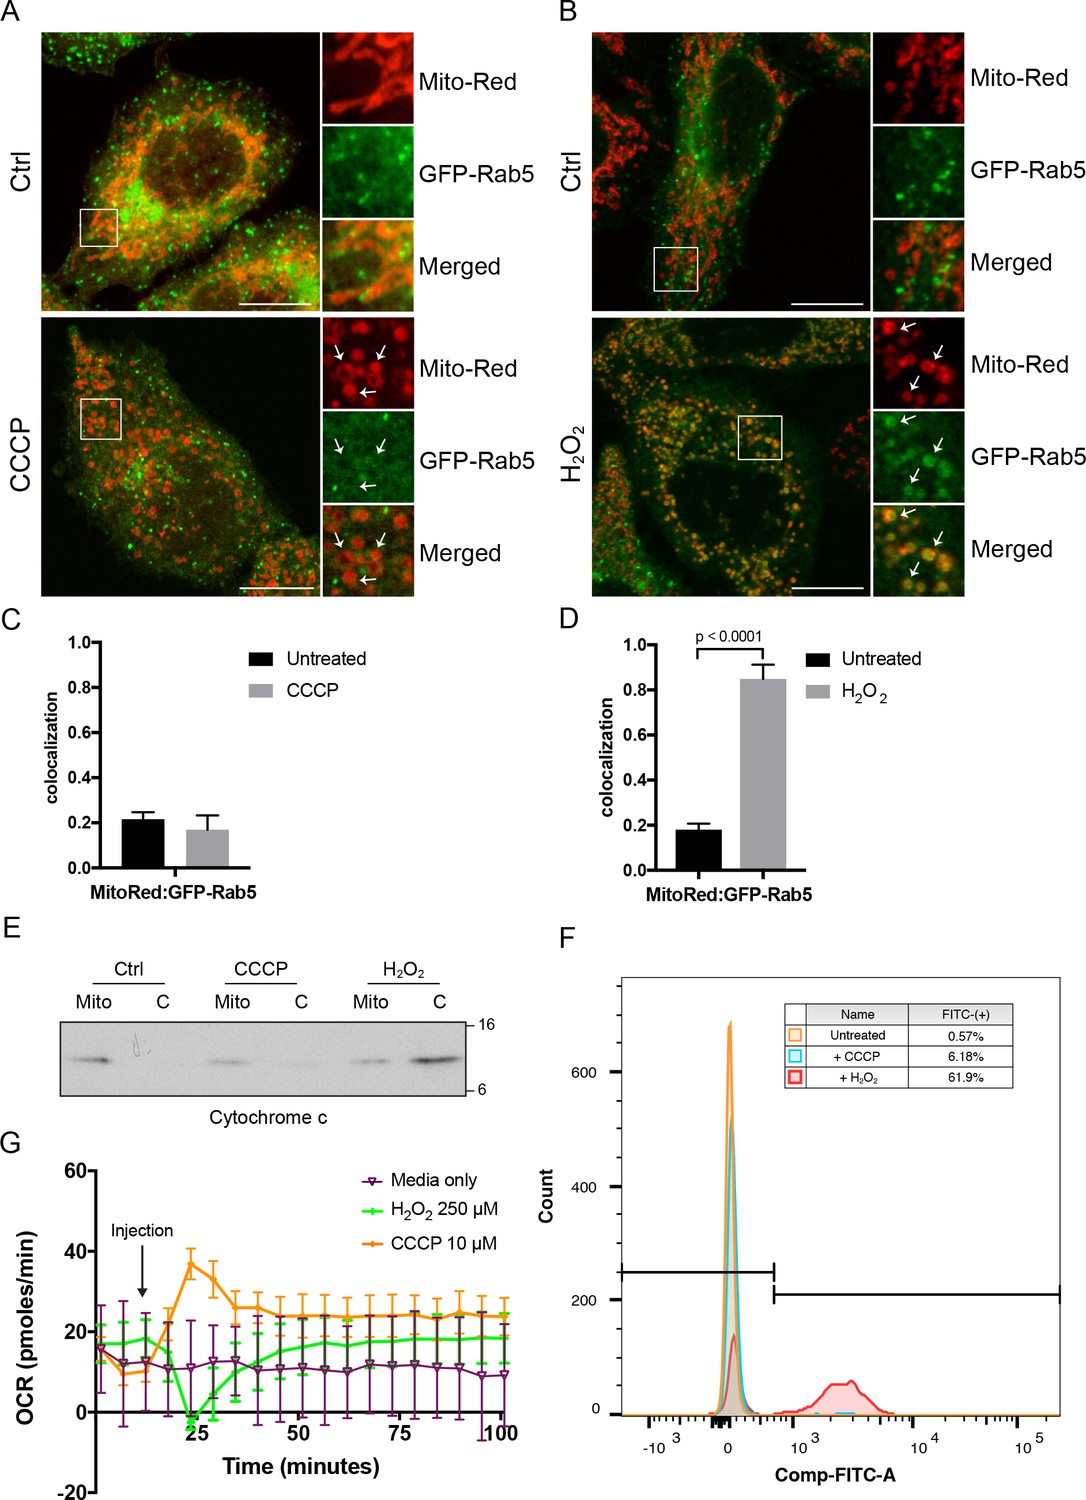
Effects of CCCP vs H2O2 on Rab5 recruitment to mitochondria.
BAC GFP-Rab5 HeLa cells labeled with 100 nM of Mito-Red were treated with either DMSO (Ctrl), 10 μM CCCP (A), or 250 μM H2O2 at 37°C for 2 hr (B). Cells were fixed and imaged by confocal microscopy. Inset regions reveal the effect on mitochondrial morphology and GFP-Rab5 localization upon treatment. Arrowheads indicate rounded and stressed mitochondria in both CCCP- and H2O2- treated conditions. Scale bars, 10 μm. (C) and (D) Colocalization analysis between Mito-Red and GFP-Rab5 in (A) and (B), respectively; n = 50. Error bars represent SEMs. p Values based on two-tailed t-tests. (E) Subcellular fractionation was performed in HeLa cells treated with DMSO (Ctrl), 10 μM CCCP, or 250 μM H2O2 at 37°C for 2 hr. Protein samples from purified mitochondria (Mito) and cytosolic (C) fractions were loaded onto SDS-PAGE and imunoblotted with cytochrome c antibody. (F) Cells were treated the same way as in (E). Cells were then resuspended in live-cell imaging solution containing 500 nM caspase-3/7 green flow cytometric reagent and incubated at 37°C for 30 min before subjecting to flow cytometric analysis. FITC signal (x-axis) is plotted against the total cell count (y-axis). The gating was set based on the background signal in DMSO control. (G) HeLa cells were seeded in the Seahorse 96-well plate format and incubated overnight. Growth medium was exchanged to bicarbonated-free low-buffered assay medium (provided by the manufacturer) supplemented with 10 mM galactose immediately before the start of the experiment. Oxygen consumption rate measurements were measured in the Seahorse XFe96 Analyzer from cells injected with media only (purple), 250 µM H2O2 (green), or 10 µM CCCP (orange). Error bars represent SEMs.
-
Figure 5—source data 1
Numerical data corresponding to the bar graphs presented in Figure 5C,D.
- https://doi.org/10.7554/eLife.32282.027
-
Figure 5—source data 2
Numerical data corresponding to the line traces presented in Figure 5G.
- https://doi.org/10.7554/eLife.32282.028
Figure 5—figure supplement 1

CCCP, but not H2O2, leads to Parkin recruitment.
(A) BAC GFP-Parkin or WT HeLa cells (B) were treated with either DMSO (Ctrl), 10 µM CCCP, or 250 µM H2O2 at 37°C for 2 hr. Cells were fixed and imaged by confocal microscopy. HeLa cells were immunostained with Parkin antibody. Inset regions are shown. Scale bars, 10 μm.
Figure 6
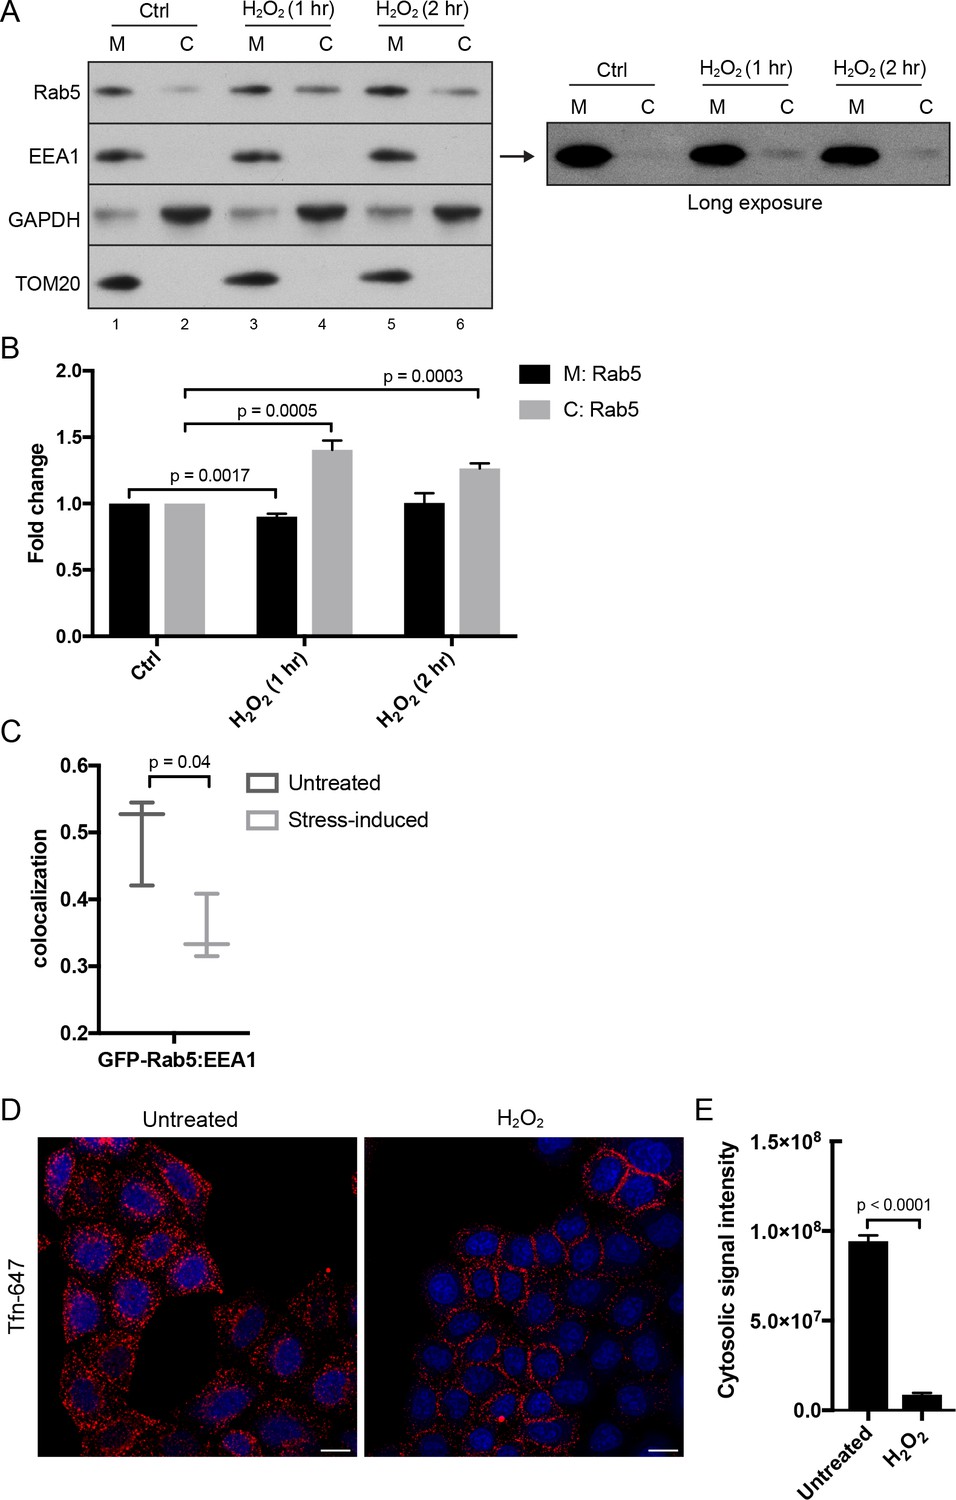
Hydrogen peroxide (H2O2) treatment decreases Rab5 membrane association on EE, increases early endosomal-mitochondrial contacts, and reduces transferrin uptake.
(A) Subcellular fractionation was performed in HeLa cells treated with H2O2 for 1 and 2 hr. The total membrane (M) fraction was obtained by centrifugation of the post nuclear supernatant at 200,000 g at 4°C for 1 hr, and supernatant was taken as cytosolic (C) fraction. Protein samples were loaded onto SDS-PAGE and imunoblotted with antibodies against Rab5, EEA1, GAPDH, and TOM20. The long exposure blot for EEA1 is shown (right panel). (B) Densitometric quantification of Rab5 in (A). Band intensities were calculated as normalized ratio between Rab5 to TOM20 in the M fraction, and Rab5 to GAPDH in the C fraction. Fold change is plotted on the y-axis. Error bars represent SEMs from three independent experiments. (C) BAC GFP-Rab5 HeLa cells were incubated with/out 250 µM H2O2 at 37°C for 2 hr. Cells were fixed and immunostained with EEA1 antibody. Colocalization analysis was performed between GFP-Rab5 and EEA1. (D) HeLa cells were seeded in a 384-well plate and pre-treated with either PBS (control) or 250 μM H2O2 at 37°C for 10 min. Cells were then pulsed with Alexa-647 Tfn (10 μg/ml) for 5 min, washed with PBS, fixed, and stained with DAPI (nuclear) and CellMask Blue (cytoplasmic) dyes. Images were acquired by the Yogokawa confocal microscope. Scale bars, 10 μm. (E) Quantification of the cytoplasmic fluorescence intensity per cell, n = 50. p Values based on two-tailed t-tests.
-
Figure 6—source data 1
Numerical data corresponding to the bar graph presented in Figure 6B.
- https://doi.org/10.7554/eLife.32282.030
-
Figure 6—source data 2
Numerical data corresponding to the chart presented in Figure 6C.
- https://doi.org/10.7554/eLife.32282.031
-
Figure 6—source data 3
Numerical data corresponding to the bar graphs presented in Figure 6E.
- https://doi.org/10.7554/eLife.32282.032
Figure 7
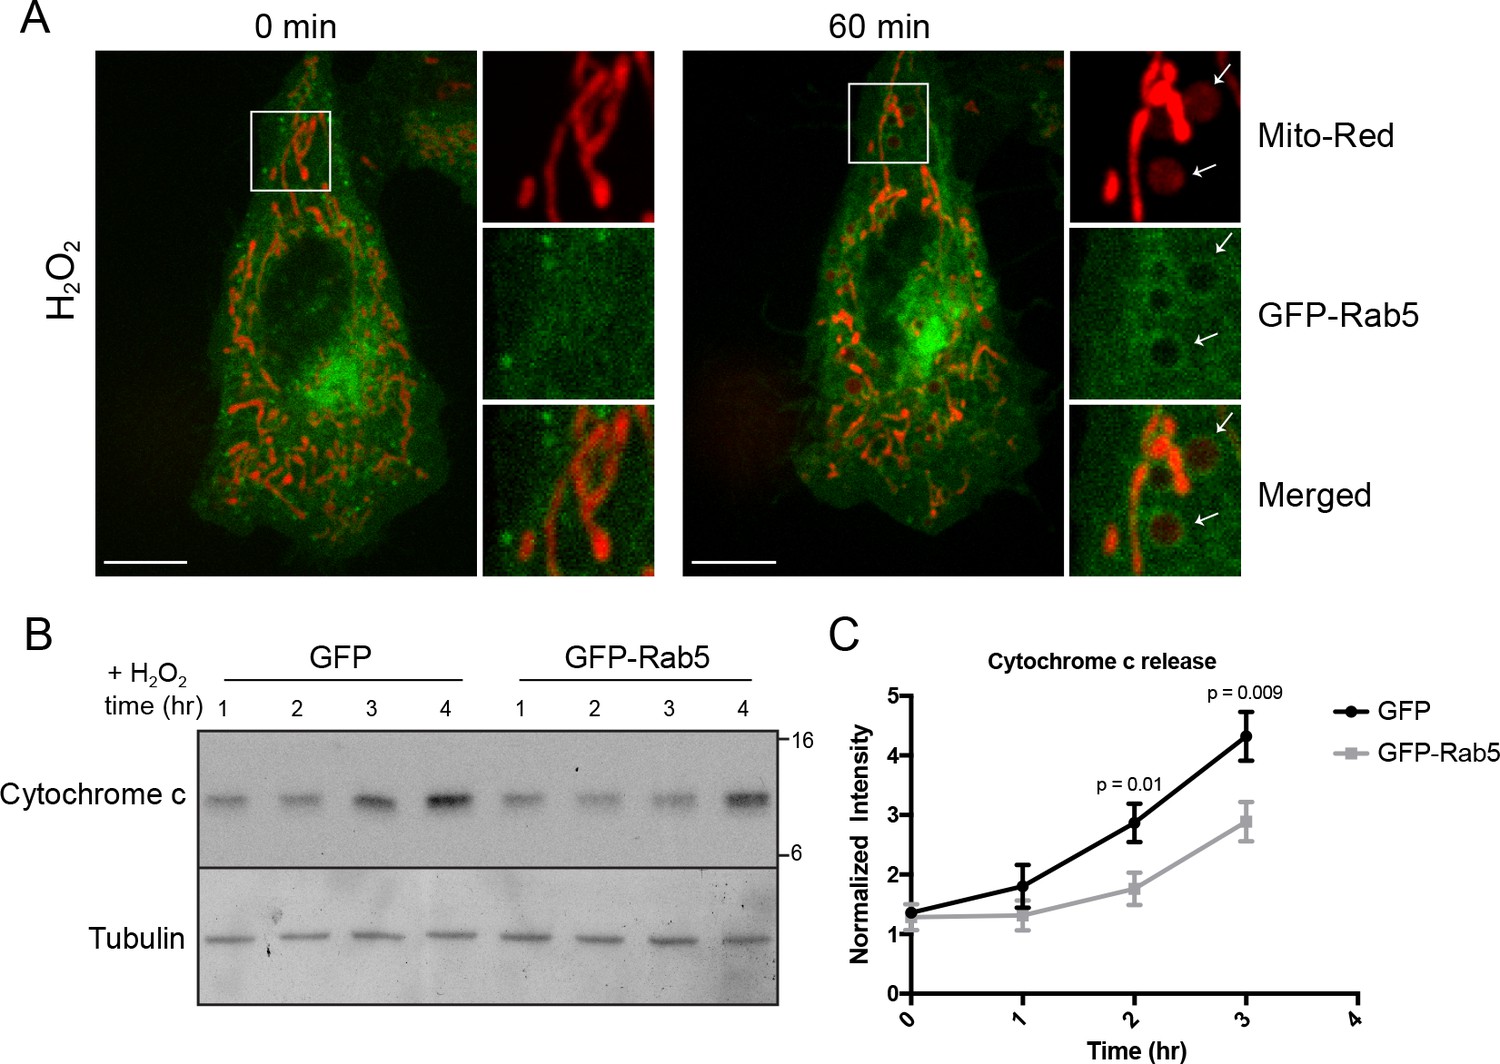
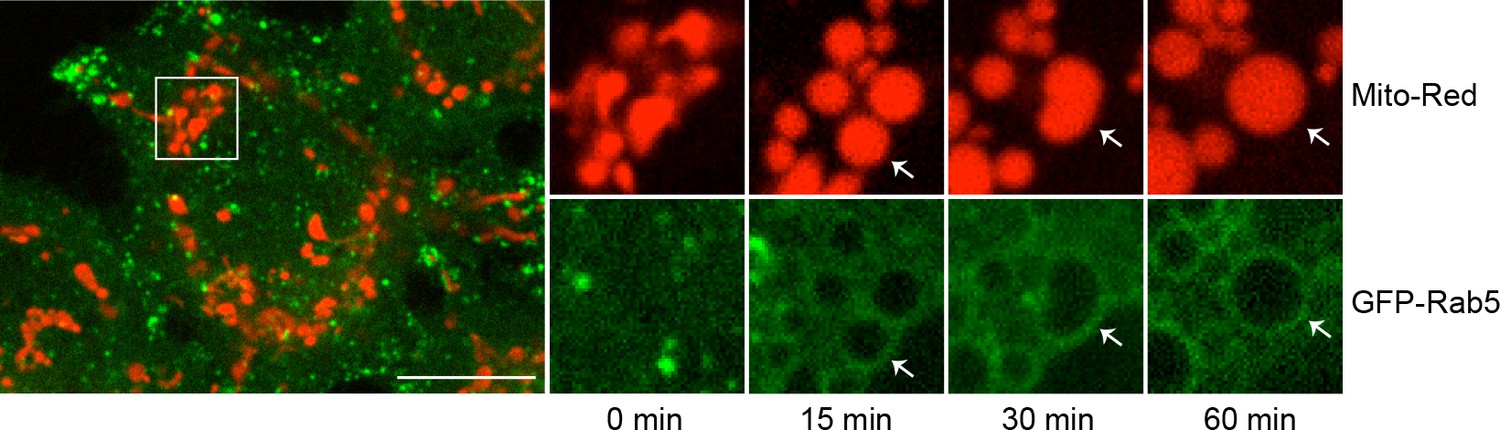
Rab5 regulates cytochrome c release during H2O2-induced stress.
(A) Live-cell imaging of a BAC GFP-Rab5 cell stained with 100 nM Mito-Red before (0 min) and after treatment (60 min) with 250 μM H2O2 at 37°C. Inset images are shown and arrowheads indicate GFP-Rab5 recruitment to MOMP events (right panel). Scale bars, 10 μm. (B) HeLa cells over-expressing either GFP or GFP-Rab5 were treated with 250 μM H2O2 at 37°C for 1 to 4 hr. Protein samples from cytosolic fractions were obtained and immunoblotted for cytochrome c and tubulin (as a loading control). (C) Densitometric quantification of cytochrome c release in (B). Data were collected from three independent experiments. Y-axis corresponds to the normalized ratio intensity of cytochrome c to the tubulin loading control. p Values based on two-tailed t-tests.
-
Figure 7—source data 1
Numerical data corresponding to the line traces presented in Figure 7C.
- https://doi.org/10.7554/eLife.32282.034
Figure 8
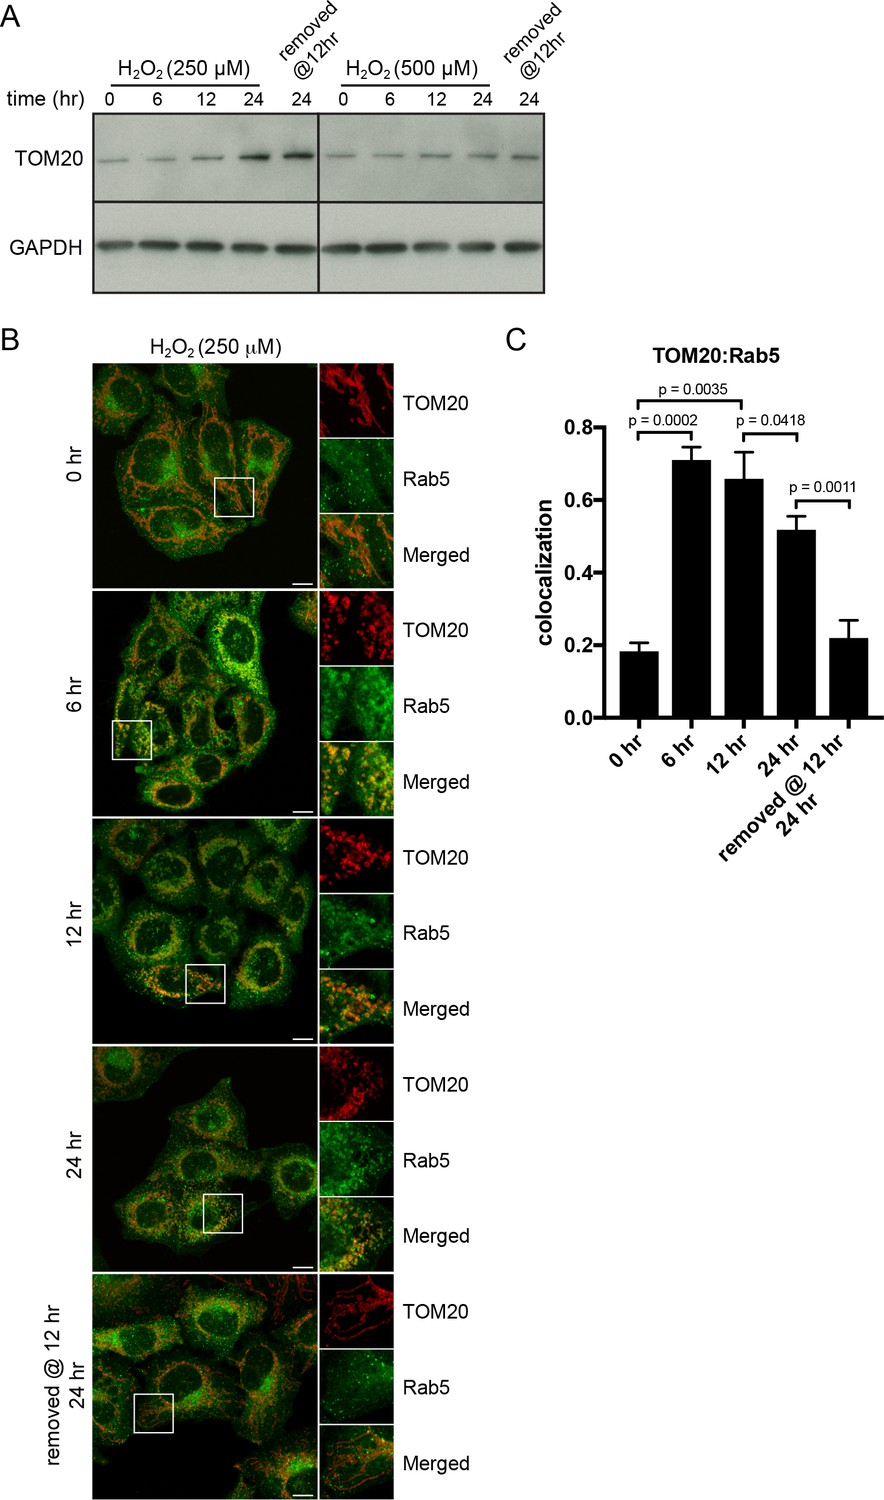
H2O2-induced translocation of Rab5 to mitochondria is reversible.
HeLa cells were seeded in 24-well plates (A) or on glass coverslips (B), and after overnight incubation, were treated with either 250 µM or 500 µM H2O2 at 37°C for 0, 6, 12, 24 hr, or replaced with a fresh medium at 12 hr followed by additional 12 hr incubation. (A) Cells were then harvested in SDS loading buffer and protein lysates were loaded onto SDS-PAGE and immunoblotted with TOM20 and GAPDH antibodies. (B) Cells were fixed and immunostained with Rab5 and TOM20 antibodies. Inset regions are shown. Scale bars, 10 μm. (C) Colocalization analysis between TOM20 and Rab5 in (B), n = 50. p Values based on two-tailed t-tests.
-
Figure 8—source data 1
Numerical data corresponding to the bar graphs presented in Figure 8C.
- https://doi.org/10.7554/eLife.32282.037
Figure 9 with 2 supplements
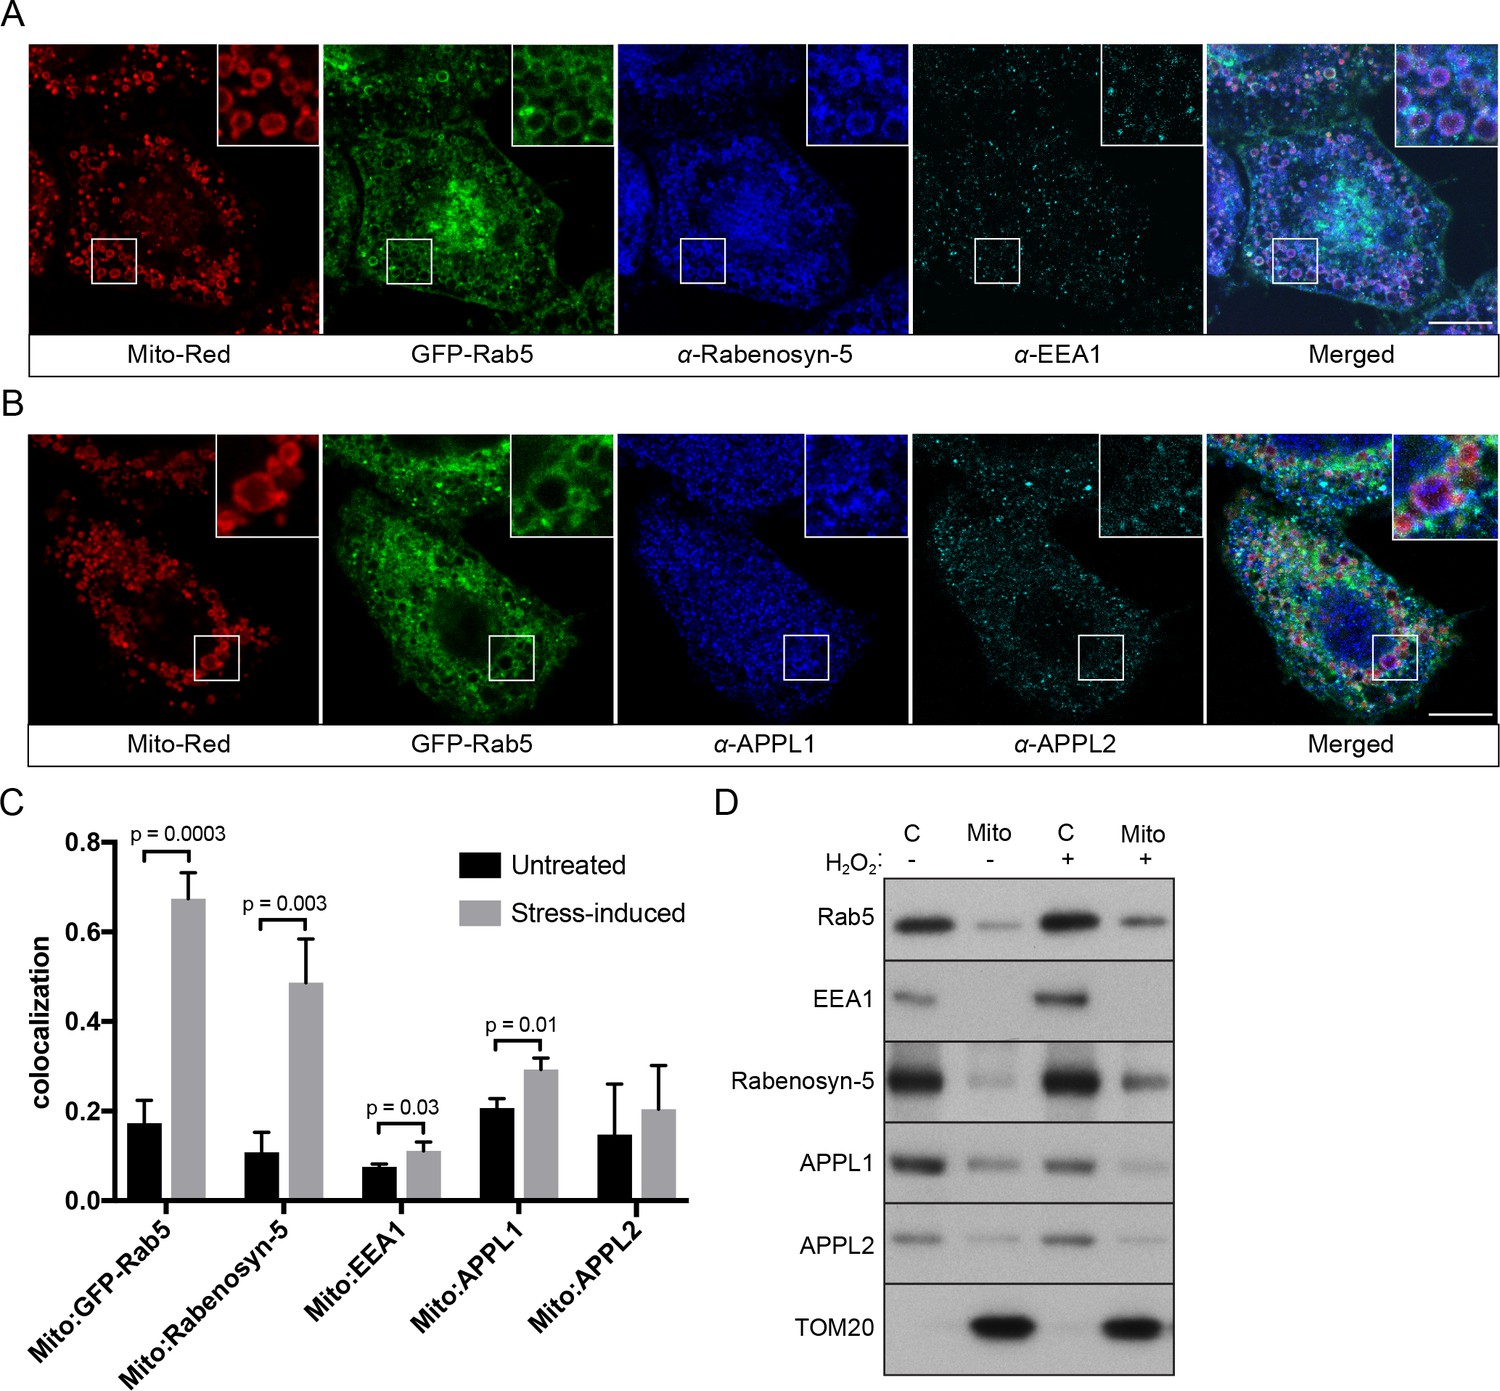
Localization of Rab5 effectors upon mitochondrial stress.
BAC GFP-Rab5 cells seeded on gridded dishes were labeled with Mito-Red and photoirradiated as before. Cells were fixed after 30 min post-laser treatment and immunostained with antibodies against ZFYVE20 and EEA1 (A), or APPL1 and APPL2 (B). Inset regions are shown. Scale bars, 10 μm. (C) Colocalization analysis from untreated and laser-treated cells in (A) and (B), n = 3. p Values based on two-tailed t-tests. (D) Subcellular fractionation was performed in HeLa cells treated with either PBS (control) or 250 μM H2O2 at 37°C for 2 hr. Protein samples from purified mitochondria (Mito) and cytosolic (C) fractions were loaded onto SDS-PAGE and imunoblotted with antibodies against Rab5, EEA1, Rabenosyn-5, APPL1, APPL2, and TOM20.
-
Figure 9—source data 1
Numerical data corresponding to the bar graphs presented in Figure 9C.
- https://doi.org/10.7554/eLife.32282.041
Figure 9—figure supplement 1
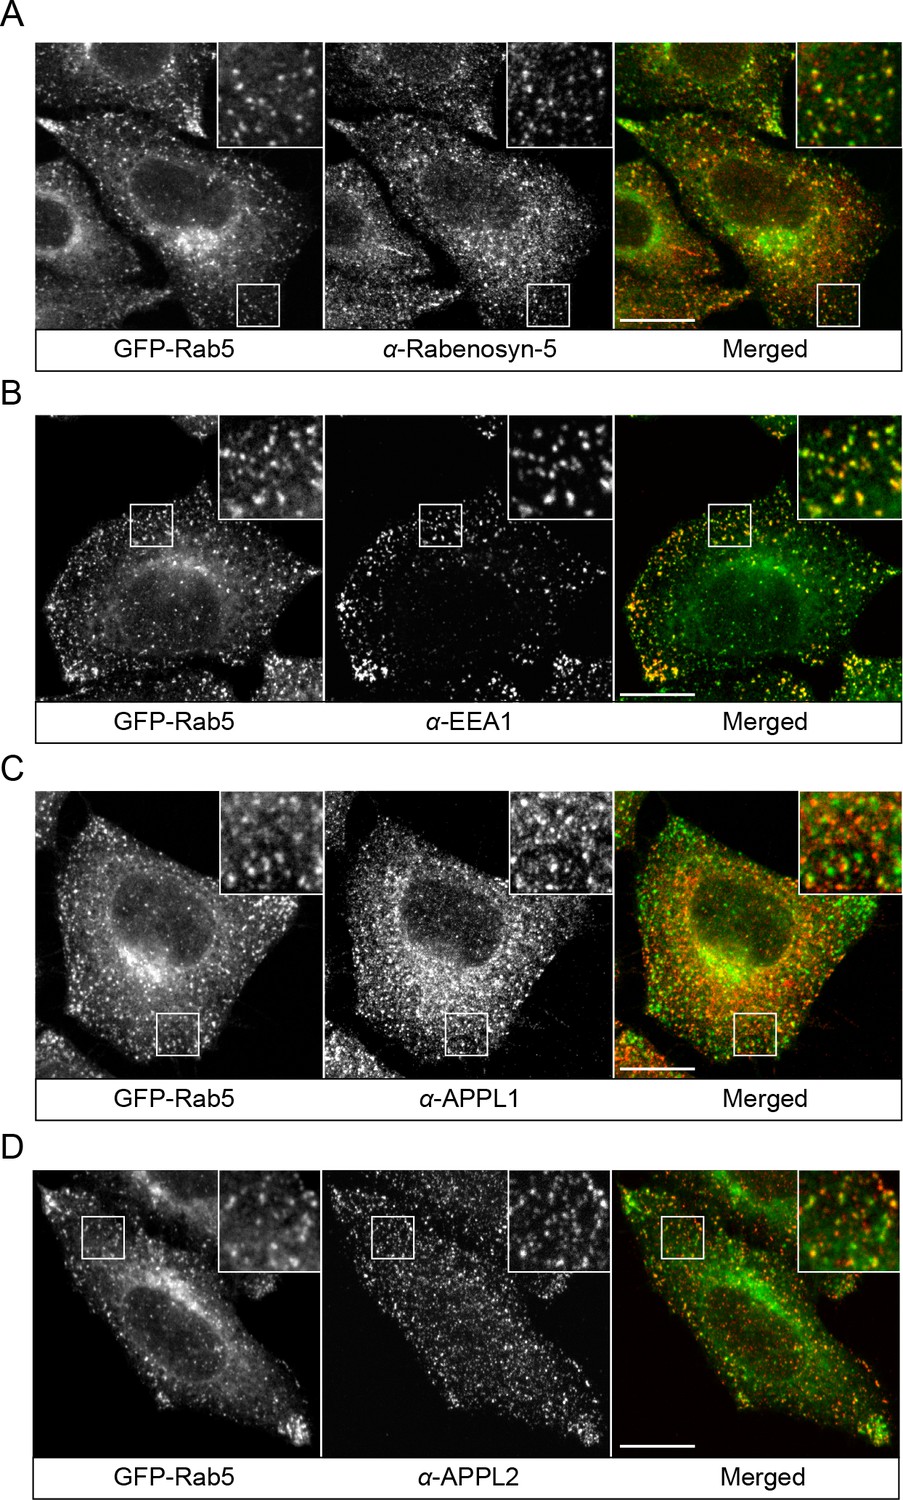
Localization of endogenous Rabenosyn-5, EEA1, APPL1 and APPL2.
BAC GFP-Rab5 cells were seeded on glass coverslips, fixed, and immunostained with antibodies against Rabenosyn-5 (A), EEA1 (B), APPL1 (C), and APPL2 (D). Inset regions are shown. Scale bars, 10 μm.
Figure 9—figure supplement 2
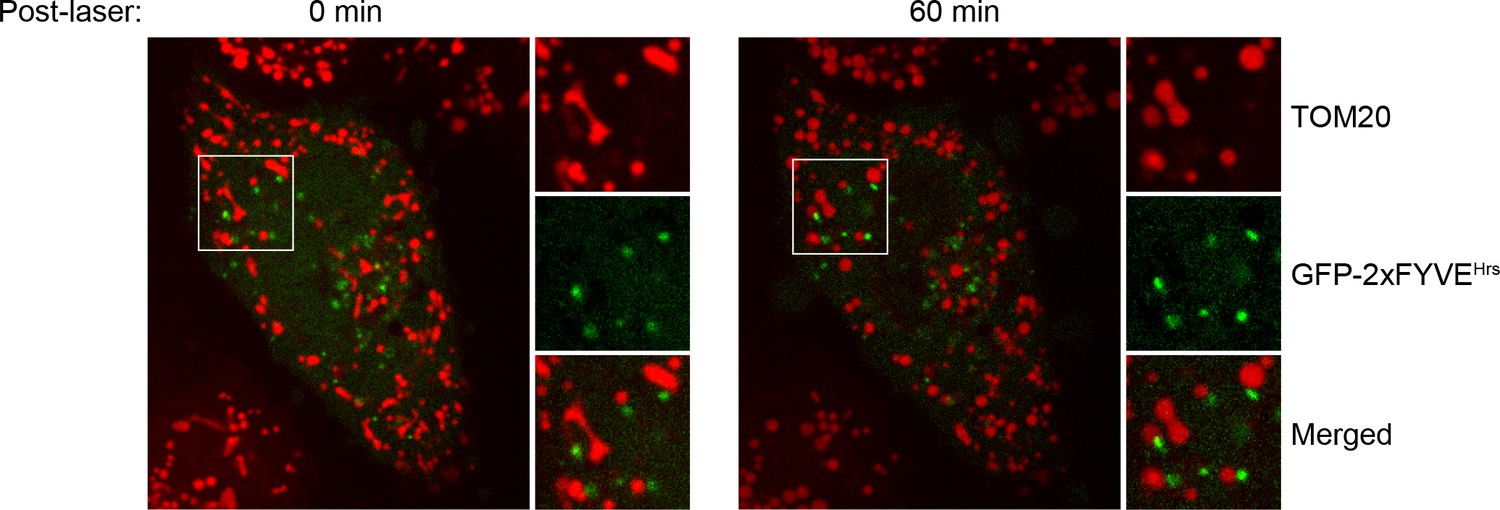
Localization of GFP-2xFYVEHrs upon laser-induced stress.
HeLa cells were transfected with GFP-2xFYVEHrs for 24 hr, labeled with 100 nM Mito-Red, photoirradiated as before, and then imaged live. Images were acquired immediately post-laser (0 min) and after 60 min.
Figure 10 with 2 supplements
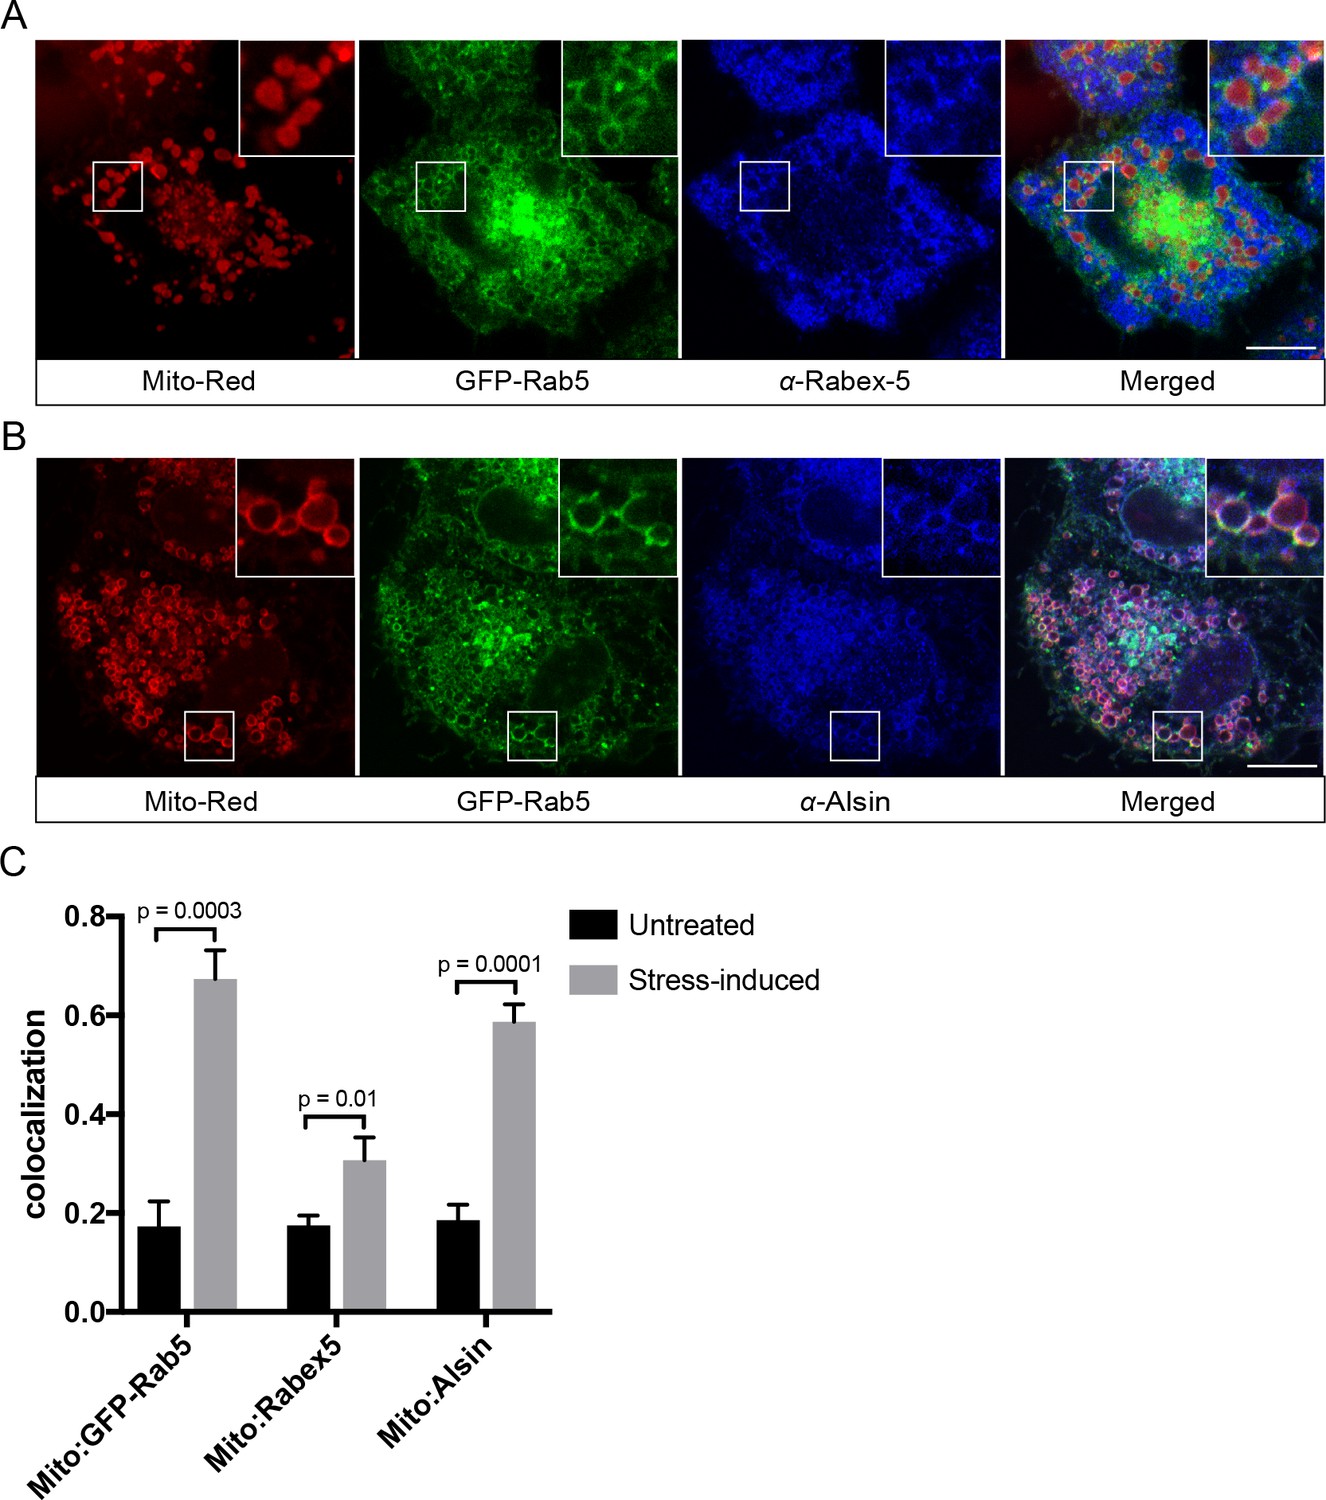
Localization of Rabex-5 and Alsin upon mitochondrial stress.
BAC GFP-Rab5 cells seeded on gridded dishes were labeled with 100 nM Mito-Red and photoirradiated as before. Cells were fixed after 30 min post-laser treatment and immunostained with antibody against Rabex-5 (A) or Alsin (B). Inset regions are shown. Scale bars, 10 μm. (C) Colocalization analysis from untreated and laser-treated cells in (A) and (B), n = 3. p Values based on two-tailed t-tests.
-
Figure 10—source data 1
Numerical data corresponding to the bar graphs presented in Figure 10C.
- https://doi.org/10.7554/eLife.32282.046
Figure 10—figure supplement 1
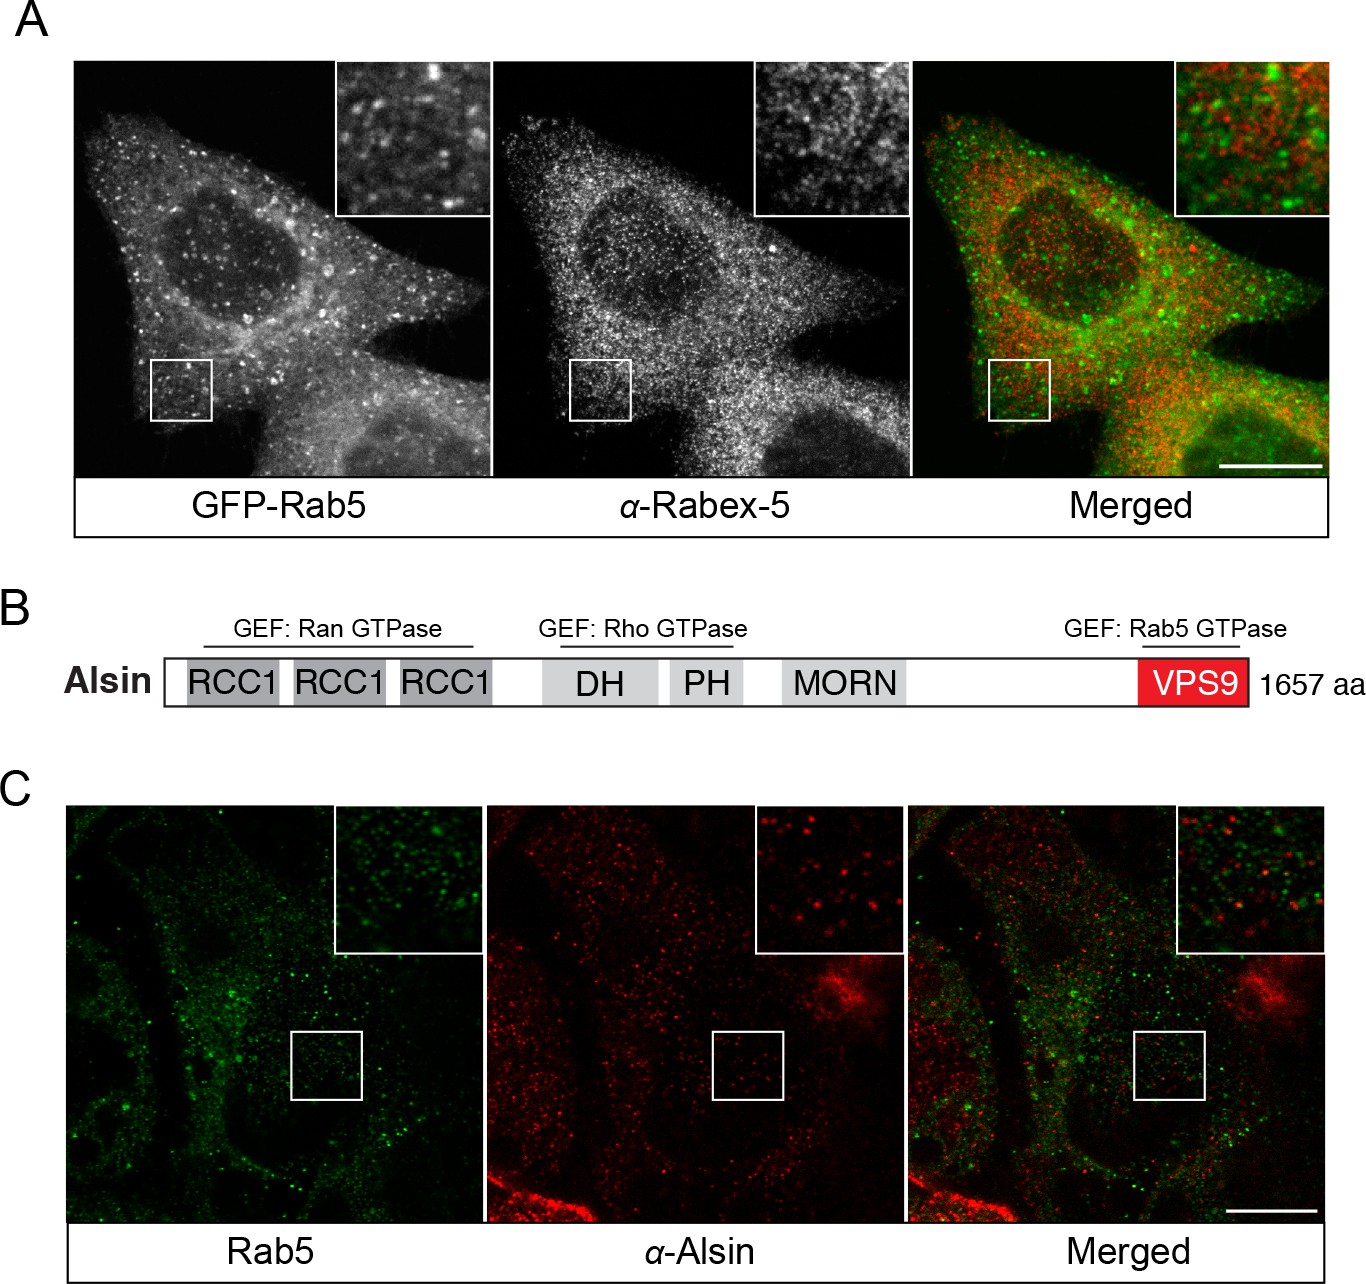
Endogenous localization of Rabex-5 and Alsin.
BAC GFP-Rab5 cells were seeded on glass coverslips, fixed, and immunostained with specific antibodies against Rabex-5 (A) or Alsin (C). Inset regions are shown. Scale bars, 10 μm. (B) A schematic representation of the domain organization of human Alsin. The regulator of chromosome condensation 1 (RCC1), B-cell lymphoma (Dbl) homology (DH) and pleckstrin homology (PH), membrane occupation and recognition nexus (MORN) motif, and vacuolar protein sorting 9 (VPS9) domains are labeled. Three putative GEF domains are annotated.
Figure 10—figure supplement 2
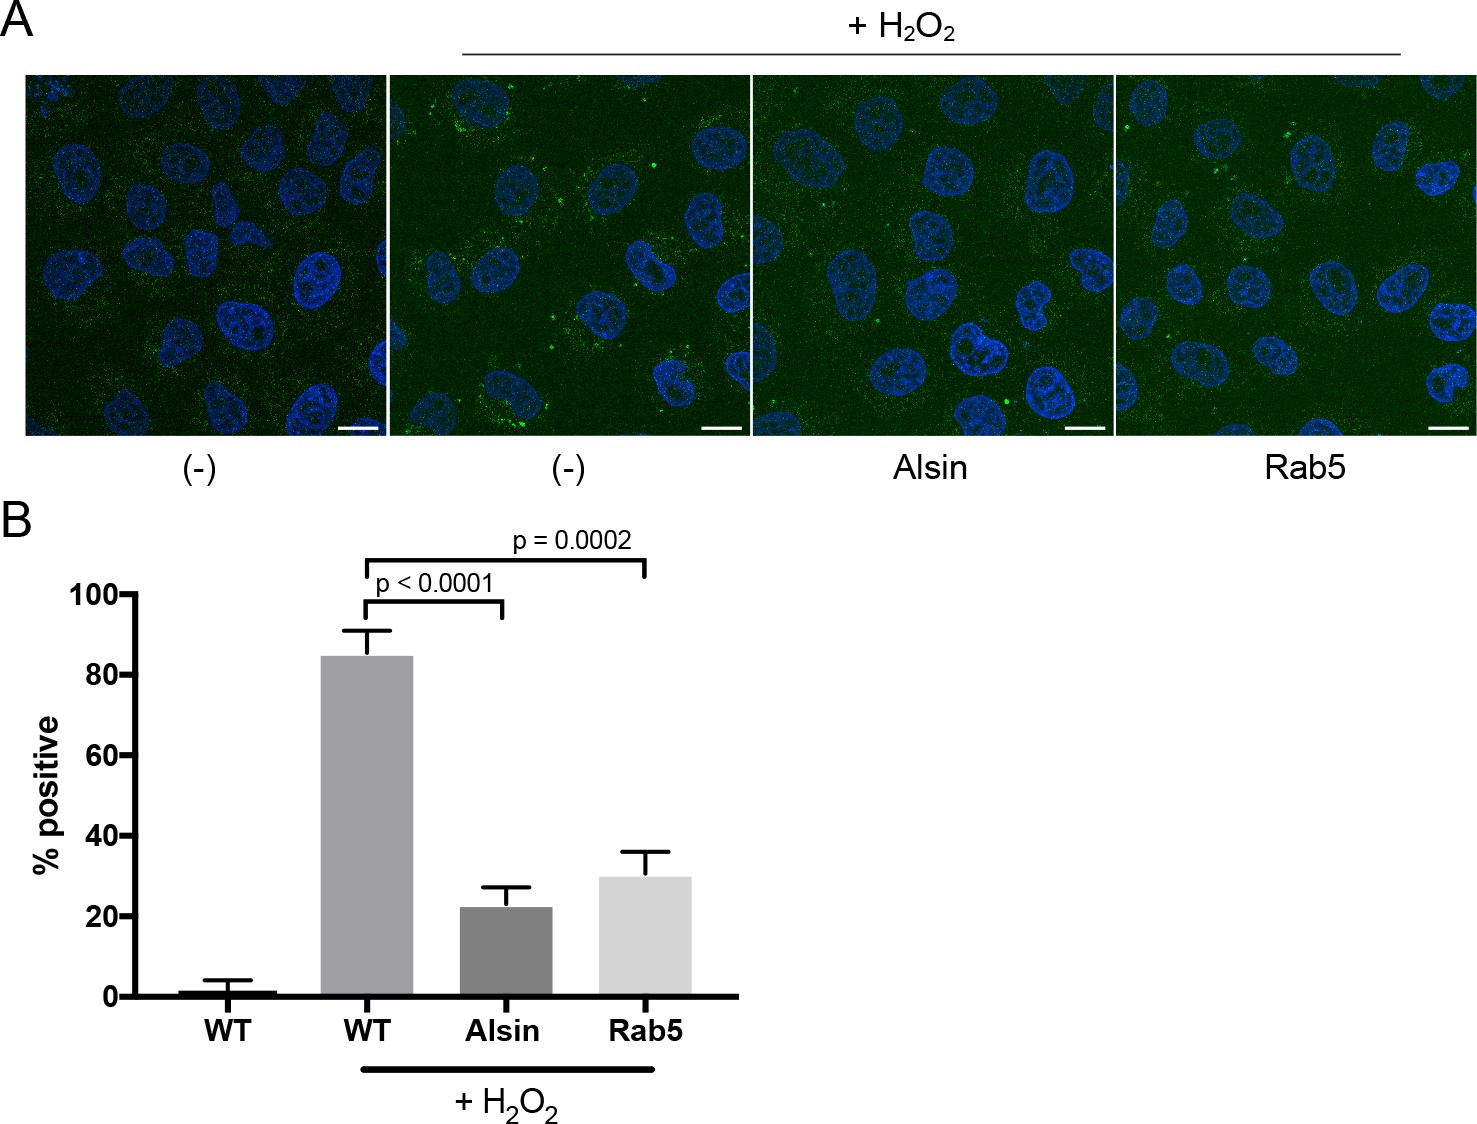
Over-expression of Alsin or Rab5 blocks caspase-3/7 activation.
(A) HeLa cells transiently expressing empty vector, Alsin, or Rab5 were incubated in the presence of 500 μM H2O2 and 5 μM CellEvent caspase-3/7 green detection reagent at 37°C for 2 hr. Nucleus was stained with DAPI (blue). Images were acquired by confocal microscopy. Caspase-activated cells displayed green signals, while non-activated cells (PBS control) showed no signal. Percent of cells with positive signals were quantified in (B), n = 50. Error bars represent SEMs. Scale bars, 10 μm.
-
Figure 10—figure supplement 2—source data 1
Numerical data corresponding to the bar graphs presented in Figure 10—figure supplement 2B.
- https://doi.org/10.7554/eLife.32282.045
Figure 11 with 1 supplement
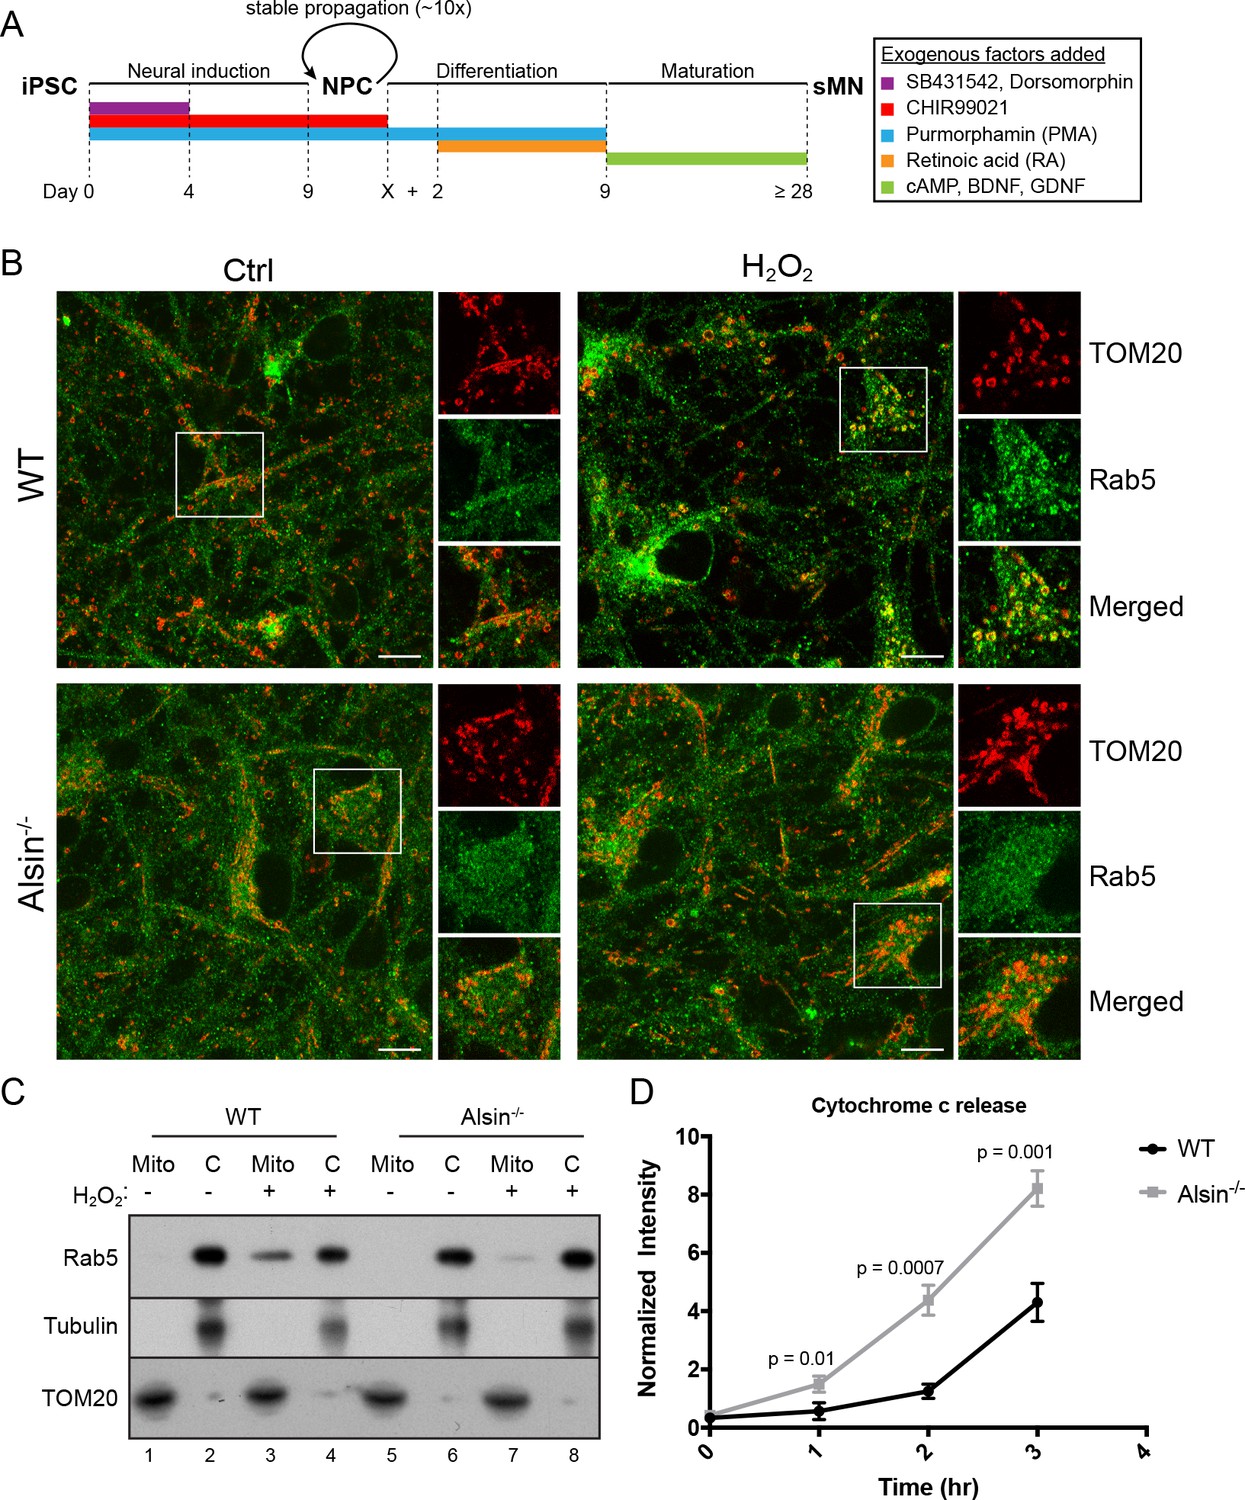
Alsin is required for Rab5 recruitment and regulates cytochrome c release.
(A) Flow chart depicting the different stages and time (in days) from induced-pluripotent stem cells (iPSC), to neuroprogenitor cells (NPC), and to mature spinal motor neurons (sMN). The small molecules and compounds used at different stages are shown and color-coded. (B) WT and Alsin-/- cells were challenged with either PBS (Ctrl) or 100 µM H2O2 at 37°C for 1 hr. Cells were fixed and immunostained with Rab5 and TOM20 antibodies. Inset images show are shown. Scale bars, 10 μm. (C) Subcellular fractionation of mitochondrial (Mito) and cytosolic (C) fractions from WT and Alsin-/- iPSC-sMN challenged with either PBS or 100 μM H2O2 at 37°C for 1 hr. Protein samples were loaded onto SDS-PAGE and imunoblotted with antibodies against Rab5, tubulin and TOM20. (D) Cytosolic fractions were prepared from WT and Alsin-/- iPSC-sMN challenged with 100 μM H2O2 at 37°C for 1 hr. Densitometric quantification of cytosolic cytochrome c were collected from three independent experiments. Y-axis corresponds to normalized ratio intensity of cytochrome c to tubulin. Error bars represent SEMs. p Values based on two-tailed t-tests.
-
Figure 11—source data 1
Numerical data corresponding to the line traces presented in Figure 11D.
- https://doi.org/10.7554/eLife.32282.049
Figure 11—figure supplement 1

Validation of the CRISPR/Cas9 Alsin-/- cells in iPSC, NPC and iPSC-sMN.
(A) Electrophoresis result of the PCR reaction using primers flanking exon three and within exon 3. Homozygous deletion was confirmed by the absence of a 2.8 kb. (B) Protein lysates from WT KOLF and Alsin-/- iPSC were loaded onto SDS-PAGE and immunoblotted with Alsin antibody. A band detected at ~184 kDa, but absent in Alsin-/-, corresponds to full-length Alsin. (C) WT KOLF, Alsin-/- iPSC, and neuroprogenitor cells (NPC) were immunostained with pluripotency markers Oct4 and Lin28, and neuroprogenitor markers Sox2 and Pax6, respectively. (D–E) WT KOLF and Alsin-/- iPSC-sMN were immunostained with motor neuron markers such as ChAT, HB9, and ISL1, nuclear dye DAPI, and cytoskeletal marker MAP2. (F) WT KOLF and Alsin-/- iPSC-sMN were immunostained with antibodies against Rab5 and Alsin, along with DAPI (nuclear) and phalloidin (actin) stains. Scale bars, 10 μm.
Figure 12
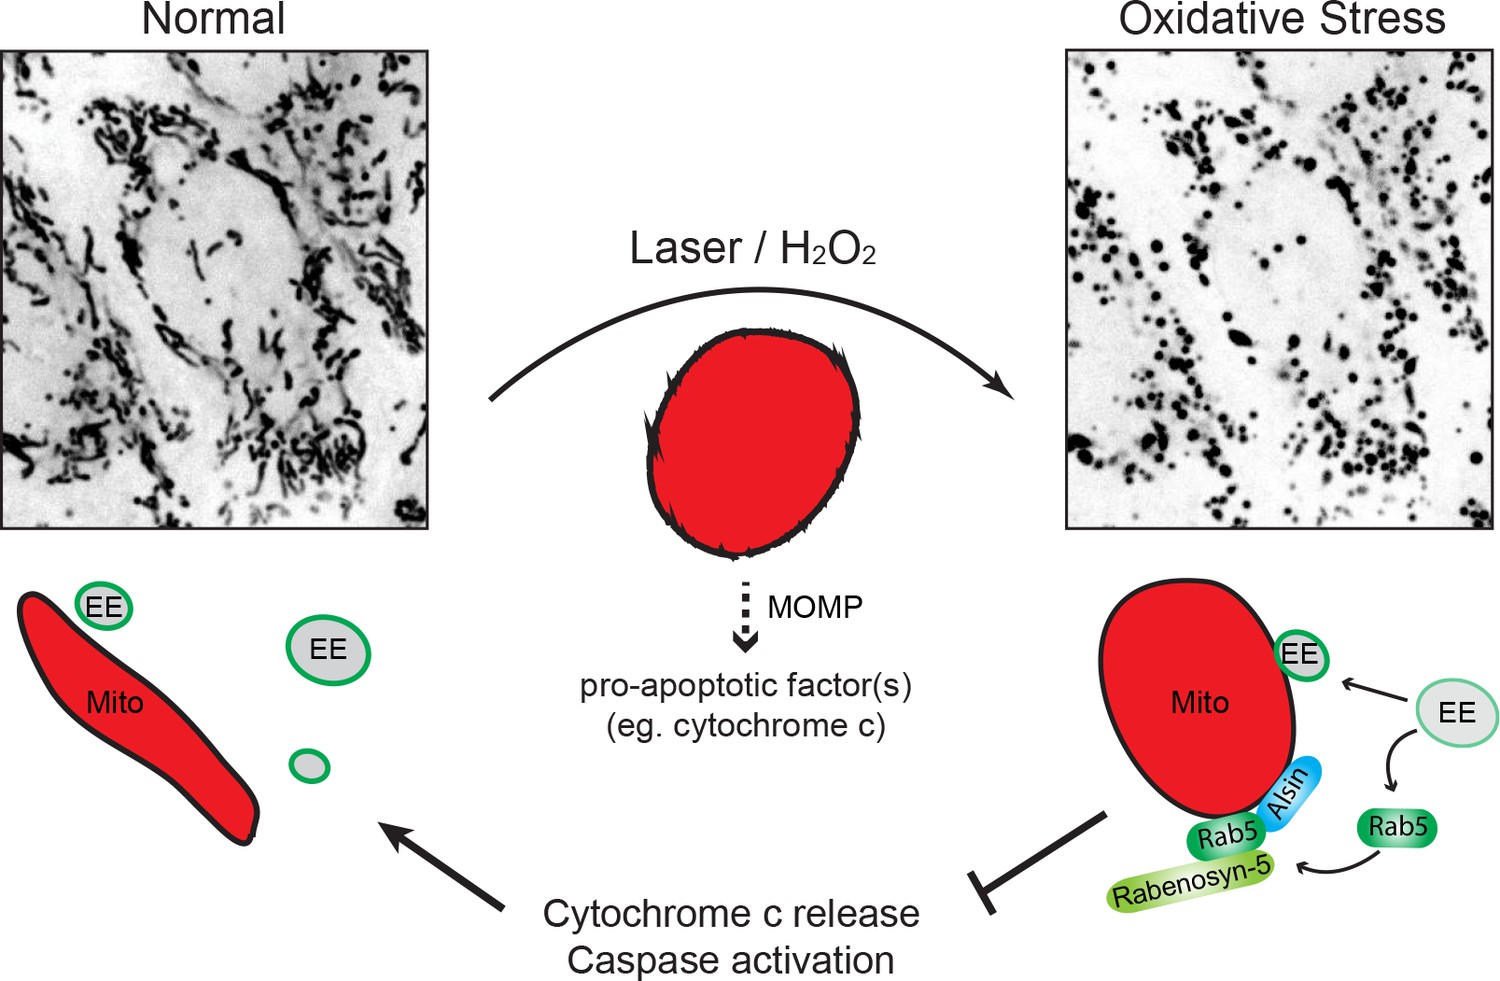
Schematic model depicting the role of Rab5-Alsin-mitochondria during oxidative stress.
In the normal condition, mitochondria (Mito, red) are elongated and tubular (left). Rab5 (green) are localized on early endosomes (EE) to assemble the Rab5 machinery for endosomal maturation and membrane trafficking. At steady state, some EE make transient contacts with mitochondria. During oxidative stress (e.g. laser- or chemically-induced), mitochondria undergo MOMP and a dramatic morphological transformation into rounded and swollen structures (right). The release of the apoptotic factor, cytochrome c, from mitochondria into the cytosol is associated with a re-localization event of Rab5 from EE to mitochondria via a cytosolic intermediate, accompanied by an increase in EE-mitochondria MCS. The recruitment and activation of Rab5 on mitochondria depend on the Rab5 GEF Alsin (blue), which leads to a selective recruitment of Rabenosyn-5 (light green). This signaling cascade on mitochondria is a reversible process that regulates the apoptotic program (e.g. cytochrome c release and caspase activation) and thus, promotes overall cell survival.
Videos
Video 1
Dynamics of transferrin and mitochondria.
HeLa cells were labeled with Alexa-488 transferrin (Tf; green) and Mito-Red (Mito; red). Images were acquired using a spinning disk confocal microscope at 11 frames/sec for ~6 min. Time stamp corresponds to min:s:ms.
Video 2
Dynamics of transferrin and mitochondria.
Zoom-in of a HeLa cell labeled with Alexa-488 transferrin (Tf; green) and Mito-Red (Mito; red). The movement of endosomes during a mitochondria fission event is shown. Images were acquired using a spinning disk confocal microscope at 11 frames/sec for ~5 min. Time stamp corresponds to min:s:ms.
Video 3
Dynamics of Rab5-positive endosomes and mitochondria.
Zoom-in of a BAC GFP-Rab5 (green) cell labeled with Mito-Red (Mito; red). Images were acquired using a spinning disk confocal microscope at 11 frames/s for ~4 min. Time stamp corresponds to min:s:ms.
Video 4
Mitochondria dynamics during laser-induced stress.
HeLa cells were labeled with Mito-Red and photoirradiated via 561 nm laser for 1 min, and immediately imaged. Time-lapse was acquired using a spinning disk confocal microscope at 11 frames/s for ~5 min.
Video 5
GFP-Rab5 recruitment to mitochondria during laser-induced stress.
Zoom-in of a BAC GFP-Rab5 (green) cell labeled with Mito-Red (Mito; red). Images were acquired using a spinning disk confocal microscope at 11 frames/s with 1 min increment for ~30 min.
Video 6
Endosomes and mitochondria interactions upon laser-induced stress.
BAC GFP-Rab5 (green) cells were labeled with Mito-Red (red) and photoirradiated via 561 nm laser for 1 min, and then imaged after 5 min. Time-lapse was acquired using a spinning disk confocal microscope for 20 frames with 5 s increment for ~3 min. Boxed regions indicate GFP-Rab5 endosomes docking onto mitochondria.
Video 7
Endosomes and mitochondria interactions upon laser-induced stress.
Zoom-in of a BAC GFP-Rab5 (green) cell labeled with Mito-Red (Mito; red) and photoirradiated via 561 nm laser for 1 min, and then imaged continuously for ~5 min. Images were acquired using a spinning disk confocal microscope at 11 frames/s.
Video 8
Mitochondria dynamics during H2O2-induced stress.
HeLa cells were labeled with Mito-Red and then imaged in the presence of 250 µM H2O2 for ~60 min. Time-lapse was acquired using a spinning disk confocal microscope for 50 frames with 2-min increment.
Additional files
-
Transparent reporting form
- https://doi.org/10.7554/eLife.32282.051
Download links
A two-part list of links to download the article, or parts of the article, in various formats.
Downloads (link to download the article as PDF)
Open citations (links to open the citations from this article in various online reference manager services)
Cite this article (links to download the citations from this article in formats compatible with various reference manager tools)
Rab5 and Alsin regulate stress-activated cytoprotective signaling on mitochondria
eLife 7:e32282.
https://doi.org/10.7554/eLife.32282


