Extreme heterogeneity of influenza virus infection in single cells
- Fred Hutchinson Cancer Research Center, United States
- University of Washington, United States
Figures
Figure 1
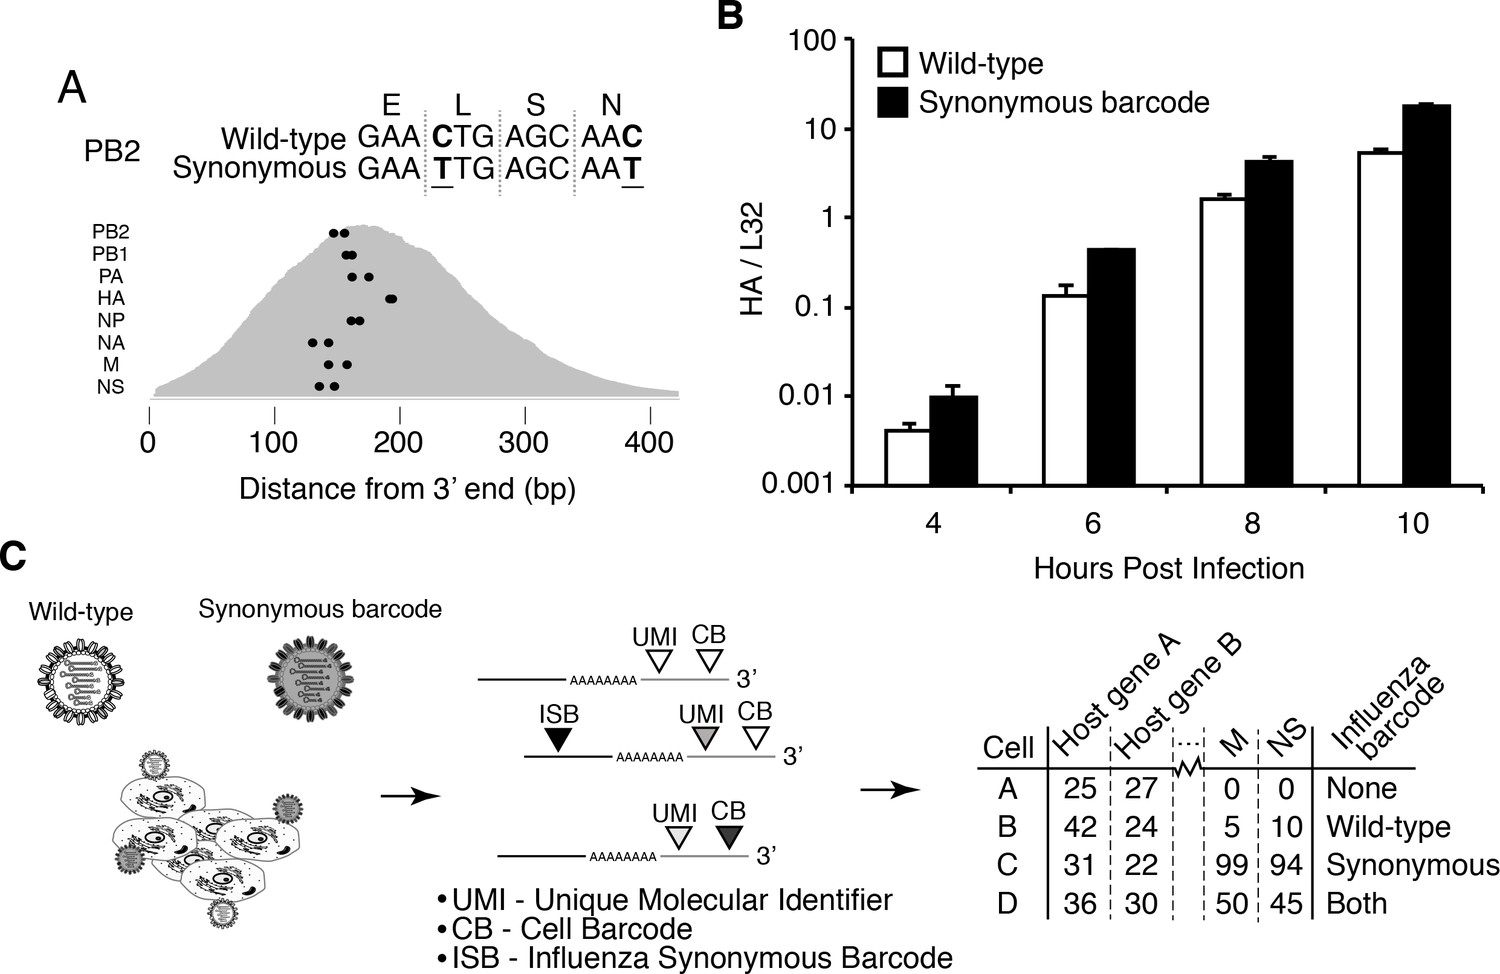
Experimental design.
(A) We engineered a virus that carried two synonymous mutations near the 3’ end of each mRNA. At top are the mutations for PB2. At bottom are locations of the synonymous mutations relative to the typical distribution of read depth for our 3’-end sequencing. (B) The wild-type and synonymously barcoded viruses transcribe their genes with similar kinetics. The abundance of the viral hemagglutinin (HA) transcript relative to the cellular housekeeping gene L32 was assessed by qPCR in A549 cells infected at an MOI of 0.5 (as determined on MDCK-SIAT1 cells). Error bars S.D., n = 3. (C) For the single-cell mRNA sequencing, A549 cells were infected with an equal mixture of wild-type and synonymously barcoded virus. Immediately prior to collection, cells were physically separated into droplets and cDNA libraries were generated containing the indicated barcodes. The libraries were deep sequenced, and the data processed to create a matrix that gives the number of molecules of each transcript observed in each cell. Infected cells were further annotated by whether their viral mRNAs derived from wild-type virus, synonymously barcoded virus, or both.
-
Figure 1—source data 1
Sequences of wild-type and barcoded viruses are in viralsequences.fasta.
- https://doi.org/10.7554/eLife.32303.004
Figure 2 with 1 supplement

The viral stocks in our experiments are relatively pure of defective particles.
(A) Our viral stocks have a higher ratio of infectious particles to HA virion RNA compared to a high-defective stock propagated at high MOI. HA viral RNA was quantified by qPCR on virions. Error bars S.D., n = 6 (qPCR replicates). (B) Our viral stocks have a higher ratio of infectious particles to particles capable of expressing HA protein. A549 cells were infected at an MOI of 0.1, and the percentage of cells expressing HA protein at 9 hr post-infection was quantified by antibody staining and flow cytometry. (C) Our viral stocks are less immunostimulatory than virus propagated at high MOI when used at the same number of infectious units as calculated by TCID50. Note that this fact does not necessarily imply that they are more immunostimulatory per virion, as the high-MOI stocks also have more virions per infectious unit as shown in the first two panels. Measurements of IFNB1 transcript by qPCR normalized to the housekeeping gene L32 in A549 cells at 10 hr post infection at an MOI of 0.5. Error bars S.D., n = 3. Note that MOIs were calculated by TCID50 on MDCK-SIAT1 cells, whereas the experiments in this figure involved infection of A549 cells.
Figure 2—figure supplement 1
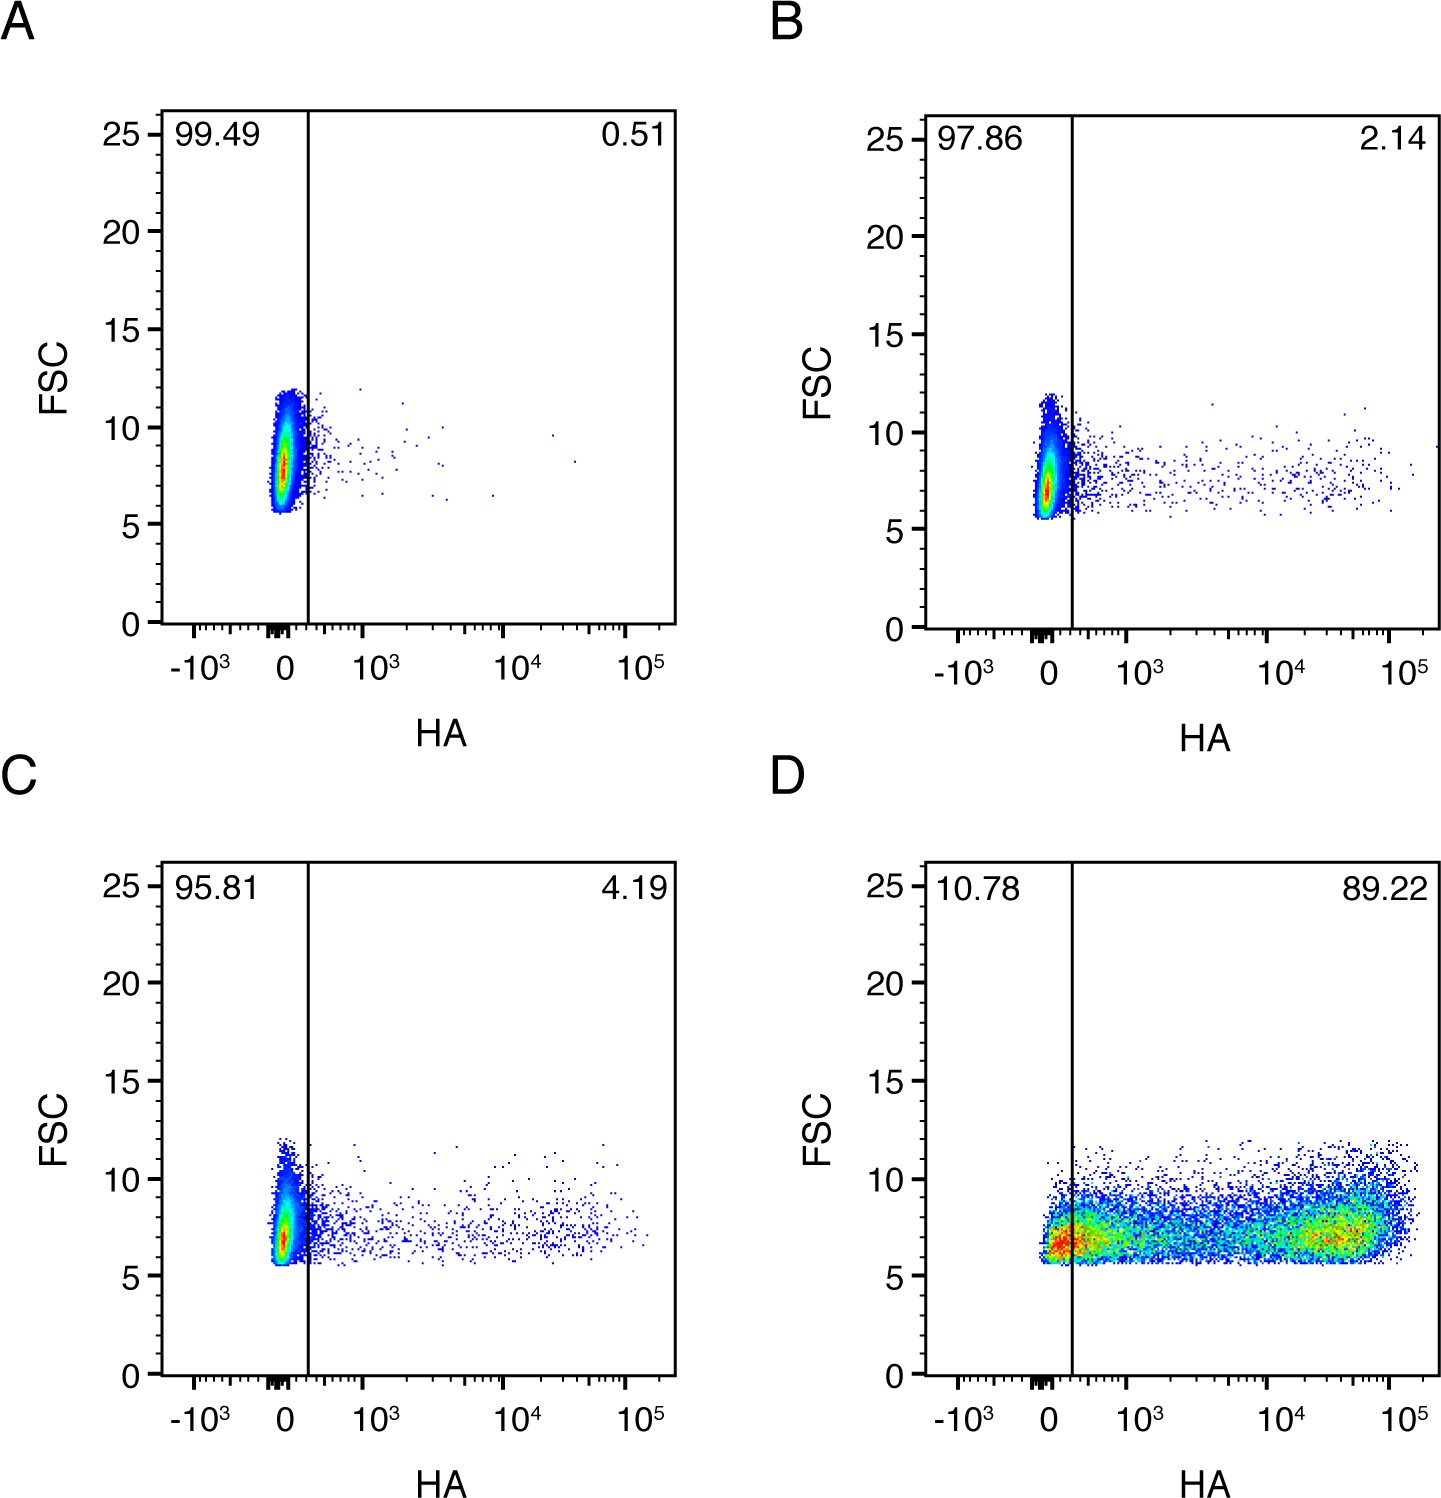
Full flow cytometry data for Figure 2B.
A549 cells were infected at an MOI of 0.1 as calculated by TCID50 on MDCK-SIAT1 cells. (A) Uninfected gating control. (B) Cells infected with the wild-type virus stock used in our experiments. (C) Cells infected with synonymously barcoded virus stock used in our experiments. (D) Cells infected with a stock of wild-type virus propagated at a high MOI, and therefore enriched in defective particles.
Figure 3 with 1 supplement
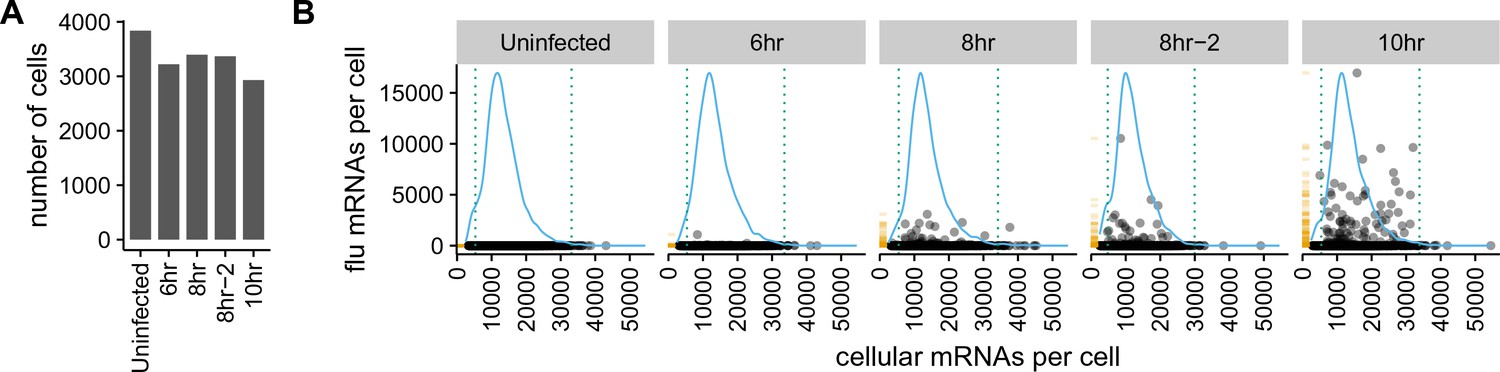
There is a very wide distribution in the amount of viral mRNA per cell.
(A) Number of cells sequenced for each sample. (B) The number of cellular and viral mRNAs detected for each cell is plotted as a point. The blue lines show the overall distribution of the number of cellular mRNAs per cell. The orange rug plot at the left of each panel shows the distribution of the number of viral mRNAs per cell. Cells outside the dotted green lines were considered outliers with suspiciously low or high amounts of cellular mRNA (possibly derived from two cells per droplet), and were excluded from all subsequent analyses. Figure 3—figure supplement 1 shows the exact distributions of the fraction of viral mRNA per cell.
Figure 3—figure supplement 1
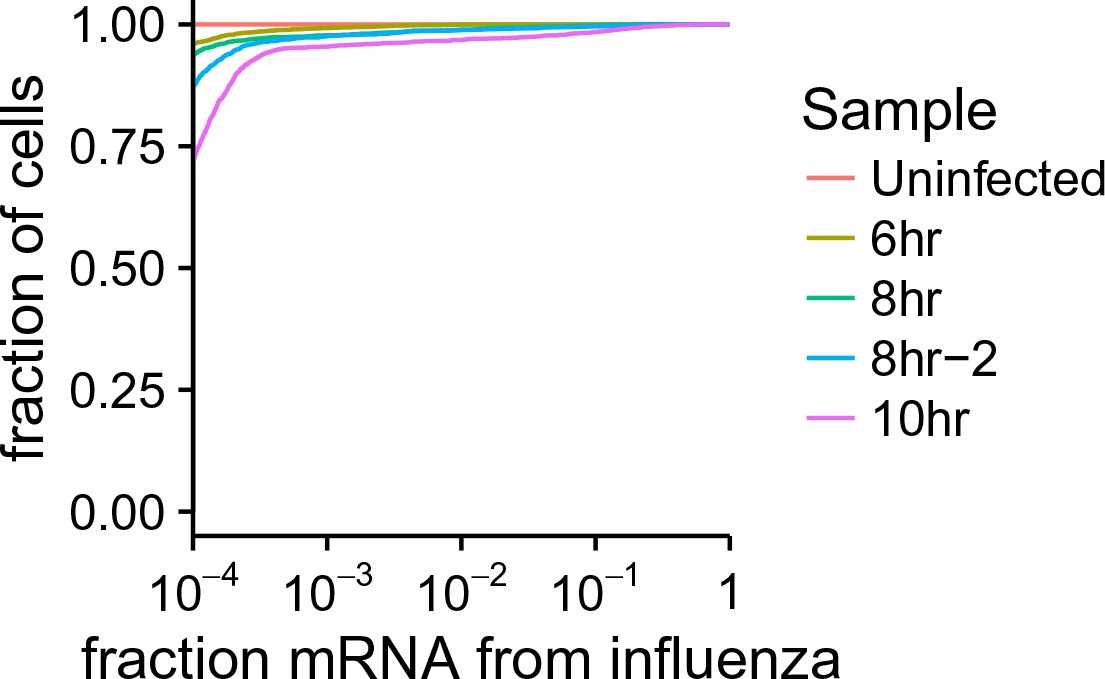
Cumulative fraction plot of proportion of total mRNA from virus.
For each sample, this plot shows the fraction of all cells that derive at least the indication fraction of their mRNA from influenza virus.
Figure 4 with 5 supplements
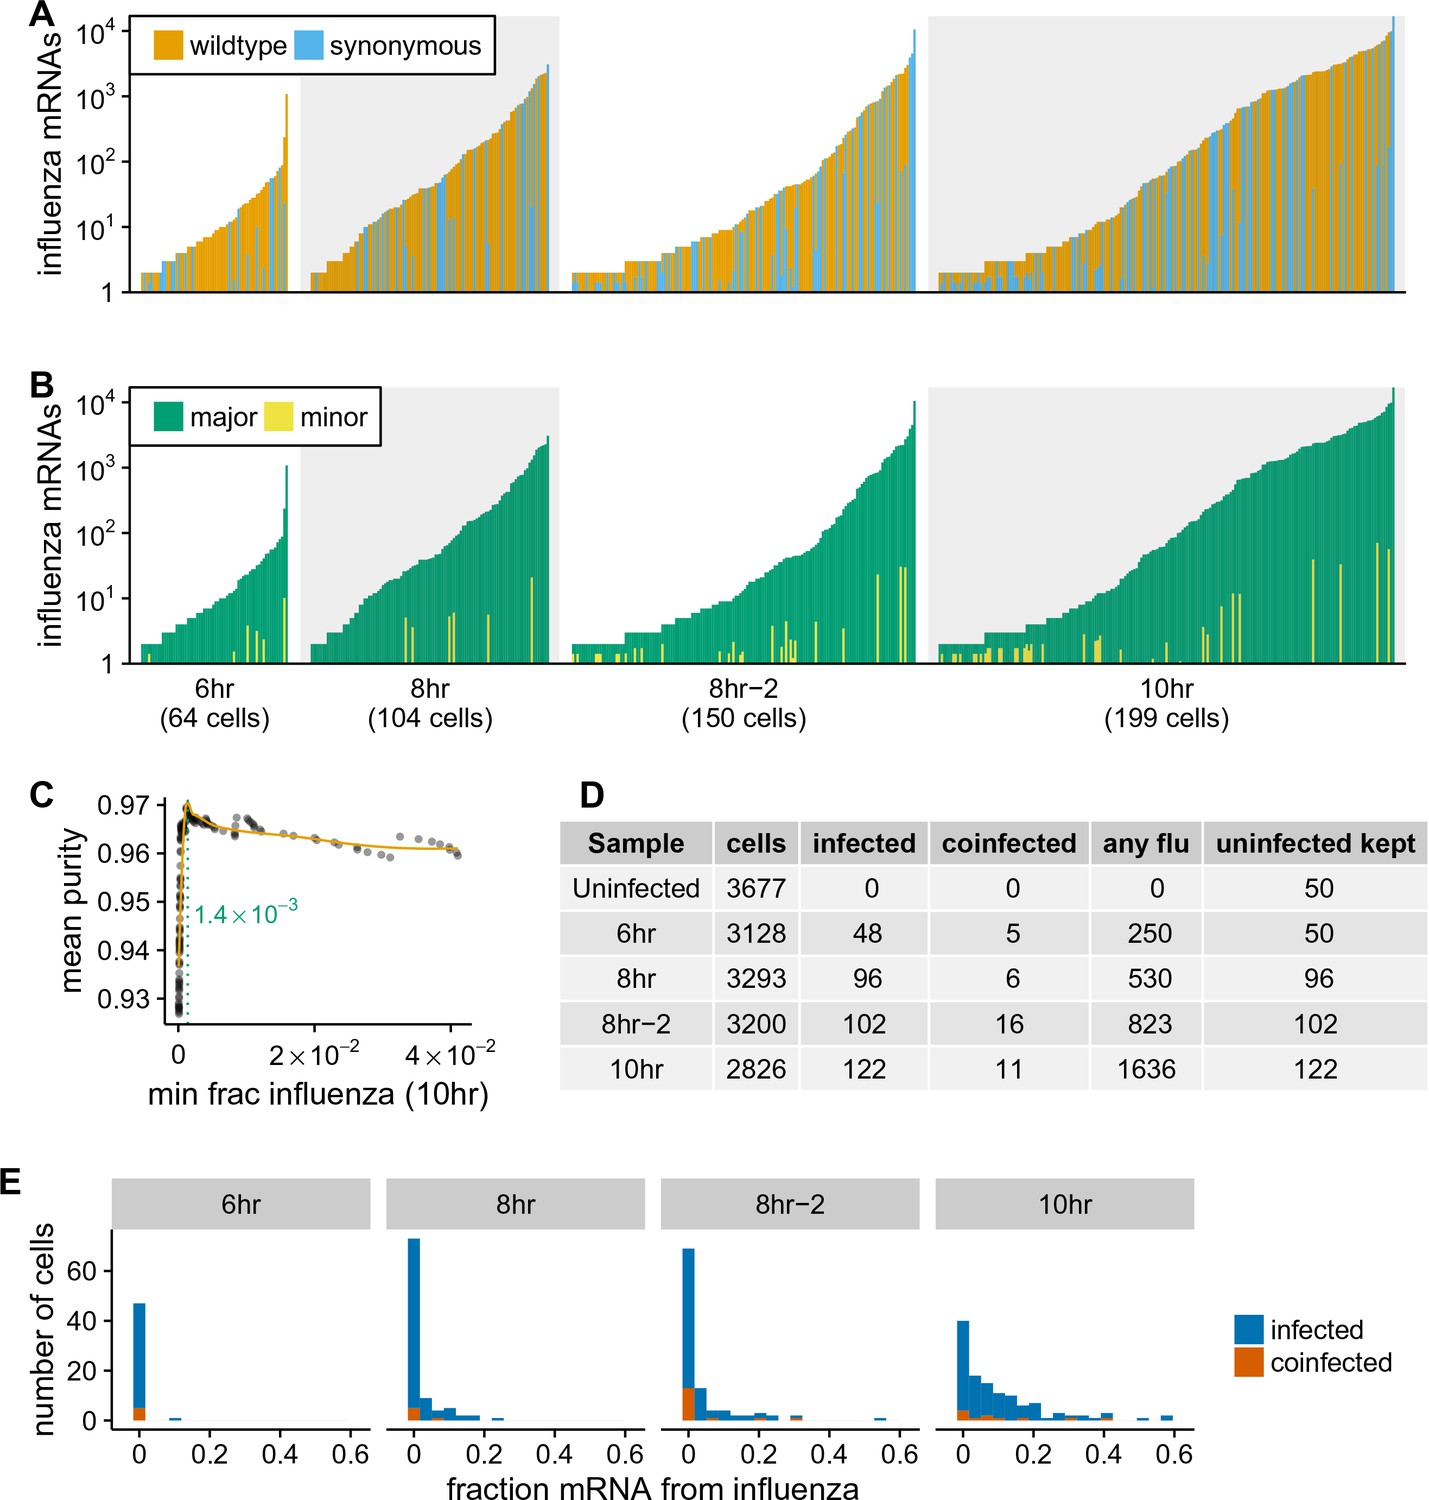
Synonymous barcodes on the viral mRNAs distinguish true infections from cells that contain viral mRNAs derived from leakage of lysed cells.
(A) Cells with at least two viral mRNAs for which the barcode could be called, arranged in order of increasing influenza transcript counts. Bar heights denote the number viral mRNAs on a log10 scale, bar coloring is linearly proportional to the fractions of viral mRNAs derived from wild-type and synonymously barcoded virus. (B) Same as (A), but each bar is colored according to the relative fraction of the more common (major) and less common (minor) virus variant. At low levels of viral mRNA there is often a roughly equal mix, suggesting contamination with viral mRNAs leaked from lysed cells. At higher levels of viral mRNA, cells generally have only one viral variant, suggesting infection initiated by a single virion. A few cells are also obviously co-infected with both viral variants. (C) We determined a threshold for calling ‘true’ infections by finding the amount of viral mRNA per cell at which the viral barcode purity no longer increases with more viral mRNA. The purity is the fraction of all viral mRNA in a cell derived from the most abundant viral barcode in that cell. We fit a curve (orange line) to the mean purity of all cells with more than the indicated amount of viral mRNA, and drew the cutoff (dotted green line) at the point where this curve stopped increasing with the fraction of total mRNA derived from virus. This plot illustrates the process for the 10 hr sample, see Figure 4—figure supplement 2 for similar plots for other samples. See the Materials and methods for details. (D) The number of cells identified as infected and co-infected for each sample, as well as the number of cells with any viral read. For all subsequent analyses, we subsampled the number of uninfected cells per sample to the greater of 50 or the number of infected cells. (E) Distribution of the fraction of mRNA per cell derived from virus for both infected and co-infected cells. Figure 4—figure supplement 3 shows these same data in a cumulative fraction plots and calculates Gini coefficients to quantify the heterogeneity in viral mRNA load.
Figure 4—figure supplement 1

The number of viral barcodes called for each sample and gene segment.
Viral transcripts are classified as syn if they mapped to a synonymously barcoded influenza transcript, wt if they mapped to a wild-type influenza transcript, invalid if multiple reads for the same UMI differed on the status of the viral barcode, and as uncalled if none of the reads for that UMI overlapped the region of the viral transcript containing the viral barcode. For calculations of the number of reads in a cell derived from each viral barcode for each viral gene, the total number of detected molecules of that gene are multiplied by the fraction of those molecules with assignable barcodes that are assigned to that barcode.
Figure 4—figure supplement 2
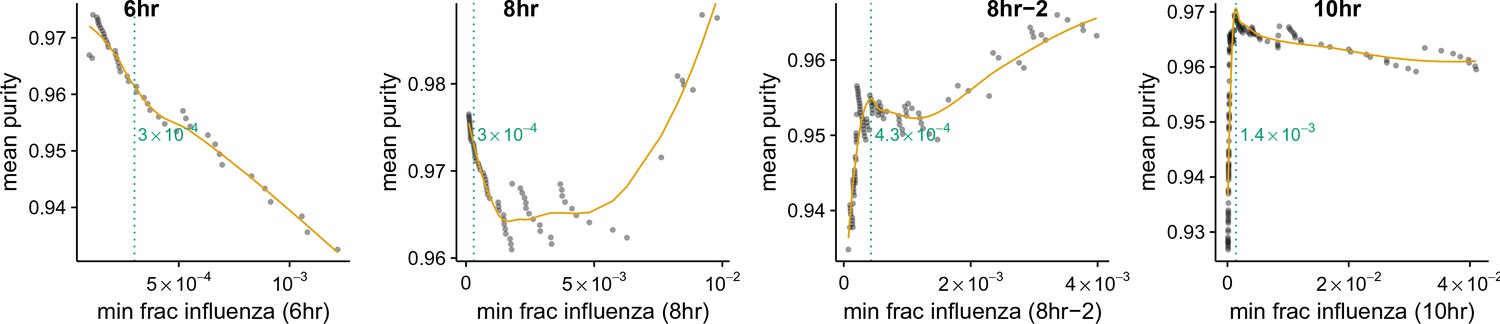
Thresholds for calling infected cells.
Cell lysis can lead cells to the spurious association of small amounts of extraneous mRNA with individual cells. We wanted to avoid classifying as infected cells that had simply acquired such lysis-derived viral mRNA. The amount of lysis-derived viral mRNA will vary among samples as a function of both the lysis rate during the cell preparation (which always varies slightly from sample to sample in the 10X procedure) and with the amount of total viral mRNA for that sample (the more viral mRNA, the more there is to be acquired from lysed cells). As is shown in Figure 4B, the 8 hr-2 and 10 hr sample clearly have an enrichment of mixed barcodes in cells with small numbers of viral mRNA. For each sample, we calculated the mean purity of all cells with at least the indicated amount of viral mRNA, and determined the threshold amount of viral mRNA where purity no longer increased by finding the first maxima in a loess curve fit (orange line). We called the threshold at this point of maximum purity (dotted green line). For the 6 hr and 8 hr samples there is no indication of contamination from lysis-derived reads, as Figure 4B shows no increase in mixed barcodes in low viral mRNA cells. Therefore, for these samples we simply set a threshold of requiring at least 210 of the total mRNA to come from virus, which corresponds to 2 viral mRNAs for the typical cell with total reads (Figure 3B).
Figure 4—figure supplement 3
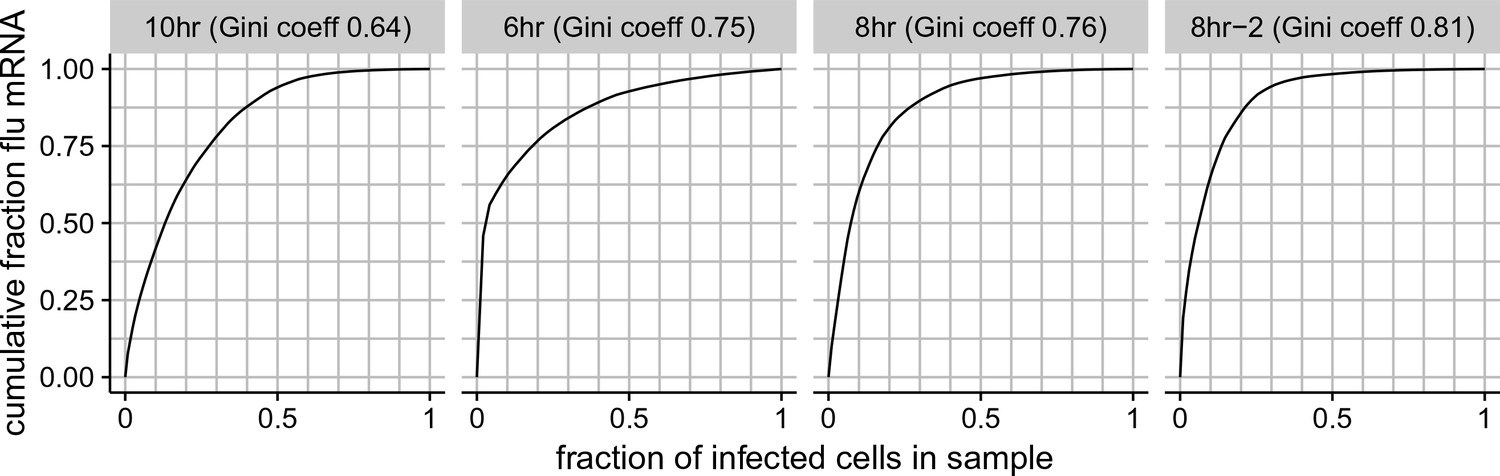
Cumulative distributions of viral mRNA per cell and Gini coefficients.
The total fraction of all viral mRNA among infected cells that is attributable to a given fraction of these cells. For instance, the plot for the 8 hr sample shows that 50% of all viral mRNA is derived from 8% of the infected cells. The facet titles above each plot also give the Gini coefficient (Gini, 1921) that calculates the heterogeneity in the distribution of viral mRNA among infected cells. Gini coefficients of 0 indicate a perfectly even distribution across cells, and Gini coefficients of 1 indicate a maximally skewed distribution.
Figure 4—figure supplement 4
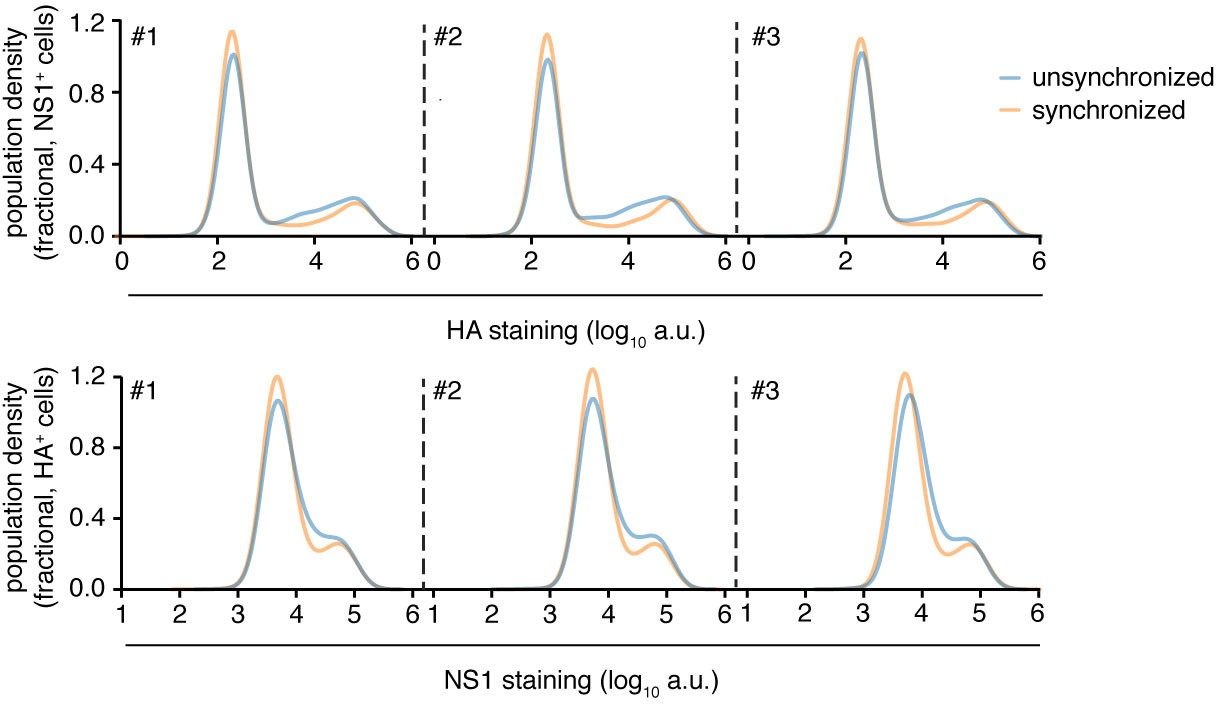
Synchronization of infection does not greatly affect heterogeneity.
Flow cytometry analysis of expression of viral proteins in cells infected at an MOI of 0.1 (unsynchronized) or 0.2 (synchronized) as calculated by TCID50 on MDCK-SIAT1 cells. The higher MOI for synchronized infections was to attempt to account for loss of virus in washing steps. Infections were synchronized by pre-adsorbing virus at 4C for 1 hr prior to initiation of infection by shifting temperature to 37C using pre-warmed media. Cells were concurrently stained for HA and NS1 proteins at 10 hr after initiation of infection, and then analyzed by flow cytometry. The level of HA protein was quantified in cells that were identified as infected based on being positive for NS1 protein (top), and the level of NS1 protein was quantified in cells that were identified as infected based on being positive for HA protein (bottom) Synchronization resulted in a small decrease in variability in the levels of each viral protein, particularly in cells with intermediate levels. But the effects were small compared to the overall variability in the protein levels, indicating timing of infection makes only a small contribution to the observed heterogeneity. Data are shown for three independent replicates.
Figure 4—figure supplement 5

Effects of infectious dose or coinfection state.
(A) Flow cytometry analysis of expression of viral proteins in cells infected at high (MOI five as calculated by TCID50 on MDCK-SIAT1 cells) or low (MOI 0.1) initial infectious dose. Cells were concurrently stained for HA and NS1 proteins at 10 hr after initiation of infection, and then analyzed by flow cytometry. The level of HA protein was quantified in cells that were identified as infected based on being positive for NS1 protein (left), and the level of NS1 protein was quantified in cells that were identified as infected based on being positive for HA protein (right) While a higher dose leads to more cells expressing high amounts of viral protein, it does not greatly increase the amount of viral protein in either the low-expressing or high-expressing cells. Therefore, higher viral dose does not lead to a large continuous increase in viral protein production among all cells – rather, it mostly changes the proportions of cells that fall in different parts of the highly heterogeneous distribution. (B) Cells were co-infected with a mix of wild-type virus and pseudovirus in which the HA gene was replaced by GFP flanked by the terminal regions of the HA gene segment at an MOI of 0.1 for each virus. At 10 hr post-infection, cells were stained for NS1 and HA expression and analyzed by flow cytometry for these proteins and GFP. Cells could be annotated as infected by virions of the same type (wild-type infection indicated by presence of HA, or pseudovirus infection indicated by the presence of GFP) or both types of virions (indicated by presence of HA and GFP). Coinfected cells, like cells infected at a higher infectious dose, occupy different positions in the distribution of viral protein production but do not not exhibit a continuous increase in viral protein production. Data are shown for three independent replicates.
Figure 5 with 5 supplements
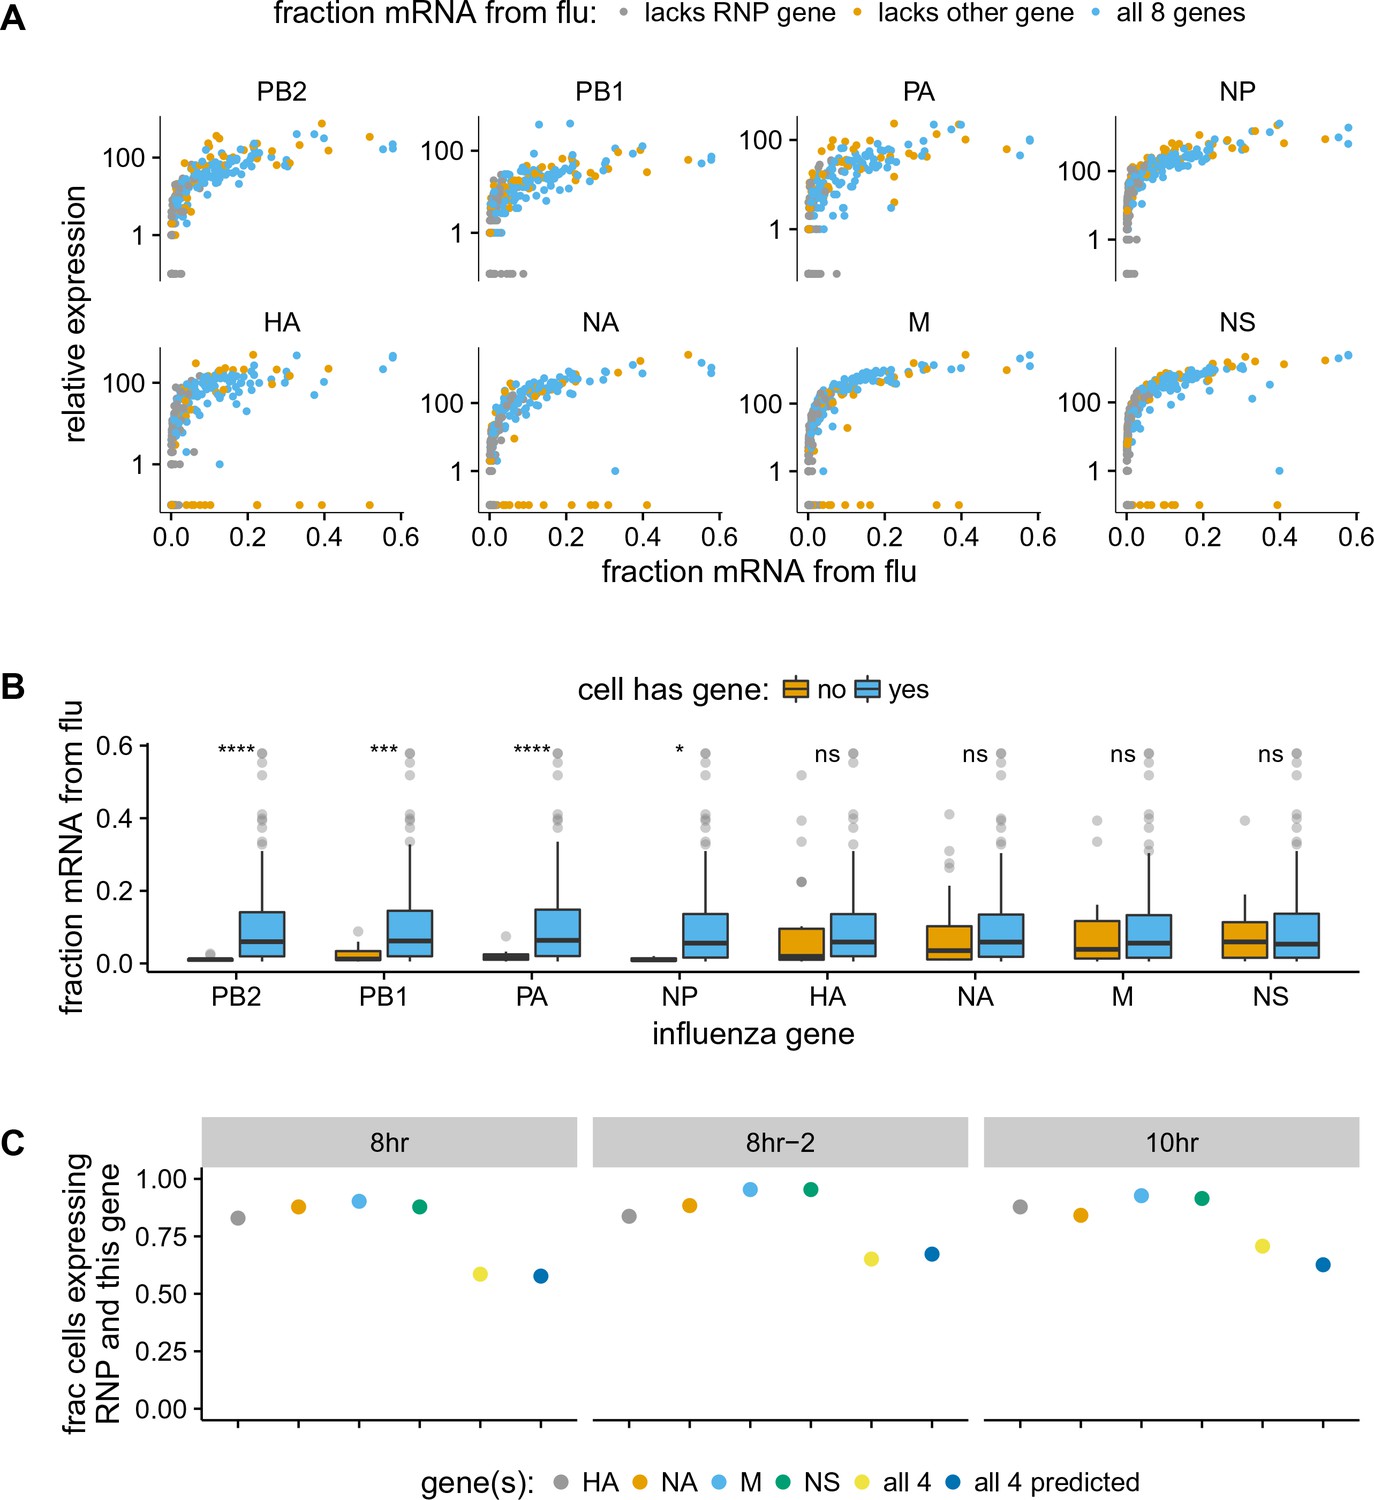
The absence of viral genes explains some of the variability in the amount of viral mRNA per cell.
(A) The normalized expression of each viral gene as a function of the total fraction of mRNA in each infected cell derived from virus, taken over all time points. Cells with high viral burden always express all RNP genes, but some cells with high viral burden lack each of the other genes. Plots for individual samples are in Figure 5—figure supplement 2, and a plot that excludes known coinfected cells is in Figure 5—figure supplement 3 . (B) Box and whisker plots showing the per-cell viral burden among cells with 0.5% of their mRNA from virus, binned by whether or not the cells express each gene. A Wilcoxon signed-rank test was used to test the null hypothesis that absence of each gene does not affect viral burden: **** = , *** = , * = , ns = not significant. The trends are similar if we look only at the 10 hr sample Figure 5—figure supplement 4 or exclude known co-infected cells ([fluburdenbyflugene]fluburdenbyflugene_nocoinfection).Figure 5—figure supplement 5 . (C) The fraction of cells that express each of the four other genes among cells that express all RNP genes, as well as the fraction that express all four of the other genes. The fraction that express all four genes is well predicted by simply multiplying the frequencies of cells that express each gene individually, indicating that gene absence is approximately independent across these genes.
-
Figure 5—source data 1
The numerical data for panel (C) are in p_missing_genes.csv.
- https://doi.org/10.7554/eLife.32303.021
-
Figure 5—source data 2
Simulation with a simple model for the expected heterogeneity due to Poisson co-infection and presence/absence of the full RNP is in simple_Poisson_model.html.
- https://doi.org/10.7554/eLife.32303.022
Figure 5—figure supplement 1
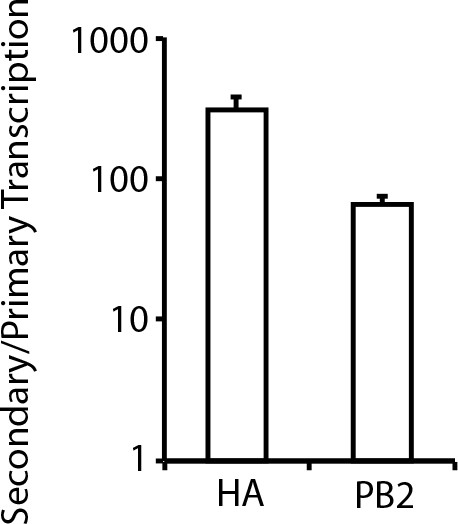
Secondary transcription is a major source of viral mRNA during bulk infections.
A549 cells were infected at an MOI of 0.2 as calculated on MDCK-SIAT1 cells in either the presence or absence of the protein-translation inhibitor cyclohexamide, and viral mRNA was quantified at 8 hr post-infection by qPCR. The cyclohexamide prevents translation of new PB2, PB1, PA, and NP protein, and so prevents the formation of the new RNPs needed for secondary transcription. The bars show the relative amount of HA and PB2 mRNA in the absence versus the presence of cyclohexamide. Error S.D. n = 3.
Figure 5—figure supplement 2
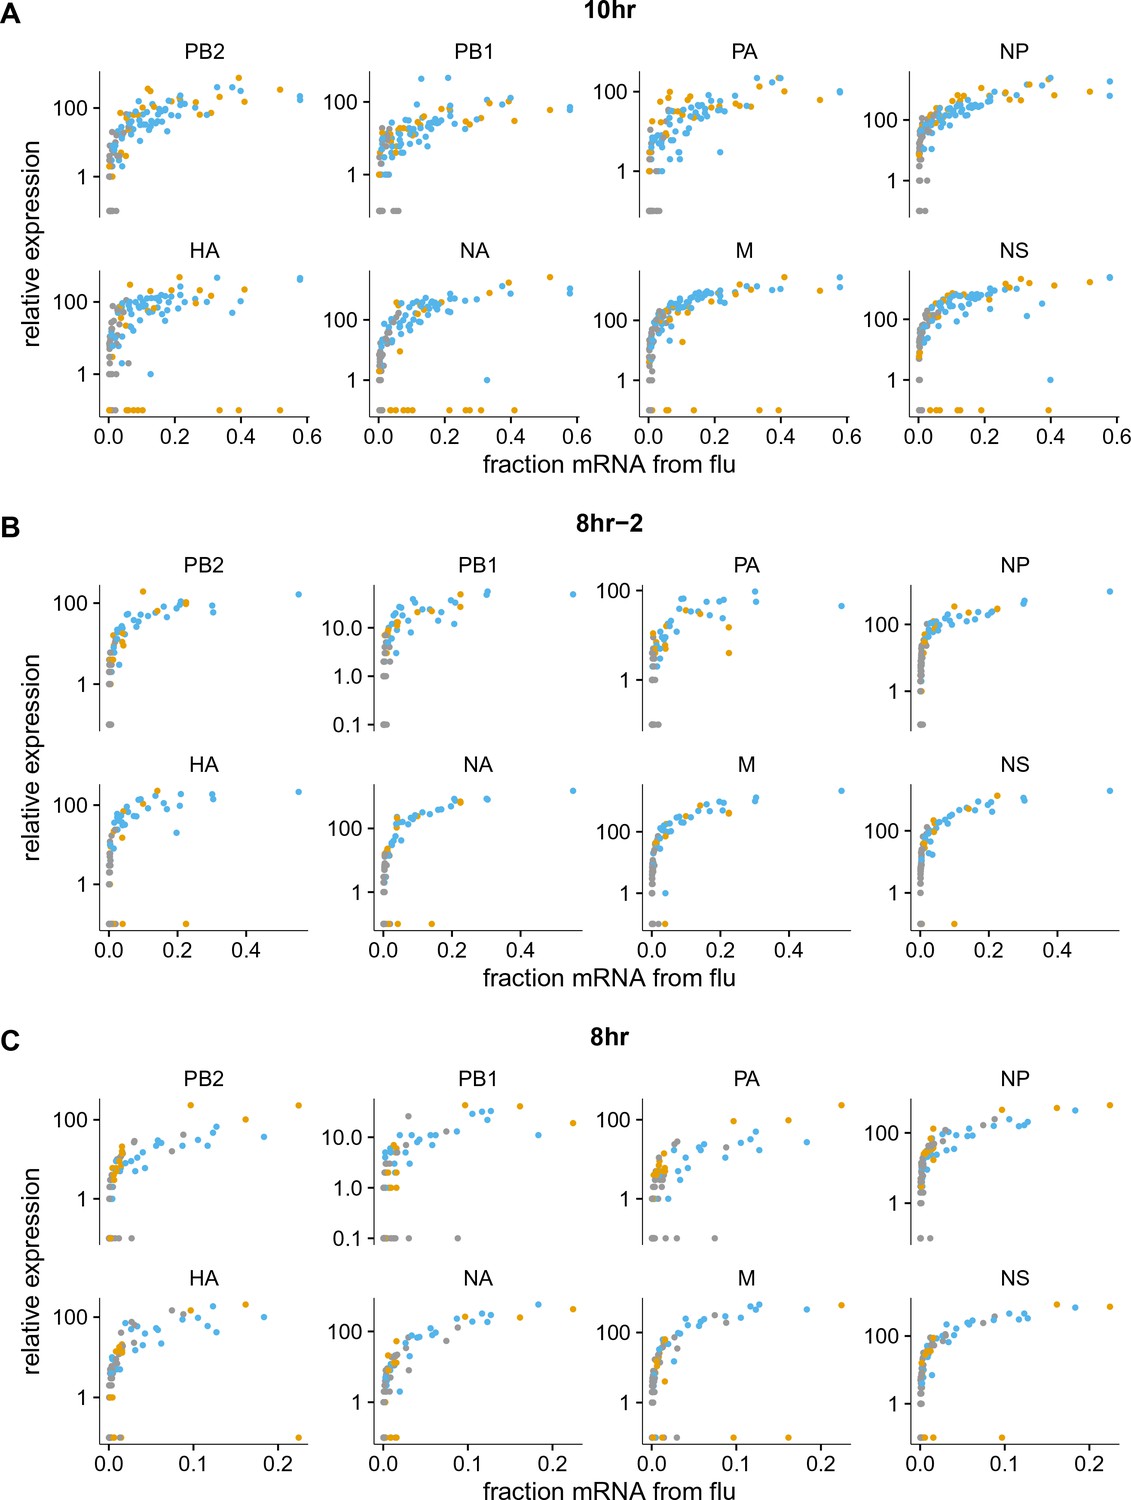
Like panel (A), but shows samples individually.
The normalized expression of each viral gene as a function of the fraction of total mRNA derived from virus, shown for the 10 hr and 8 hr samples individually (the other samples had too few infected cells for this analysis to be useful). Points are colored as in Figure 5A.
Figure 5—figure supplement 3
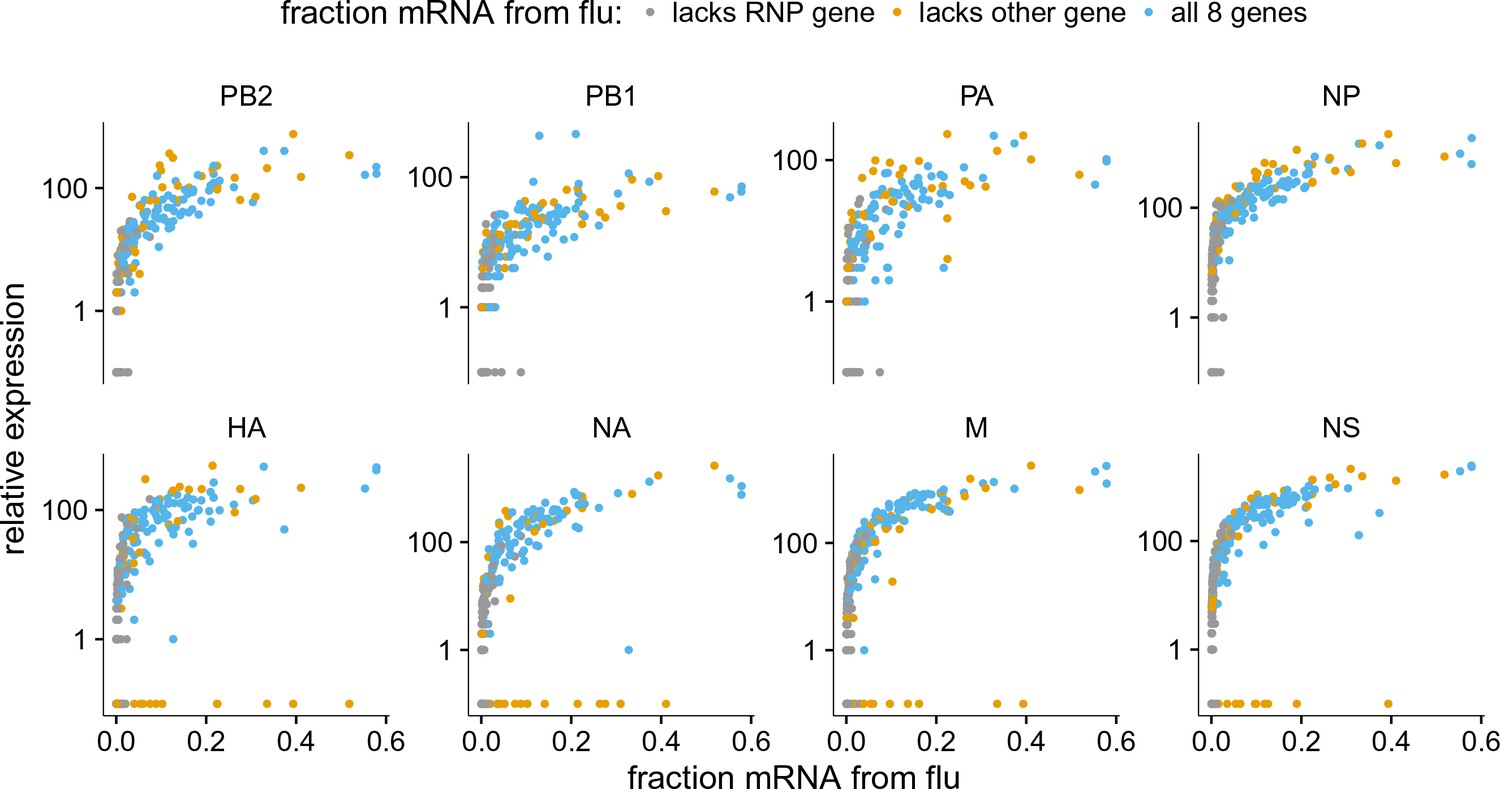
Like panel (A), but excludes coinfected cells with mixed viral barcodes.
The normalized expression of each viral gene as a function of the fraction of total mRNA derived from virus, excluding cells that were annotated as coinfected based on the presence of both viral barcodes.
Figure 5—figure supplement 4
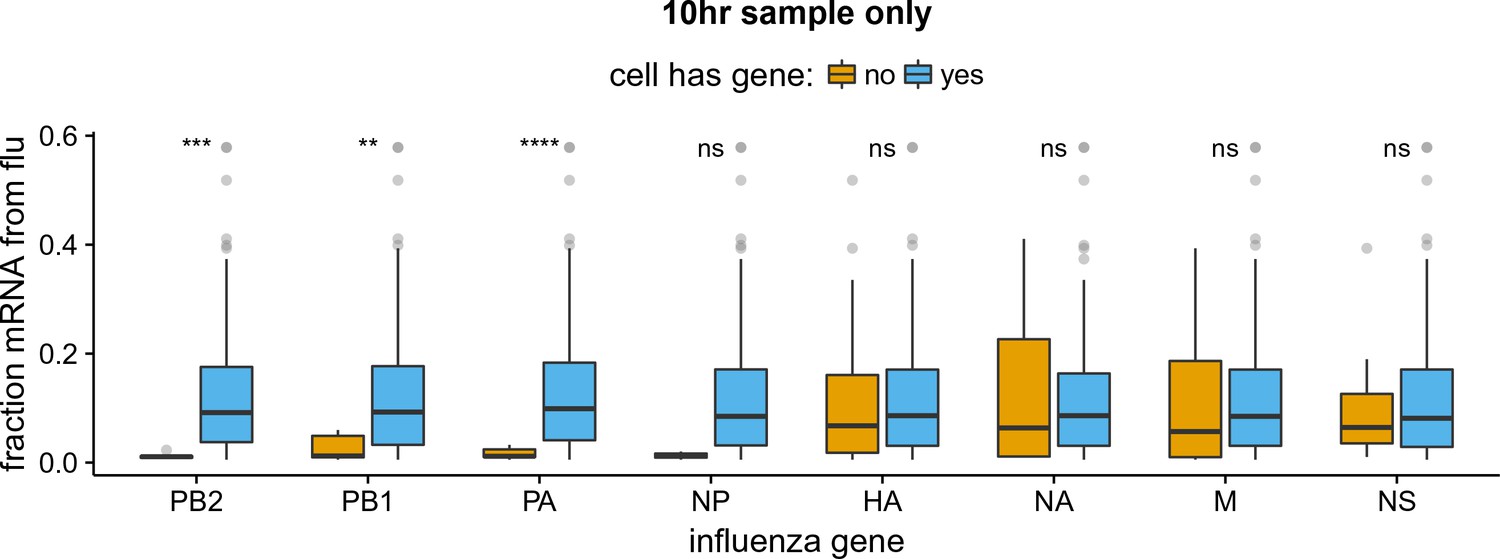
Like panel (B) but for the 10 hr sample only.
The absence of viral RNP genes but not non-RNP genes remains significantly associated with reduced viral burden when we examine only the 10 hr sample, which is the single time point with the most data points. The difference for NP is no longer statistically significant due to low counts of infected cells lacking NP, but the trend remains. We do not show statistical analyses for other samples, as the number of infected cells is too low.
Figure 5—figure supplement 5
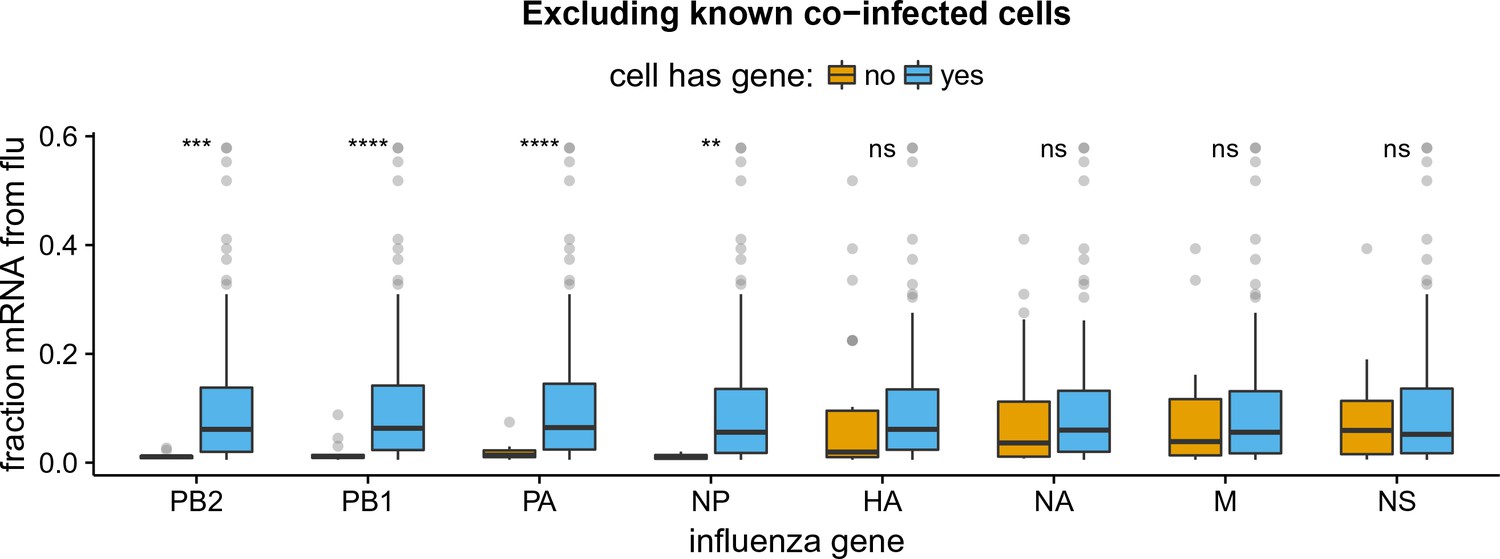
Like panel (B) but excludes coinfected cells with mixed viral barcodes.
All findings in Figure 5B remain unchanged if we exclude cells called as coinfected based on the presence of mixed viral barcodes.
Figure 6
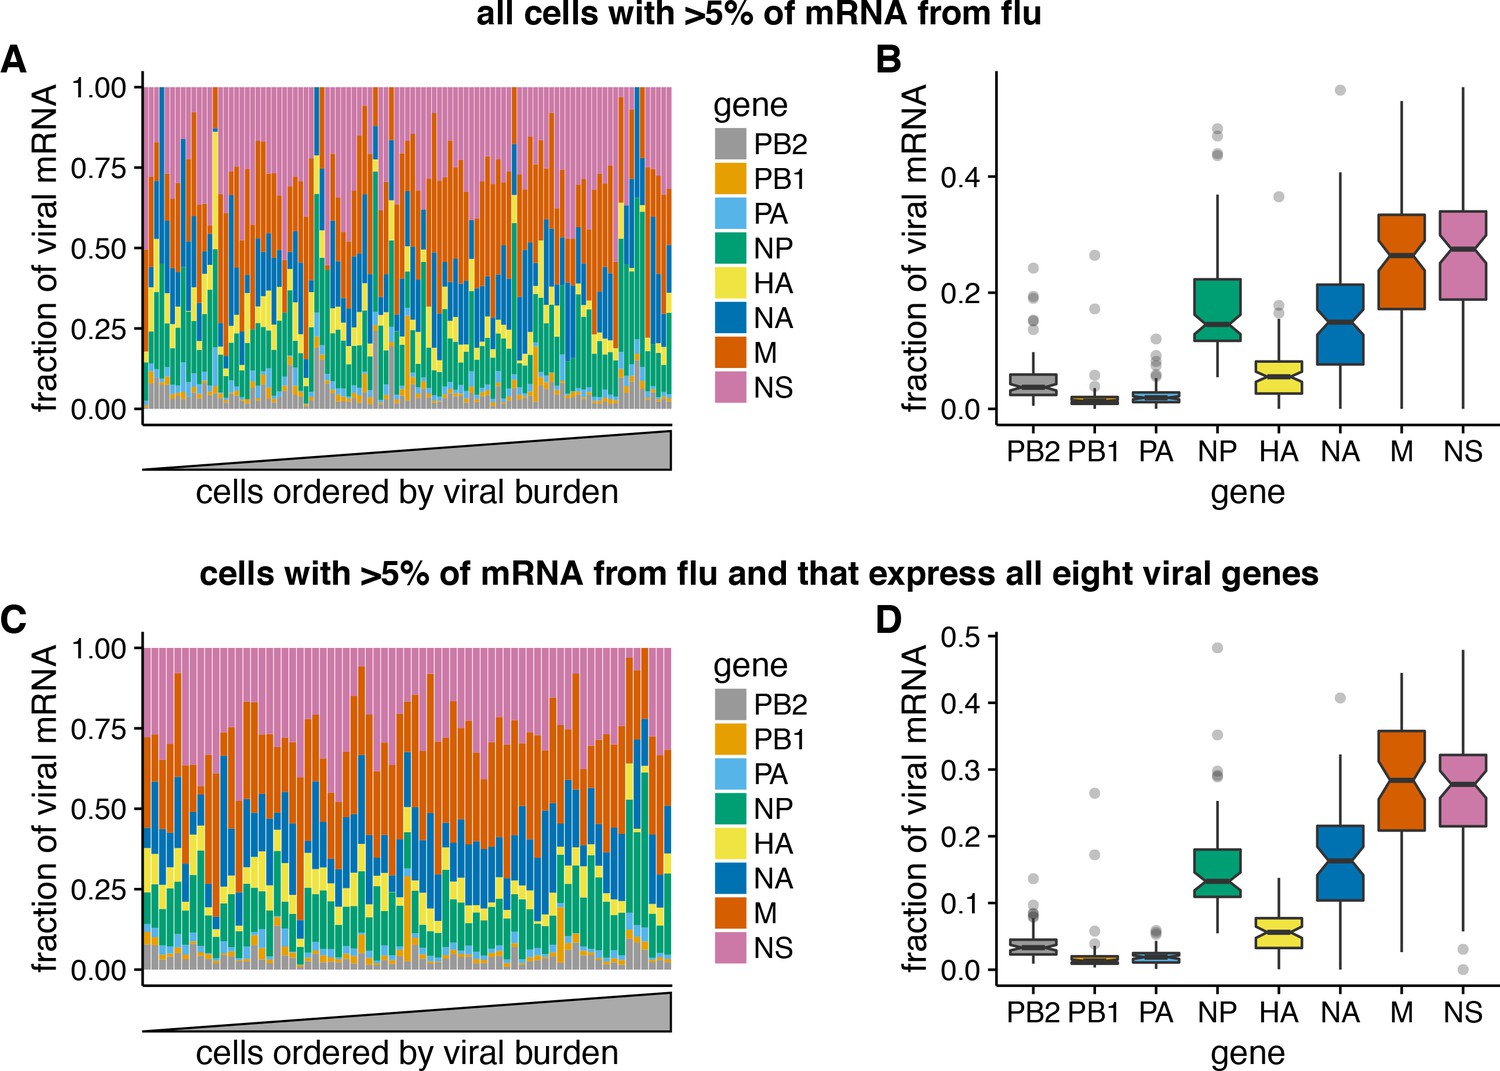
Relative expression of influenza virus genes in highly infected cells (>5% of total mRNA from virus).
(A) The fraction of viral mRNA from each viral gene for each cell. (B) Box plots showing the distribution of the fraction of viral mRNA per cell from each viral gene. The black lines at the notches are the medians, and the tops and bottoms of boxes indicate the first and third quartiles. Whiskers extend to the highest or lowest data point observed within 1.5x the interquartile range, outliers shown as circles. Notches extend 1.58x the interquartile range divided by the square root of the number of observations. (C), (D) The same plots, but only including cells for which we observed at least one molecule of each viral gene.
-
Figure 6—source data 1
The raw data for all cells are in p_flu_expr_all.csv.
- https://doi.org/10.7554/eLife.32303.024
-
Figure 6—source data 2
The raw data for fully infected cells are in p_flu_expr_fullyinfected.csv.
- https://doi.org/10.7554/eLife.32303.025
Figure 7 with 1 supplement

The abundance of each viral transcript in cells that are co-infected with the two viral variants and have 5% of their mRNA derived from virus.
The bars show the logarithms of the numbers of each viral mRNA detected, and are colored in linear proportion to the fraction of that mRNAs derived from wild-type or synonymously barcoded virus.
-
Figure 7—source data 1
The raw data plotted in this figure are in p_co-infection.csv.
- https://doi.org/10.7554/eLife.32303.028
-
Figure 7—source data 2
The sequence of the HA viral RNA carrying the GFP gene is in HAflank-eGFP.fasta.
- https://doi.org/10.7554/eLife.32303.029
Figure 7—figure supplement 1
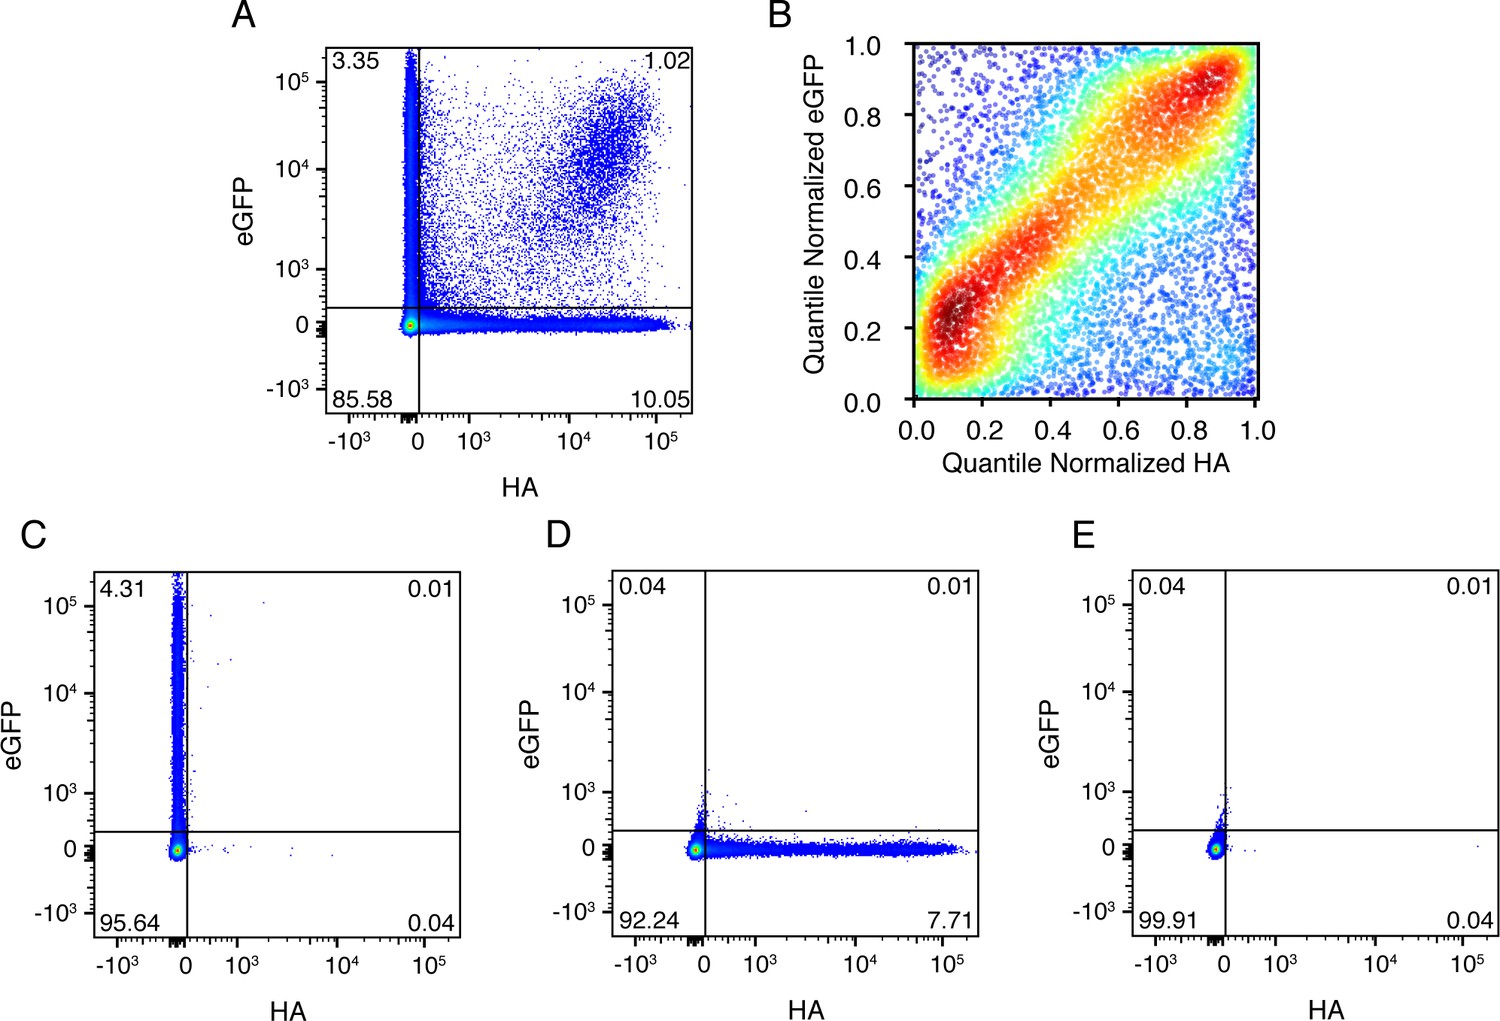
Co-infected cells express roughly equal amounts of a gene from each infecting viral variant.
(A) Cells were co-infected with a mix of wild-type virus and virus in which the HA gene was replaced by GFP flanked by the terminal regions of the HA gene segment. At 10 hr post-infection, cells were analyzed by flow cytometry for HA and eGFP expression. (B) The expression of HA and GFP are correlated in co-infected cells. Shown are the quantile-normalized HA and eGFP signals for double-positive cells. Cells are colored by density, using a Gaussian kernel density estimate. (C) ,(D), (E) Gating controls, single infection with eGFP virus, single infection with wild-type virus, and uninfected cells, respectively. .
Figure 8
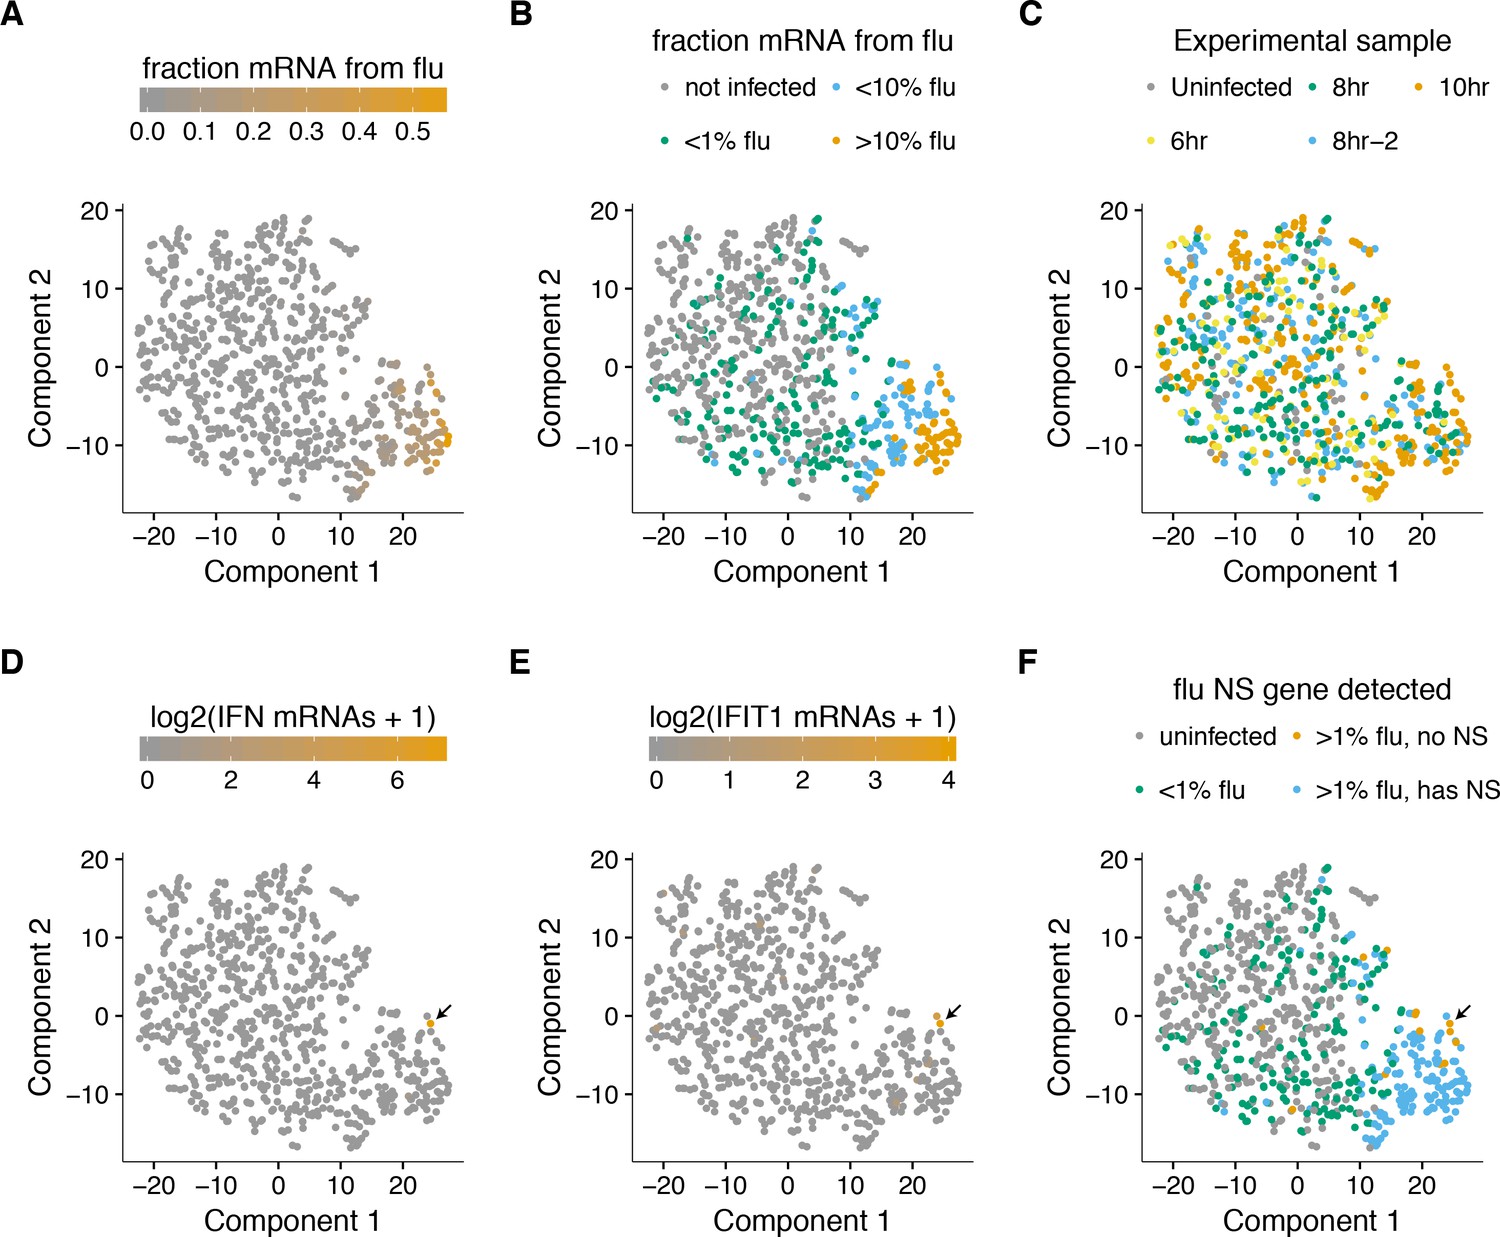
A t-SNE plot created by semi-supervised clustering using genes that co-vary with viral infection status.
Each point is a single cell, and each panel shows an identical layout but colors the cells according to a different property. (A), (B) Cells colored by the fraction of their mRNA derived from virus. (C) Cells colored by the experimental sample. (D) Cells colored by the number of detected transcripts from type I and III interferons (IFN). Only one cell has detectable interferon expression (in orange, indicated with arrow). (E) Cells colored by the expression of the interferon-stimulated gene IFIT1. (F) Cells colored by whether they express the viral NS gene. The one interferon-positive cell is lacking NS, but so are many interferon-negative cells.
Figure 9 with 2 supplements
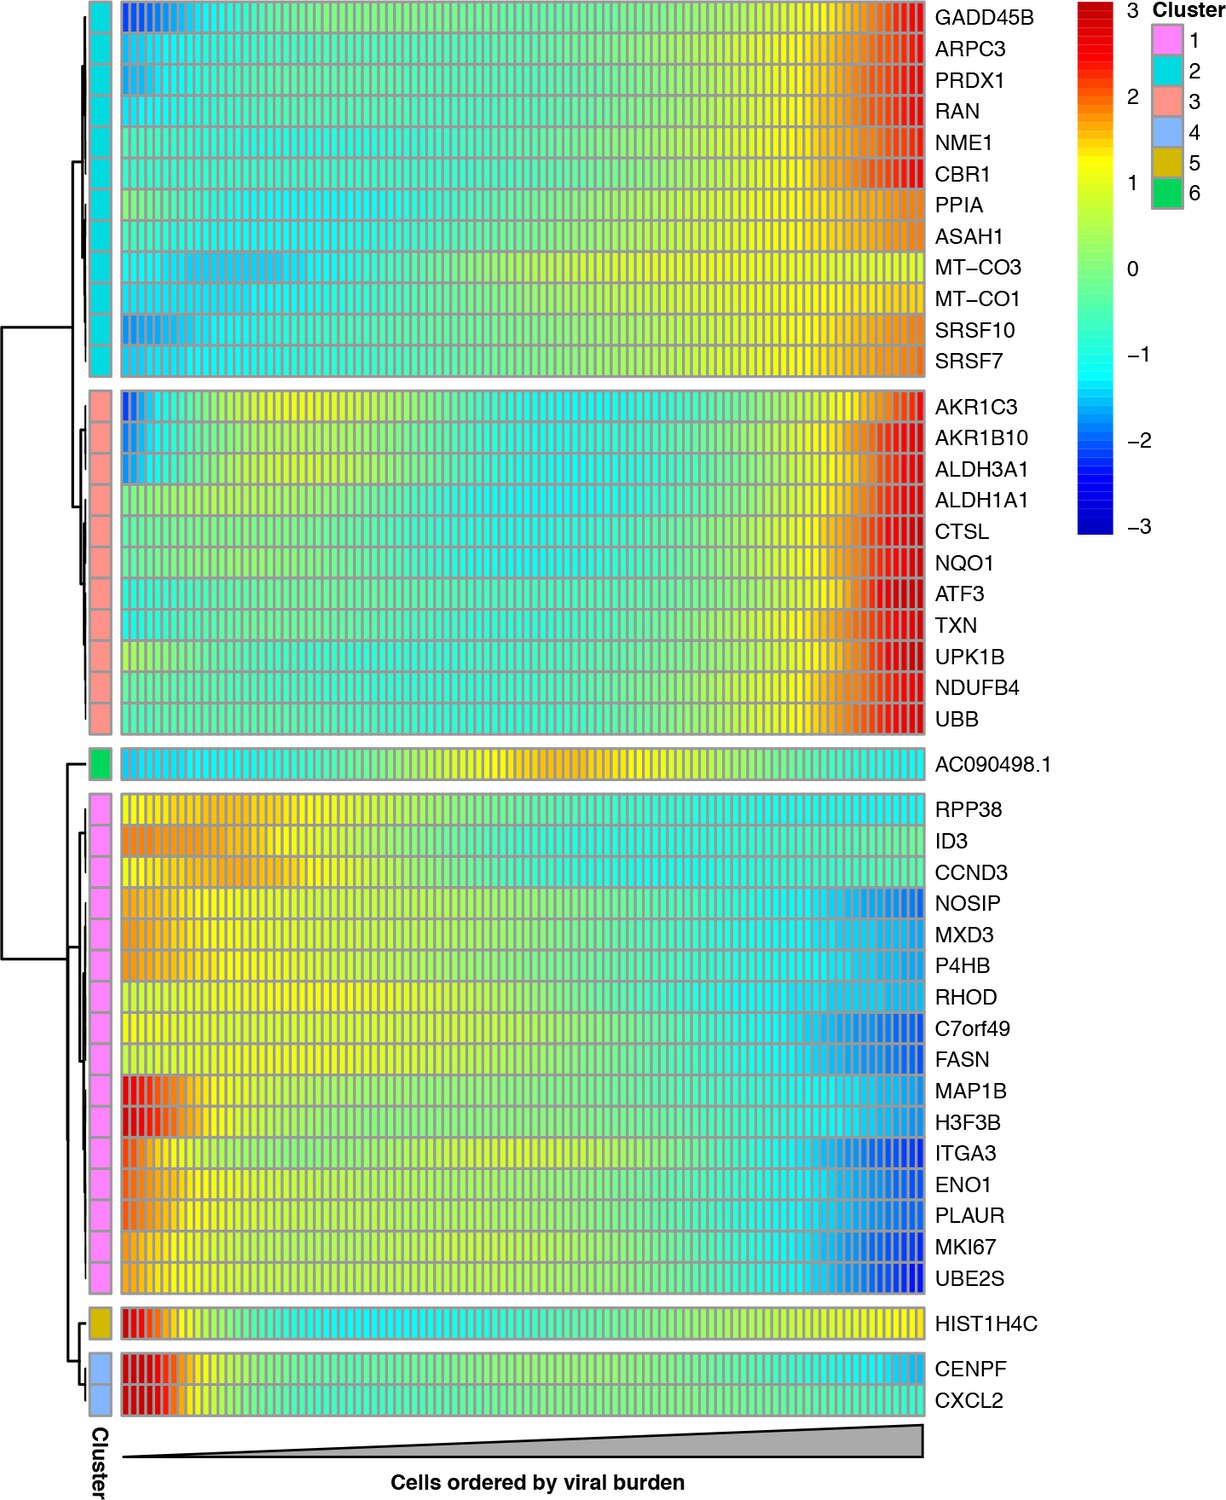
Cellular genes that co-vary in expression with the amount of viral mRNA in cells expressing all eight viral genes.
The columns are cells, ordered from left to right by the fraction of mRNA derived from virus. Each row is a gene that is differentially expressed as a function of the fraction of mRNA derived from virus at a false discovery rate of 0.1. Genes for which the color goes from blue at left to red at right are expressed at higher levels in cells with more viral mRNA. The scale bar indicates the number of standard deviations above or below the mean expression, truncated at 3-fold on both sides.
-
Figure 9—source data 1
The full results of the differential expression test are in p_sig_cellular_genes.csv.
- https://doi.org/10.7554/eLife.32303.034
-
Figure 9—source data 2
A gene-set analysis for pathways associated with the amount of viral mRNA is in p_pathway_enrichment.csv.
- https://doi.org/10.7554/eLife.32303.035
Figure 9—figure supplement 1
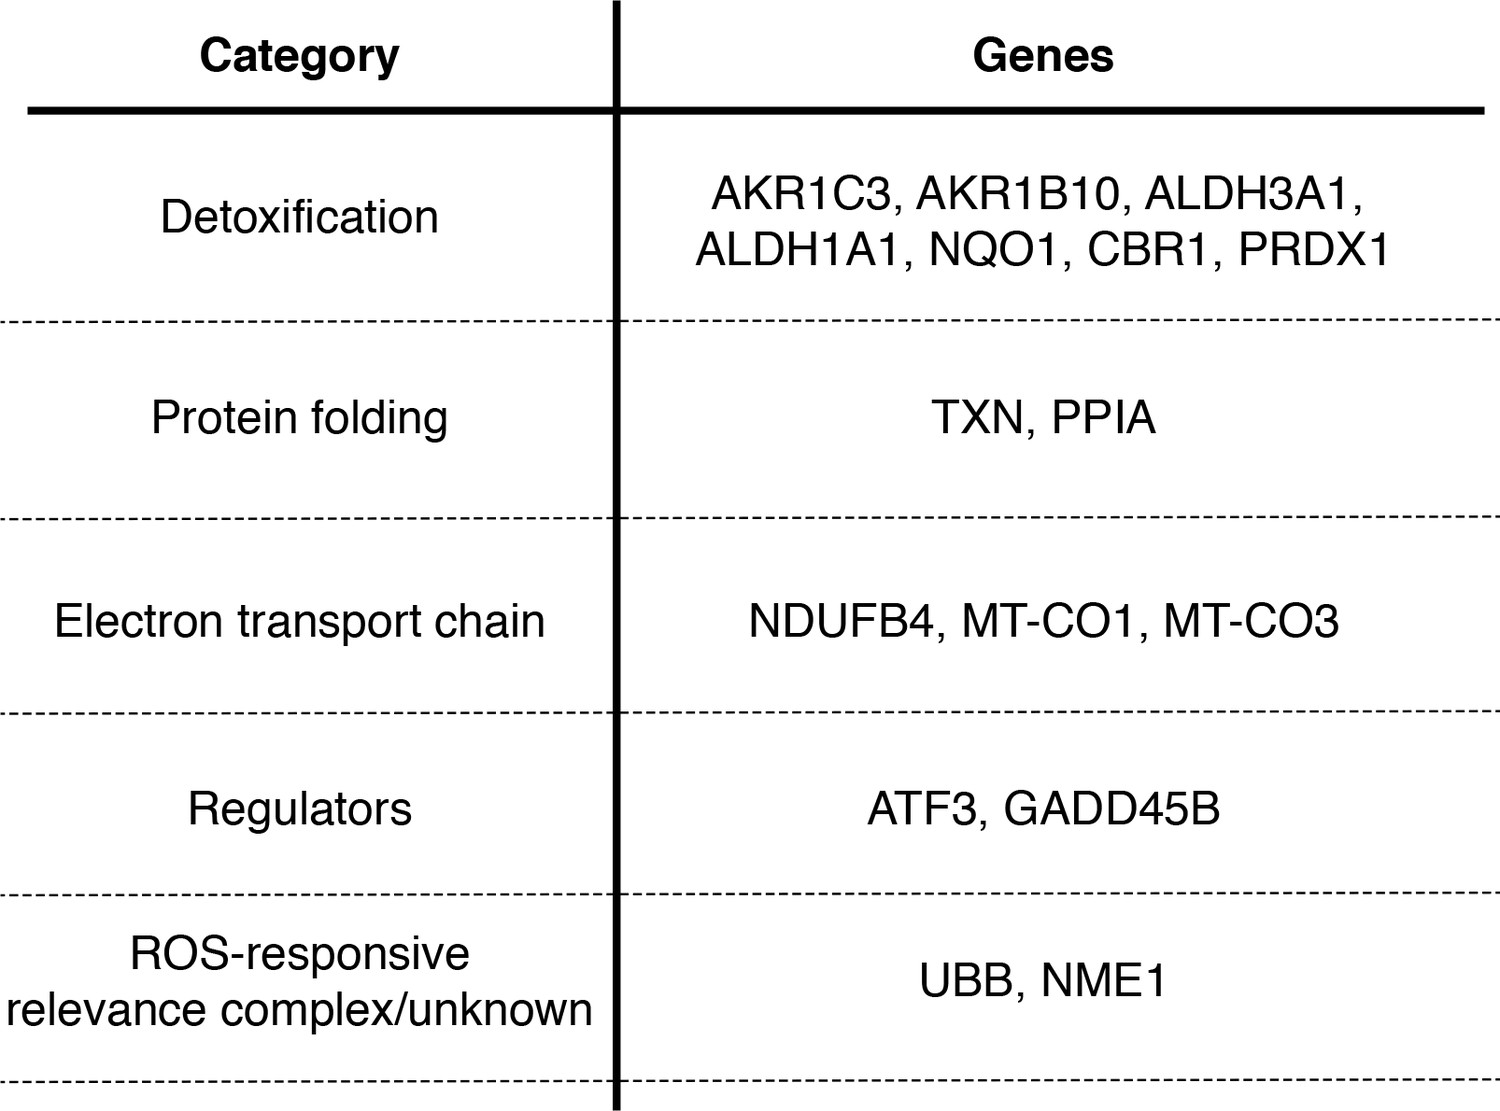
Many genes that co-vary with viral load are involved in the oxidative stress response.
Table delineating genes in Figure 9 that are associated with the response to oxidative stress (Duong et al., 2017; Jung et al., 2017; Lee and Ryu, 2017; Peuchant et al., 2017; MacLeod et al., 2016; Jiang et al., 2016; Gorrini et al., 2013; Miura et al., 2013; Kim et al., 2010; Banning et al., 2005; Murray et al., 2003; Doyle et al., 1999).
Figure 9—figure supplement 2
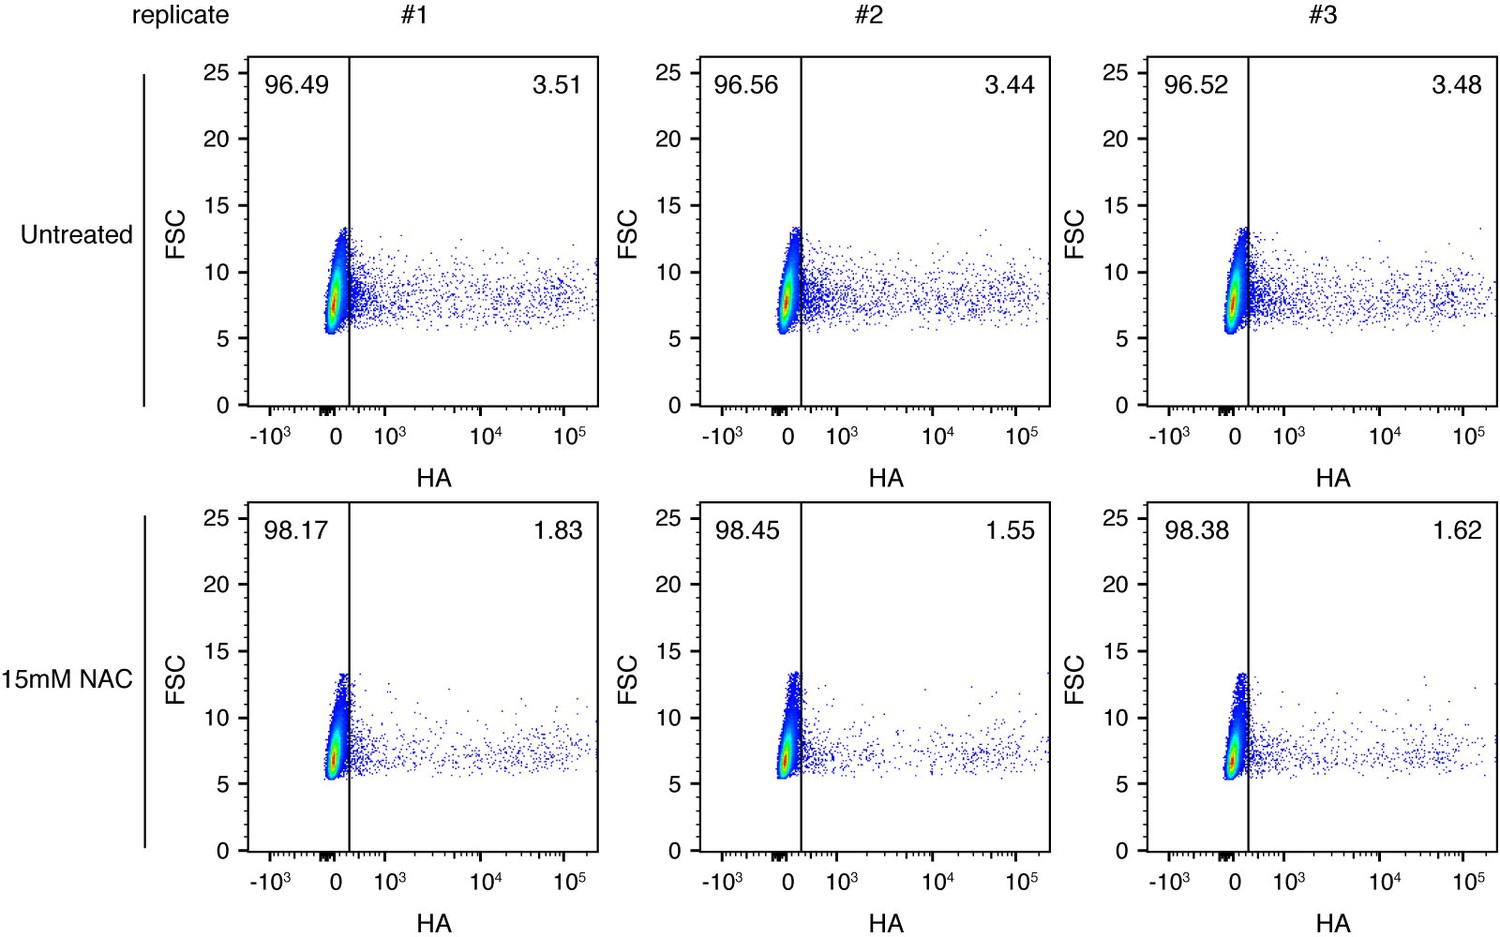
Pre-treating to reduce oxidative stress decreases the fraction of infected cells expressing detectable viral protein.
Cells were treated as indicated with 15 mM N-acetylcysteine (NAC), an antioxidant, and infected at an MOI of 0.1 as calculated by TCID50 on MDCK-SIAT1 cells. At 10 hr post-infection, cells were analyzed by flow cytometry for HA expression. The percentage of HA-positive cells is indicated on the flow cytometry plots. Data are shown for three independent replicates.
Additional files
-
Supplementary file 1
Computer code for the analyses.
This ZIP file contains a Jupyter notebook that runs CellRanger to align and annotate the reads, and a Jupyter notebook that uses Monocle to analyze the cell-gene matrix. The ZIP file also includes associated custom scripts. To just run the Monocle analysis in monocle_analysis.ipynb on a pre-generated cell-gene matrix, unpack Supplementary file 2 into. /results/cellgenecounts/.
- https://doi.org/10.7554/eLife.32303.036
-
Supplementary file 2
The annotated cell-gene matrix in Matrix Market Format.
This is the matrix generated in. /results/cellgenecounts/ by running the CellRanger analysis in align_and_annotate.ipynb in Supplementary file 1. This file is available on DataDryad at https://doi.org/10.5061/dryad.qp0t3.
- https://doi.org/10.7554/eLife.32303.037
-
Transparent reporting form
- https://doi.org/10.7554/eLife.32303.038
Download links
A two-part list of links to download the article, or parts of the article, in various formats.
Downloads (link to download the article as PDF)
Open citations (links to open the citations from this article in various online reference manager services)
Cite this article (links to download the citations from this article in formats compatible with various reference manager tools)
Extreme heterogeneity of influenza virus infection in single cells
eLife 7:e32303.
https://doi.org/10.7554/eLife.32303


