An incoherent feedforward loop facilitates adaptive tuning of gene expression
- New York University, United States
- Memorial Sloan Kettering Cancer Center, United States
- University of Toronto, Canada
Figures
Figure 1 with 1 supplement
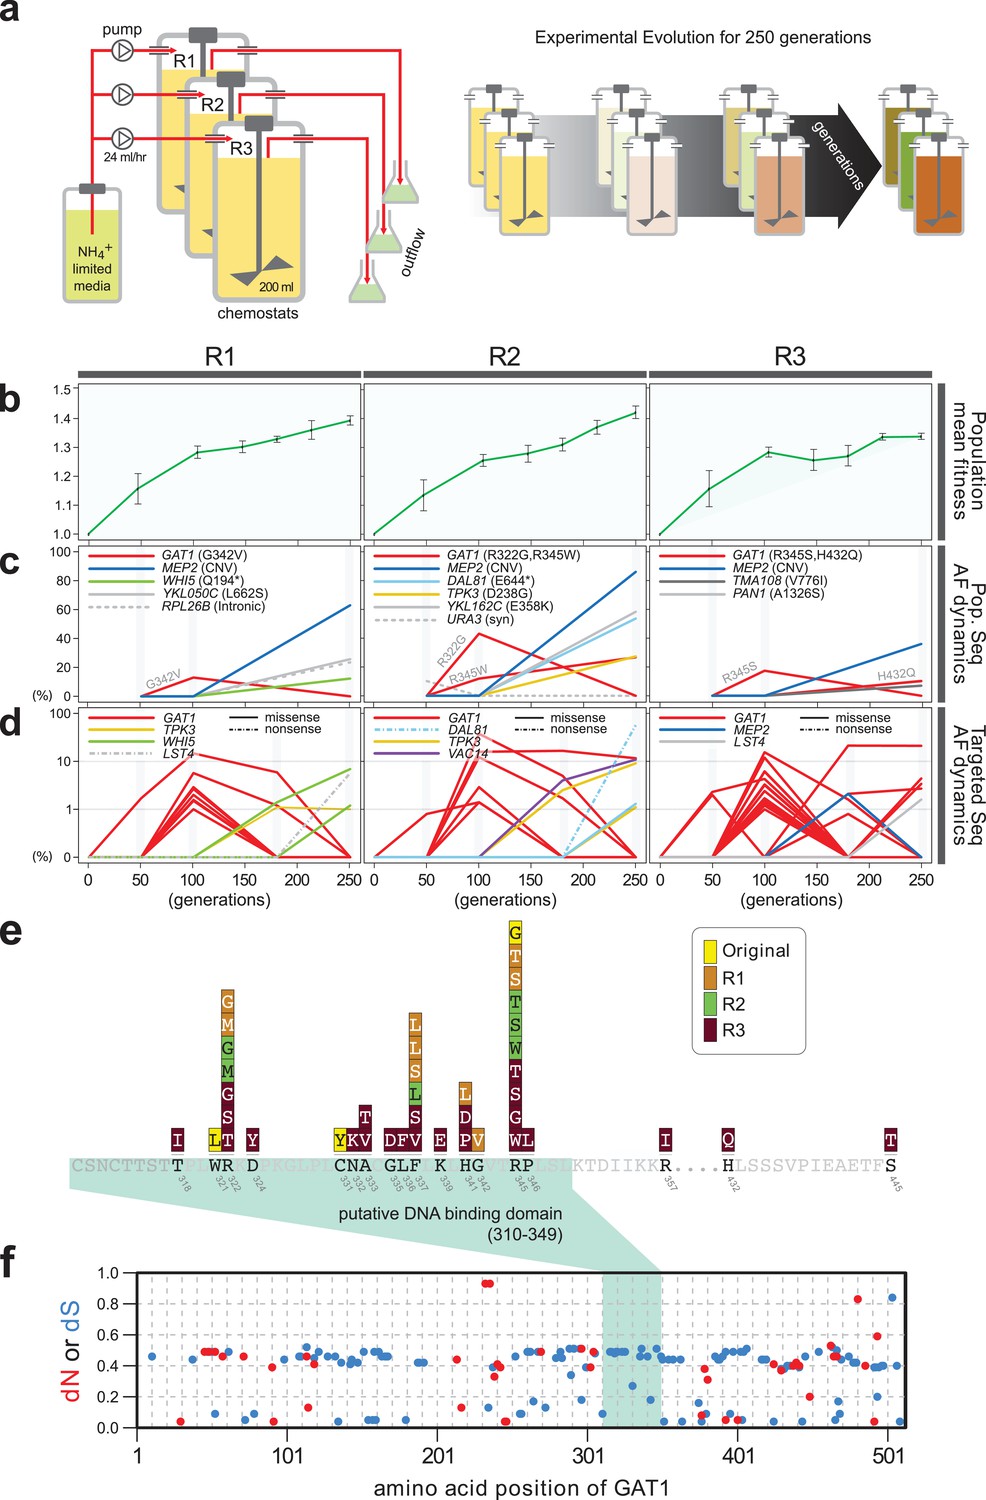
Repeated LTEE in ammonium-limited chemostats selects for adaptive mutations in GAT1.
(a) LTEE design. Three chemostat vessels w ere founded with a clonal ancestral population and maintained under constant dilution with defined media containing 0.4 mM (NH 4) 2 SO 4 , (0.8mM nitrogen). Chemostats were maintained in continuous mode for 250 generations (~ 3 months) and samples obtained every 10-20 generations for archiving. (b) Dynamics of population fitness. The rate of fitness improvement decelerates over time for three independently replicated LTEE (R1, R2 and R3). Error bar are 95% CI of linear regression analysis of competition assays, which comprised six time points each. (c) Allele dynamics in parallel LTEE. Whole population while genome sequencing was performed on samples from the three LTEEs at 50, 100 and 250 generations to identify high frequency mutations (> ~10%) using an Illumina HiSeq2500 in 2 x 50 bp paired end mode with an average read depth of ~50X. The frequency of the MEP2 amplification was defined as the proportion of clones bearing more than 2 copies of MEP2 among 96 randomly selected clones. GAT1 (red lines) variants are a primary target in the earliest generations of selection but, in some LTEE, are ultimately replaced by other alleles including CNVs that encompass MEP2 (blue lines) and mutations in genes that control cell cycle and growth. x- and y-axes represent time in generation and AF (allele frequency) in %, respectively. (d) Dynamics of minor frequency mutations. 12 genes that have previously been identified as adaptive targets of selection in different nitrogen-limited environments (see method) were subjected to targeted deep sequencing. Multiple missense mutations in GAT1 are present simultaneously in each population and compete with each other during the earliest generations. Discrepancies in the estimated AFs of the same mutations identified in Figure 1c are likely due to noise in the sequencing assay. x- and y-axes represent time in generation and AF (allele frequency) in %, respectively (e) Mutational landscape of adaptive GAT1 mutations. All mutations in GAT1 with population AF greater than 1% are shown. The DNA binding domain of GAT1 is a mutational hotspot in all ammonium-limited LTEE. Multiple missense (protein coding alteration) mutations were observed but no nonsense or frame-shift mutations were detected. (f), The DNA binding domain of GAT1 is under purifying selection in the wild. dN and dS values (see method for their definition) for GAT1 at each amino acid position were calculated using SNAP v2.1.1 (http://www.hiv.lanl.gov/content/sequence/SNAP/SNAP.html) Korber, 2000 using sequences from 42 different wild yeast strains. Unlike LTEE in ammonium-limited chemostats, the GAT1 DNA binding domain is under purifying selection implying that non-synonymous mutations are likely to be detrimental in dynamic environments.
Figure 1—figure supplement 1
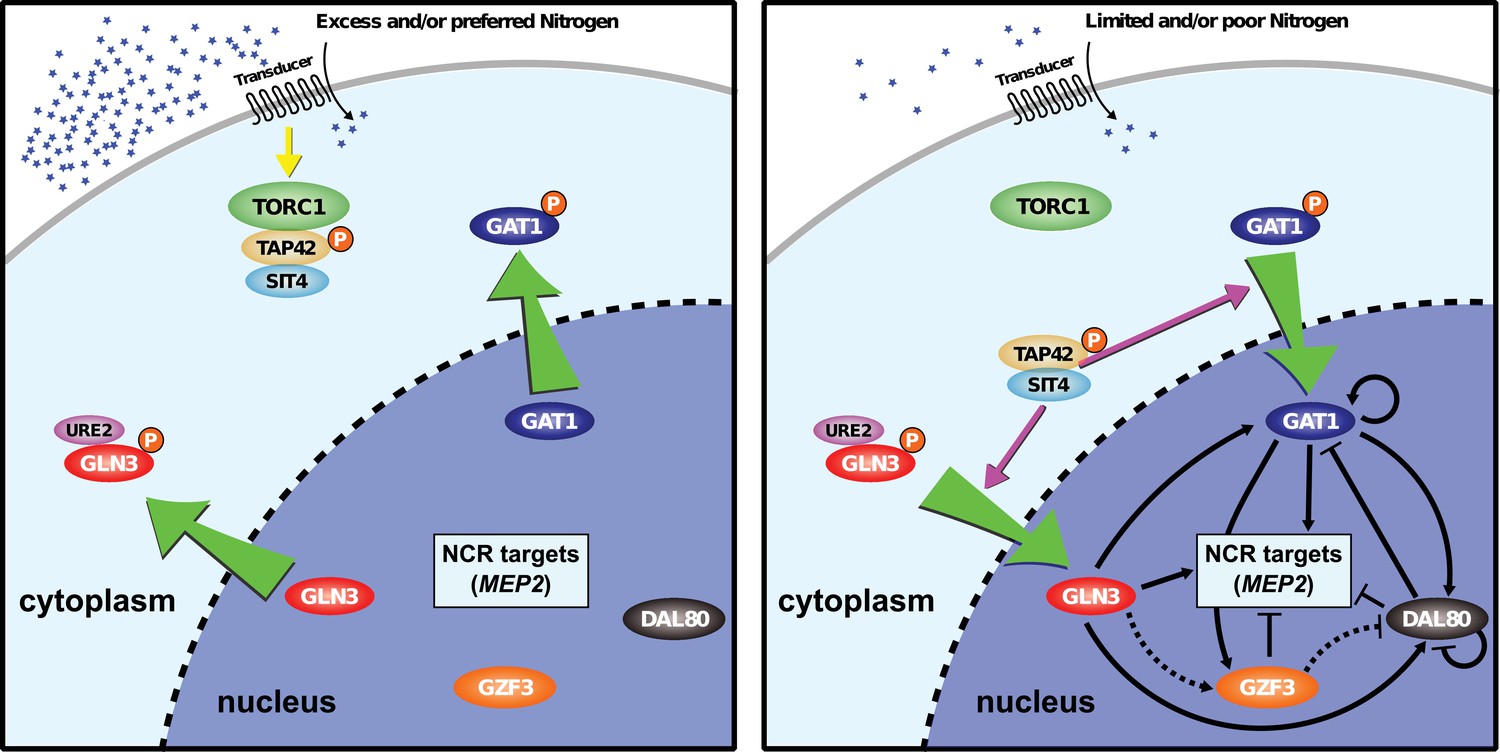
Model of NCR regulon.
The NCR regulon is controlled by four GATA-binding transcription factors: two activators (GLN3 and GAT1) and two repressors (DAL80 and GZF3). Under nitrogen rich conditions, GLN3, and any GAT1, are phosphorylated and retained in the cytoplasm in a TORC1-dependent manner. In nitrogen-poor conditions, GLN3 and GAT1 are dephosphorylated allowing them to enter the nucleus and activate NCR sensitive genes. The activator, GAT1, and repressors, DAL80 and GZF3 contain GATAA consensus sequences in their promoters and therefore are subject to NCR regulation resulting in both positive and negative regulatory loops. The activator GLN3 is constitutively expressed and acts to initiate NCR expression subject to post-translational regulation.
Figure 2 with 1 supplement
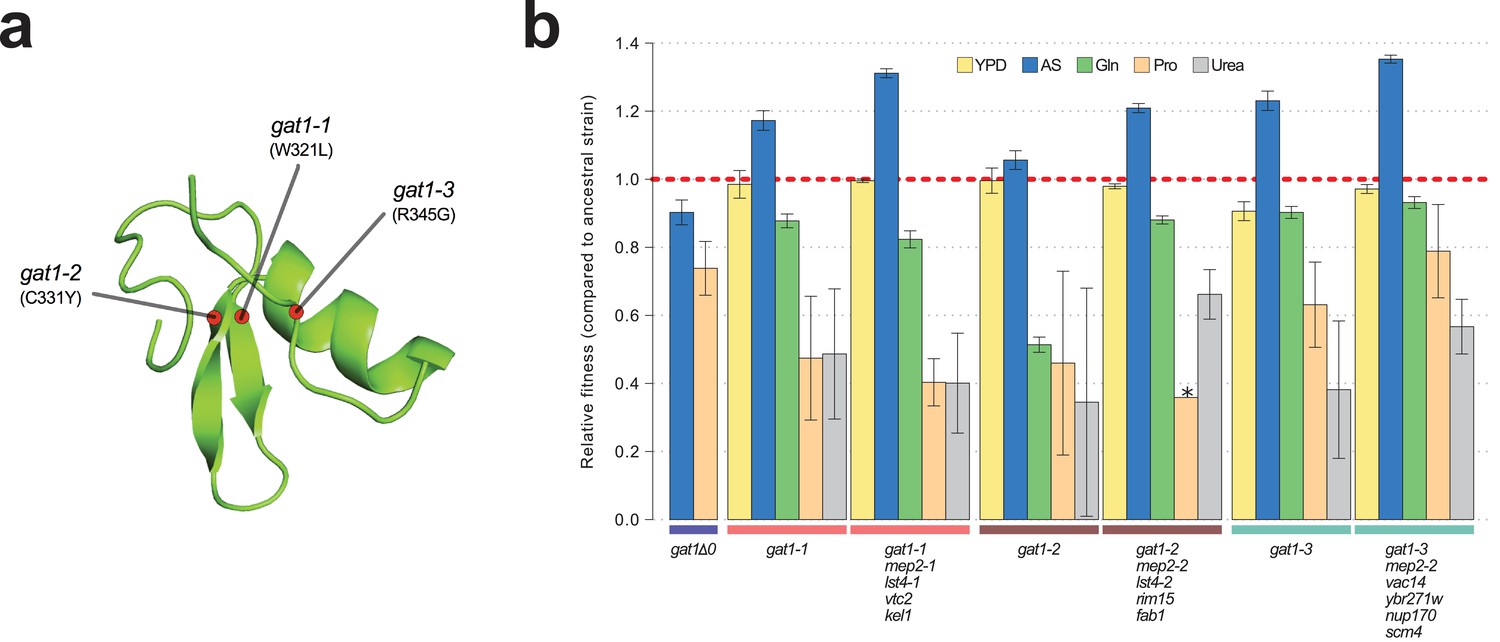
Adaptive GAT1 mutations underlie increased fitness and confer antagonistic pleiotropy.
(a) 3D structure model of GAT1 DNA binding domain. The 3D structure is based on available GATA factor DNA binding domain structures in the modbase database (https://modbase.compbio.ucsf.edu/). Adaptive amino acid changes selected for the subsequent analyses lie within, or in close proximity, to the DNA binding domain of GAT1. (b) Fitness effects of GAT1 mutations. GAT1 variants are beneficial in ammonium-limited chemostats and confer increased fitness in the lineages in which they occur. GAT1 variants confer a fitness cost in non-ammonium limited environments consistent with antagonistic pleiotropy. Error bars represent 95% CI of linear regression analysis of competitive fitness assays. ‘*’ denotes the absence of a 95% CI estimate due to a small number of time points sampled in the fitness assay (<5). (YPD: YPD batch culture, AS: Ammonium sulfate-limited chemostat, Gln: Glutamine-limited chemostat, Pro: Proline-limited chemostat, Urea: Urea-limited chemostat; all nitrogen-limited media were normalized to 0.8mM nitrogen).
Figure 2—figure supplement 1
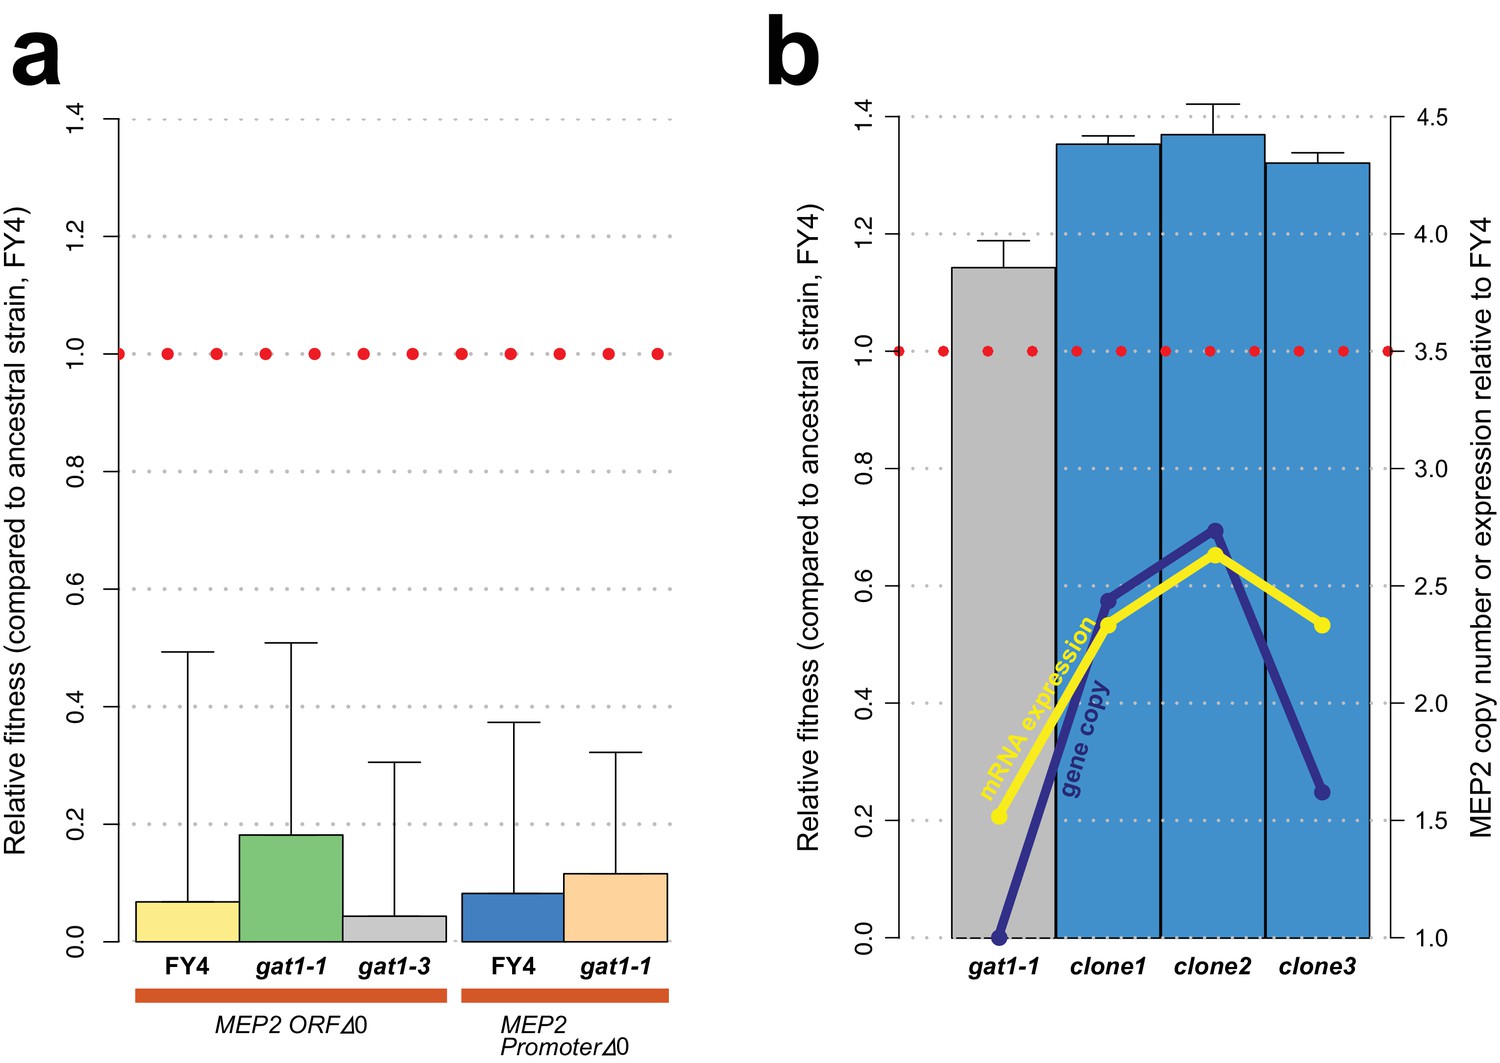
GAT1 variant fitness effects are due to its effect on MEP2.
(a) Fitness effect of MEP2 KO in the background of the ancestral strain (FY4), gat1-1 and gat1-3 in ammonium-limited chemostats. All conditions and methods are identical to those used in Figure 2b. Deletion of MEP2 ORF and its promoter sequences is highly deleterious in ammonium-limited chemostats regardless of the genotype of GAT1. (b) Effect of MEP2 gene copy number on fitness and expression under ammonium limitation. Three clones were identified that contain increased MEP2 gene copy number from the last time point of each LTEE. DNA copy number and mRNA expression of MEP2 was quantified by qPCR assays targeting both MEP2 and ACT1 genes in evolved lineages, gat1-1 mutant strain and the ancestral strain (FY4).
Figure 3 with 2 supplements
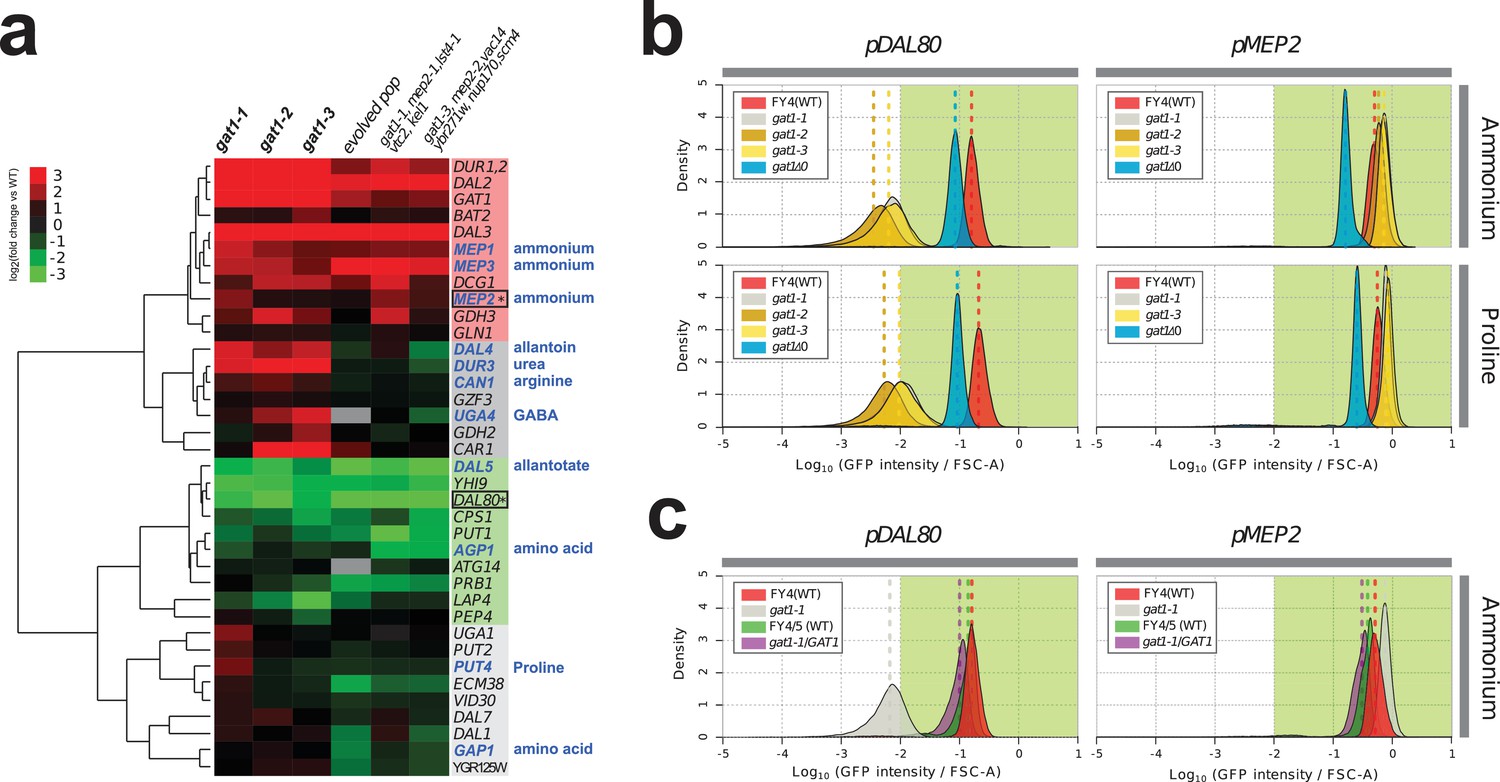
Adaptive GAT1 variants exhibit differential effects on target gene expression.
(a) Gene expression profile of NCR genes in different GAT1 variant lineages. ‘Blue’ gene names indicate permease-encoding genes for different nitrogen sources. Clustered gene expression values relative to the ancestral strain (log2 transformed fold change compared to the ancestor without statistical filtering) are shown for 41 experimentally confirmed NCR target genes. Expression data for the final evolved population and two lineages containing multiple mutations in addition to GAT1 variants from our previous report (Hong and Gresham, 2014) are also presented for reference. (b) Transcriptional reporter assay for MEP2 and DAL80. We quantified GFP expression from the MEP2 and DAL80 promoters in the ancestral and GAT1 variant backgrounds in different nitrogen-limited conditions. In nitrogen-limited chemostats containing different individual sources of nitrogen (ammonium, glutamine, proline and urea), all mutant strains (gat1-1, gat1-2 and gat1-3) show the same gene expression pattern for DAL80 (decreased expression) and MEP2 (increased expression) compared to the ancestral genotype. A GAT1 KO mutant results in decreased expression of both DAL80 and MEP2. (c) GFP reporter assay for MEP2 and DAL80 promoters in heterozygous diploids. The gat1-1/GAT1 genotype results in expression of DAL80 or MEP2 comparable to the ancestral strain. The distribution and median expression (dashed line) for each genotype is shown.
Figure 3—figure supplement 1
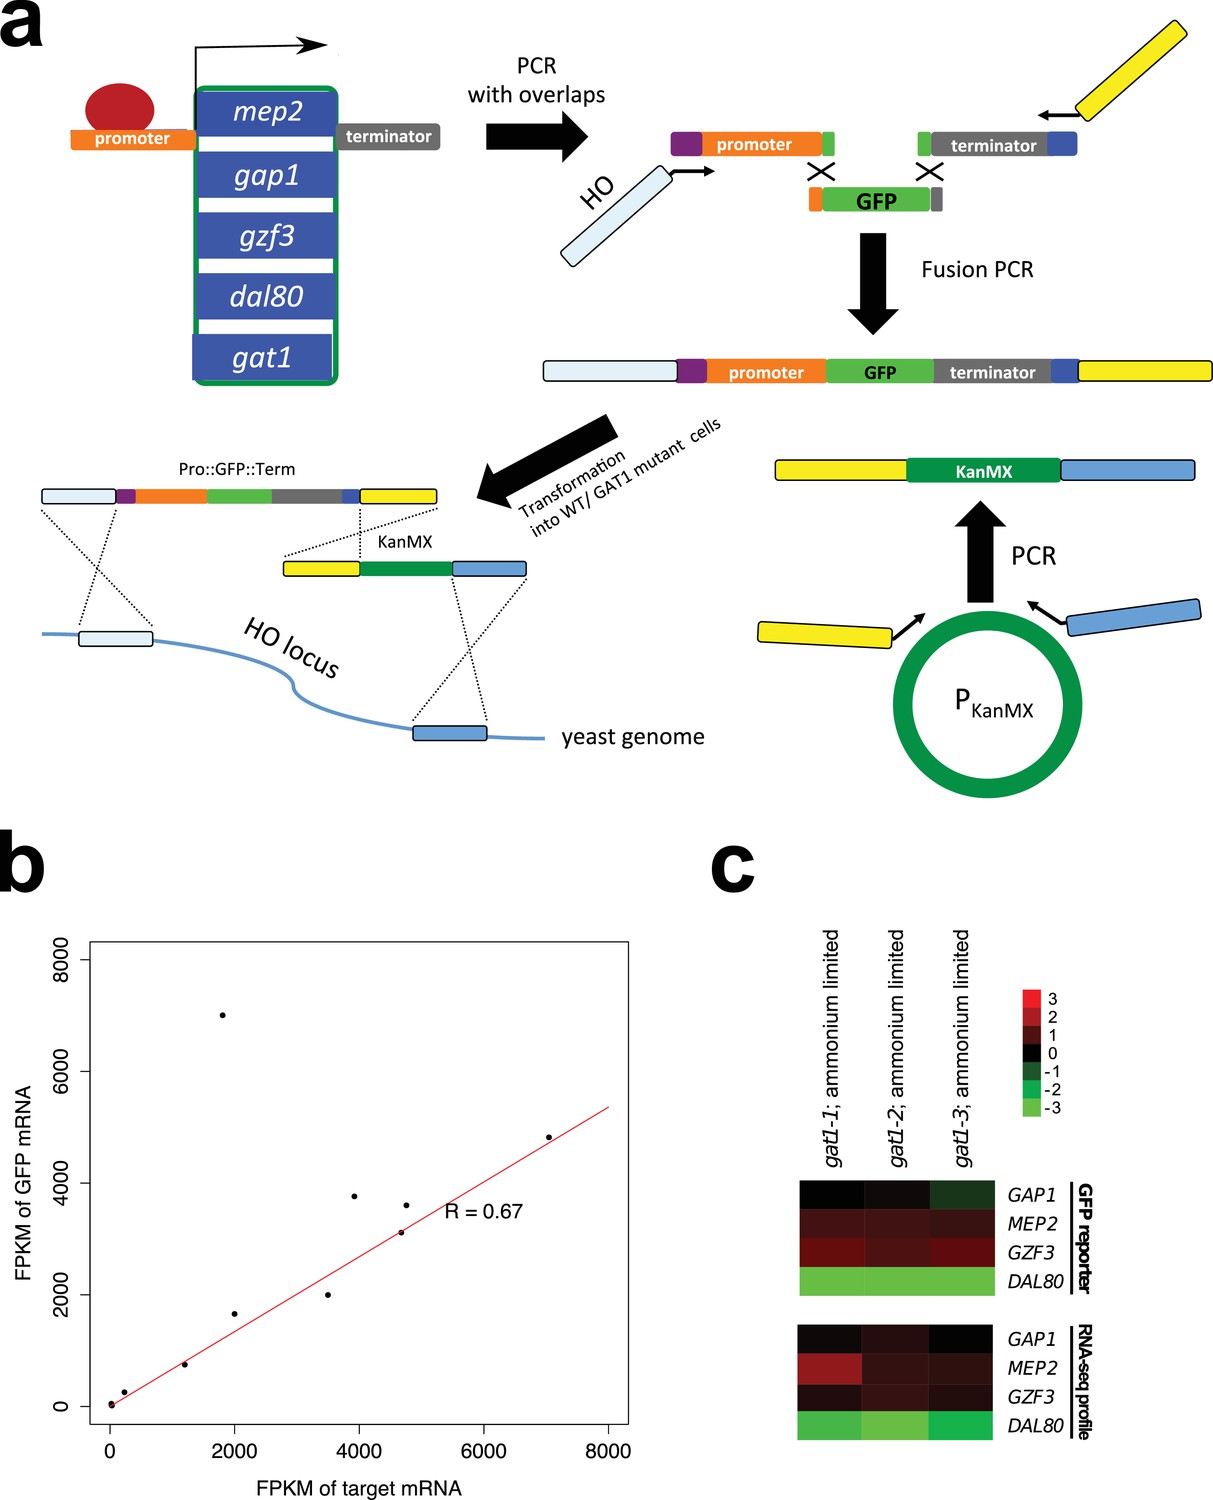
Construction and validation of transcriptional reporters.
(a) Construction of transcriptional reporters for GAP1, MEP2, GZF3 and DAL80 promoters. The promoters of five different NCR target genes were amplified via PCR to include partial overlap with GFP sequence (green) and the HO locus (purple). In addition, the corresponding terminator sequence for each NCR target gene was amplified creating overlaps with GFP sequence (green) or an artificial anchor sequence (dark blue). The GFP gene was also amplified so that it contained partial overlaps with the two amplicons containing the promoter and terminator sequences for each gene. The three amplicons were fused using fusion PCR, which included extended primers containing sequence complementary to the 5’ UTR of HO (light blue) and an artificial linker sequence (yellow). The KanMX cassette (dark green) was also amplified from a plasmid such that its left arm was complementary to the artificial linker sequence (yellow) and its right arm was complementary to 3’ UTR of the HO locus (blue). The two full length constructs were co-transformed into the relevant genotype and integration at the HO locus confirmed by selection for G418 resistance and PCR. GFP expression was measured in a flow cytometer to quantify transcriptional activity from each reporter. (b) Validation of GFP reporter constructs. We performed RNAseq analysis of three GFP constructs (GAP1pr::GFP, MEP2pr::GFP and DAL80pr::GFP). Based on FPKM values, mRNA expression of the endogenous gene and GFP mRNA expressed from the same promoter are highly correlated (R = 0.67). (A single outlier due to low read coverage was excluded when quantifying the strength of the relationship). (c) the GFP reporter assay is consistent with expression quantified using RNAseq in an ammonium-limited environment. Median GFP intensity measured by flow cytometry for each GAT1 allele was divided by the same value for WT, and log2 transformed. Relative gene expression levels estimated by RNAseq and the GFP reporter assay are highly comparable (r = 0.9275) justifying the use of GFP protein expression levels measured by flow cytometry as a proxy for native mRNA expression level of the four target genes. The fold change compared to WT is log2 transformed.
Figure 3—figure supplement 2
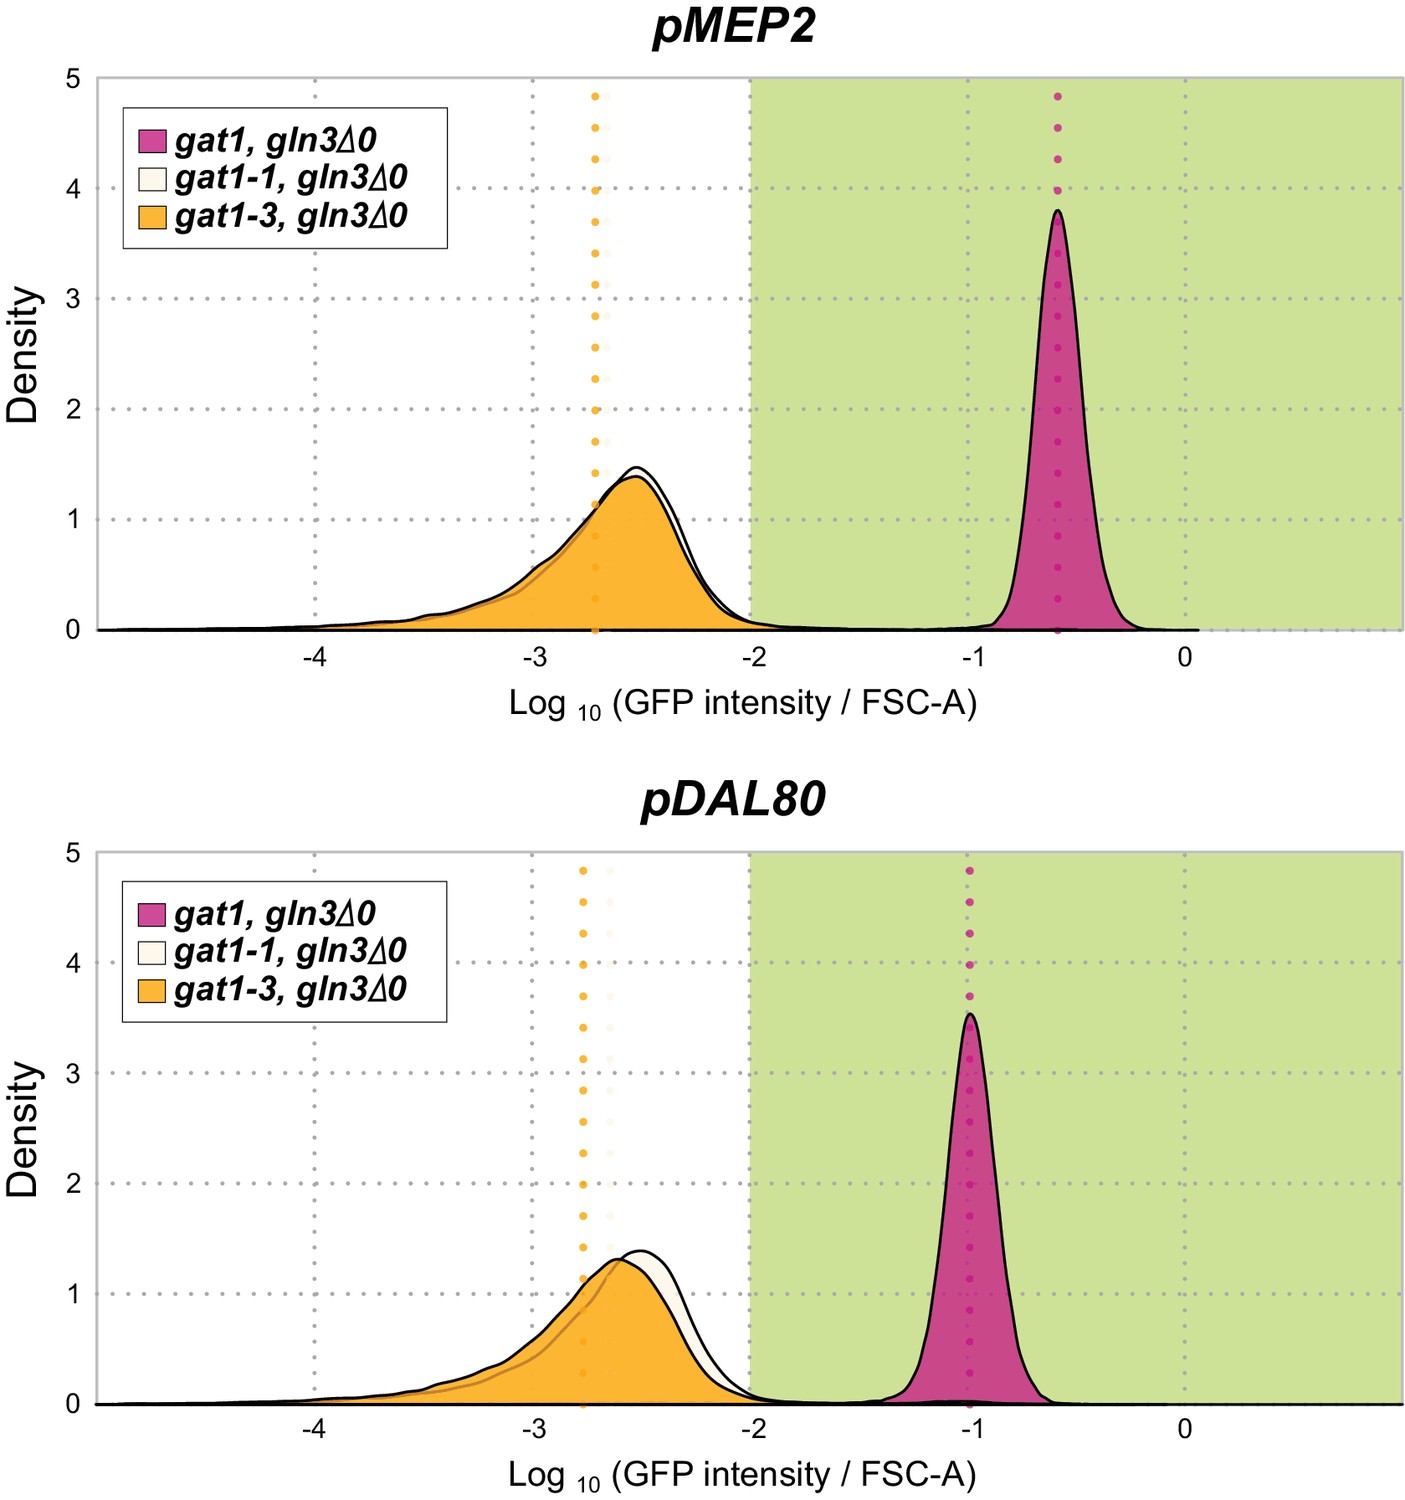
GFP reporter assay for MEP2 and DAL80 in the background of GLN3 KO.
GLN3 is an a transcriptional activator of NCR genes. A GLN3 KO in the background of either the gat1-1 or gat1-3 alleles shows no expression from the MEP2 and DAL80 promoters.
Figure 4 with 2 supplements

Adaptive GAT1 variants alter DNA binding affinities in a promoter-specific manner.
(a) Design of protein-DNA binding assays. We purified a 151-amino acid long protein fragments of GAT1 containing the DNA binding domain (DBD) (positions 310–349) for the ancestral GAT1 and two adaptive mutations – gat1-1 (W321L) and gat1-3 (R345G). DNA sequences containing the consensus sequence in MEP2 and DAL80 promoters were determined from the MotifDb collection in Bioconductor. MEP2 motif 1 contains three copies of GATAA, MEP2 motif 2 contains two copies of GATAA and DAL80 motif 1 contains one copy of GATAA. (b) Electrophoretic mobility shift assay (EMSA) analysis of GAT1 variants. Increasing quantities of the GAT1 DBD protein fragment from 0 to 20 μg were added to 32P-labeled dsDNA. Arrows and stars indicate protein-bound DNA and unbound DNA respectively. Negative motif sequences (neg) were prepared by randomizing bases only at their GATAA binding motif sequences (see Supplementary file 2B). (c) Proportion of bound DNA for different amounts of protein. The two GAT1 variants showed significantly decreased binding affinity to all three GATAA motifs. Dotted lines are fits to a two-parameter Michaelis-Menten model. Only ancestral GAT1 and gat1-3 (R345G) showed significant estimates of two parameters (Frmax and Kx) (p-value<0.02). Insignificant estimates for gat1-1 (W321L) may be due to the small number of data points (Supplementary file 2C). (d) Correlation between GAT1 promoter affinity and expression changes for NCR target genes. The promoter affinity for GAT1 (Lee and Bussemaker, 2010) is positively correlated (Spearman correlation = 0.31; p-value=0.02) with the alteration in expression of NCR targets in strains containing adaptive GAT1 mutations (log2 transformed fold change of gene expression of NCR genes in GAT1 variant strains compared to the ancestor strain). (e) Model for altered output from the NCR regulatory network by adaptive GAT1 mutations. GAT1 mutations reduce affinity for the promoter of MEP2, but have an even greater reduction in affinity for the promoter of the repressor, DAL80. (f) Mathematical modeling of GAT1 affinity for MEP2 and DAL80 promoters on steady-state MEP2 expression. The steady state expression level of MEP2 depends on both the absolute activation of the MEP2 promoter (indicated with increasing levels of blue) and DAL80 promoter and the ratio of their levels of activation (x-axis). MEP2 expression relative to an ancestral state (green point) is increased by adaptive GAT1 variants that result in a quantitative decrease in direct activation of MEP2 and a proportionally greater decrease in direct activation of DAL80 (parameter space resulting in increased MEP2 expression outlined by red triangle). As shown in the inset, an ancestral state in which MEP2 promoter activation (red) is greater than DAL80 promoter activation (pink) can evolve to a state in which both promoters are decreased in activation, but the decrease is more pronounced at the DAL80 promoter.
Figure 4—figure supplement 1
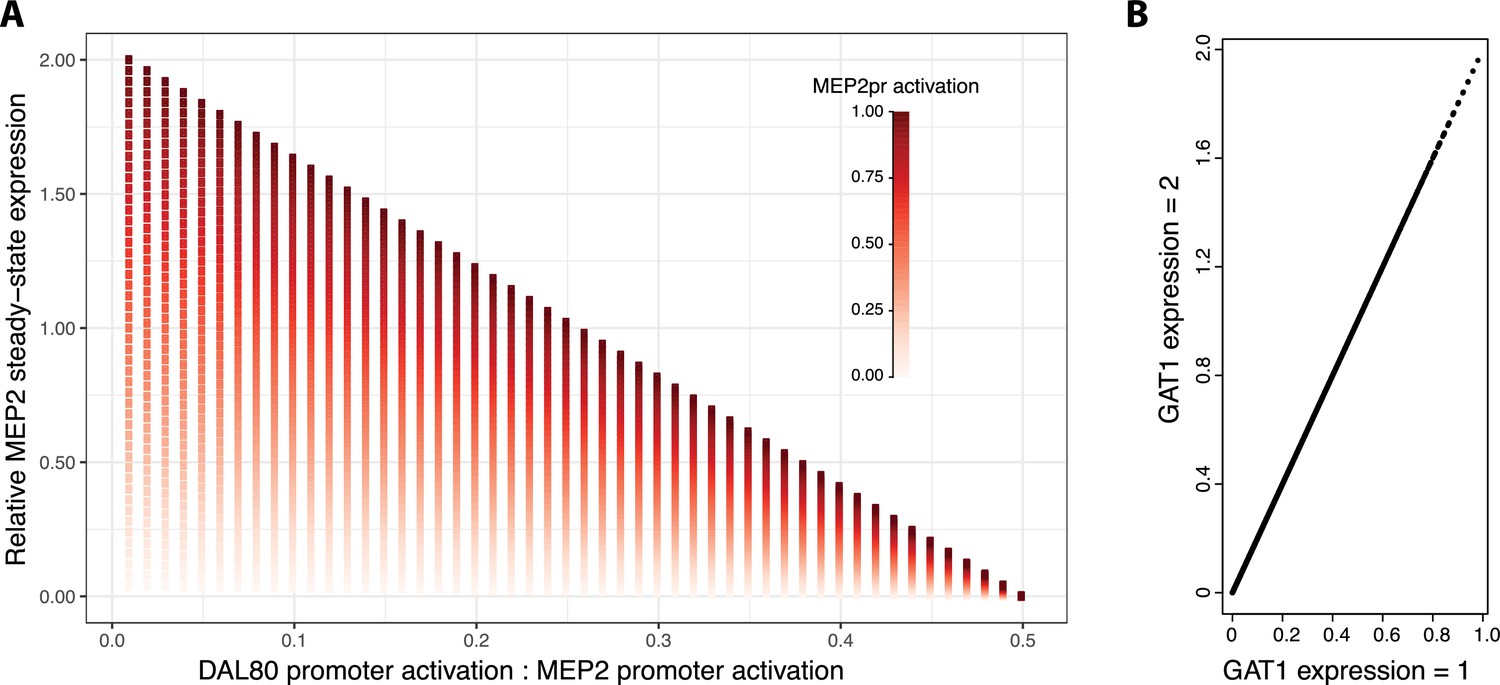
Increasing GAT1 expression results in increased MEP2 expression.
We studied the effect of increased GAT1 expression across the same parameter space investigated in Figure 4f. (a) We find that when GAT1 expression is increased by a factor of two, the effect of differential activation of MEP2 and DAL80 promoters on MEP2 expression is qualitatively identical and (b) for each parameter combination, expression of MEP2 is increased twofold. MEP2 expression levels are relative to values reported in Figure 4f .
Figure 4—figure supplement 2
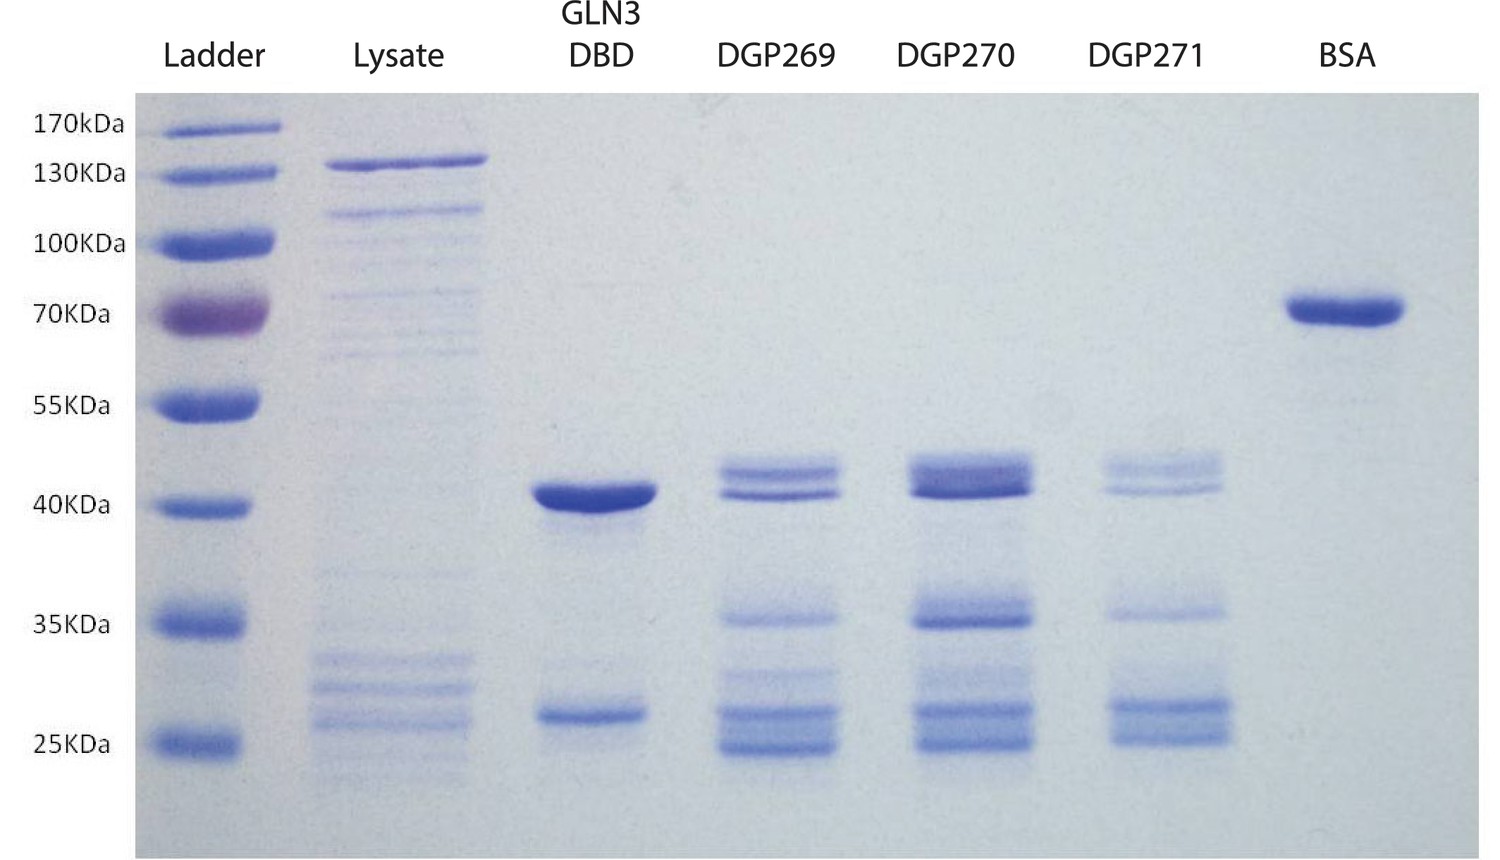
Purification of GST-tagged DNA binding domains of GAT1 variants.
Representative SDS-PAGE gel showing purified products used for EMSA experiments. Purified DNA binding domains for GAT1-wt (DGP269), gat1-1 (DGP270), and gat1-3 (DGP271) do not run as a single band, but are characterized by a reproducible fragmentation pattern when run on an SDS-PAGE gel. The DNA binding domain for another GATA-factor, GLN3, was cloned and purified as a positive control. Cell lysate and bovine serum albumin (BSA) were run as controls.
Additional files
-
Supplementary file 1
(A) SNPs identified in each LTEE. Variants identified in each LTEE at four different time points throughout the evolution experiments and present at an allele frequency of at least 1% are listed. (B) Global gene expression analysis. Mean expression values for each gene for three GAT1 variants relative to the ancestral genotype as determined by RNAseq are presented as log2 values along with an estimate of statistical significance. Gene expression of lineages and the population studied in (Hong and Gresham, 2014) are shown for reference. (C) Quantification of promoter activity using transcriptional reporters. The median fluorescence for each transcriptional reporter in each of the four GAT1 genotypes relative to the ancestral strain was determined in different conditions. (D) Quantification of transcription factors binding affinity. Parameters estimated from fitting a Michaelis-Menten function to EMSA data. Fr_max is the maximal of bound over total DNA. K_x is the concentration of protein required for half-maximal binding. Non-significant parameter values are in grey italics. (E) Strains used in this study. (F) Plasmids used in this study.
- https://doi.org/10.7554/eLife.32323.012
-
Supplementary file 2
(A) Determination of GAT1 variants binding specificities by Protein Binding Microarray. Each purified protein was assayed on two different microarrays containing different probe sequences (ME or HK). E-scores for the top 8-mer bound by the protein on each microarray were calculated. A PWM was generated for each protein variant based on an alignment of the top ten 8-mers. (B) GAT1 protein fragment sequences used in PBM and EMSA assays. The DNA binding domain is in blue. Flanking sequences included in the expressed protein fragment are in green. (C) Oligonucleotides used to generate duplex DNA for EMSAs. Bold and underlined sequences are GATA sequences bound by GAT1. The minimum match score was set as 0.8 using ‘matchPWM()’ function in ‘Biostrings’ library in R. Negative motifs differ from target motifs only at the underline GATA by replacement with random sequence.
- https://doi.org/10.7554/eLife.32323.013
-
Transparent reporting form
- https://doi.org/10.7554/eLife.32323.014
Download links
A two-part list of links to download the article, or parts of the article, in various formats.
Downloads (link to download the article as PDF)
Open citations (links to open the citations from this article in various online reference manager services)
Cite this article (links to download the citations from this article in formats compatible with various reference manager tools)
An incoherent feedforward loop facilitates adaptive tuning of gene expression
eLife 7:e32323.
https://doi.org/10.7554/eLife.32323


