Two-photon imaging in mice shows striosomes and matrix have overlapping but differential reinforcement-related responses
- Massachusetts Institute of Technology, United States
Figures
Figure 1 with 1 supplement
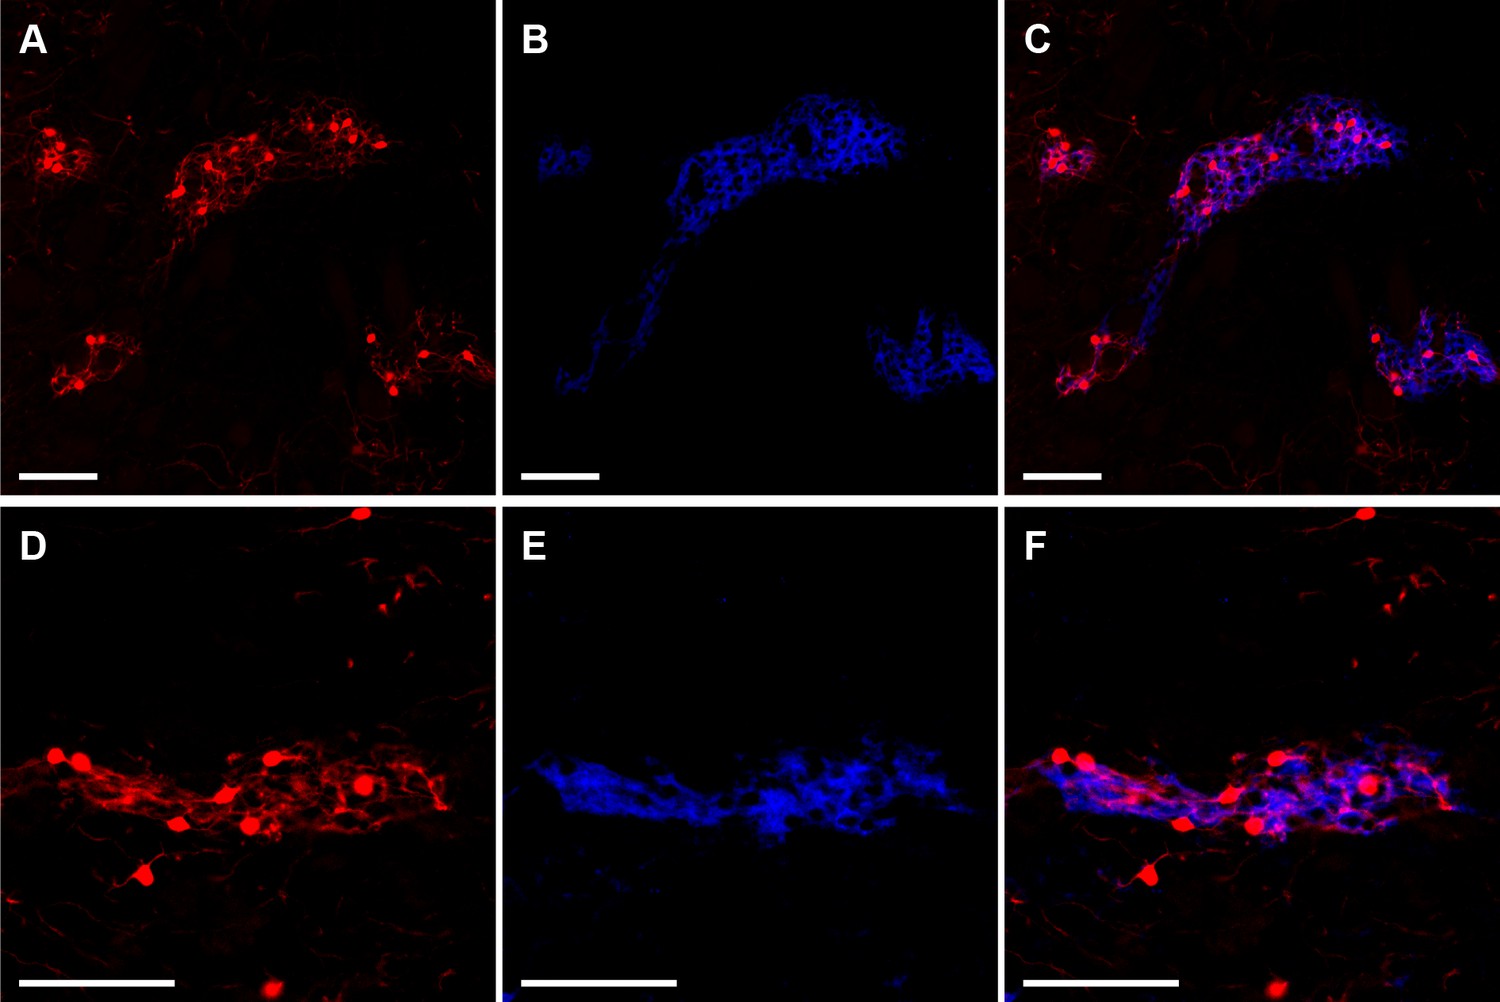
Striosomes are labeled with tdTomato in Mash1-CreER;Ai14 mice that received tamoxifen at E11.5.
Images illustrate two examples (rows) of striosomal labeling of cell bodies and neuropil by tdTomato (A,D, red) as verified by MOR1 immunostaining identifying striosomes (B,E, blue). Merged images show overlap of tdTomato and MOR1 labeling (C,F). Scale bars indicate 100 µm.
Figure 1—figure supplement 1
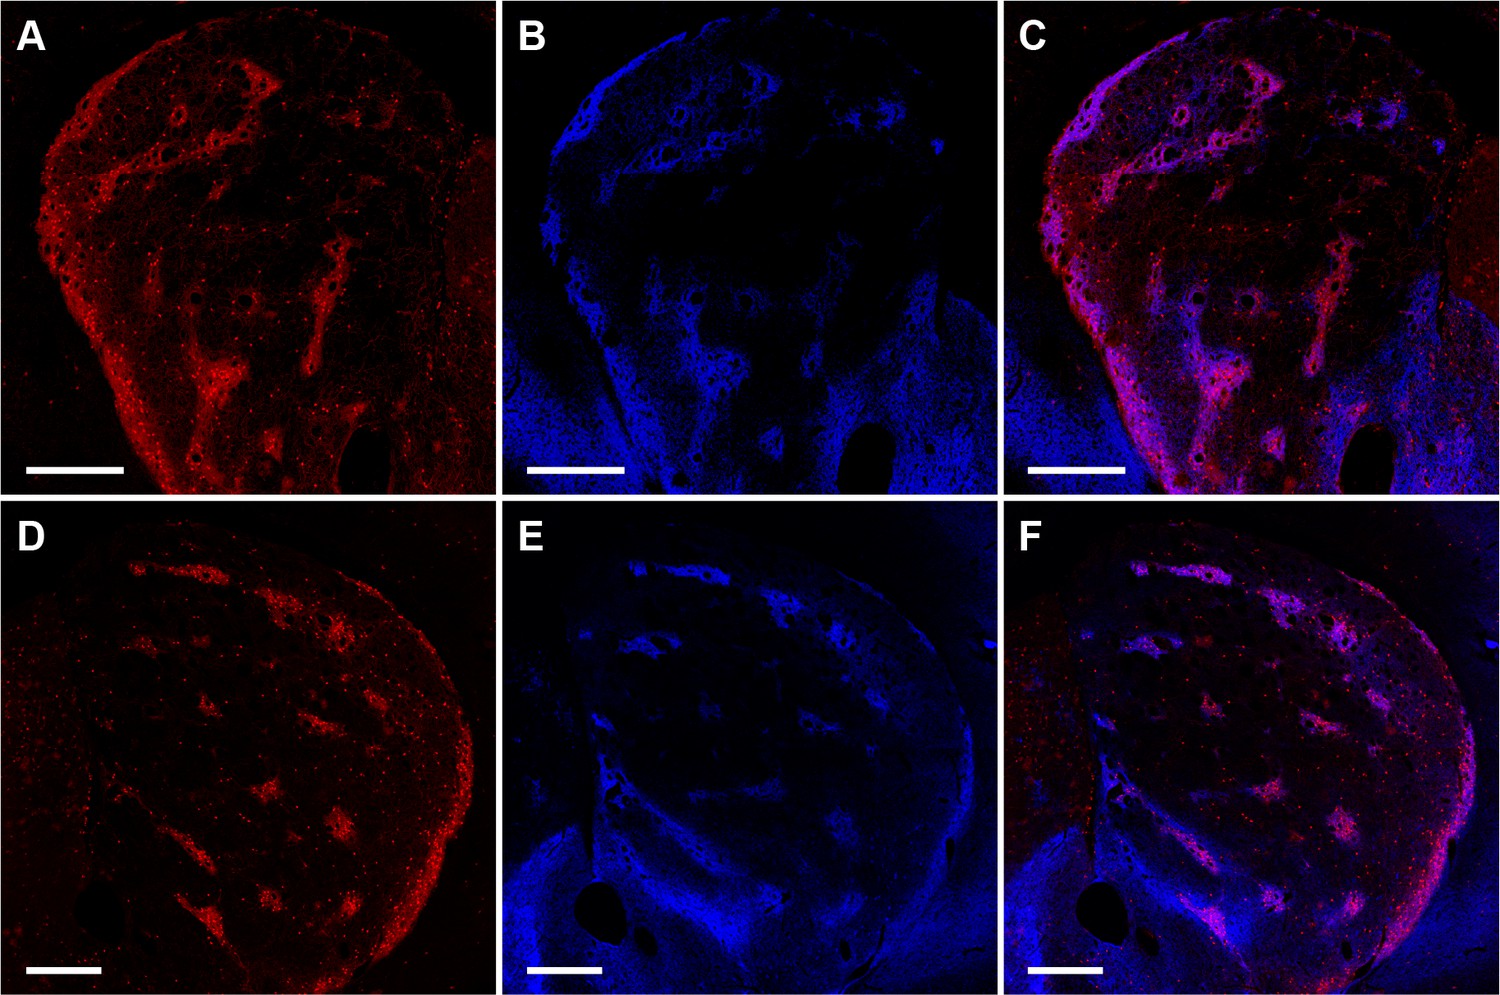
Striosome labeling in Mash1-CreER;Ai14 mice injected with tamoxifen at E11.5.
Low-magnification images show tdTomato labeling in striosomes (A,D, red), striosomes detected in sections immunostained for MOR1 (B,E, blue), and overlap of the tdTomato and MOR1 signals (C,F). Scale bars indicate 500 µm.
Figure 2
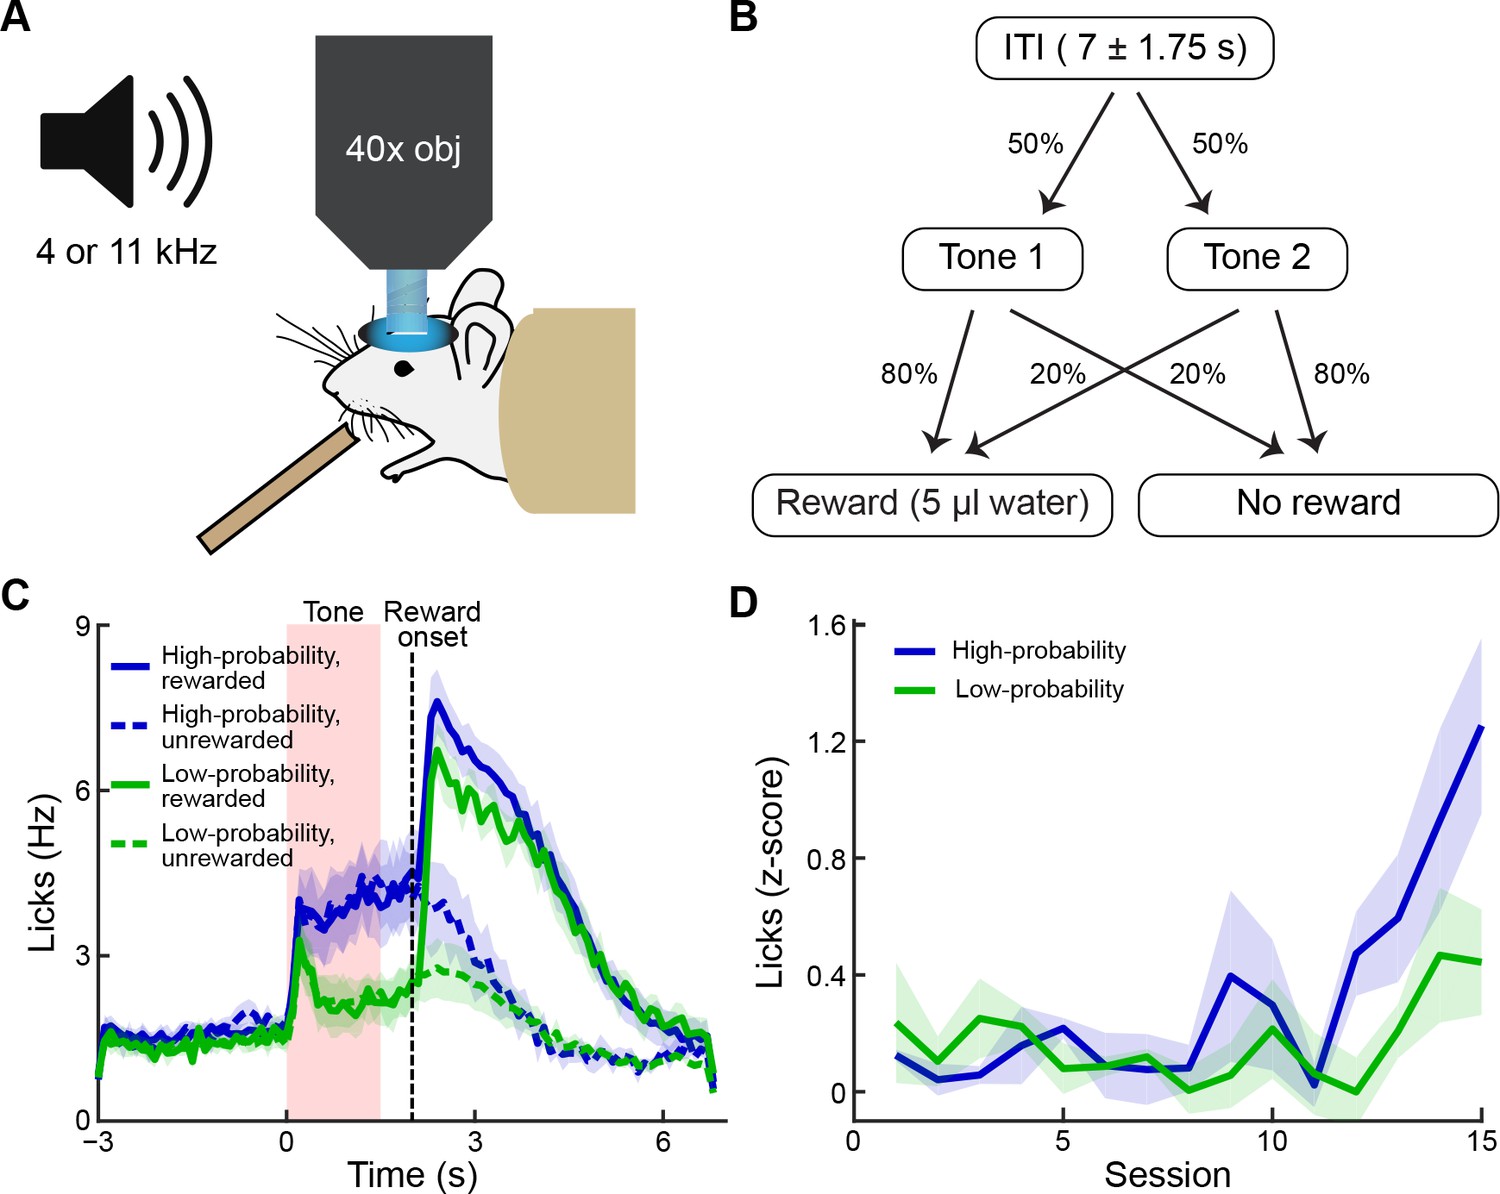
Behavioral task and performance.
(A) The striatum was imaged during conditioning sessions in which tones predicted reward delivery. (B) Two tones (4 and 11 kHz) were played (1.5 s duration) and were associated with distinct reward probabilities (80% or 20%). After a 0.5 s delay, reward could be delivered. Inter-trial interval durations varied from 5.25 to 8.75 s. (C) Frequency of licking after training, averaged over five mice (±SEM). Anticipatory licking was significantly higher during the presentation of the high-probability tone (blue) than during the presentation of the low-probability tone (green). After reward delivery, licking rates were elevated for several seconds (solid lines: rewarded trials; dotted lines: unrewarded trials). (D) Licking during the tone and reward delay, shown as z-scores calculated relative to the 2 s baseline period preceding the tone, during training sessions (average of 3 mice). Mice began to exhibit differences in levels of anticipatory licking between the two cues after 11–12 sessions. Animals were considered to be trained when they exhibited significantly higher anticipatory licking during the high-probability tone (blue) than during the low-probability tone (green) in 2 out of 3 consecutive sessions. Shading represents SEM.
Figure 3
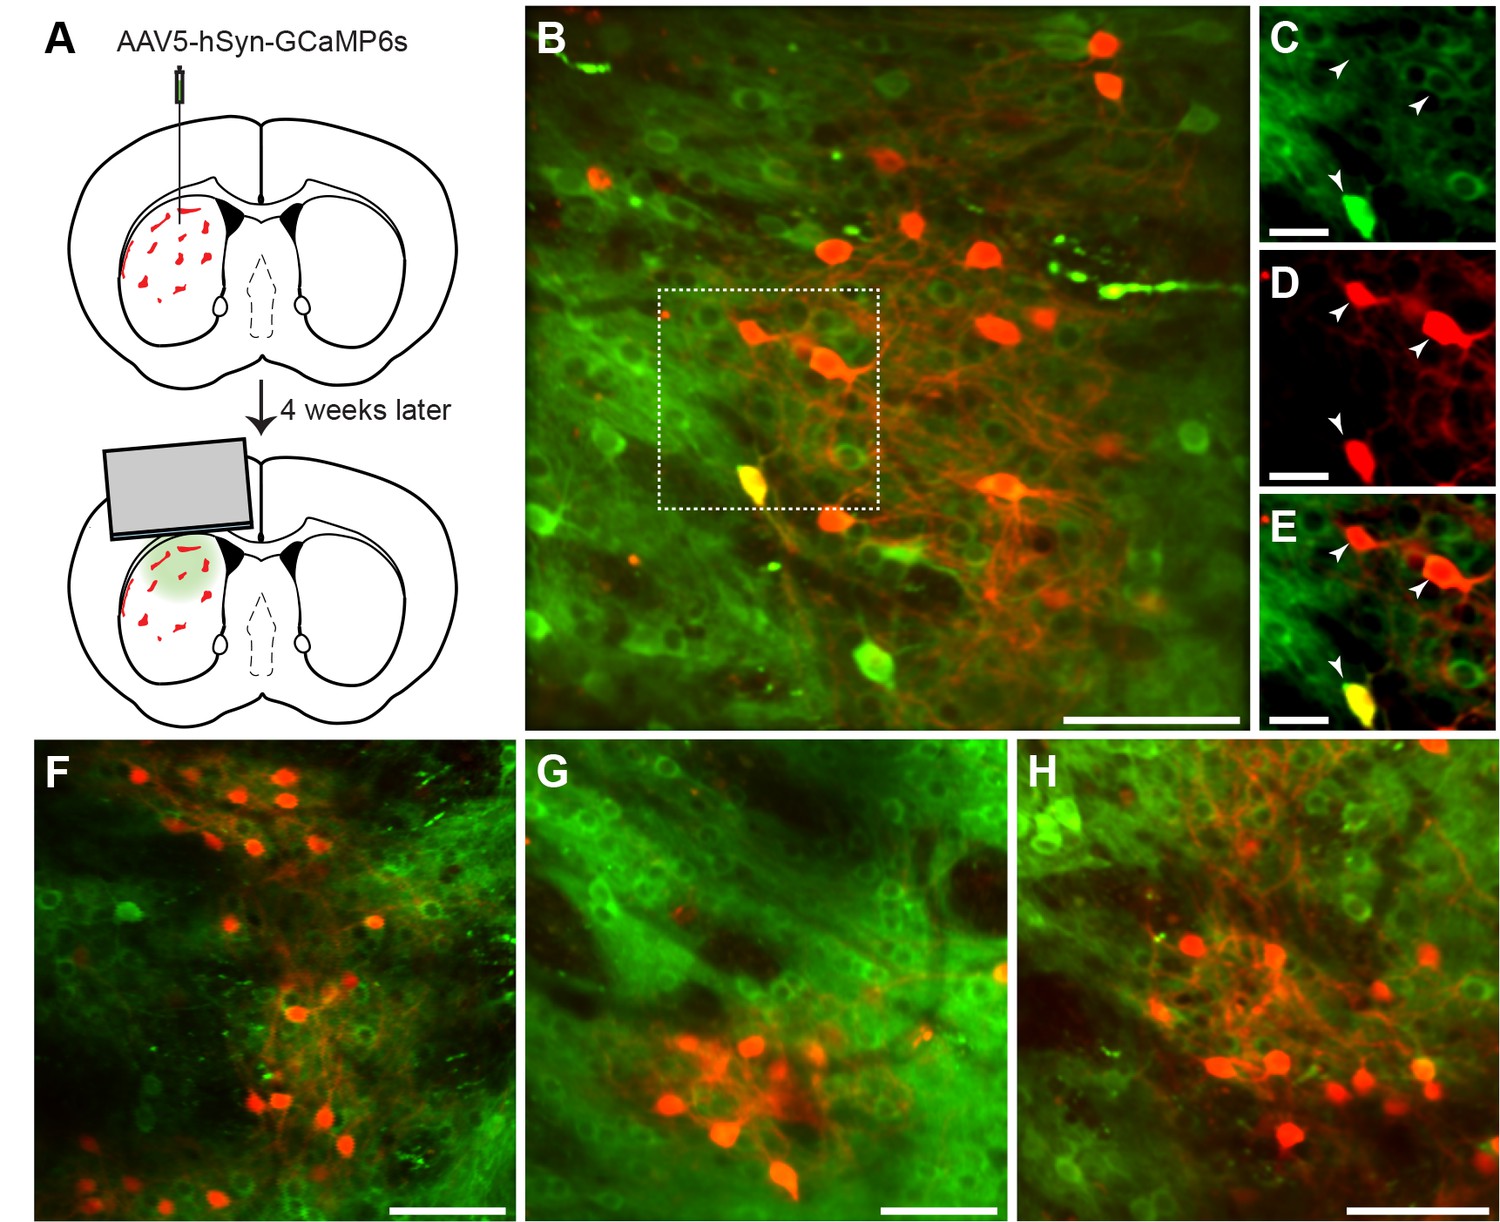
In vivo 2-photon calcium imaging of identified striosomes and matrix.
(A) Mash1-CreER;Ai14 mice were injected with AAV5-hSyn-GCaMP6s and 4 weeks later were implanted with a cannula. (B) Image of a striosome acquired with the 2-photon microscope, illustrating tdTomato labeling in red and GCaMP in green (scale bar: 100 µm) in the striatum of a trained mouse. (C–E) Higher magnification images of the region indicated in B (scale bar: 10 µm), shown for individual green (C), red (D) and merged (E) channels. Arrowheads indicate double-labeled cells. (F–H) Representative examples of striosomes imaged in three other trained mice (scale bars: 100 µm).
Figure 4 with 1 supplement
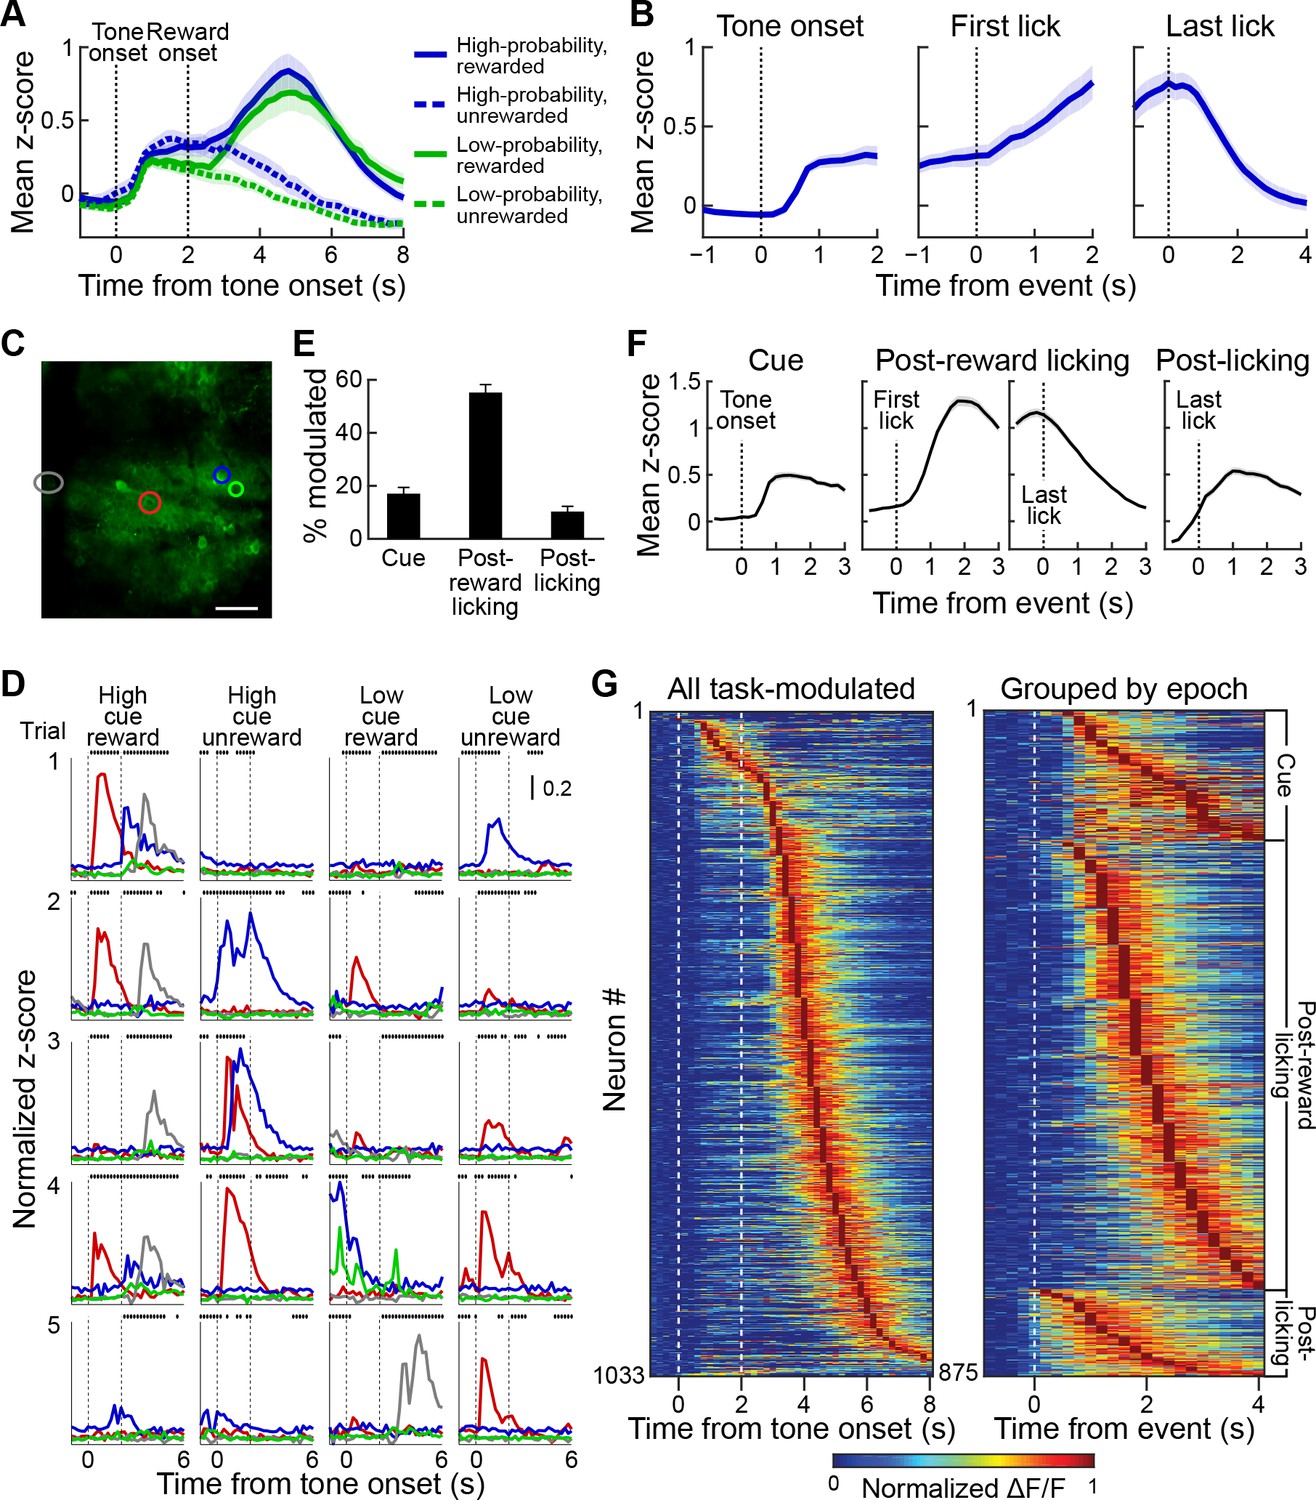
Striatal activity during reward-predicting cues and during post-reward period.
(A) Aggregate neuropil calcium signal in all four trial types (blue: high-probability cue; green: low-probability cue; solid line: rewarded trials; dotted line: unrewarded trials). Shading represents SEM. (B) Neuropil activation aligned to tone onset (left), first lick after reward delivery (middle) and last lick (right). Only rewarded trials with high-probability cues are included. (C, D) Responses of the neurons (D) color-coded in C during five sample trials (rows) for four different cue-outcome conditions (columns). Dotted lines indicate the tone and reward onsets. Scale bar in C represents 100 µm. Lines above each plot show when licks occurred. (E) Percentage of task-modulated neurons that were selectively active during cue, post-reward licking, or post-licking epochs of the task. Error bars represent 95% confidence intervals. (F) Population-averaged responses of task-modulated neurons selectively active during the three epochs. Data for neurons active during the post-reward licking period are separately shown aligned to the first and the last lick. (G) Session-averaged activity of all task-modulated neurons (left) and those that were significantly active during only one of three task epochs (right). Neurons were sorted by the timing of their peak activity.
Figure 4—figure supplement 1
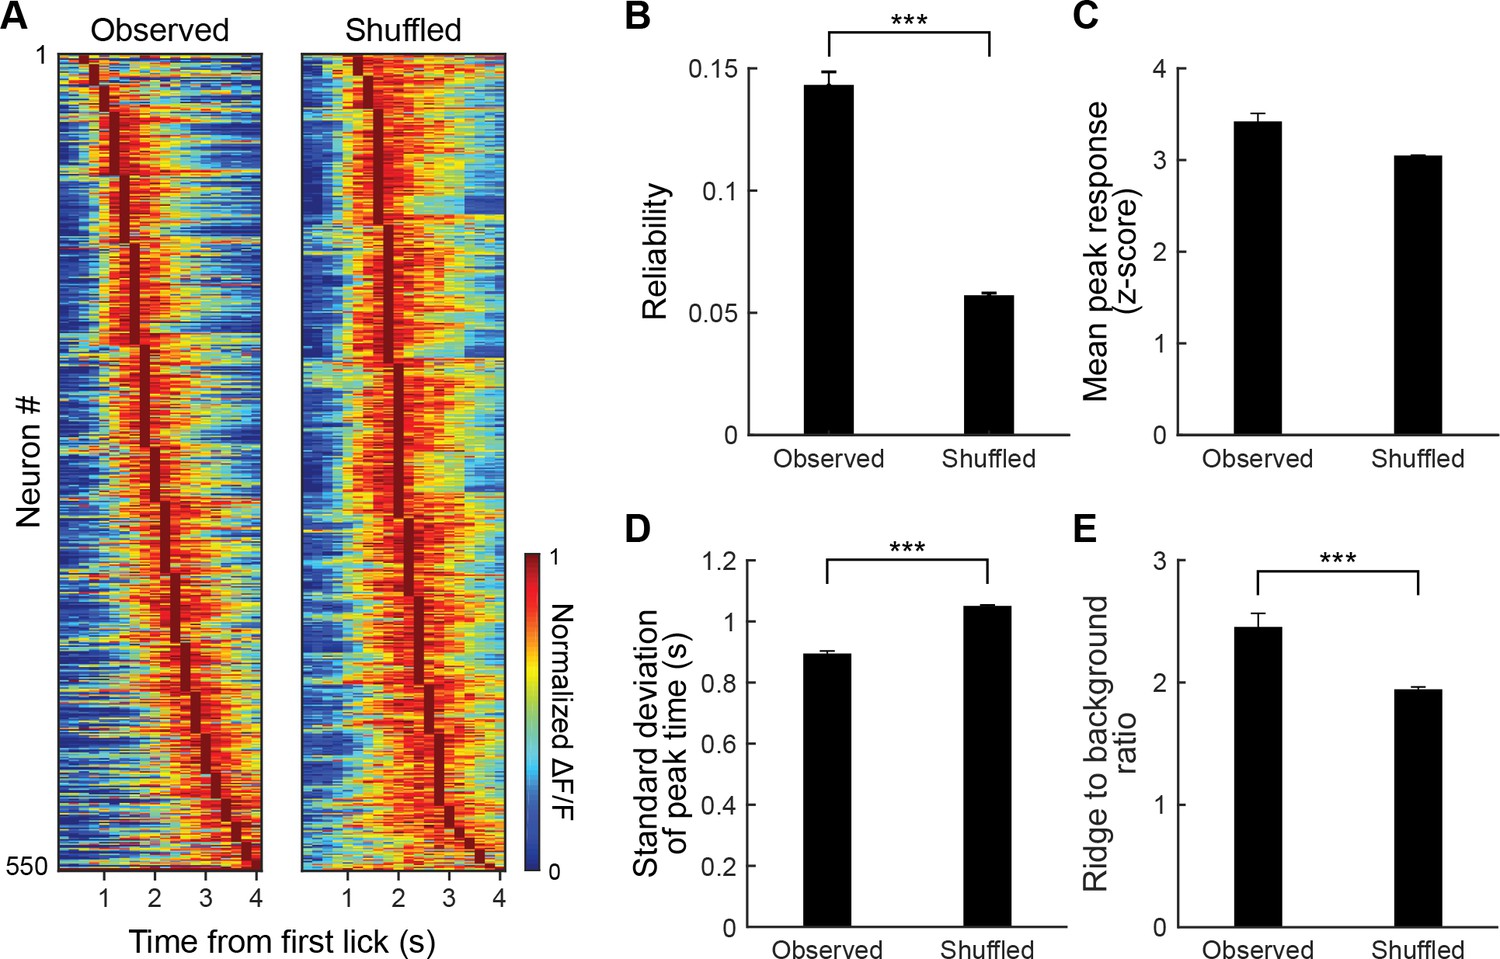
Temporal specificity of post-reward licking responses.
(A) Session-averaged post-reward licking responses for observed (left) and shuffled (right) data. Data were shuffled for each neuron by substituting responses in a given trial with response in the same trial from a randomly picked task-modulated neuron recorded simultaneously. Each row is a single neuron. Responses were sorted based on the timing of the peak response for observed and shuffled data separately. (B) Quantification of trial-to-trial response reliability, calculated as the average correlation for all pairwise combinations of trials. (C) The observed decrease in response reliability with shuffling is unlikely due to changes in response amplitude because the shuffling procedure does not affect the mean amplitude of the peak responses. (D) Standard deviation of peak times for observed and shuffled data. (E) Ridge-to-background ratio for the color maps shown in A. The ridge was defined as five data points (1 s) surrounding the peak response, and background as all other data points. ***p<0.001.
Figure 5 with 1 supplement
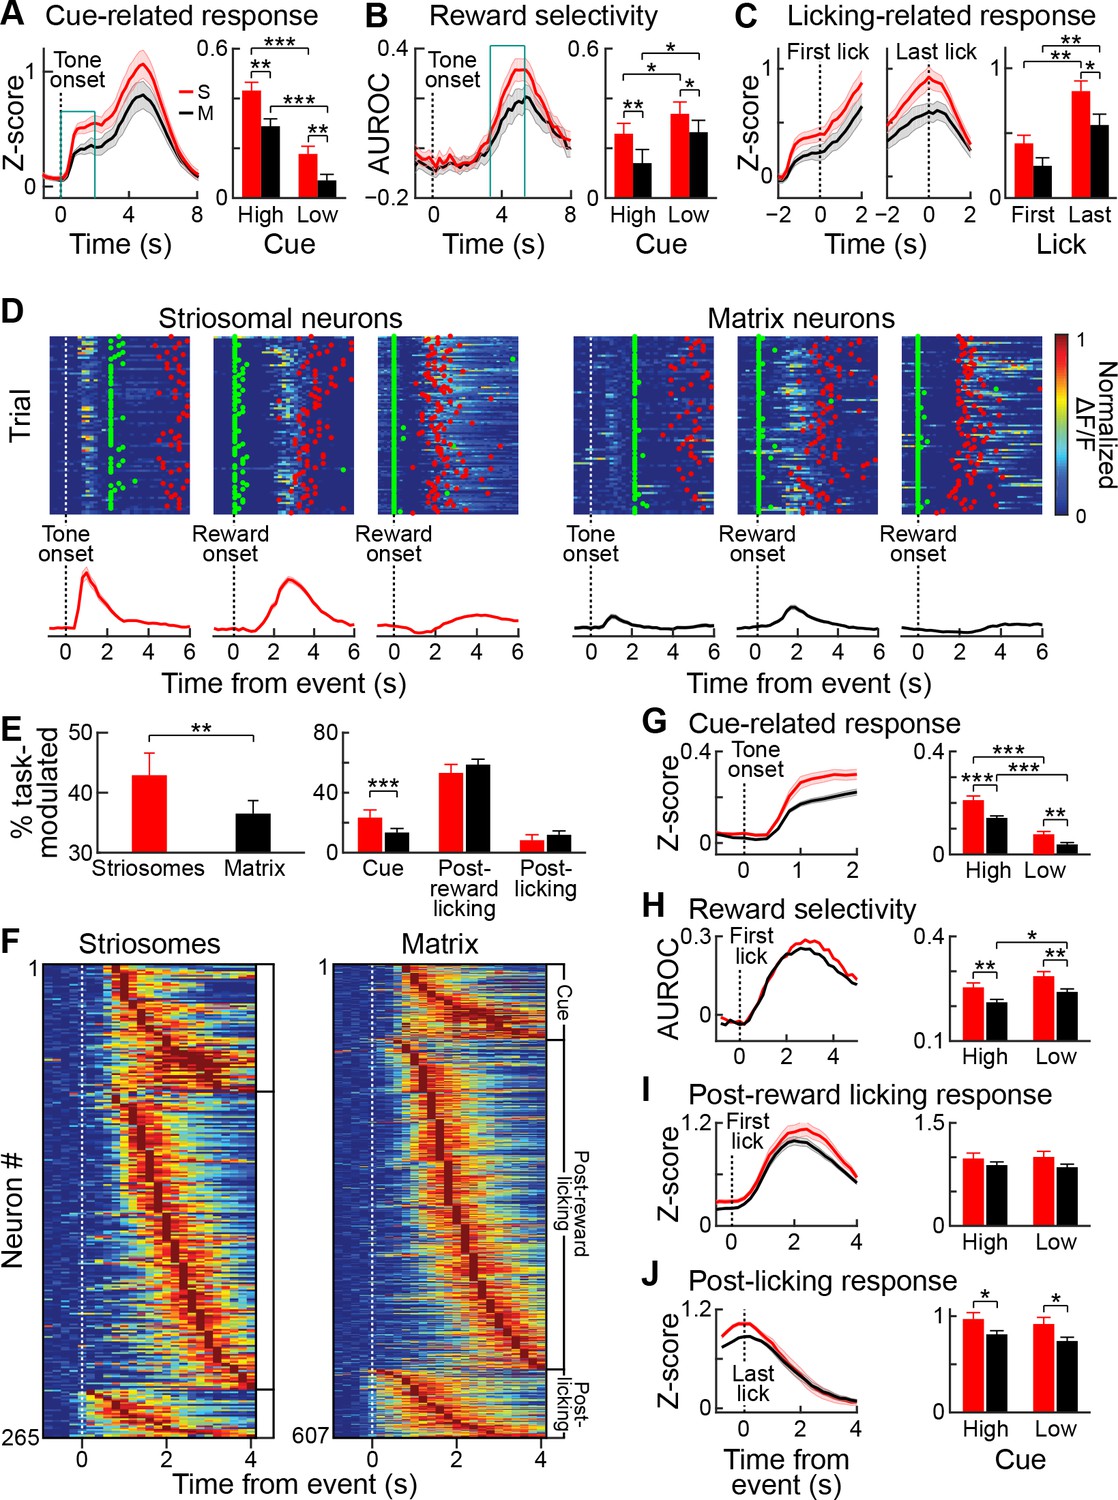
Striosomal neurons respond more strongly to reward predicting cues than matrix neurons.
(A) Average striosomal (S, red) and matrix (M, black) neuropil activation during rewarded trials with high-probability cue (left), and quantification of the magnitude of the response to high- and low-probability cues (right), calculated for the time period indicated by blue box (left). **p<0.01, ***p<0.001 (ANOVA and post hoc t-test). Shading and error bars represent SEM. (B) Neuropil selectivity for the rewarded vs. unrewarded trials for every time point in the trials in high-probability trials (left) and the average selectivity during the time indicated in the blue box (left) for both trial types (right). (C) Average neuropil post-reward activity aligned to the first (left) or last lick (middle), and average response during the ±1 s period (right). *p<0.05, **p<0.01 (ANOVA and post hoc t-test). (D) Trial-by-trial response of three striosomal (left block) and three matrix (right block) neurons that were selectively active during the cue (left), post-reward licking (middle), or end of licking (right) task-epochs. Green and red dots show, respectively, the first lick after reward delivery and the last lick. Average responses for the same neurons are shown underneath the color plots. (E) Proportion of all task-modulated striosomal and matrix neurons (left) and those that were modulated selectively during cue, post-reward licking, or post-licking epochs of the task (right). **p<0.01, ***p<0.001 (Fisher’s exact test). Error bars represent 95% confidence intervals. (F) Session-averaged responses of all task-modulated striosomal (left) and matrix (right) neurons, plotted on the color scale shown in D. Neurons are grouped and sorted as were those shown in Figure 4G. (G) Population-averaged responses of all task-modulated striosomal and matrix neurons to the high-probability cue (left), and the population responses separately averaged for high- and low-probability cues (right). **p<0.01, ***p<0.001 (ANOVA and post hoc t-test). Shading and error bars represent SEM. (H) Discriminability between rewarded and unrewarded trials for striosomal and matrix neurons. Left plot shows selectivity during trials with high-probability cue, and right plot shows average discriminability for all trials (quantified over 1–2 s time window after reward delivery). *p<0.05, **p<0.01 (ANOVA and post hoc t-test). (I,J) Population-averaged response during post-reward licking (I) or post-licking (J) periods, with data aligned, respectively, to first and last lick after reward delivery. *p<0.05 (ANOVA and post hoc t-test).
Figure 5—figure supplement 1
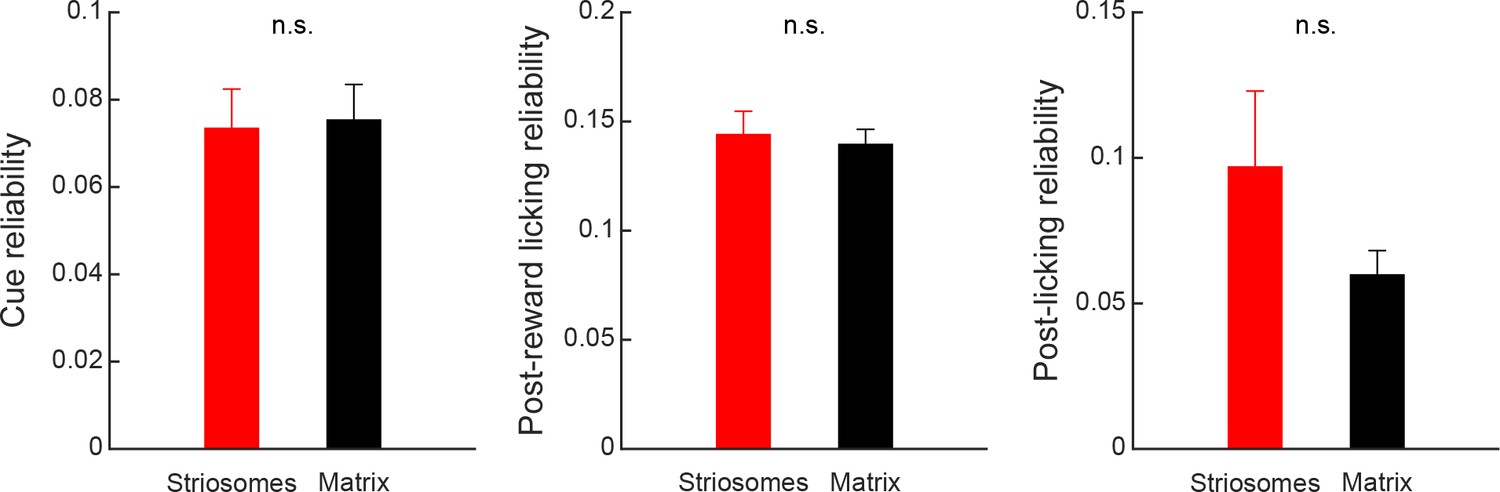
Response reliability of task-related responses of striosomal (red) and matrix (black) neurons.
Reliability of responses during the cue (left), post-reward licking (middle), or post-licking (right) task epochs for striosomal and matrix neurons was quantified as the average correlation for all pairwise combinations of trials. Only neurons that were task-modulated during these epochs were included in the analysis.
Figure 6

Cue-related signals in striosomes develop during training.
(A) Average total striosomal (red) and matrix (black) neuropil signal during the 1.5 s tone period in all sessions before and after reaching learning criterion. *p<0.05, ***p<0.001 (ANOVA and post hoc t-test). Error bars represent SEM. (B, C) Percentage of task-modulated (B) and cue-modulated (C) neurons in striosomes and matrix during the course of training. Shading represents SEM. (D) Mean normalized (z-score) licking (left) and ΔF/F activity in task-modulated striosomal and matrix neurons (right) during ±5 sessions around the session in which the learning criterion was reached (session 0). (E) Activity of task-modulated striosomal and matrix neurons averaged and normalized for blocks of 5 sessions before (dotted lines) and after (solid lines) the learning criterion was reached. (F) Quantification of the mean response of all task-modulated neurons during the period from tone onset to reward onset. **p<0.01 (ANOVA and post hoc t-test). (G) Percentage of neurons modulated in the licking period during training. (H) Mean normalized (z-score) licking (left) and activity of task-modulated neurons (right) during training around the time of reward delivery (R).
Figure 7 with 1 supplement

Striosomal cue-related responses strengthen during overtraining and become more selective.
(A) Mean neuropil signals during acquisition (light blue), after learning criterion (medium blue) and during overtraining (dark blue) in striosomes (top) and matrix (bottom). Shading represents SEM. (B) Average licking (top) and neuronal activity in striosomes (middle) and matrix (bottom) in rewarded trials with high- (blue) and low- (green) probability cues. (C) Mean neuropil responses in striosomes (red) and matrix (black) during acquisition, after criterial performance and during overtraining, and the mean of the response sizes (right). *p<0.05, **p<0.01 (ANOVA). Shading and error bars represent SEM. (D) Selectivity for the high-probability cue, shown as in B. *p<0.05, **p<0.01 (ANOVA). (E) Percentages, shown in panels from left to right, of task-modulated neurons (left), tone-modulated neurons (second), neurons modulated in post-reward licking period (third) and neurons modulated in post-licking period (right) during acquisition (ACQ), after criterion (CR) and during overtraining (OT). *p<0.05, **p<0.01, ***p<0.001 (Fisher’s exact test).
Figure 7—figure supplement 1
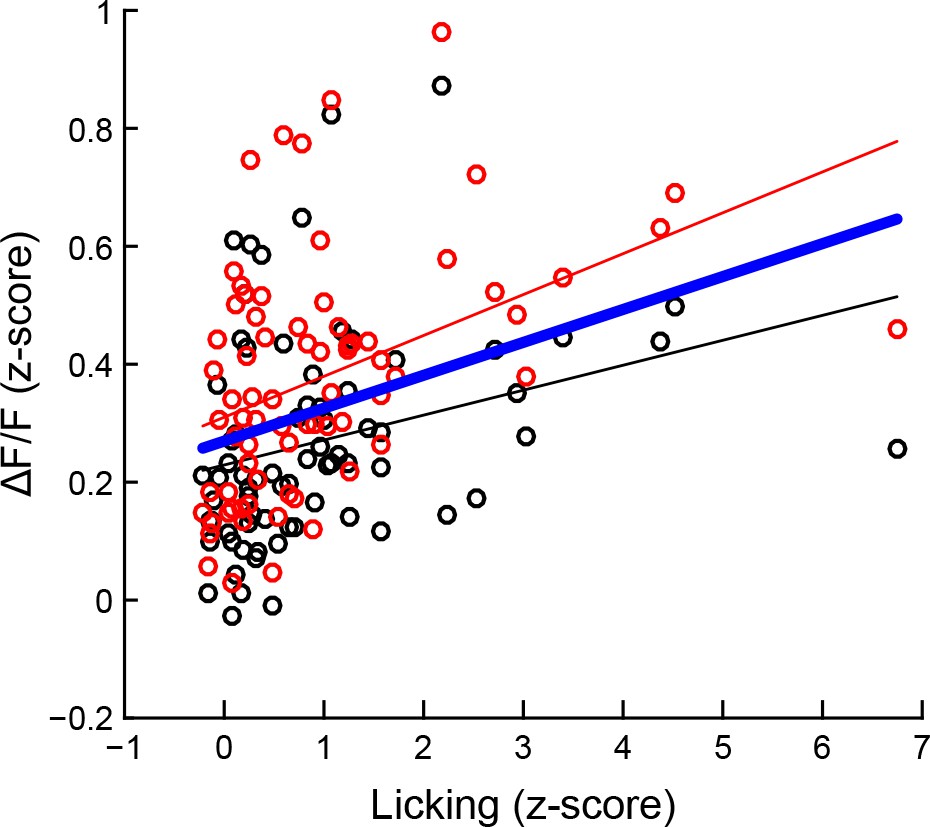
The size of tone-evoked ΔF/F activation increases as behavioral performance improves, particularly as seen in the calcium activity in striosomes.
High-probability cues induced increases in licking and ΔF/F signal for striosomes (red circles) and matrix (black circles) for every session. The thin red and black lines indicate the outcome of the linear regression analyses, respectively, for striosomes and matrix. The bold blue line indicates the combined model.
Figure 8
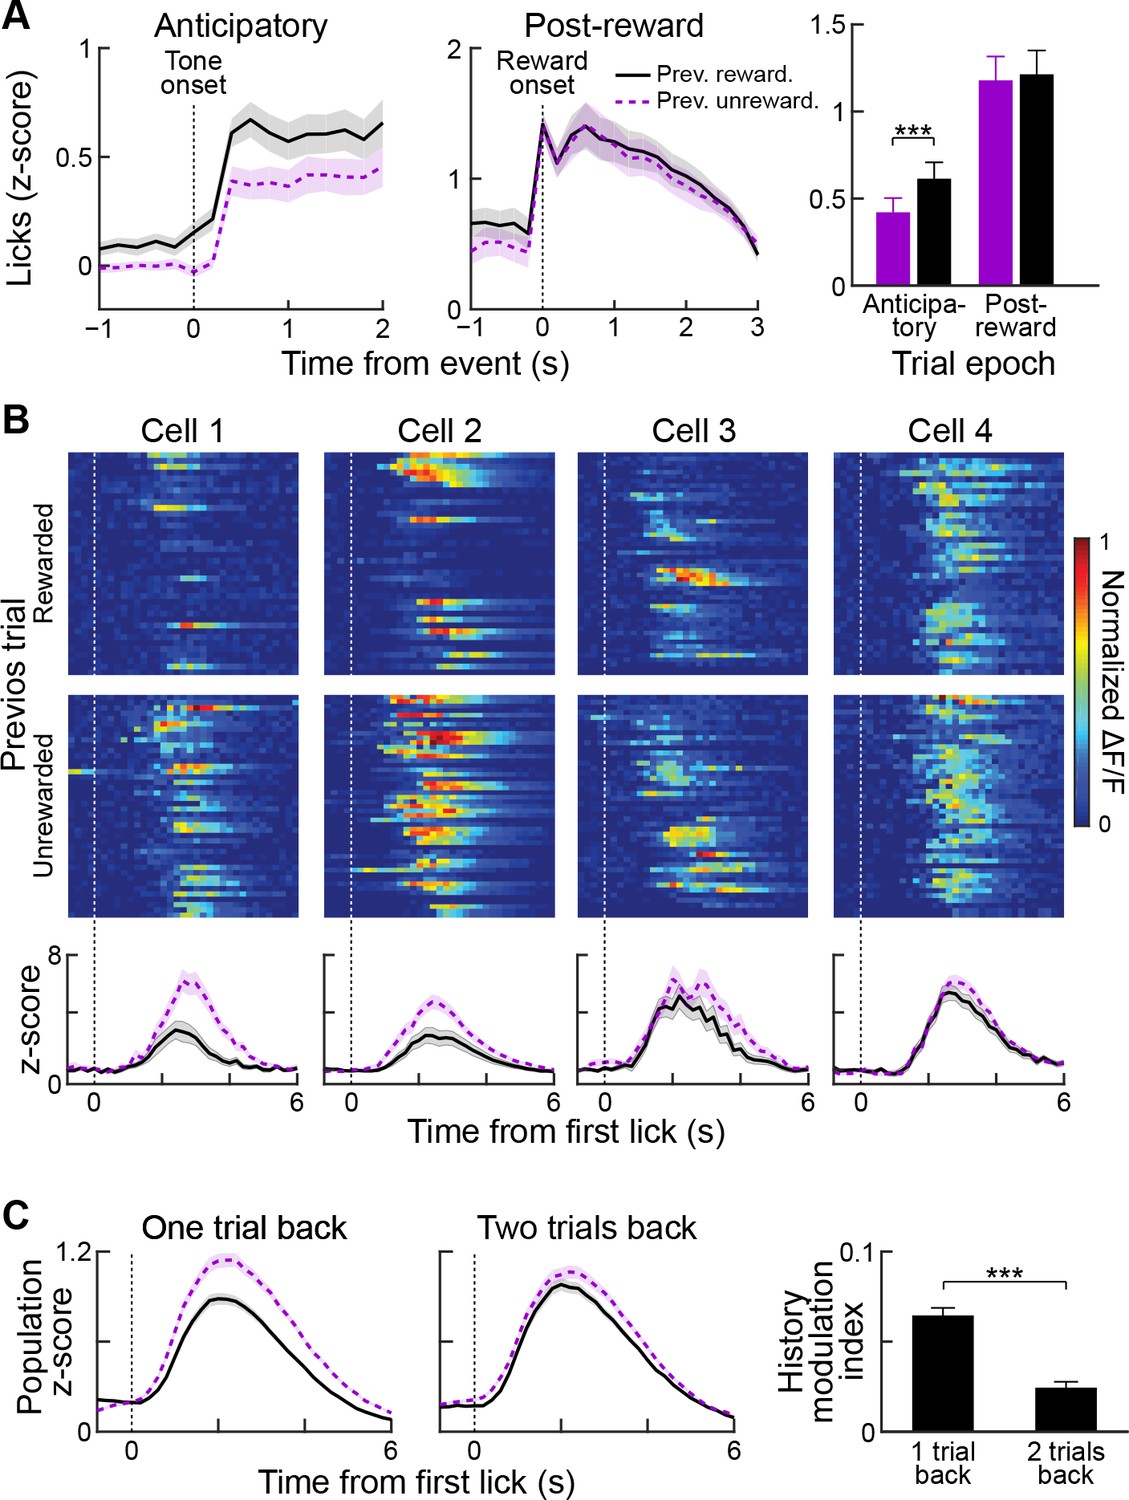
Reward history modulates anticipatory licking behavior and licking-period responses in striatal neurons.
(A) Session-averaged licking activity during anticipatory and post-reward periods for trials in which the previous trial was rewarded (black solid lines) or unrewarded (purple dotted lines). Bar plot (right) shows modulation of anticipatory or post-reward licking activity by reward history. ***p<0.001 (Wilcoxon signed-rank test). Shading and error bars represent SEM. (B) Single-trial (top two rows) and averaged (bottom row) post-reward licking responses of four sample neurons for previously rewarded (black solid) or unrewarded (purple dotted) trials. (C) Population-averaged post-reward licking activity of all task-modulated neurons for reward histories extending one or two trials back. ***p<0.001 (Wilcoxon signed-rank test).
Figure 9
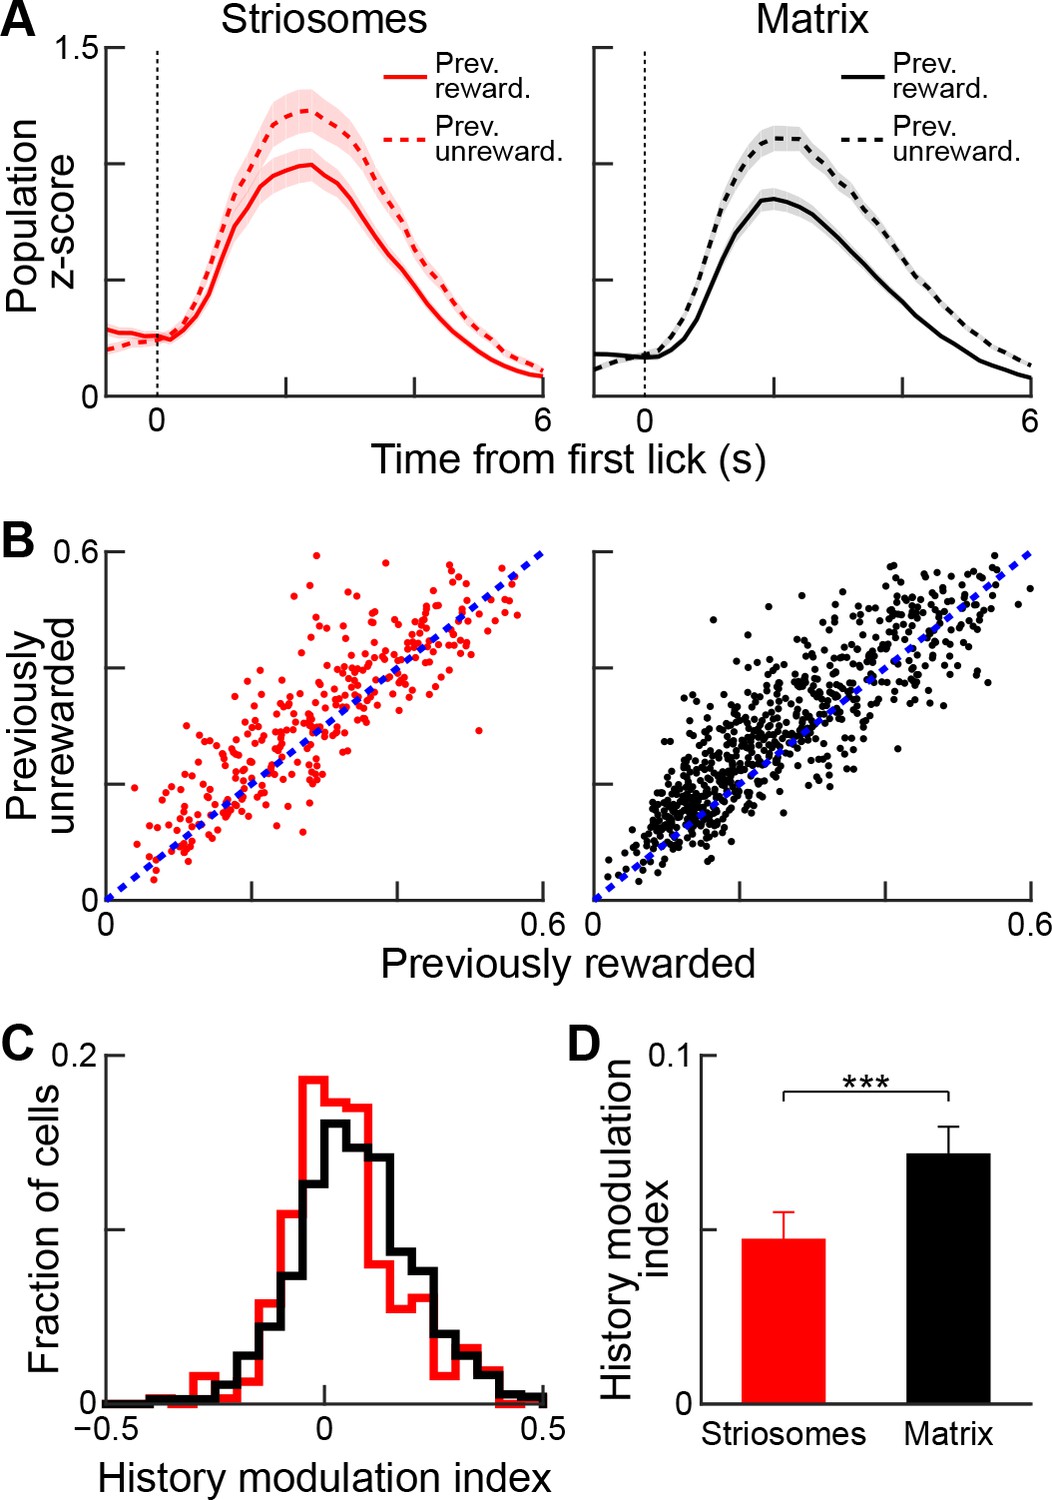
Reward-history modulation of striosomal and matrix neurons.
(A) Population-averaged responses of all task-modulated striosomal (red, left) and matrix (black, right) neurons during trials following previously rewarded (solid) or unrewarded (dotted) trials. Shading represents SEM. (B) Normalized lick-period responses (averaged over 1–3 s after first lick) of individual striosomal (left) and matrix (right) neurons. Responses with previously rewarded trials (x-axis) are plotted against responses from previously unrewarded trials (y-axis). Unity line is shown as blue dotted line (C) Histogram showing reward-history modulation index for all task-modulated striosomal and matrix neurons. (D) Mean reward-history modulation index for striosomal and matrix neurons. ***p<0.001 (Wilcoxon rank-sum test). Error bars represent SEM.
Tables
Table 1
Overlap of striosomes outlined using tdTomato and MOR1.
https://doi.org/10.7554/eLife.32353.004| MOR1 | |||
|---|---|---|---|
| Positive | Negative | ||
| tdTomato | Positive | 14.2%±1.3% | 2.0%±0.3% |
| Negative | 3.7%±0.6% | 80.2%±1.9% | |
-
MOR1 test-retest error rate = 2.4%
tdTomato test-retest error rate = 2.3%
Table 2
Numbers of recorded neurons per mouse.
https://doi.org/10.7554/eLife.32353.007| Mouse | ||||||
|---|---|---|---|---|---|---|
| 1 | 2 | 3 | 4 | 5 | Total | |
| Number of neurons | 587 | 782 | 252 | 426 | 657 | 2704 |
| Striosomal neurons | 218 (37.1 %) | 214 (27.4 %) | 41 (16.3 %) | 77 (18.1 %) | 177 (26.9 %) | 727 (26.9 %) |
| Matrix neurons | 369 (62.9 %) | 568 (72.6 %) | 211 (83.7 %) | 349 (81.9 %) | 480 (73.1 %) | 1977 (73.1 %) |
| tdTomato-positive neurons in striosomes | 33 (5.6 %) | 21 (2.7 %) | 11 (4.4 %) | 13 (3.1 %) | 33 (5.0 %) | 111 (4.1 %) |
| tdTomato-negative neurons in striosomes | 182 (31.0 %) | 191 (24.4 %) | 30 (11.9 %) | 60 (14.1 %) | 134 (20.4 %) | 597 (22.1 %) |
| tdTomato-positive neurons outside of striosomes | 3 (0.5 %) | 2 (0.3 %) | 0 (0.0 %) | 4 (0.9 %) | 10 (1.5 %) | 19 (0.7 %) |
Table 3
Baseline fluorescence and ΔF/F values for striosomal and matrix neurons.
https://doi.org/10.7554/eLife.32353.008| Cell type | ||||
|---|---|---|---|---|
| Striosomal | In striosomal neuropil | tdTomato labeled | Matrix | |
| Baseline fluorescence | 290.0 (8.5) *** | 274.9 (8.1) *** | 337.2 (27.9) | 364.5 (6.8) |
| ΔF/F baseline mean | 11.3 (0.7) | 11.9 (0.7) | 9.3 (1.9) | 11.9 (0.4) |
| ΔF/F baseline standard deviation | 37.2 (1.3) | 38.2 (1.4) | 33.5 (3.5) | 38.5 (0.7) |
| ΔF/F baseline maximum | 250.6 (9.9) | 259.3 (11.2) | 216.2 (22.8) | 255.2 (6.0) |
-
***p<0.001.
Table 4
Data details for individual mice.
https://doi.org/10.7554/eLife.32353.014| Mouse | |||||
|---|---|---|---|---|---|
| 1 | 2 | 3 | 4 | 5 | |
| Number of acquisition sessions | 12 | 11 | 10 | 19 + 2 * | 12 + 4 * |
| Number of criterion sessions | 7 | 9 | 4 | 5 | 8 |
| Number of overtraining sessions | 5 | 5 | 0 | 0 | 0 |
| Mean baseline ΔF/F | 11.2 (0.7) | 10.8 (0.7) | 12.4 (1.4) | 12.1 (1.0) | 12.7 (0.6) |
| Standard deviation baseline ΔF/F | 35.5 (1.3) | 41.3 (1.3) | 30.6 (1.6) | 37.9 (1.7) | 39.8 (1.2) |
| Maximum baseline ΔF/F | 237.2 (9.6) | 296.3 (11.2) | 148.8 (9.3) | 236.1 (13.2) | 270.3 (9.7) |
| Task-modulated neurons in striosomes | 54.1% | 22.4% | 31.7% | 66.2% | 46.3% |
| Task-modulated neurons in matrix | 46.9% | 20.8% | 19.4% | 56.4% | 40.6% |
| Tone-modulated neurons in striosomes | 21.6% | 14.0% | 14.6% | 16.9% | 7.3% |
| Tone-modulated neurons in matrix | 13.0% | 9.2% | 3.3% | 9.5% | 4.4% |
-
*Two mice were initially trained on a more complex version of the task with three tones instead of two (numbers of sessions trained on the two versions indicated by the first and second number, respectively). Data of these mice were excluded from acquisition analyses.
Table 5
Outcome of the regression analyses.
https://doi.org/10.7554/eLife.32353.017| Trial type | ||||
|---|---|---|---|---|
| High-probability cue | Low-probability cue | Difference (high − low) | ||
| Striosome model | Regression coefficient | 0.069 *** | 0.057 | 0.074 ** |
| R-squared | 0.180 | 0.029 | 0.095 | |
| Matrix model | Regression coefficient | 0.042 * | 0.016 | 0.056 |
| R-squared | 0.081 | 0.003 | 0.053 | |
| Combined model | Regression coefficient | 0.056 *** | 0.037 | 0.065 ** |
| R-squared | 0.118 | 0.014 | 0.072 | |
| Residual for striosomes (mean ± SEM) | 0.053 ± 0.021 *** | 0.031 ± 0.021 *** | 0.022 ± 0.023 *** | |
| Residual for matrix (mean ± SEM) | −0.053 ± 0.021 *** | −0.031 ± 0.018 *** | −0.022 ± 0.024 *** |
-
*p<0.05, **p<0.01, ***p<0.001
Key resources table
| Reagent type (species) or resource | Designation | Source or reference | Identifiers | Additional information |
|---|---|---|---|---|
| strain, strain background (mouse,both sexes) | Mash1(Ascl1)-CreER | Jackson Laboratory | Ascl1tm1.1(Cre/ERT2)Jejo/J | Stock no: 12882 |
| strain, strain background (mouse,both sexes) | Ai14 | Jackson Laboratory | B6.Cg-Gt(ROSA)26Sortm14 (CAG-tdTomato)Hze/J | Stock no: 007914 |
| strain, strain background (mouse,both sexes) | C57Bl6/J | Jackson Laboratory | C57BL/6J | Stock no: 000664 |
| genetic reagent | AAV5-hSyn-GCaMP6s-wpre-sv40 | University of Pennsylvania Vector Core) | ||
| antibody | anti-MOR1 | Santa-Cruz | sc-7488 | Polyclonal goat (1:500) |
| antibody | anti-GFP | Abcam | ab13970 | Polyclonal chicken (1:2000) |
| software, algorithm | Matlab | Mathworks | ||
| software, algorithm | Image-J | National Institutes of Health |
Additional files
-
Transparent reporting form
- https://doi.org/10.7554/eLife.32353.020
Download links
A two-part list of links to download the article, or parts of the article, in various formats.
Downloads (link to download the article as PDF)
Open citations (links to open the citations from this article in various online reference manager services)
Cite this article (links to download the citations from this article in formats compatible with various reference manager tools)
Two-photon imaging in mice shows striosomes and matrix have overlapping but differential reinforcement-related responses
eLife 6:e32353.
https://doi.org/10.7554/eLife.32353


