T-cell calcium dynamics visualized in a ratiometric tdTomato-GCaMP6f transgenic reporter mouse
- University of California, United States
Figures
Figure 1
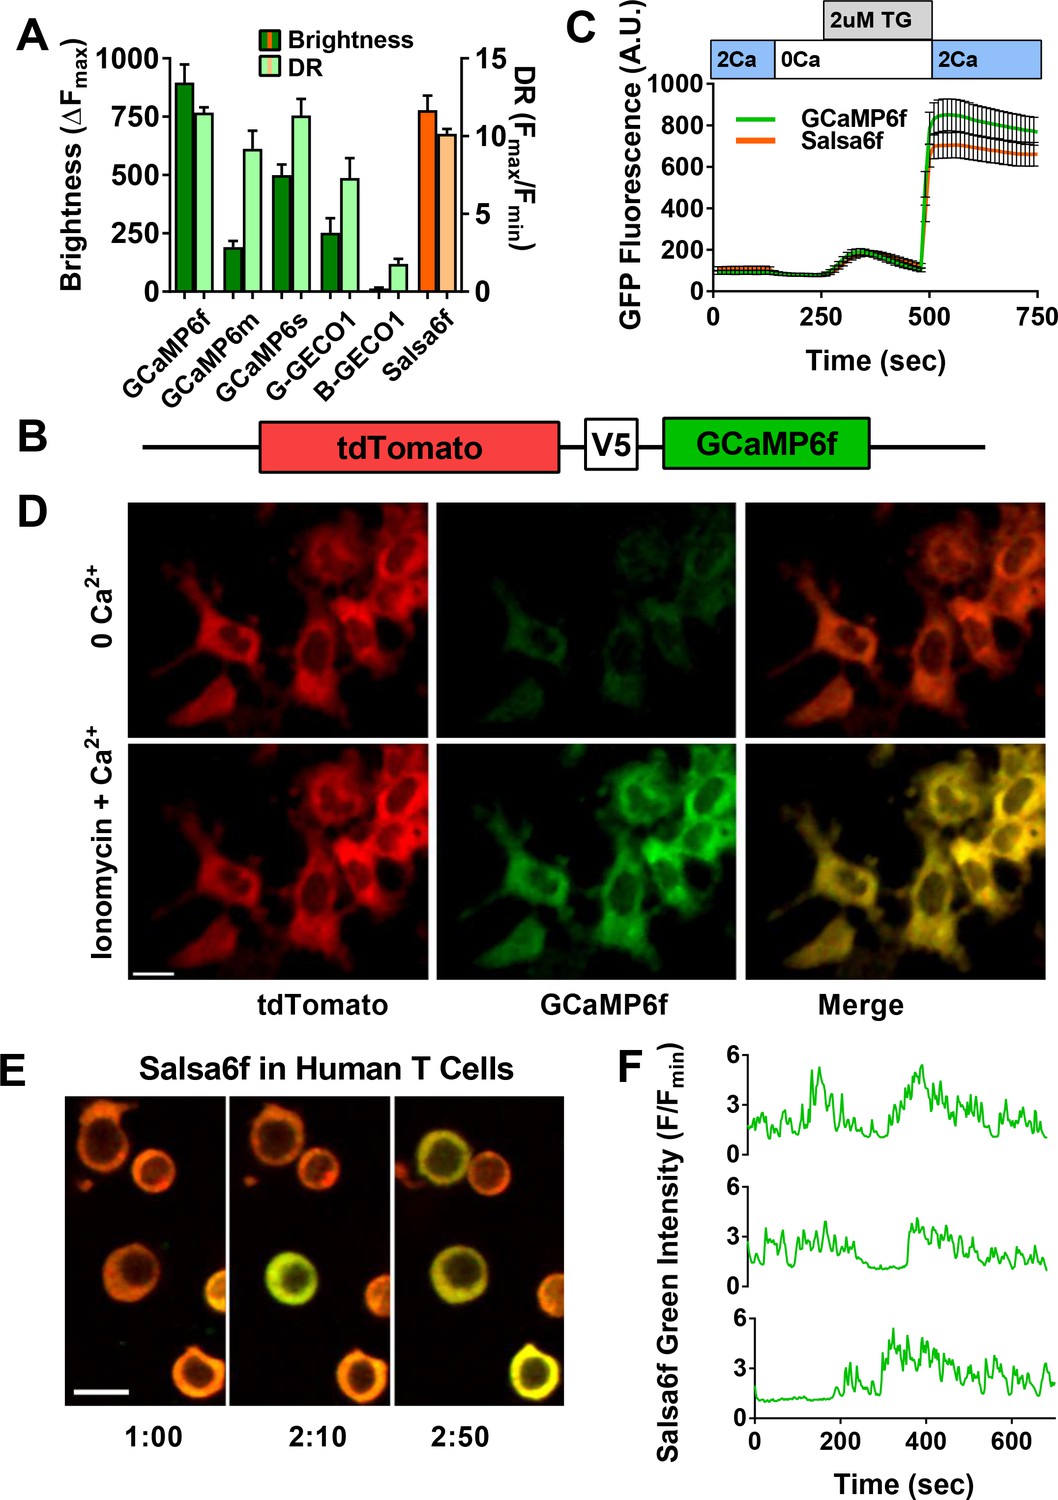
Design of novel tdTomato-V5-GCaMP6f fusion probe ‘Salsa6f’ and characterization in living cells.
(A) Several genetically encoded Ca2+ indicators were screened in vitro in HEK 293A cells, by co-transfecting with Orai1/STIM1 and measuring Ca2+ influx after thapsigargin-induced store depletion. Bars indicate maximum change in fluorescence intensity (dark) and dynamic range (DR: light) with Salsa6f shown in orange bars on right; n > 30 cells per probe, from two different transfections, error bars indicate SEM. (B) Diagram of Salsa6f construct used in transfection. (C) Averaged thapsigargin-induced Ca2+ entry, measured by change in green fluorescence, in GCaMP6f- (green, 11.5 ± 0.3, n = 63) or Salsa6f- (orange, 10.2 ± 0.3, n = 78) transfected HEK cells; data from two different transfections, error bars indicate SEM. (D) Two-photon images of Salsa6f co-transfected in HEK cells with Orai1/STIM1, showing red (tdTomato), green (GCaMP6f), and merged channels, at baseline in 0 mM extracellular Ca2+ (top) and after maximum stimulation with 2 µM ionomycin in 2 mM extracellular Ca2+ (bottom); scale bar = 20 µm; see Video 1; data are representative of at least three different experiments. (E) Confocal time lapse microscopy of human Cd4+ T cells previously transfected with Salsa6f and then activated for 2 days on plate-bound αCd3/28 antibodies; time = min:s, scale bar = 10 µm. (F) Representative traces of green fluorescence intensity from individual activated human T cells transfected with Salsa6f. Data are representative of at least three different experiments.
Figure 2
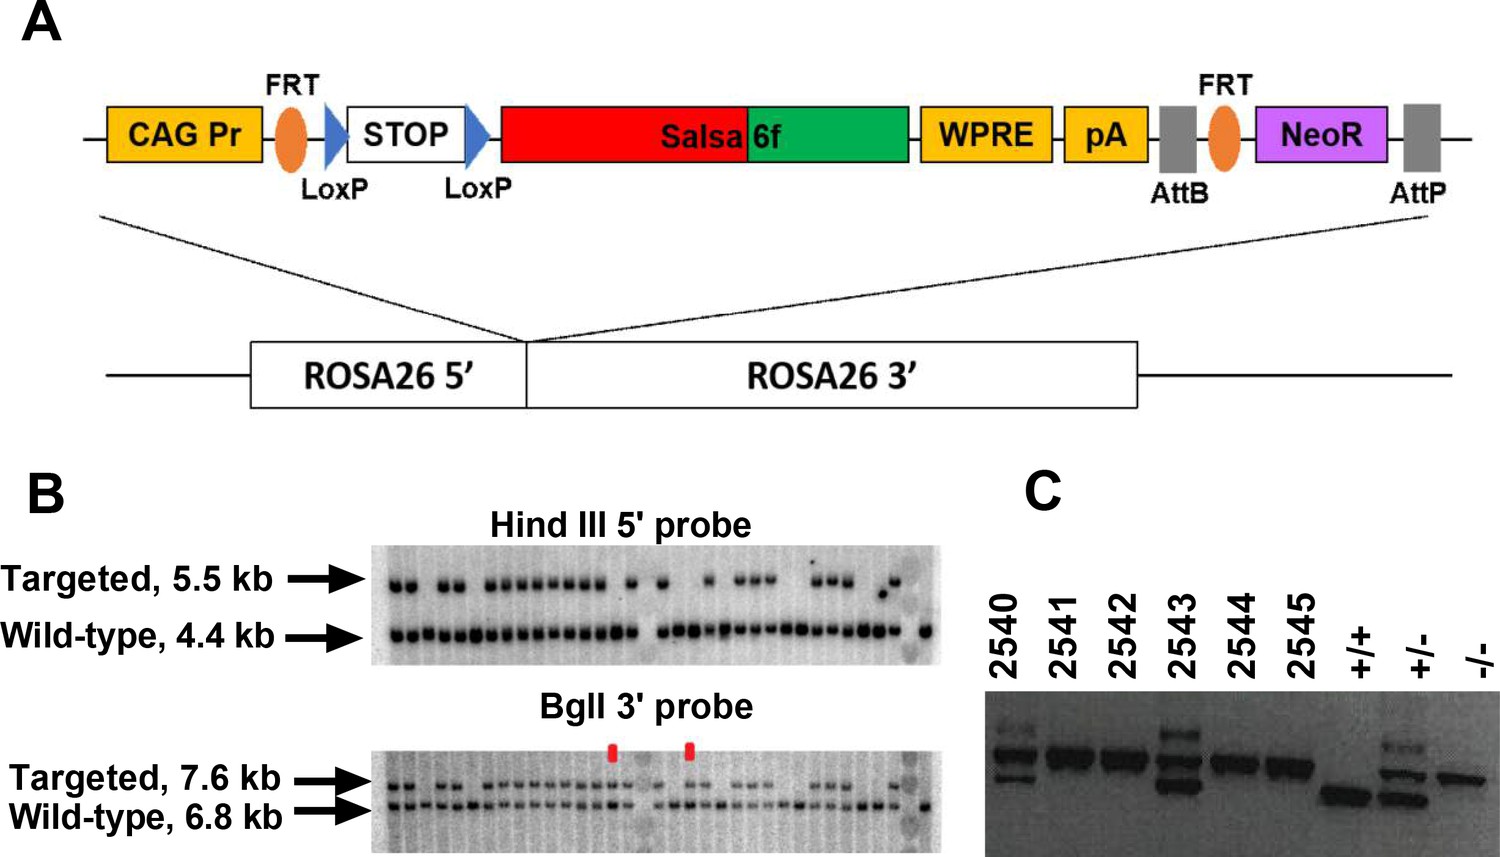
Generation of a Salsa6f transgenic mouse line targeted to the Rosa26 locus.
(A) Transgenic targeting vector for Salsa6f, inserted between Rosa26 homology arms and electroporated into embryonic stem cells. CAG Pr: cytomegalovirus early enhancer/chicken β-actin promoter; Salsa6f: tdTomato-V5-GCaMP6f; FRT, LoxP, AttB, AttP: recombinase sites; WPRE: woodchuck hepatitis virus post-transcriptional regulatory element; pA: bovine growth hormone polyadenylation sequence; NeoR: neomycin resistance gene. (B) Correctly targeted ES cells were screened by Southern blot after HindIII digest for the 5’ end (top) or BglI digest for the 3’ end (bottom). The two clones marked in red failed to integrate at the 5’ end. (C) PCR screening for chimeras based on presence of the Nnt mutation, present only in JM8.N4 ES cells but not in the C57BL/6J blastocyst donors. 2540 and 2543 are chimeras. Control lanes on the right are wild type (Nnt+/+), heterozygous (Nnt+/-), or homozygous mutant (Nnt-/-).
Figure 3

Cd4-Salsa6f mice show normal immune cell development and expression.
(A) Experimental design to target expression of Salsa6f in Cd4 cells. (B) Cd4, Cd8 and double-positive cells gated on tdTomato (Salsa6f+ cells) from thymus. (C) Histograms showing percent of Salsa6f+ cells in spleen, LN, and thymus. (D) Cd4, Cd8, and double positive cells from spleen, gated on tdTomato (Salsa6f+ cells). (E) Histograms showing percent of Salsa6f+ cells within Cd4, Cd8, Cd19, Cd11b populations from spleen. (F) Total number of Cd4, Cd8, Cd19, Cd11b cells in the spleen of Cd4-Salsa6f (Het) mice and Cd4Cre mice (n = 6 mice). (G) Relative percentages of Cd4, Cd8, Cd19, Cd11b cells in thymus, lymph nodes, and spleen of Cd4-Salsa6f mice and Cd4Cre mice (n = 6).
Figure 4 with 1 supplement
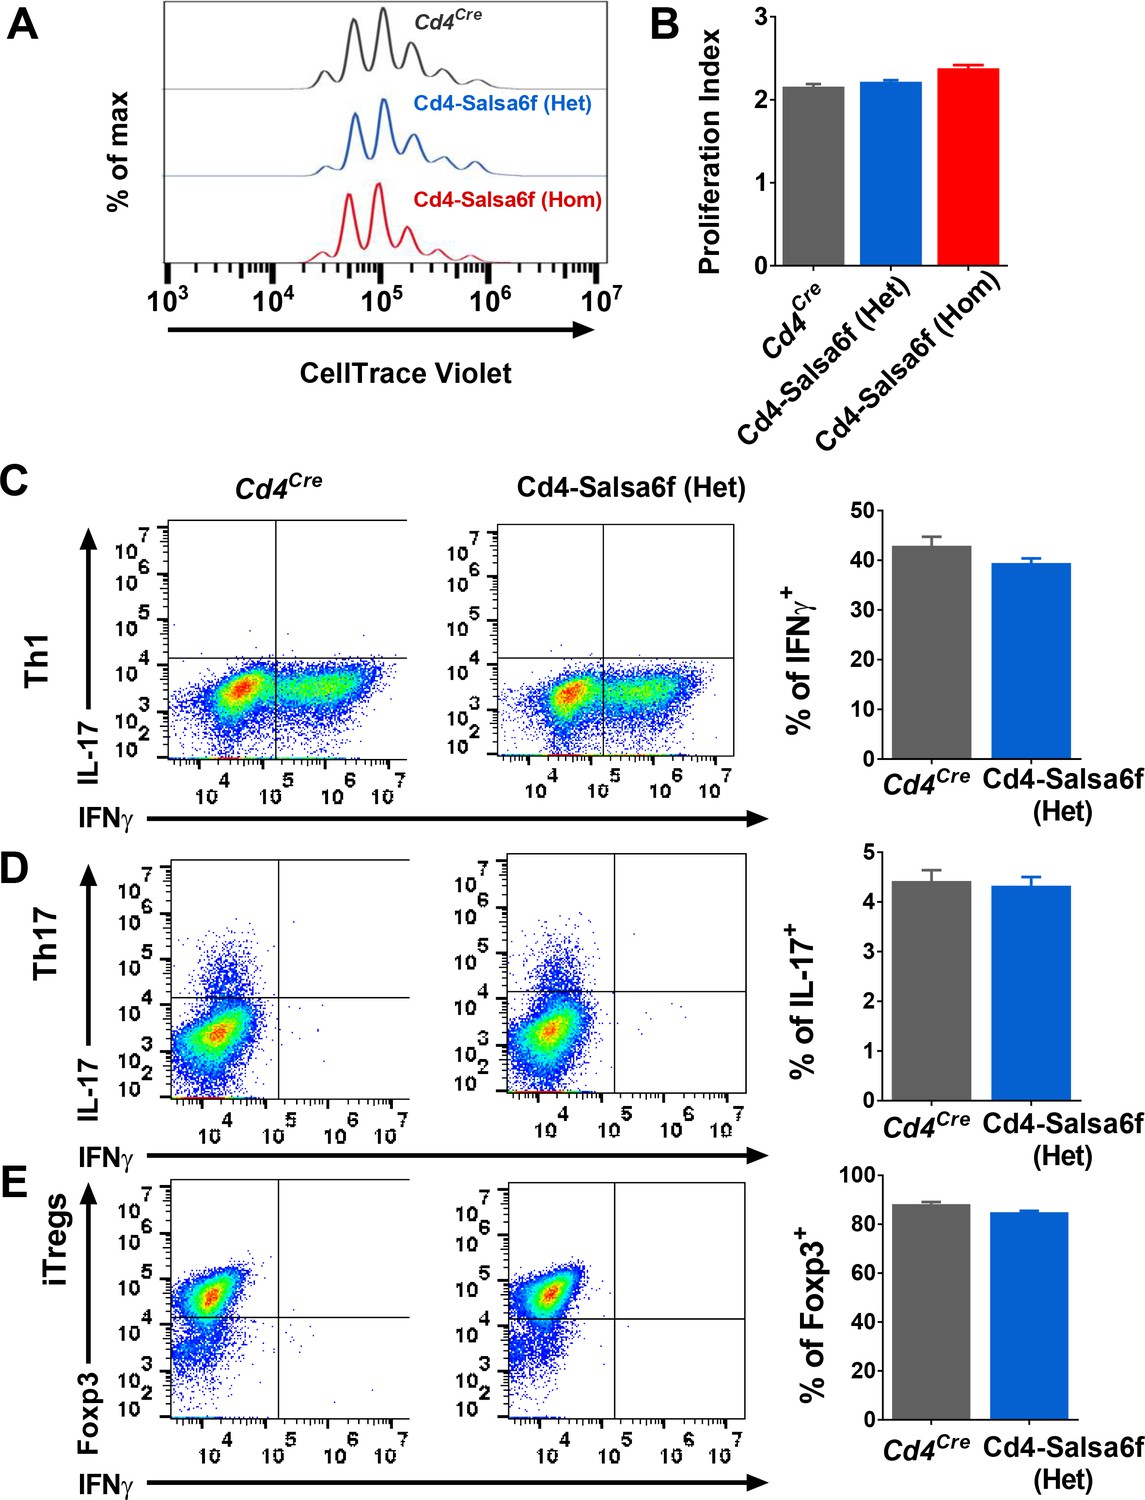
Functional responses of Cd4-Salsa6f T cells in vitro.
(A) Representative histogram showing cell trace violet (CTV) dilution in Cd4Cre (dark grey), Cd4-Salsa6f (Het) (blue), and Cd4-Salsa6f (Hom) (red) T cells at 72 hr following stimulation with αCd3/28 Dynabeads (1:1 ratio). (B) Proliferation index measured on CTV dilution curves (n = 8). (C–E) Dot plots showing differentiation of naive T cells from Cd4Cre and Cd4-Salsa6f (Het) mice into Th1 cells (C), Th17 cells (D) and iTregs (E) after 6 days (n = 4 mice). Right panels show average percentages of IFNγ+ cells (C), IL-17+ cells (D) and Foxp3+ cells (E).
Figure 4—figure supplement 1
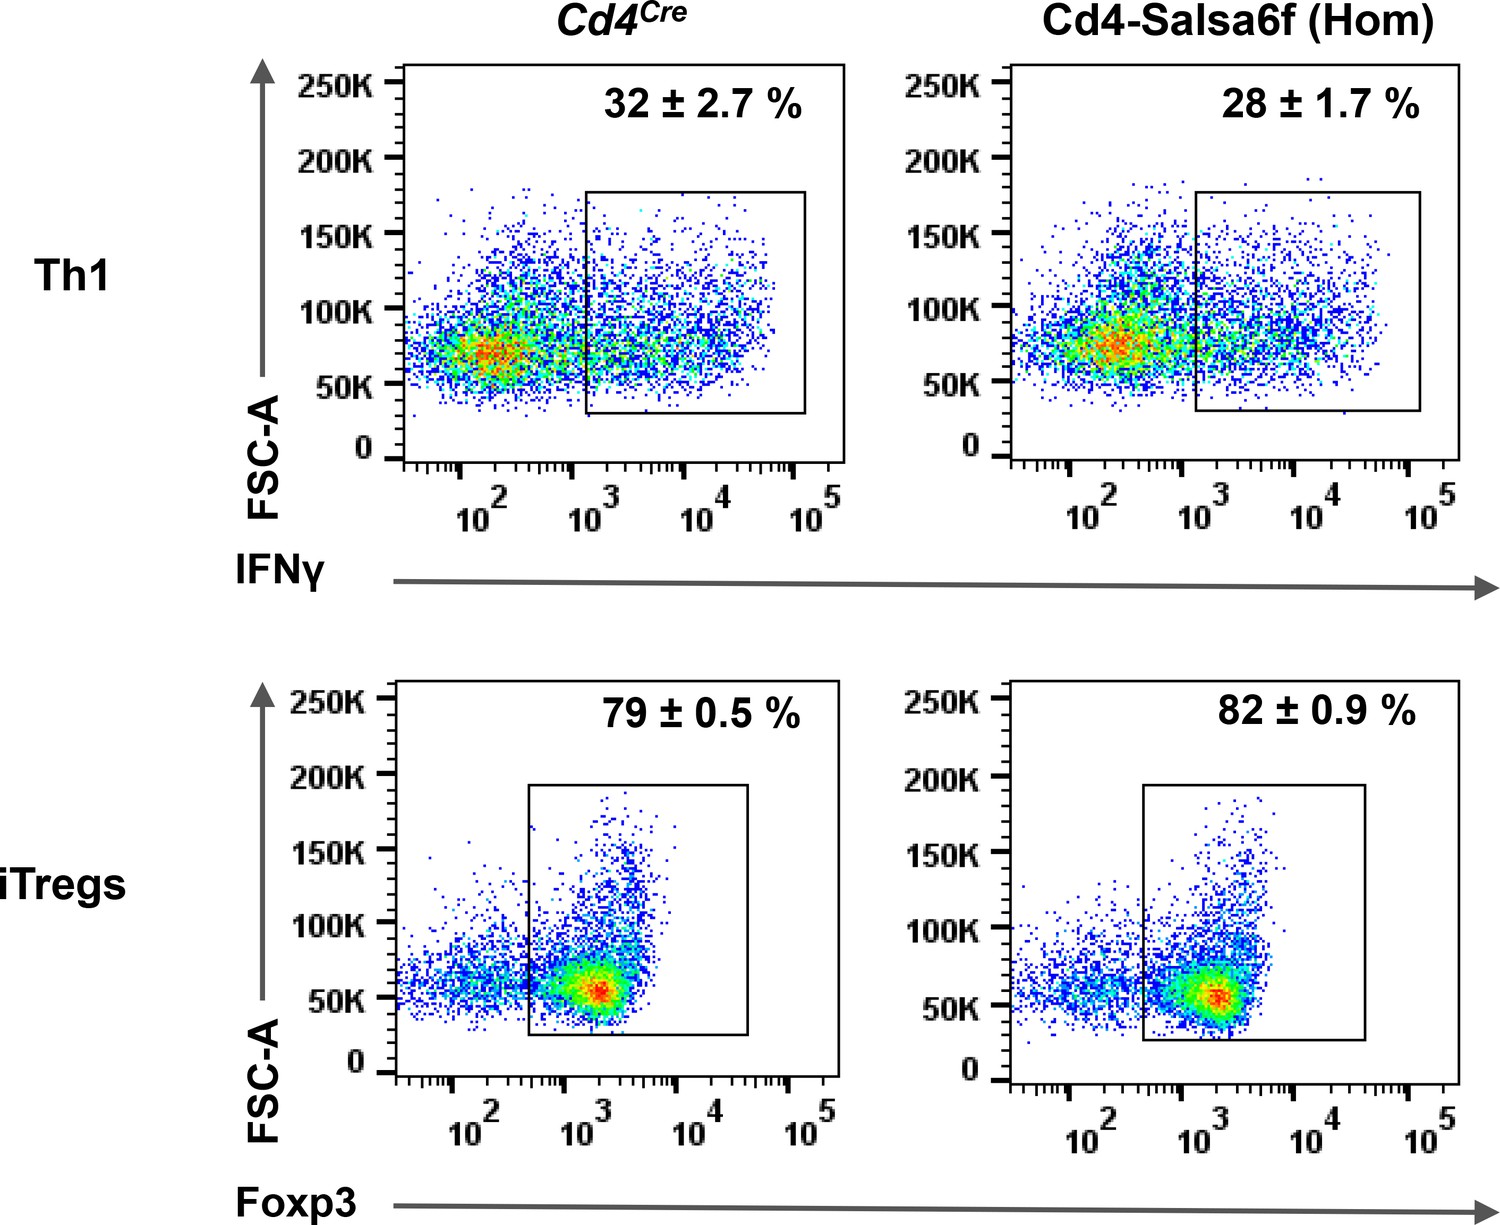
Differentiation of Cd4-Salsa6f (Hom) T cells into Th1 and iTregs.
Representative dot plots showing differentiation of Cd4+ T cells from Cd4Cre and Cd4-Salsa6f (Hom) mice into Th1 cells (top panel) and iTregs (bottom panel) after 4 days of stimulation with αCd3/28 Dynabeads (1:1 ratio) in the presence of polarizing cytokines. Numbers inside the plots indicate percent of cells in respective gates (mean ±SD, n = 4).
Figure 5
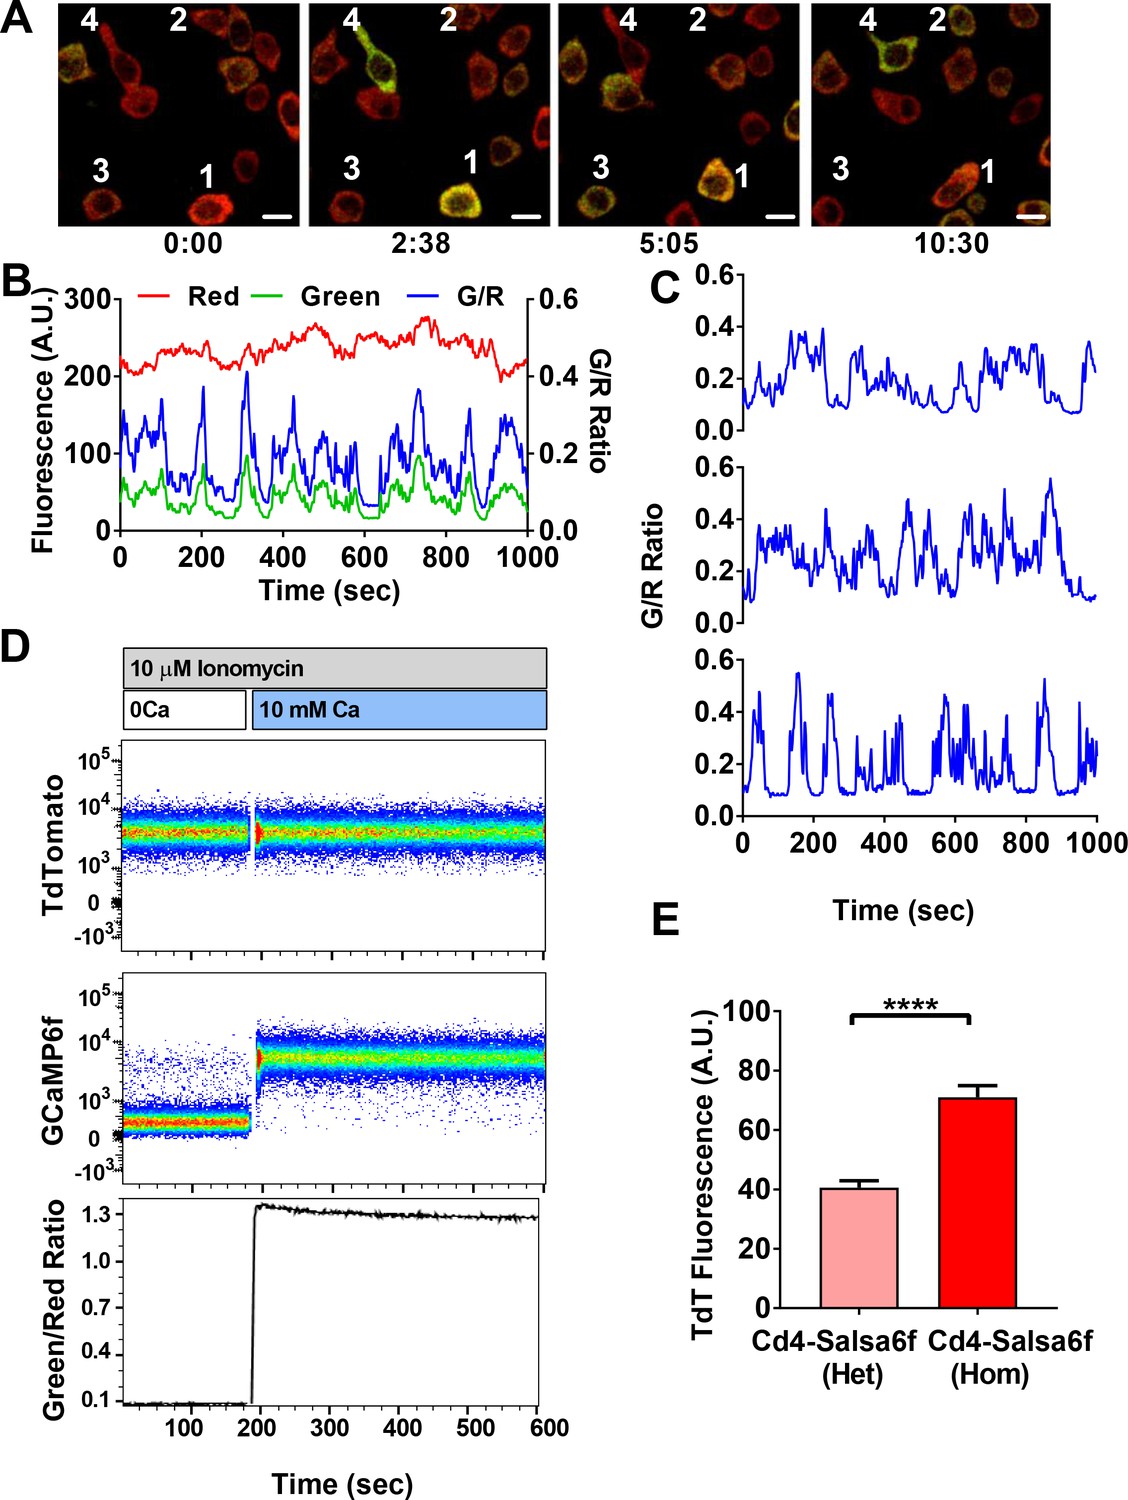
Single-cell Salsa6f calcium signals in T cells.
(A) Confocal images of Ca2+ signals in activating Cd4+ T cells from Cd4-Salsa6f (Het) mice, after two day stimulation on plate bound αCd3/28 antibody, showing merged green (GCaMP6f) and red (tdTomato) channels; time = min:sec; scale bar = 10 μm. (B) Representative traces from cell #3 in (A), showing cell-wide fluorescence intensity changes in GCaMP6f (green), tdTomato (red), and green/red ratio (G/R, blue). (C) G/R ratios for cells 1, 2, and 4 from (A). (D) Dynamic range of Salsa6f in resting Cd4 T cells, measured as green/red fluorescence ratio by flow cytometry. Cells were pre-treated with 10 μM ionomycin in Ca2+-free solution (white bar), followed by re-addition of 10 mM Ca2+ (blue bar). (E) Averaged tdTomato fluorescence in resting T cells from heterozygous Cd4-Salsa6f compared to homozygotic Cd4-Salsa6f mice.
Figure 6 with 1 supplement

Probe characterization and calibration of [Ca2+] in Salsa6f T cells.
(A) Confocal images of a naive T cell from a Cd4-Salsa6f (Het) mouse. Upper panel: tdTomato (left) and GCaMP6f (right) fluorescence intensity in Ca2+-free Ringer solution. Lower panel: same cell treated with 2 μM thapsigargin (TG) in Ringer solution containing 2 mM Ca2+. Line scans for each condition are shown adjacent to the images. Scale bar = 2 μm for A–C). (B) Corresponding confocal images and line scans of Salsa6f localization in a 2-day activated Cd4+ T-cell from Cd4-Salsa6f (Het) mouse. (C) Confocal image of a Fluo-4 (5 μM)-loaded Cd4+ T cell from Cd4Cre mouse. (D) Average GCaMP6f and tdTomato intensities in 2-day activated Cd4+ T cells treated with 2 μM ionomycin in Ca2+-free buffer and in external Ringer solution containing 0.1, 0.3 and 1 mM Ca2+. n = 36 cells, representative of three experiments. (E) Average 340/380 nm ratios in 2-day-activated and fura-2-loaded Cd4+ T cells from Cd4Cre mice (n = 59 cells) and G/R ratios in 2-day activated Cd4+ T cells from Cd4-Slasa6f (Het) mice (n = 47 cells) treated identically with 2 μM ionomycin followed by graded increases of external Ca2+ concentration as indicated. (F) Steady-state fura-2 and Salsa6f ratios recorded 300 s after solution application and peak Salsa6f ratio from 6E plotted as a function of external Ca2+ concentration. (G) Steady-state and peak Salsa6f ratios plotted as a function of cytosolic Ca2+ concentrations calculated from the fura-2 experiment, assuming a fura-2 Kd of 225 nM. The points were fit with a four parameter Hill equation to obtain the Kd for Salsa6f, with the following parameters: Salsa6f steady-state: Hill coefficient = 1.49 ± 0.16; Kd = 301 ± 24; Salsa6f peak: Hill coefficient = 0.93 ± 0.4; Kd = 162 ± 48. Data are representative of three experiments.
Figure 6—figure supplement 1
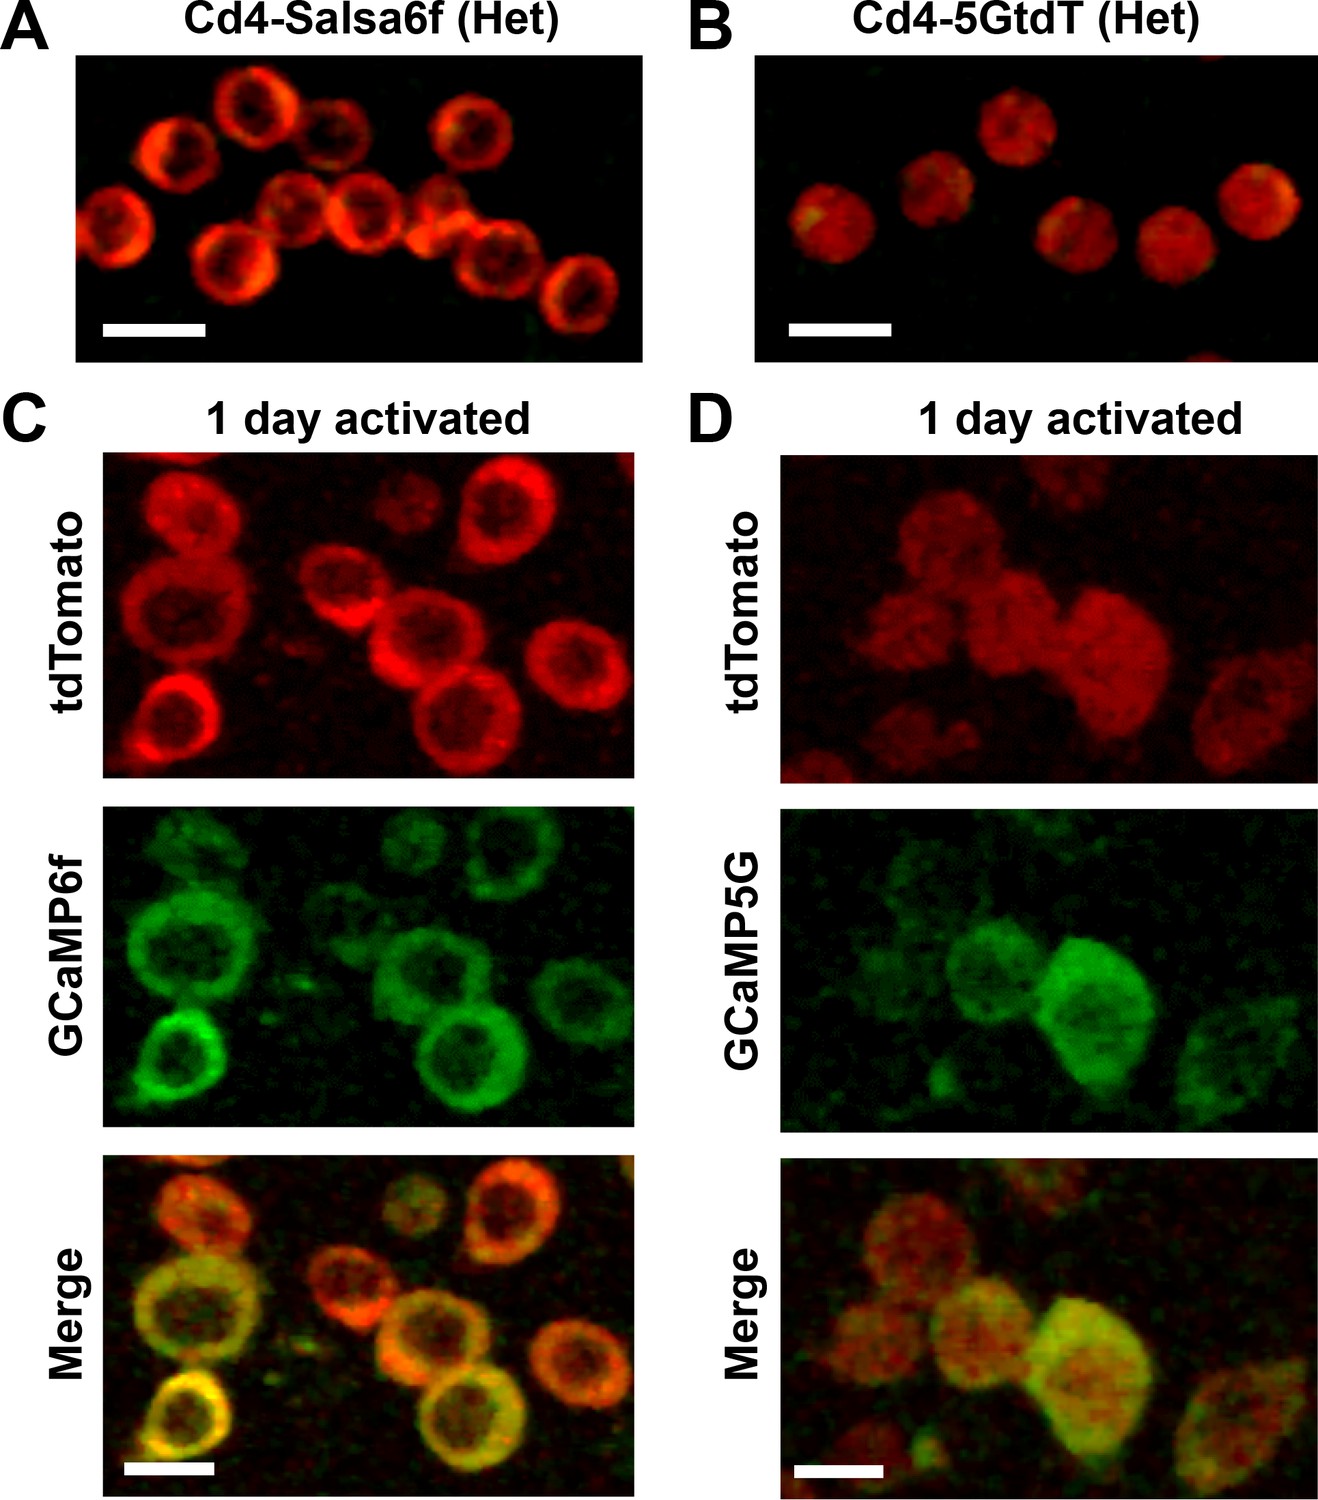
Comparison of GECI localization in Cd4 T cells from Salsa6f mouse and PC::G5-tdT mouse.
(A,B) Confocal images of Cd4+ T cells purified from a Cd4-Salsa6f (Het) mouse (A) or a Cd4-5GtdT mouse (B), showing merged red and green; cells imaged at the same laser and PMT settings; scale bar = 10 μm. (C,D) Cd4+ T cells purified from a Cd4-Salsa6f (Het) mouse (C) or a Cd4-5GtdT mouse (D), then activated for 24 hr on plate-bound αCd3/28 antibodies, and imaged with confocal microscopy, showing red (tdTomato), green (GCaMP6f or GCaMP5G), and merged channels; scale bar = 10 μm.
Figure 7 with 1 supplement
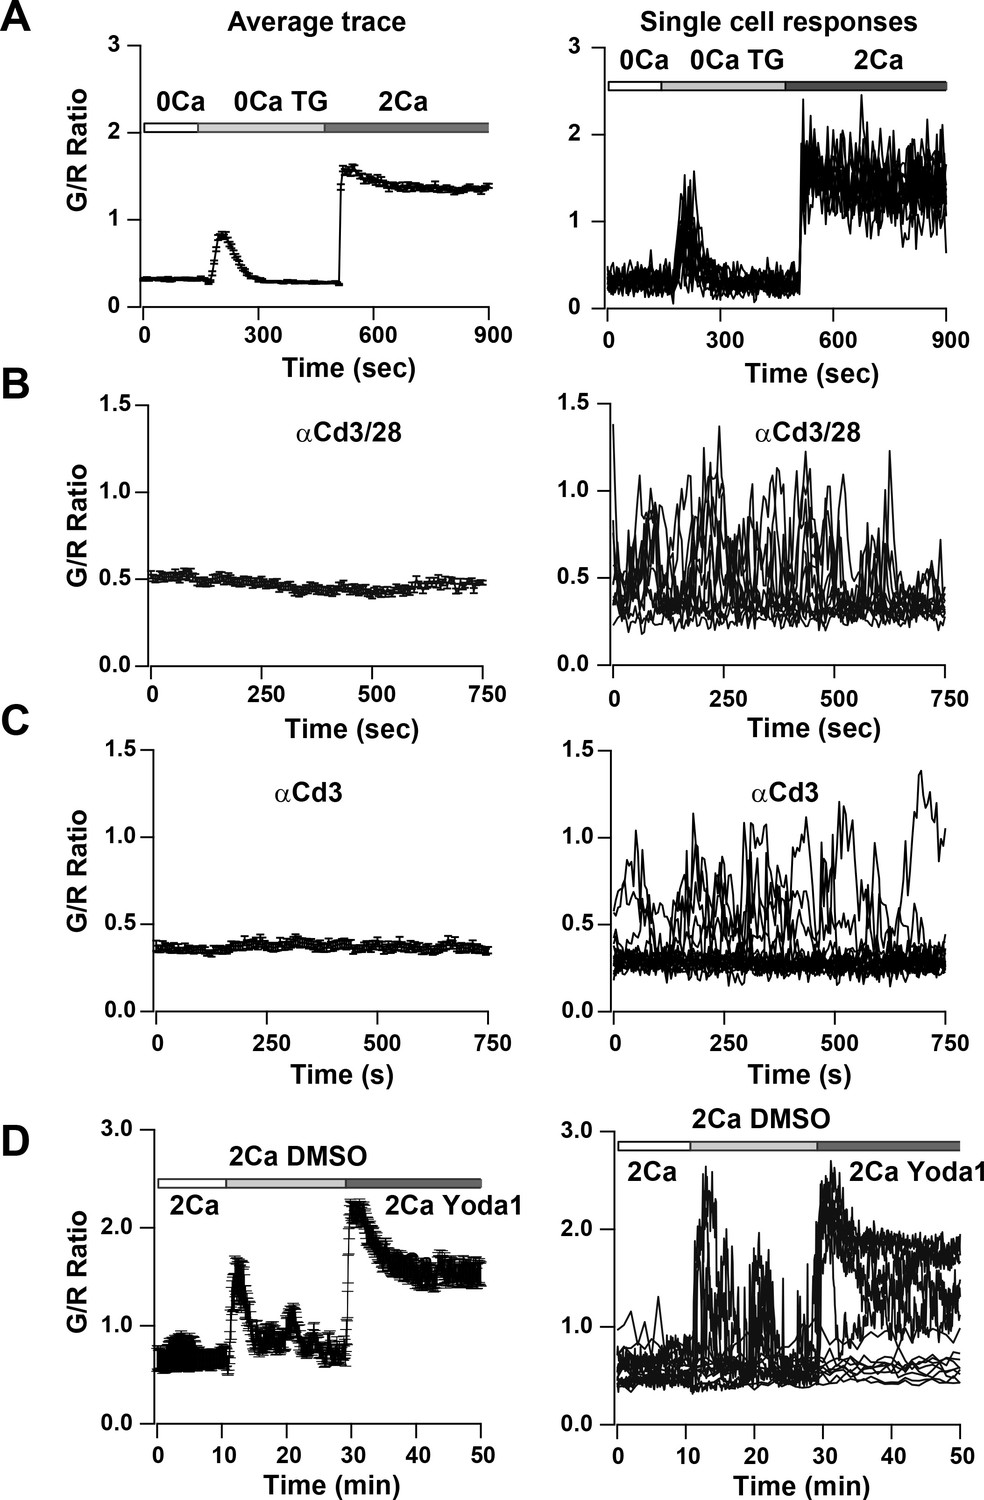
Ca2+signals in two day activated Cd4+ T cells from Cd4-Salsa6f (Het) mice in response to store-depletion, TCR stimulation and stimulation by Yoda1.
In all panels, average Salsa6f G/R ratios are shown on the left, and representative single-cell traces are shown superimposed on right. Experiments were done in standard Ringer solution (A) or in RPMI containing 2% FCS and 2 mM Ca2+ (B–D). (A) Store-operated Ca2+ entry (SOCE) in Cd4+ T cells (n = 86 cells), induced by depleting ER Ca2+ stores with TG in Ca2+-free buffer followed by re-addition of Ringer containing 2 mM Ca2+. (B,C) Ca2+ responses to TCR stimulation in T cells plated on coverslips coated with 1 μg/ml αCd3/Cd28 (B) or 1 μg/ml αCd3 alone (C) (n = 90 cells each). (D) Ca2+ elevations during shear stress induced by solution exchange followed by the Piezo1 agonist Yoda1 (15 μM) in cells plated on αCd3/28 (n = 79 cells).
Figure 7—figure supplement 1
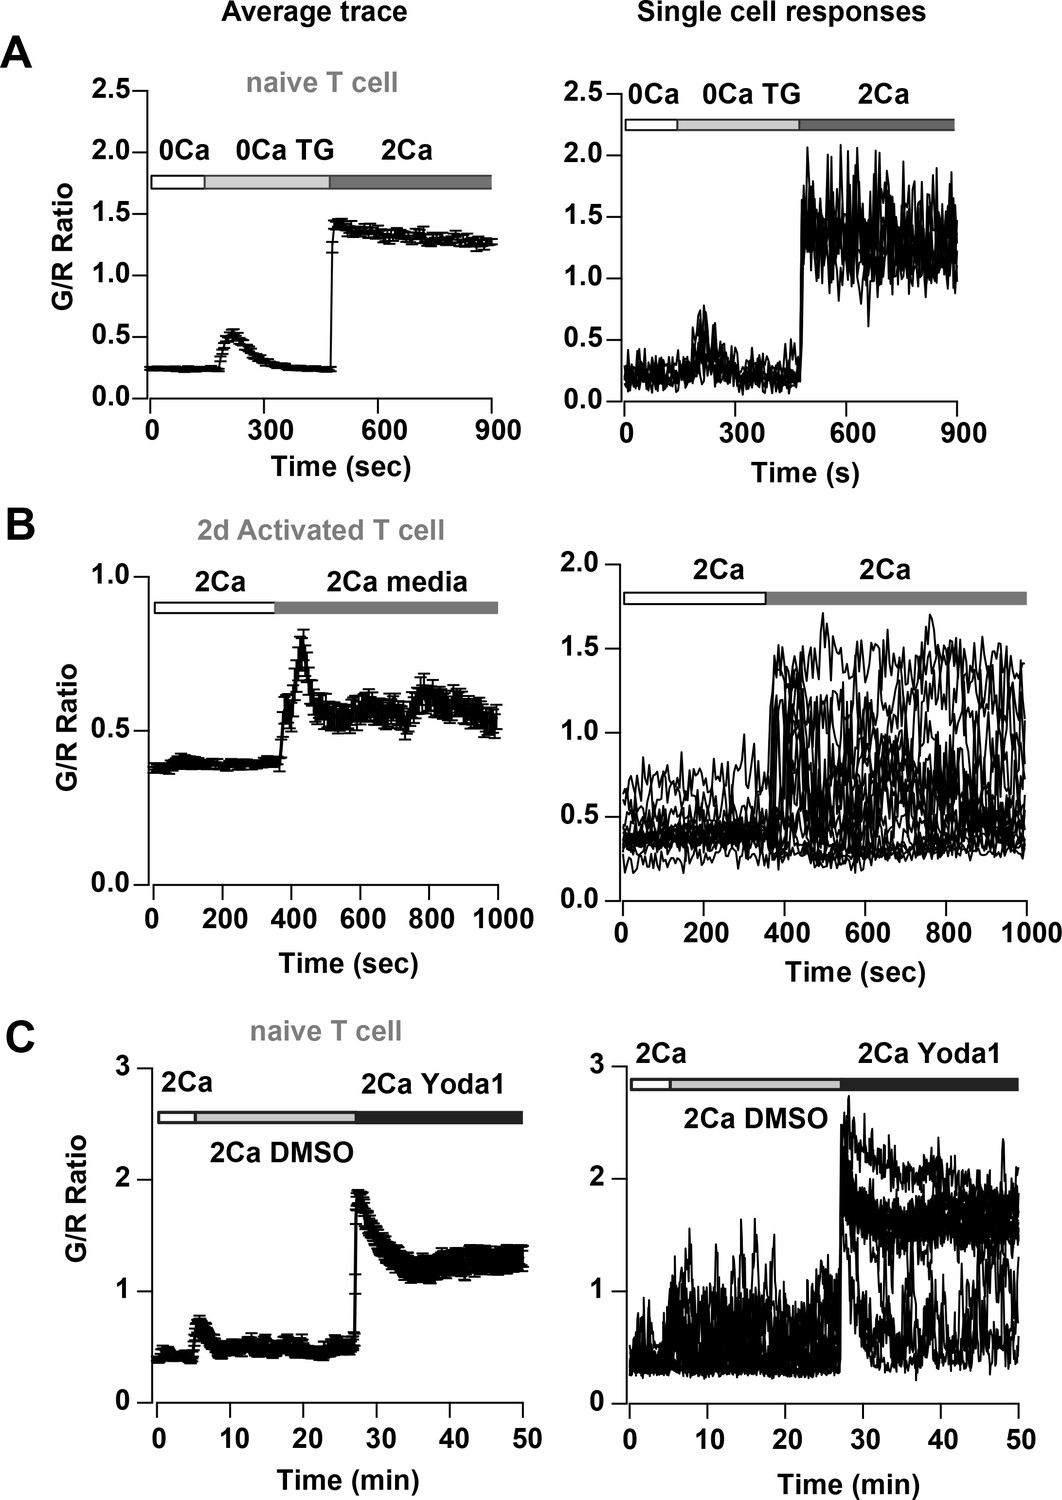
Store-operated Ca2+entry and Piezo1 activation in T cells from Cd4-Salsa6f (Het) mice.
Average (left panel) and representative single-cell responses (right panel) to (A) TG-induced SOCE in naive T cells (n = 96 cells), (B) solution exchange with media alone in 2-day activated T-cells (n = 68 cells) and (C) application of 15 μM Yoda1 in naïve T cells (n = 53 cells).
Figure 8

TCR induced Ca2+ signals in T cell subsets from Cd4-Salsa6f (Het) mice.
Average (left) and representative single-cell Ca2+ traces (right) from confocal time-lapse microscopy showing changes in Salsa6f green/red (G/R) ratio in naive T cells (A), 5-day differentiated Th17 cells (B), and 5-day differentiated iTregs (C) plated on 1 μg/mL αCd3/28. (n = 90 cells from two to three experiments each).
Figure 9 with 2 supplements
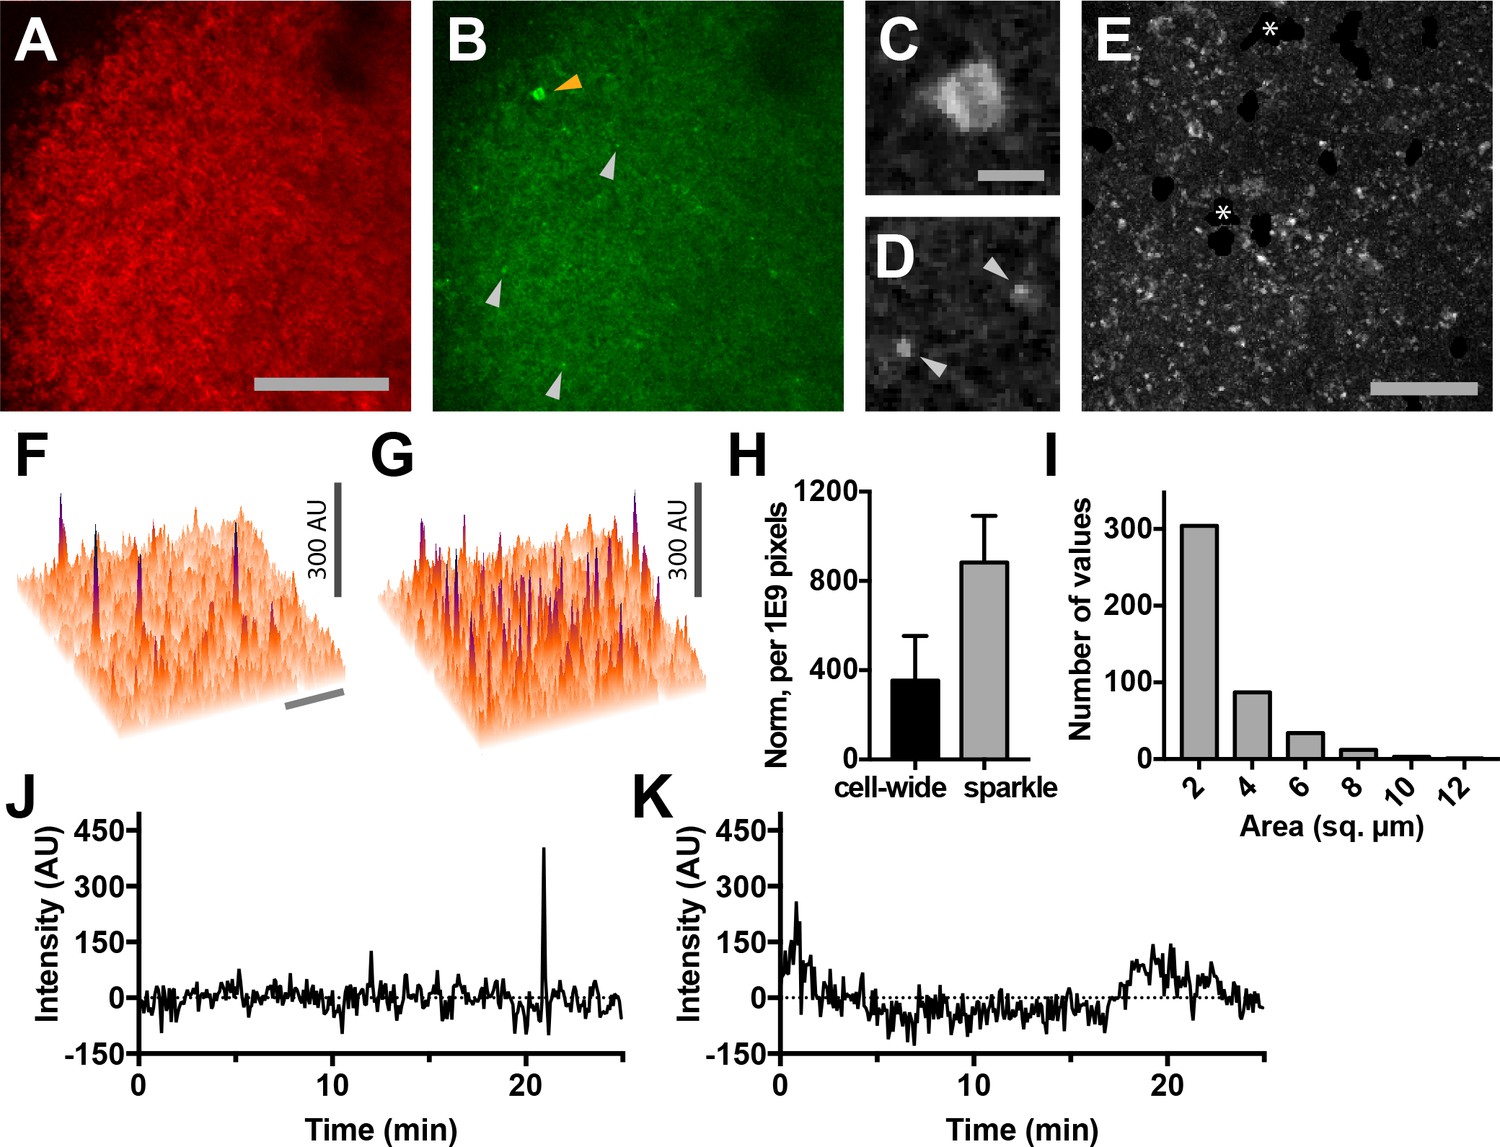
Lymph nodes from Cd4-Salsa6f (Hom) mice exhibit cell-wide and subcellular Ca2+signals.
(A) Median filtered, maximum intensity projection of a red channel image from a single time point of an explanted lymph node from a Cd4-Salsa6f (Hom) mouse. (B) Green channel image corresponding to A). Orange arrowhead indicates cell-wide Ca2+ signal and gray arrowheads indicate smaller, local transient Ca2+ signals. (C, D) Enlargements of cell-wide (C) and local (D; gray arrowheads) Ca2+ signals. Note the lower fluorescence intensity in the center of the cell in C due to exclusion of Salsa6f from the nucleus. (E) Maximum intensity projection of 214 green channel time points (every 11.5 s over 41 min) showing hundreds of small local Ca2+ signals. Green channel image series was red channel subtracted and cropped from B. Asterisks indicate regions containing autofluorescent cells that have been cropped out. (F, G) Surface plot of maximum green channel intensity over two (F) and 50 (G) consecutive time points. Note the presence of four (F) and dozens (G) of small, discrete, high-intensity peaks of similar intensity. (H) Bar graph of relative frequencies of cell-wide and local Ca2+ signals. (I) Frequency distribution of the area of local Ca2+ signals. Scale bar in A is 100 µm (applies to B); scale bar in C is 10 µm (applies to D), scale bars in E and in F are 50 µm (applies to G). (J) Trace of fluorescence intensity over 25 min at the location of a transient subcellular Ca2+ signal (one time point every 5 s). (K) Trace of fluorescence intensity of a putative cell process from an autofluorescent cell drifting in the image field.
Figure 9—figure supplement 1
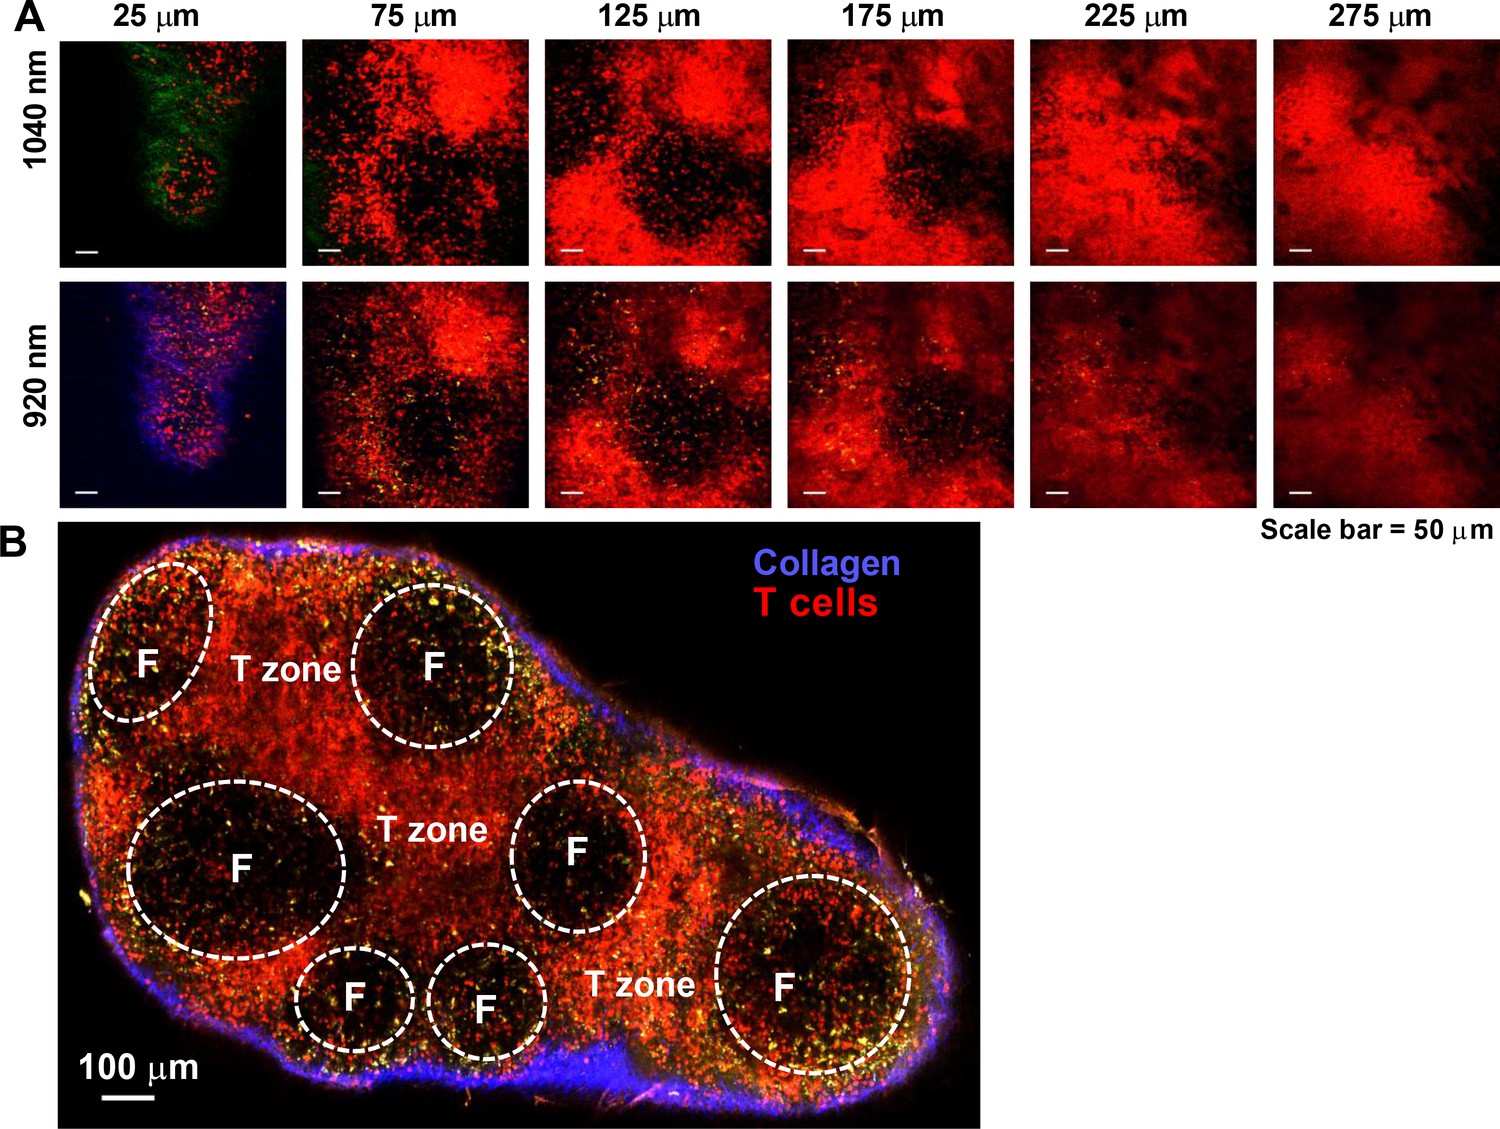
Imaging lymph nodes of Cd4-Salsa6f homozygous mice.
Cre-mediated expression of Salsa6f in Cd4 T cells reveals endogenous T cell labeling in lymph node. (A) Two-photon images of explanted lymph node from Cd4-Salsa6f (Hom) mouse at various depths (indicated above each frame); 1040 nm femtosecond excitation (top row) or 920 nm excitation (bottom row). Second harmonic signal from collagen fibers is collected in green for 1040 nm excitation and in blue for 920 nm excitation. Salsa6f cells are readily detected up to 275 µm deep. (B) Montage image of a Cd4-Salsa6f (Hom) lymph node at 100 µm depth, imaged using 920 nm excitation showing Salsa6f+ cells in red, autofluorescent structures in yellow, and the capsular boundary shown in blue (second-harmonic signal). B cell follicles (F) are outlined. Scale bar = 100 µm.
Figure 9—figure supplement 2
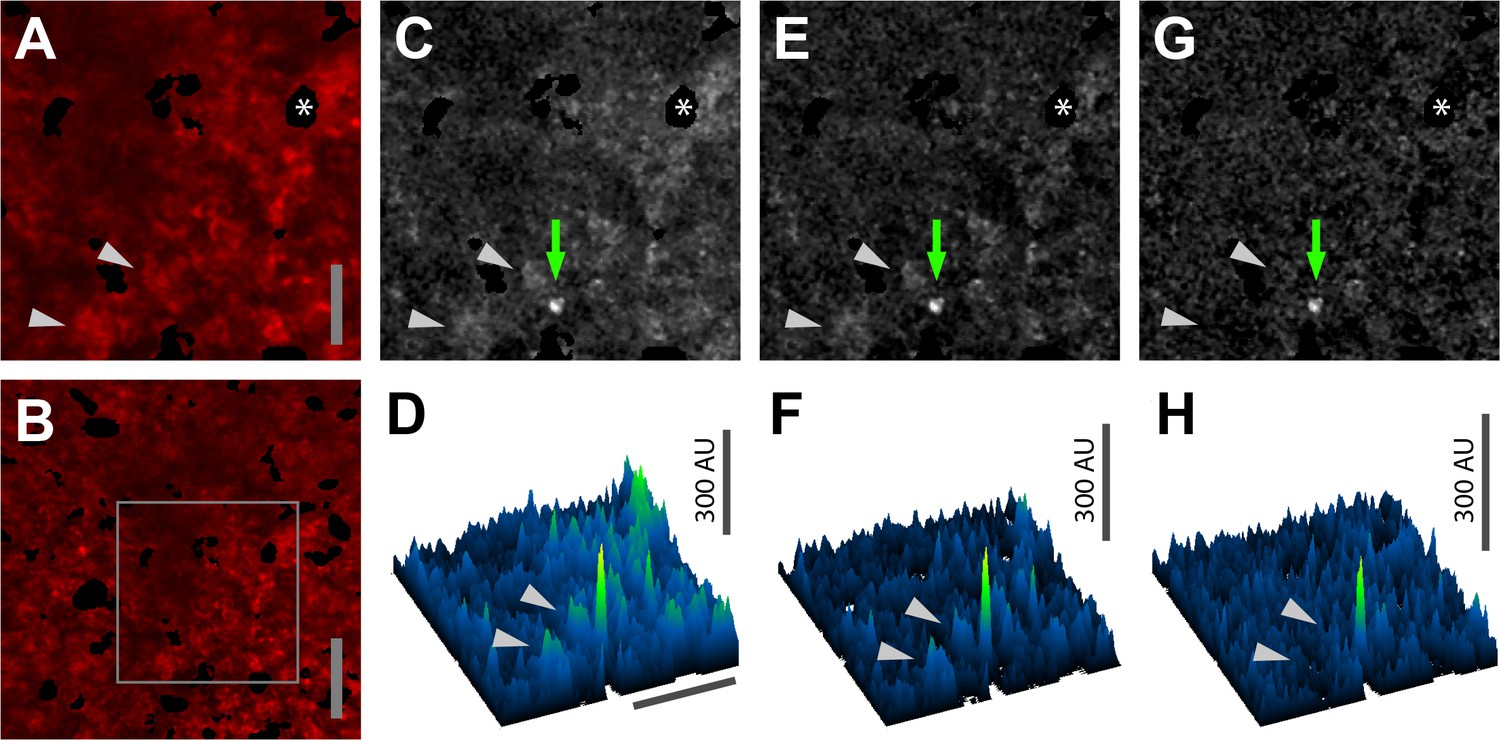
Subtraction of red channel fluorescence improves detection of Salsa6f Ca2+signals.
(A, B) Median filtered, maximum intensity projection of a red channel image from a single time point of an explanted lymph node from a Cd4-Salsa6f (Hom) mouse. Panel A is enlarged and cropped from panel B (gray rectangle). (C, E, G) Green channel images corresponding to A with different image processing protocols. (C) Maximum intensity projection without further processing. (E) Maximum intensity projection after subtraction of the average of all green channel frames. (G) Maximum intensity projection after subtraction of the corresponding scaled red channel image and subtraction of the subsequent average from all green channel frames. Green arrows in C,E,G indicate a subcellular Ca2+ signal. (D, F, H) Surface plots corresponding to the images in C,E,G, respectively, showing the subcellular Ca2+ signal as a green peak. Gray arrowheads indicate nearby background cell fluorescence that is progressively removed by image processing. Asterisk indicates a region containing an autofluorescent cell that has been cropped out. Scale bar in A is 25 µm (applies to C,E,G); scale bar in B and the horizontal scale bar in D are 50 µm (applies to F,H).
Figure 10

Subcellular Ca2+signals map to different regions of motile, adoptively transferred Cd4-Salsa6f (Hom) T cells.
(A) Histogram of green channel pixel intensities from a representative region of a time-lapse image series of Cd4-Salsa6f (Hom) T cells in a wild-type lymph node after adoptive transfer. Vertical marks indicate the peak intensities of the fluorescence transients shown in D and J. (B–F, H–L) Two Cd4-Salsa6f (Hom) T cells imaged in a wild-type lymph node after adoptive transfer (same lymph node as in A). Red (B,H) and green (C,I) channel fluorescence images. (D,J) Corresponding pseudocolored green channel images processed as in Figure 9—figure supplement 2. (E,K) Corresponding composite image of gray pseudocolored red channel image with green channel processed image. (F,L) Ratiometric images of the green divided by the red channel fluorescence image. Gray arrowheads denote local Ca2+ signals at the back (C–F) and front (I–L) of motile T cells. Look-up table for D and J) corresponds to Arbitrary Units; look-up table for F and L corresponds to green-to-red ratio. Both cells are oriented with their front toward the top of the image. Scale bar in A is 5 µm (applies to B-H, H–L). (G,M) Scatter plots of G/R ratio for individual pixels in the front and back of Cd4-Salsa6f T cells shown in B–F and H–L, respectively. Red lines indicate median values. (****) indicates p<0.0001, Mann Whitney test.
Videos
Video 1
Calcium readout of Salsa6f probe in HEK cells.
HEK 293A cells transfected with Salsa6f, first washed with 0 mM Ca2+ followed by 2 μM ionomycin in 2 mM Ca2+; scale bar = 20 µm, time shown in hr:min:s. Images were acquired at 15 s interval and played back at 15 frames per second. This video corresponds to Figure 1D.
Video 2
Single-cell readout of activation in transgenic T cells by Salsa6f.
Cd4 T cells from Cd4-Salsa6f (Het) mice were plated on activating surface coated with anti-Cd3/Cd28. Images were acquired at 5 s interval and played back at 15 frames per second. This video corresponds to Figure 5A.
Video 3
T cell Ca2+response to Ca2+store depletion by thapsigargin (TG).
Video of maximum intensity projection images of 2-day activated T cells from Cd4-Salsa6f (Het) mouse plated on poly-L-lysine. Scale bar = 20 µm, time shown in hr:min:s. 2 μM TG in Ca2+-free Ringer’s was added at 00:02:30 and 2 mM Ca2+was added at 00:08:15. Time interval between frames is 5 s. Play back speed = 50 frames per second. This video corresponds to Figure 7A.
Video 4
Activated T cell Ca2+responses to TCR stimulation.
Video of maximum intensity projection images of 2-day activated T cells from Cd4-Salsa6f (Het) mouse plated on anti-Cd3/28-coated coverslip. Scale bar = 20 µm, time shown in hr:min:s. Time interval between frames is 5 s. Play back speed = 15 frames per second. Video corresponds to Figure 7B.
Video 5
T cell Ca2+response to shear and Yoda1.
Video of maximum intensity projection images of 2-day activated T cells from Cd4-Salsa6f (Het) mouse plated on anti-Cd3/28-coated coverslip. Scale bar = 20 µm, time shown in hr:min:s. Time interval between frames is 5 s. Play back speed = 200 frames per second. Medium was added at 00:15:00and Yoda1 was added at 00:35:00. Video corresponds to Figure 7C.
Video 6
Lymph nodes from Cd4-Salsa6f (Hom) mice exhibit cell-wide and subcellular Ca2+signals.
Time shown in hr:min:s; images were acquired at 5 s intervals. Play back speed = 50 frames per second. Red channel is turned off after beginning to facilitate visualization of green signals. Video corresponds to Figure 9B.
Tables
Key resources table
| Reagent type (species) or resource | Designation | Source or reference | Identifiers | Additional information |
|---|---|---|---|---|
| Recombinant DNA reagent | Salsa6f | This paper | Fusion of GCaMP6f to tdTomato via a V5 epitope linker (GCaMP6f-V5-tdTomato) | |
| Recombinant DNA reagent | Gt(ROSA)26Sor5’-pCAG- FRT-LSL-Salsa6f-WPRE- bGHpA-AttB-FRT-NeoR- AttP-Gt(ROSA)26Sor3’ cassette | This paper | Salsa6f inserted into a Gt(ROSA)26Sor-pCAG- LSL-(Salsa6f)-WPRE- bGHpA-NeoR cassette. | |
| Transgene (mouse) | Gt(ROSA)26SorpCAG-FRT-LSL- Salsa6f-WPRE-bGHpA-AttB-FRT-NeoR-AttP | This paper | Allele with the above cassette targeted to the ROSA26 locus. | |
| Transgene (mouse) | Gt(ROSA)26SorpCAG-FRT-LSL- Salsa6f-WPRE-bGHpA-AttB/P | This paper | Same as above with Neomycin cassette deleted | |
| Strain, strain background (mouse) | LSL-Salsa6f (F1), LSL-Sals6f (Hom) | This paper | Salsa6f transgene targeted to Rosa26 locus in JM8.N4 mouse embryonic stem (ES) cells. Positive chimeras bred to R26ΦC31o mice to produce LSL- Salsa6f F1 founders and homozygotic LSL- Salsa6f (Hom) mice. See Materials and methods for details. | |
| Strain, strain background (mouse) | Cd4-Salsa6f (Het), Cd4-Salsa6f (Hom) | This paper | LSL-Salsa6f (Hom) mice crossed to Cd4Cre mice to produce heterozygotic and homozygotic Salsa6f- Cd4Cre mice (designated as Cd4- Salsa6f ± and Cd4- Salsa6f+/+ in the paper). | |
| Strain, strain background (mouse) | Cd4Cre mice C57BL/6J | Jackson #017336 | ||
| Strain, strain background (mouse) | C57BL/6J | Jackson #000664 | ||
| Cell line (human) | HEK293A | Invitrogen (#R705-07) | ||
| Transfected construct (synthetic) | Salsa6f | This paper | see above for Salsa6f gene | |
| Transfected construct (synthetic) | G-GECO1, B-GECO1, GCaMP6f, GCaMP6m, GCaMP6s | Addgene | ||
| Antibody | anti-mouse IL-4, IL17A-APC (clone TC11-18H10.1), IFN-Pacific Blue (clone XMG1.2) | BioLegend | ||
| Antibody | Foxp3-PE (clone FJK16s) | ThermoFisher Scientific | ||
| Antibody | αCd3 and αCd28 | Invivogen | ||
| Antibody | αCd3 and αCd28 coated dynabeads | LifeTechnologies Corp. | ||
| Peptide, recombinant protein | recombinant human TGFβ1 | Tonbo Biosciences | ||
| peptide, recombinant protein | recombinant mouse IL-12, IL-23, IL-1β, TGFβ | BioLegend | ||
| Peptide, recombinant protein | recombinant human IL-2 | BioLegend | ||
| Commercial assay or kit | EasySep mouse naïve Cd4 T cell isolation kit | Stem Cell Technologies | ||
| Commercial assay or kit | EasySep mouse Cd4 T cell isolation kit | Stem Cell Technologies | ||
| Chemical compound, drug | Cell trace violet, eFluor 780 | ThermoFisher Scientific | ||
| Chemical compound, drug | Ionomycin, Thapsigargin, Retinoic Acid, PMA | Sigma Aldrich | ||
| Chemical compound, drug | Ghost dye 780 | Biolegend | ||
| Chemical compound, drug | Fura2-AM, Fluo-4 AM | ThermoFisher Scientific | ||
| Software, algorithm | ImageJ/Fiji | NIH | ||
| Software, algorithm | IMARIS | Bitplane | ||
| Other | 35 mm glass chamber | LabTek, ThermoFisher Scientific | ||
| Other | RPMI cell culture medium | Lonza |
Additional files
-
Transparent reporting form
- https://doi.org/10.7554/eLife.32417.024
Download links
A two-part list of links to download the article, or parts of the article, in various formats.
Downloads (link to download the article as PDF)
Open citations (links to open the citations from this article in various online reference manager services)
Cite this article (links to download the citations from this article in formats compatible with various reference manager tools)
T-cell calcium dynamics visualized in a ratiometric tdTomato-GCaMP6f transgenic reporter mouse
eLife 6:e32417.
https://doi.org/10.7554/eLife.32417


