HCN2 channels in the ventral tegmental area regulate behavioral responses to chronic stress
- Medical College of Wisconsin, United States
- West Virginia University, United States
Figures
Figure 1 with 1 supplement
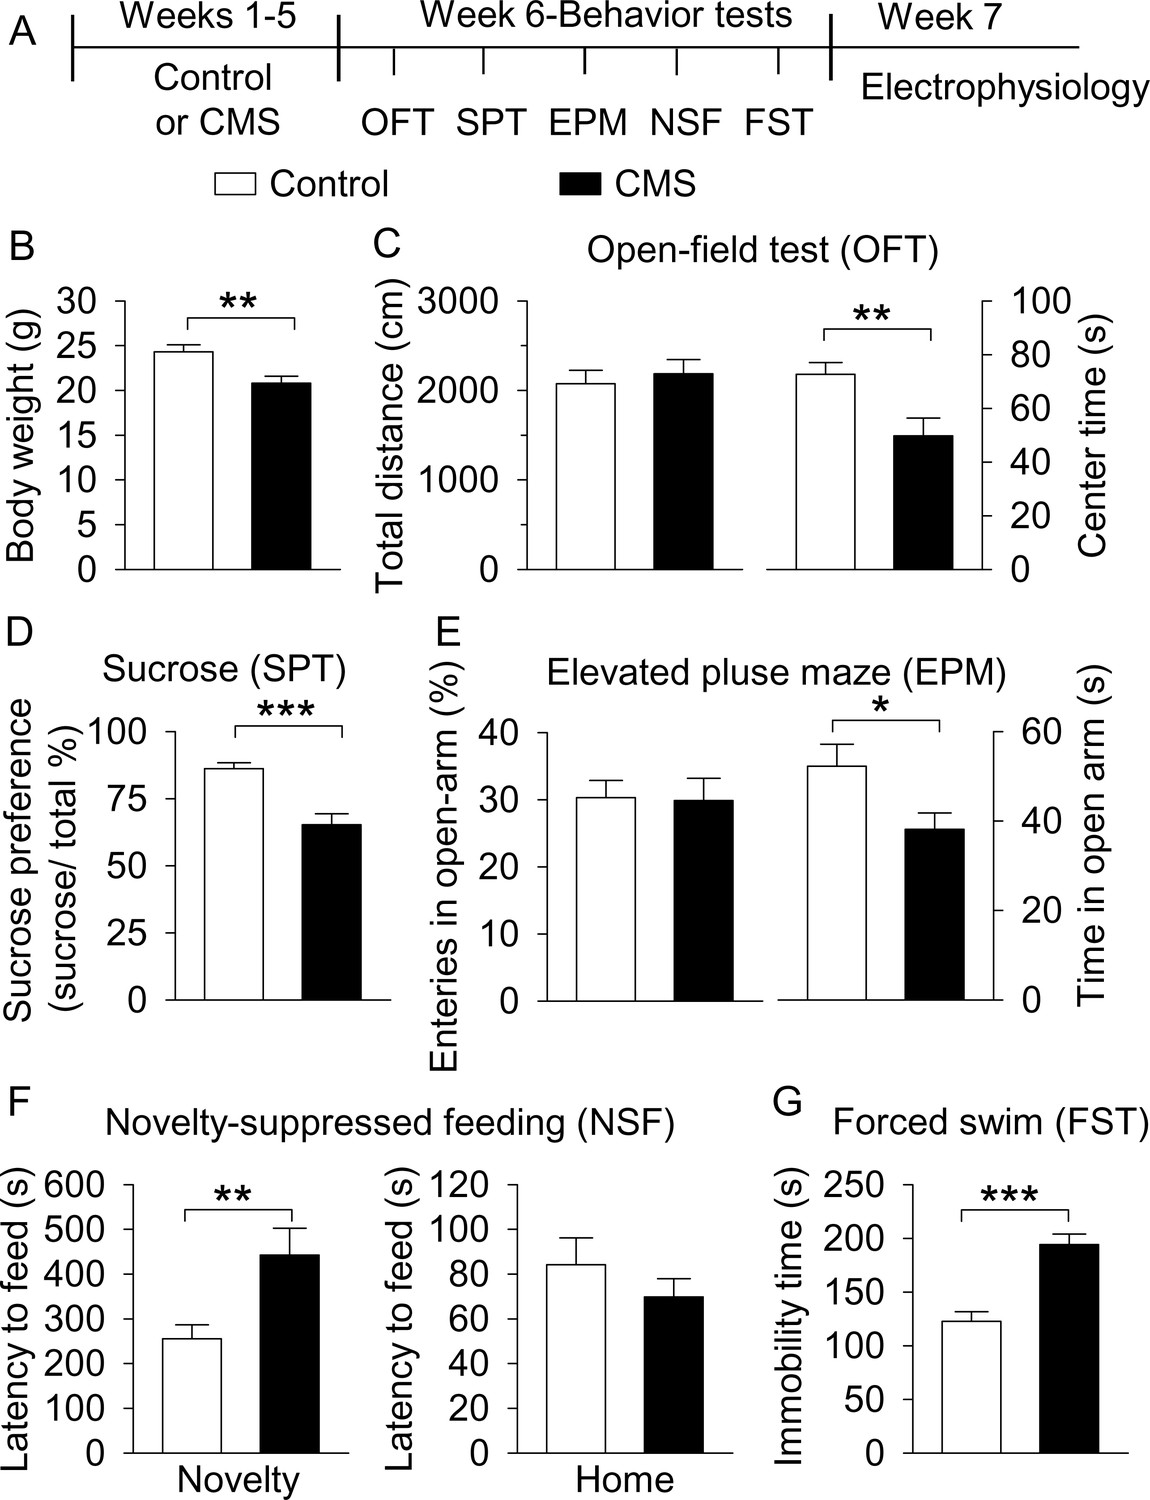
CMS produced depressive- and anxiety-like behaviors.
(A) The timeline of CMS, behavioral tests, and electrophysiology. (B) CMS significantly decreased body weight compared with non-stressed control mice (**p=0.004, control, n = 14 mice; CMS n = 12 mice from B to G). (C) CMS significantly decreased the center time (**p=0.007) without affecting total distance traveled in the OFT (p=0.615). (D) CMS significantly decreased sucrose preference compared to control (***p<0.001). (E) CMS did not affect entries into the open arms (p=0.919), but significantly decreased the time spent in the open arms (*p=0.036) in the EPM test. (F) CMS significantly increased the latency to feed in the novel environment (Novelty) in the NSF test (**p=0.008) but did not significantly affect the latency to feed in the home cage (Home) (p=0.345). (G) CMS significantly increased immobility time in the FST (***p<0.001).
-
Figure 1—source data 1
Body weight and behavior following CMS in Figure 1B–G.
- https://doi.org/10.7554/eLife.32420.004
Figure 1—figure supplement 1
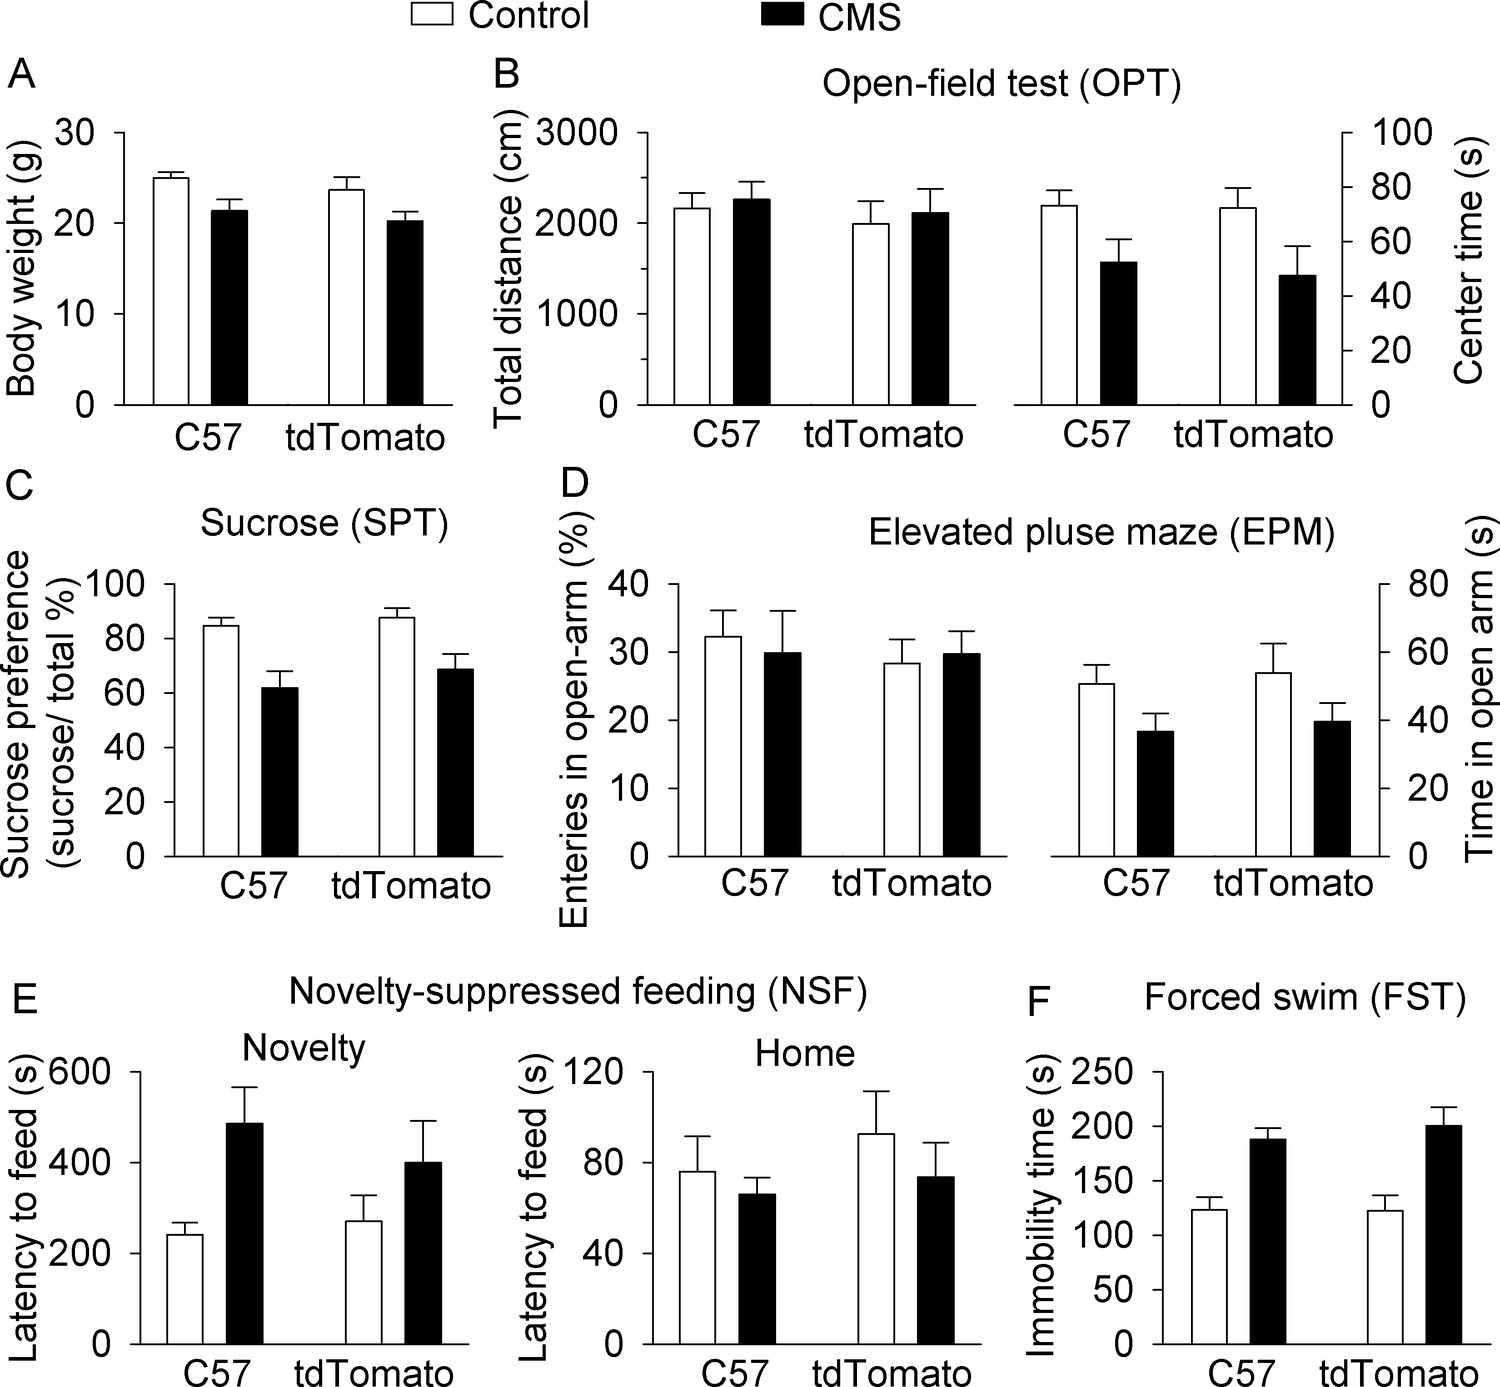
C57BL/6J and DAT-tdTomato mice do not significantly differ in body weight or behaviors at baseline or in response to CMS.
Figure 1 was reanalyzed to compare C57BL/6J (C57) and DAT-tdTomato (tdTomato) reporter mice for control and CMS-induced effects on body weight (A) and behavior in OPT (B) SPT (C) EPM (D) NSF (E) and FST (F). Detailed statistical analysis is presented in Supplementary file 1. Control-C57, n = 7 mice; control-tdTomato, n = 6 mice; CMS-C57, n = 7 mice; CMS-tdTomato, n = 6 mice.
Figure 2
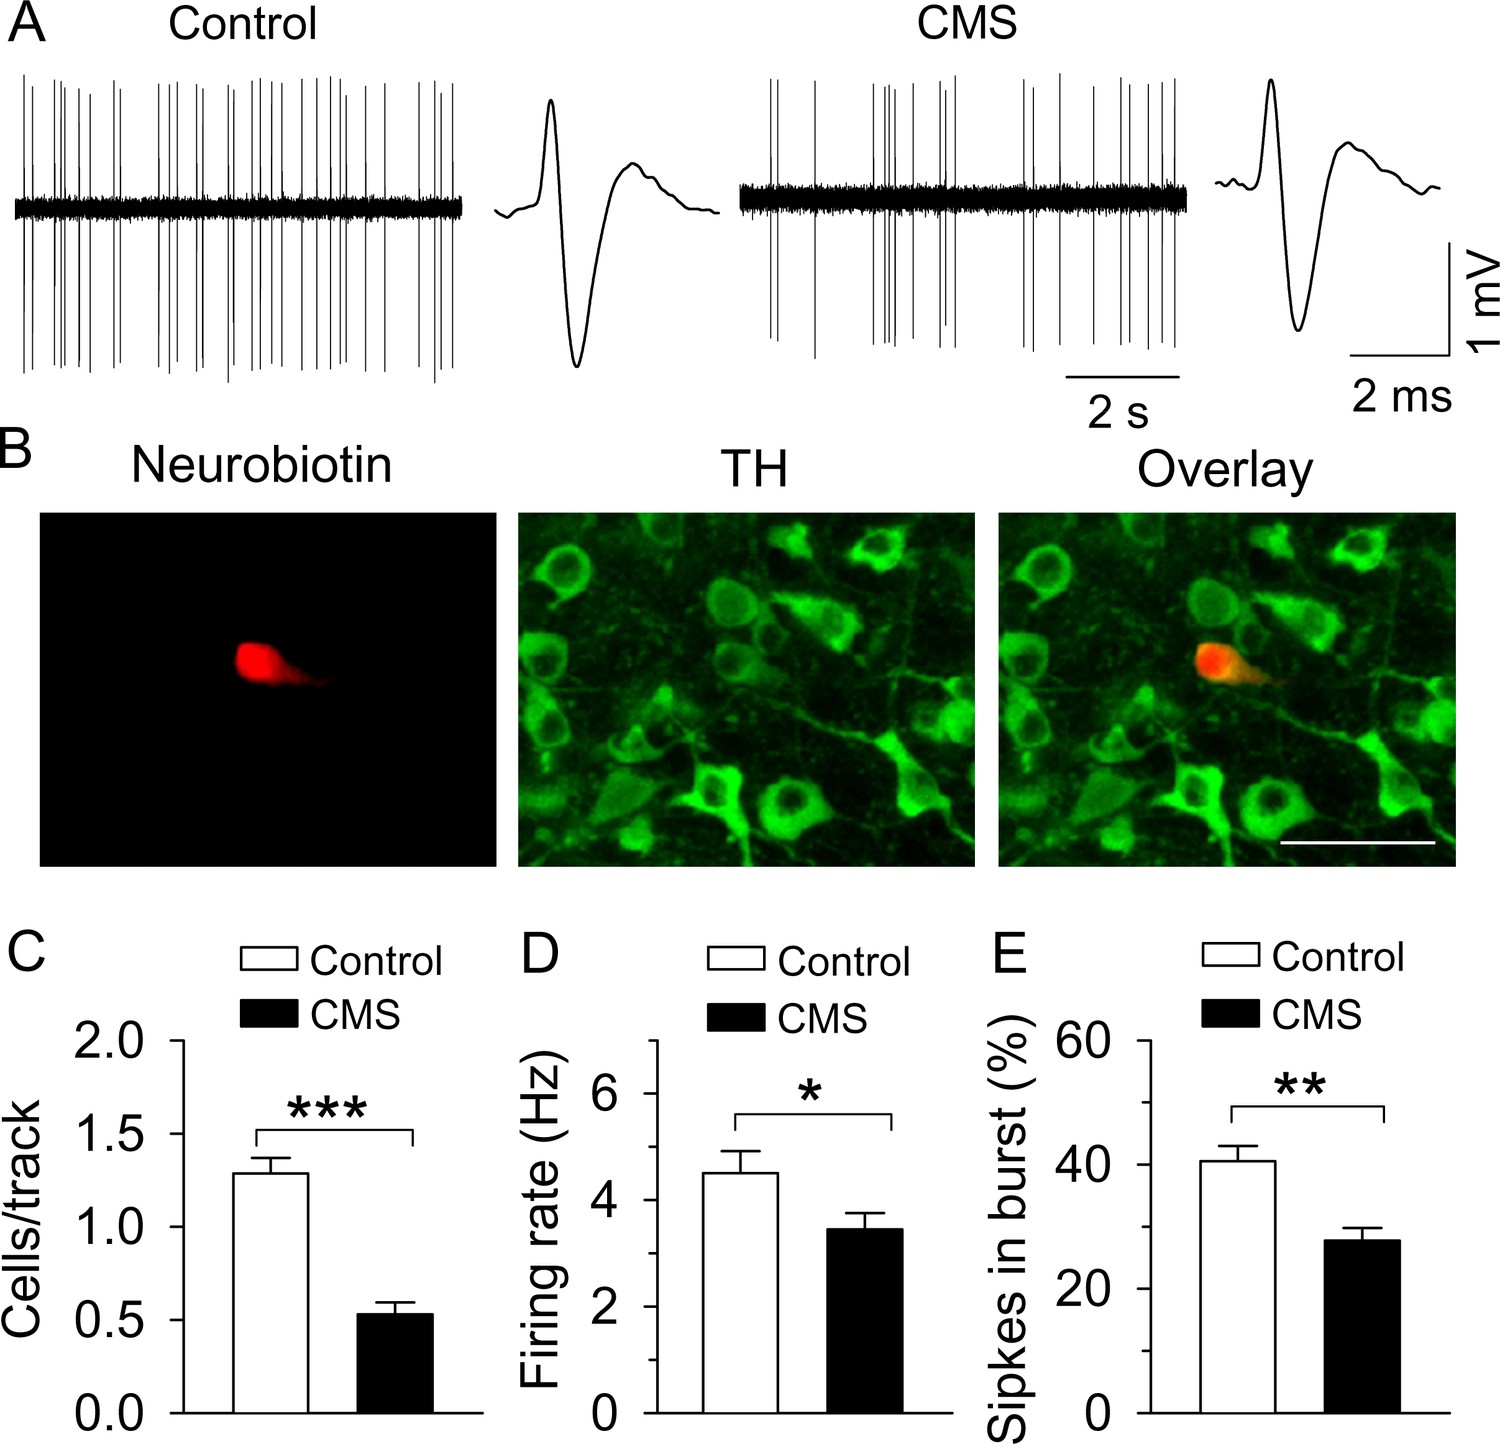
CMS decreased single-unit AP firing in VTA dopamine neurons in vivo.
(A) Sample traces of VTA dopamine neuron AP firing in control and CMS mice. Dopamine neurons were identified by a broad triphasic extracellular action potential of a width greater than 2 ms and a relatively slow firing rate (<10 Hz). (B) A recorded dopamine neuron was confirmed by neurobiotin (red) and TH (tyrosine hydroxylase, green) co-localization. (C–E) Population activity (C, ***p<0.001, control, n = 4 mice; CMS n = 5 mice), firing rate (D) *p=0.045, control, n = 15 cells from four mice; CMS, n = 17 cells from five mice), and the percent of spikes in burst (E, **p=0.006, control, n = 10 cells from four mice; CMS, n = 13 cells from five mice) were decreased in CMS mice.
-
Figure 2—source data 1
In vivo VTA dopamine neuron firing following CMS in Figure 2C–E.
- https://doi.org/10.7554/eLife.32420.006
Figure 3
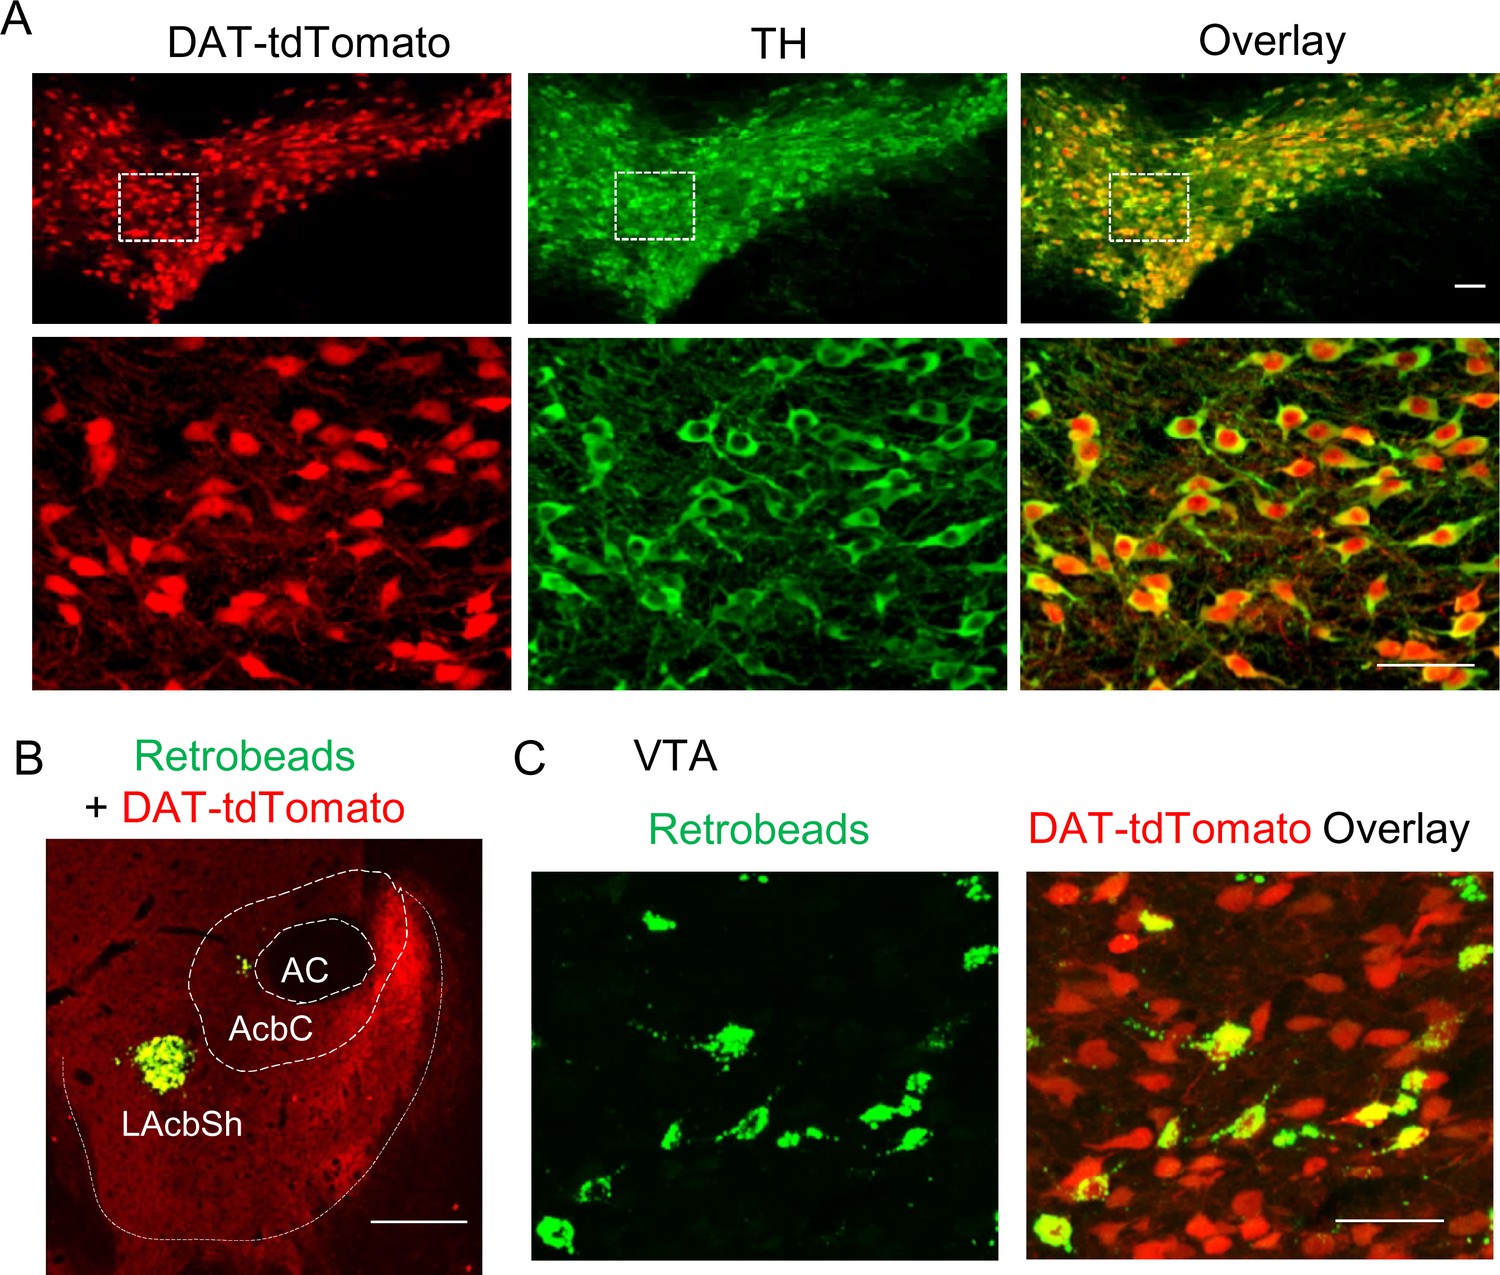
Retrobead labeling of VTA dopamine neurons that project to the lateral shell of the NAc.
(A) DAT-Cre mice were bred with Ai9 reporter mice, which express tdTomato in the presence of Cre, to produce DAT-tdTomato mice. TdTomato and TH (green) were completely co-localized, indicating that tdTomato expression provides faithful reporting of dopamine neurons for slice physiology. (B) Green Retrobeads were injected into the lateral shell of the NAc (LAcbSh) in DAT-tdTomato mice. (C) The Retrobeads were retrogradely transported to the VTA and were predominantly co-localized with tdTomato-positive VTA dopamine neurons.
Figure 4 with 1 supplement
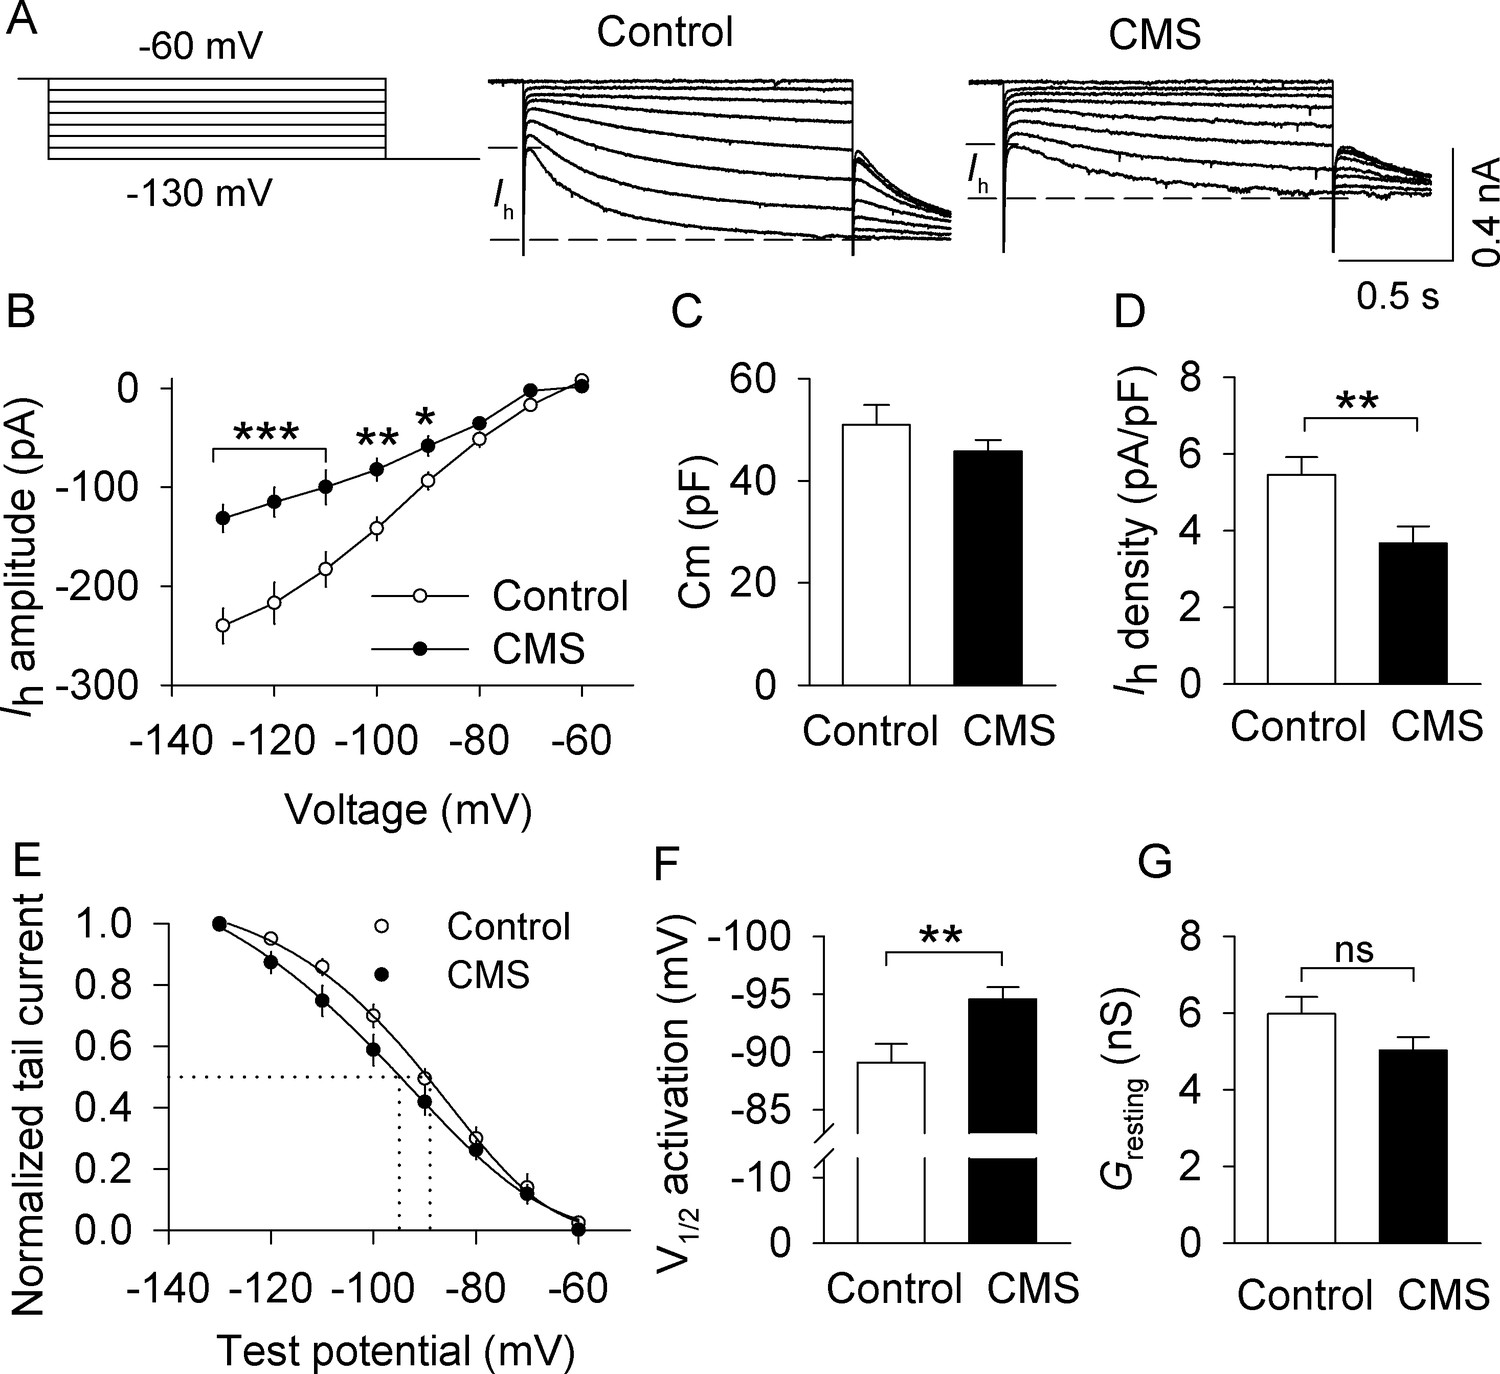
CMS decreased Ih currents in VTA dopamine neurons that project to the lateral shell of the NAc (LAcbSh).
(A) Left: Voltage protocol for recording Ih current. Right: Representative Ih current recorded from NAc-projecting VTA dopamine neurons in control and CMS mice. (B) Compared with the control group, Ih amplitude was significantly decreased in the CMS group at corresponding hyperpolarization potentials (*p<0.05, **p<0.01, ***p<0.001, control, n = 15 cells from five mice; CMS, 13 cells from three mice from B to G). Ih amplitude was calculated by subtracting the instantaneous current from the steady-state current achieved during the voltage step. (C) The membrane capacitance (Cm) was not significantly different between control and CMS mice (p=0.273). (D) Ih current density was significantly decreased in the CMS group compared with the control group (**p=0.009). (E) Ih activation curves in the control and CMS groups generated by the tail current protocol. Tail current amplitudes were fitted with a Boltzmann function. (F) CMS led to a significant hyperpolarizing shift of the half-activation potential (V1/2) compared with that of control (**p=0.007). (G) The resting membrane conductance (Gresting) was not significantly different between control and CMS mice (p=0.107).
-
Figure 4—source data 1
Ih amplitude and activation properties in VTA dopamine neurons following CMS in Figure 4B–G.
- https://doi.org/10.7554/eLife.32420.010
Figure 4—figure supplement 1
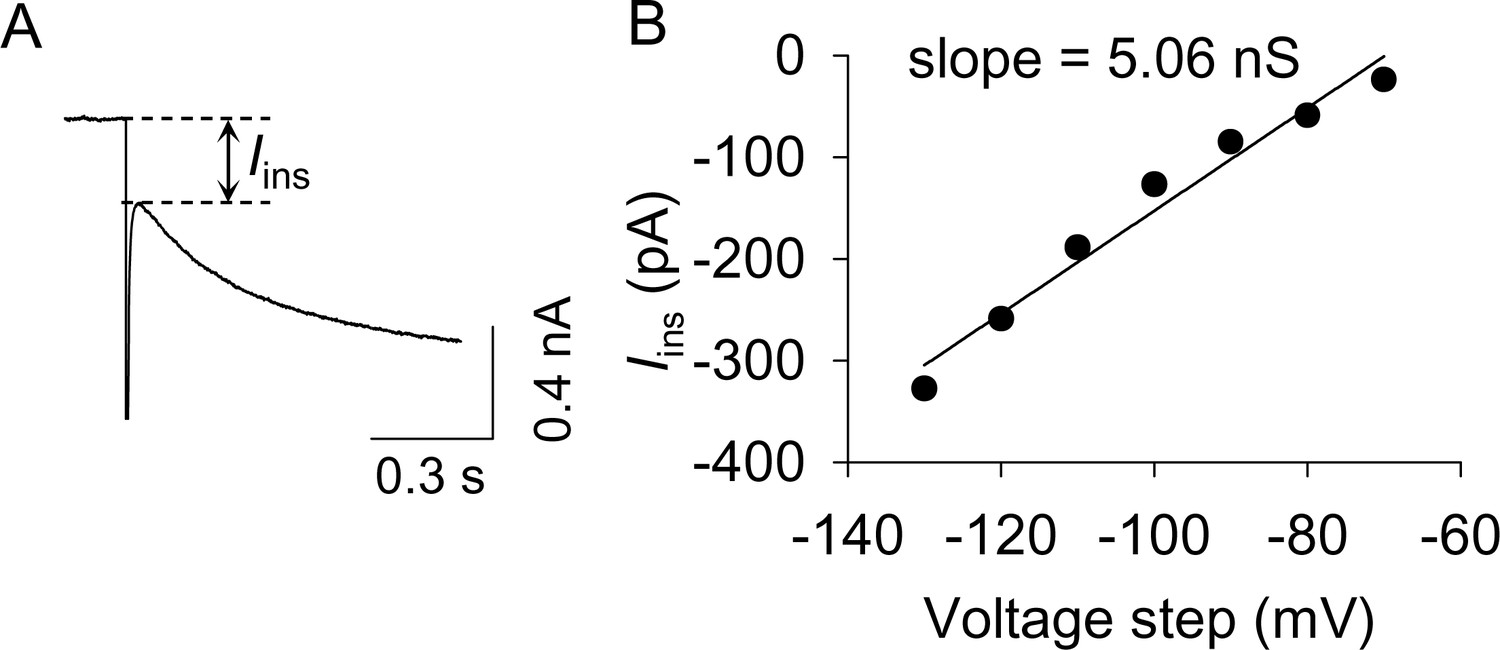
The measurement of resting membrane conductance.
(A) The instantaneous inward current (Iins) was measured as indicated by the dashed lines. (B) A representative example for calculating resting membrane conductance. Iins was plotted against the hyperpolarizing voltage steps. The slope of these I-V curves is indicative of the resting membrane conductance shown in Figure 4G.
Figure 5
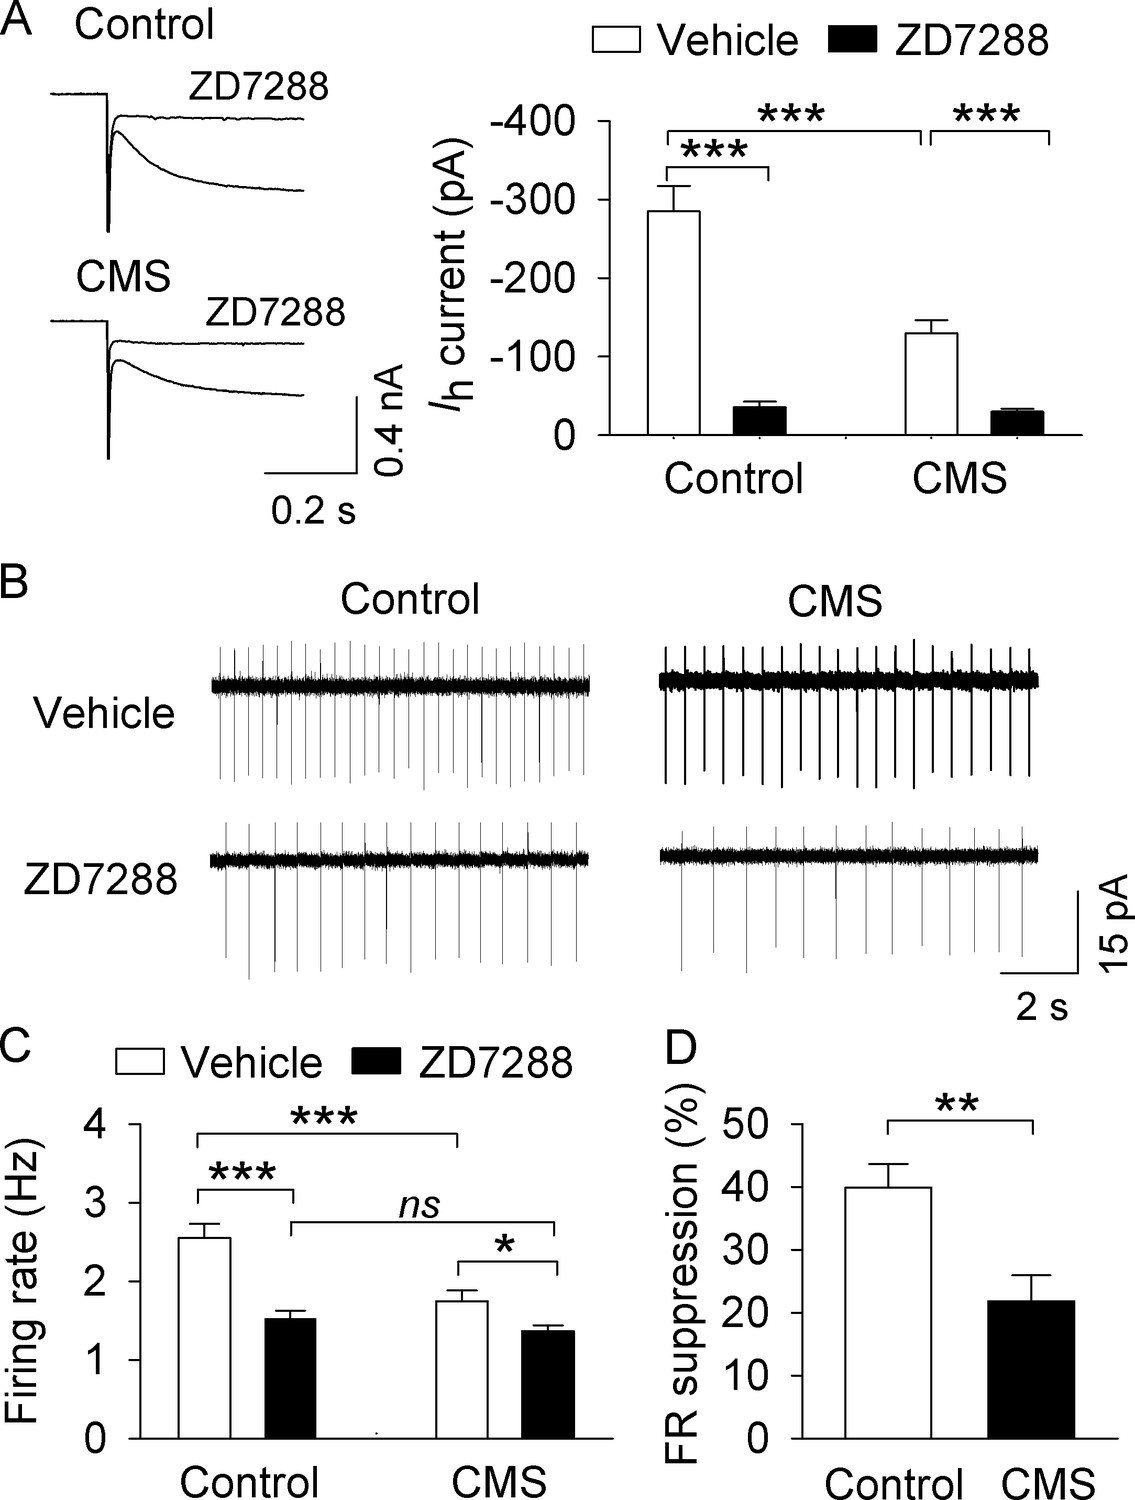
, CMS decreased AP firing in VTA dopamine neurons in midbrain slices.
(A) Ih currents recorded at −130 mV in NAc-projecting VTA dopamine neurons in both control (***p<0.001, n = 6 cells from three mice) and CMS groups (***p<0.001, n = 6 cells from three mice) were abolished by the Ih channel blocker ZD7288 (30 μM). (B) Representative AP firing in cell-attached recordings from NAc-projecting VTA dopamine neurons in control and CMS slices before and after ZD7288 (30 µM). (C) The AP firing rate was significantly decreased in the CMS group (n = 13 cells from three mice) compared with the control group (n = 12 cells from four mice; ***p<0.001). ZD7288 significantly decreased the firing rate in both control (n = 11 cells from three mice) and CMS (n = 12 cells from five mice) groups (*p<0.5, ***p<0.001). The mean firing rate was not significantly different between control (n = 11 cells from three mice) and CMS (n = 12 cells from four mice) groups following ZD7288 (p=0.382). (D) The firing rate (FR) suppression (%) by ZD7288 in the control group (n = 11 cells from three mice) was significantly higher than that of the CMS group (n = 12 cells from five mice; **p=0.004).
-
Figure 5—source data 1
Effects of ZD7288 on Ih current and ex vivo AP firing in VTA dopamine neurons following CMS in Figure 5A,C,D.
- https://doi.org/10.7554/eLife.32420.012
Figure 6 with 1 supplement
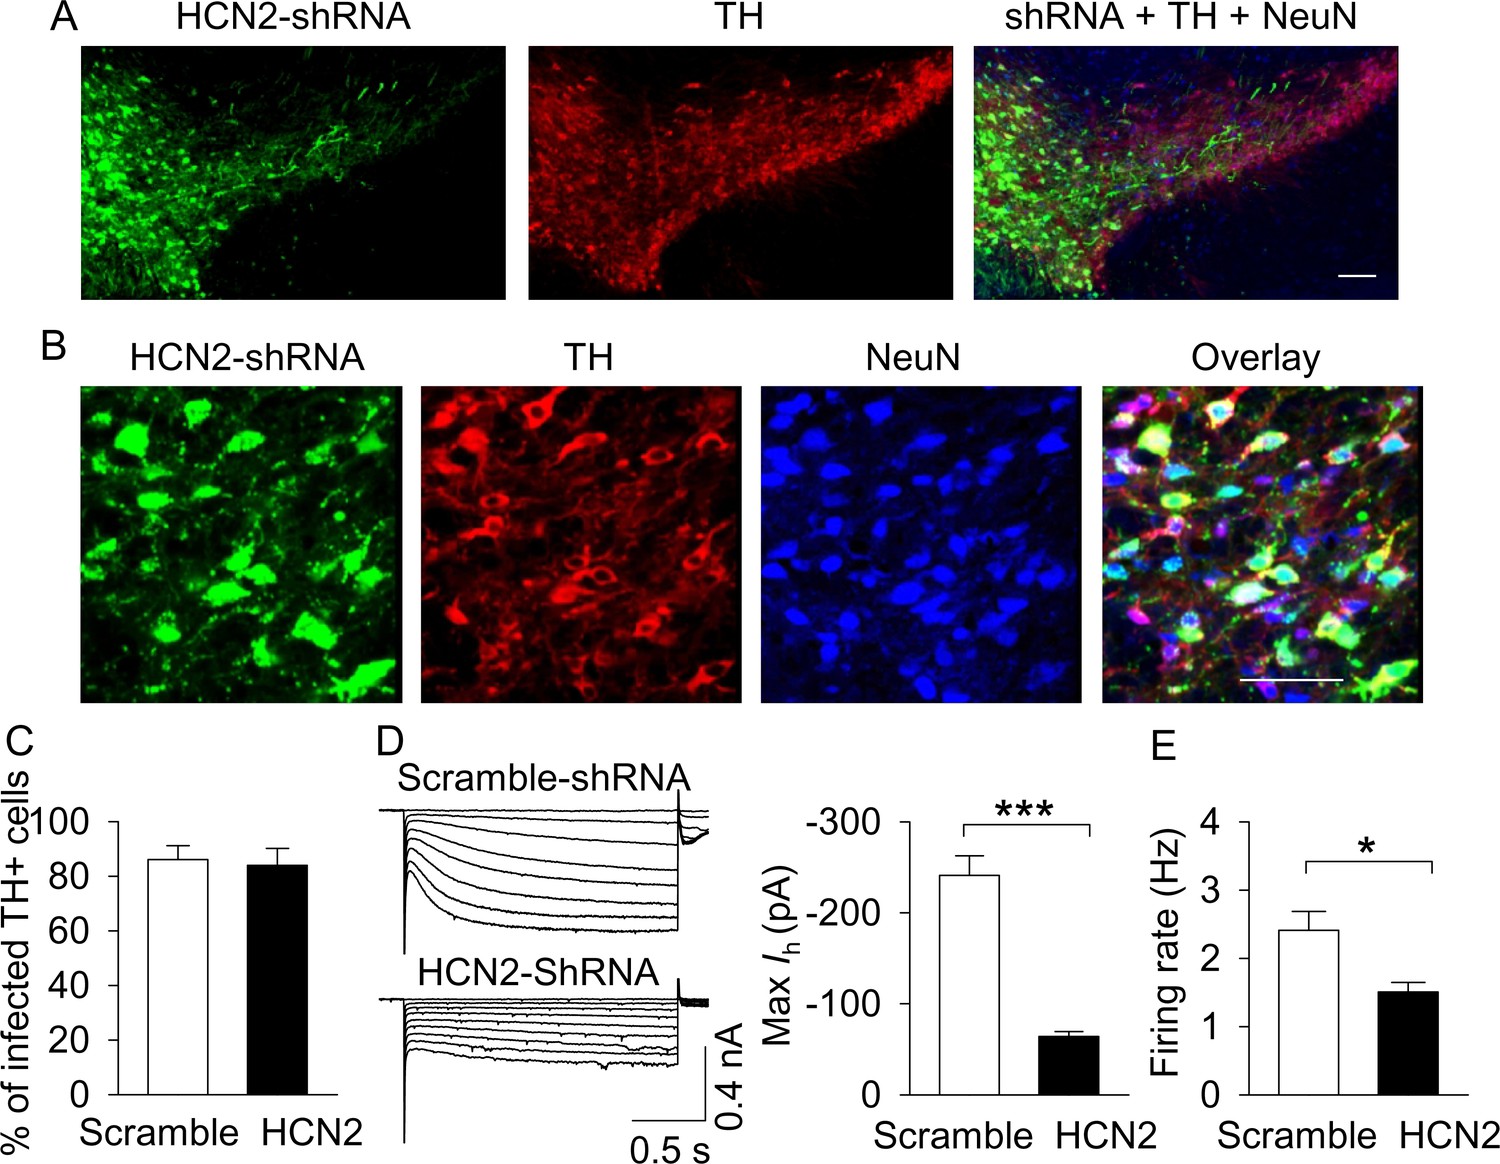
AAV-mediated shRNA knockdown of HCN2 in the VTA.
(A,B), Immunofluorescence labeling showing the expression of AAV2-HCN2-shRNA-eGFP (green), TH (dopamine neuron marker, red) and NeuN (neuronal marker, blue) in the midbrain under low magnification (A) and high magnification (B). Scale bars: 50 µm. (C), The percentage of TH+ VTA dopamine neurons that were infected with AAV2-HCN2-shRNA-eGFP or scramble-shRNA (n = 3 mice/group). (D), Maximal Ih current amplitude was significantly decreased in AAV2-HCN2-shRNA-eGFP-infected dopamine neurons (n = 14 from three mice) compared with AAV2-scramble-shRNA-eGFP-infected dopamine neurons (n = 15 from four mice; ***p<0.001). (E), AP firing frequency was decreased in AAV2-HCN2-shRNA-GeFP-infected neurons (n = 10 from three mice) compared with AAV2-scramble-shRNA-eGFP-infected neurons (n = 9 from four mice; *p=0.036).
-
Figure 6—source data 1
Ih current and AP firing following shRNA-mediated HCN2 knockdown in Figure 6C–E.
- https://doi.org/10.7554/eLife.32420.015
Figure 6—figure supplement 1
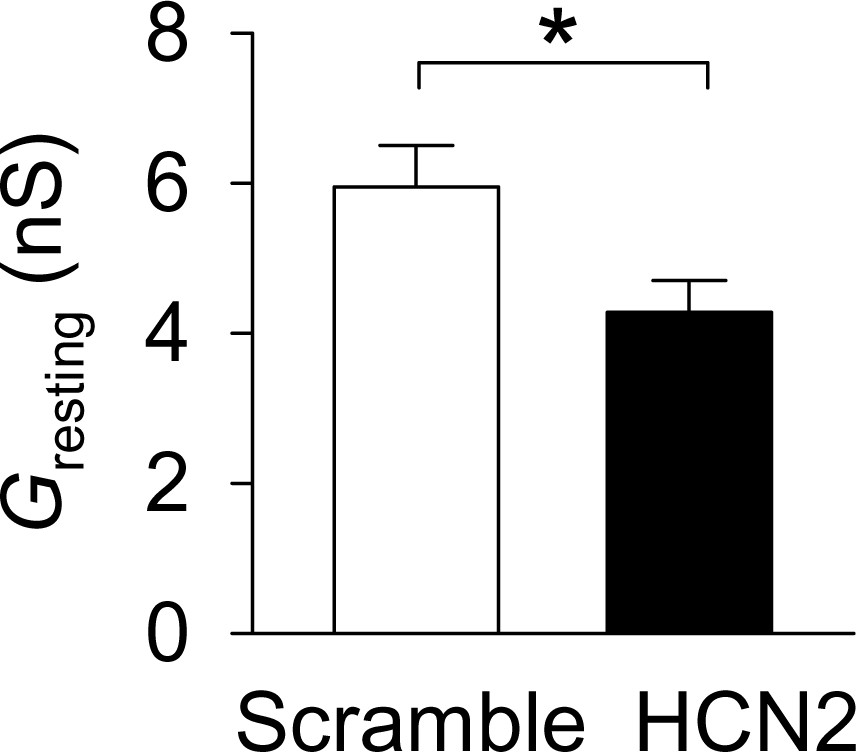
The resting conductance (Gresting) was significantly decreased in the HCN-shRNA group (n = 14) compared with the scrambled group (n = 15, *p=0.022).
https://doi.org/10.7554/eLife.32420.014
Figure 7
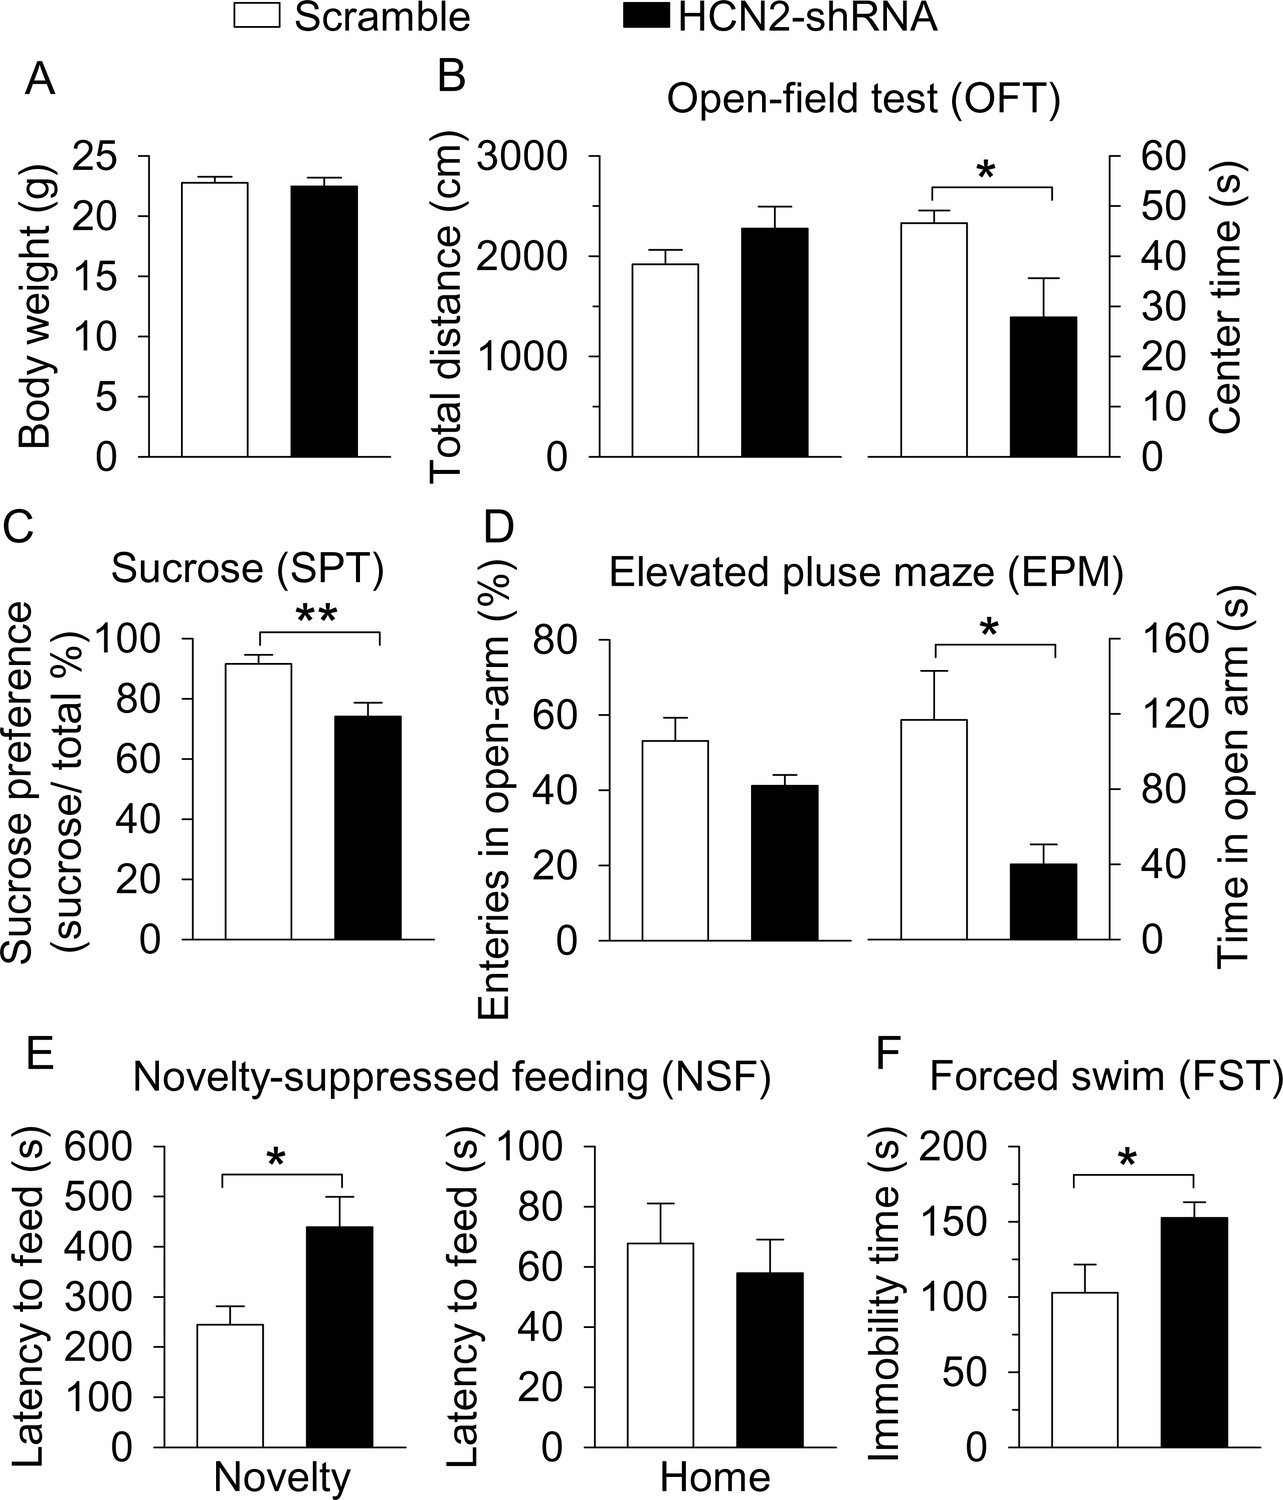
ShRNA knockdown of HCN2 in the VTA produced anxiety- and depressive-like behaviors.
(A) VTA-specific HCN2 knockdown did not significantly affect the body weight of mice (control, n = 7 mice; CMS, n = 7 mice; p=0.727). (B) HCN2 knockdown significantly decreased the center time (*p=0.042) without affecting the total distance traveled (p=0.197) in the OFT. (C) HCN2 knockdown significantly decreased sucrose preference (**p=0.003). (D) HCN2 knockdown did not affect entries into the open arms (p=0.104) but significantly decreased time spent in the open arms (*p=0.018) in the EPM test. (E) HCN2 knockdown increased the latency to feed in the novel environment (Novelty) in the NSF test (*p=0.017) but did not significantly affect the latency to feed in the home cage (Home; p=0.583). (F) HCN2 knockdown increased immobility time in the FST (*p=0.039).
-
Figure 7—source data 1
Body weight and behavior following VTA HCN2 knockdown in Figure 7A–F.
- https://doi.org/10.7554/eLife.32420.017
Figure 8
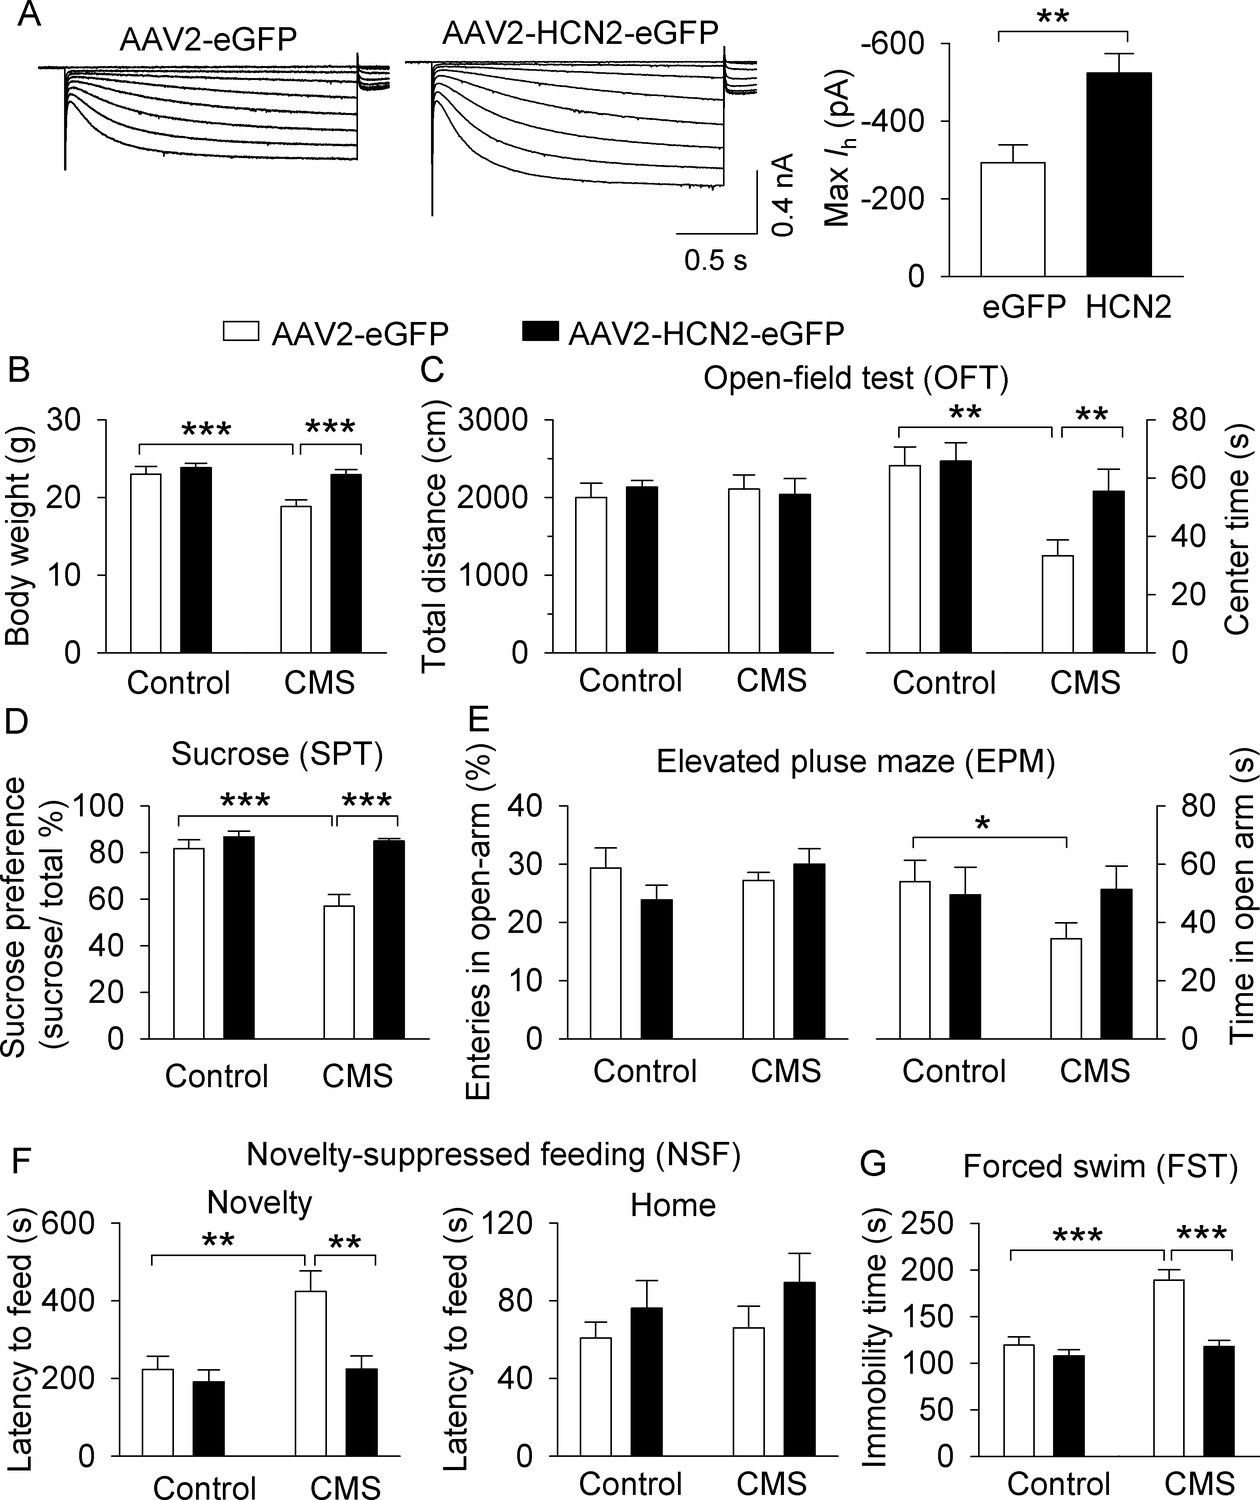
Overexpression of HCN2 in the VTA prevented the development of CMS-induced depressive-like behavior.
(A) The maximal amplitude of Ih current in AAV2-HCN2-eGFP-infected VTA dopamine neurons (n = 15 from four mice) was significantly increased compared with that in AAV2-eGFP-infected VTA dopamine neurons (n = 14 cells from five mice; **p=0.002). (B) CMS significantly decreased the body weight of mice in the AAV2-eGFP injection group (***p<0.001, control, n = 9 mice; CMS, n = 10 mice from B to G), whereas CMS did not decrease the body weight of mice in the HCN2 overexpression group (p=0.419, control, n = 10 mice; CMS, n = 8 mice from B to G). (C) Neither CMS nor HCN2 overexpression affected the total distance traveled in the OFT test (p>0.05). Compared with non-stressed control mice, CMS significantly decreased the time spent in the center square of the open field in the AAV2-eGFP group (**p=0.002), and this decrease was prevented by HCN2 overexpression (**p=0.004). (D) CMS significantly decreased sucrose preference in the AAV2-eGFP injection group (***p<0.001), whereas HCN2 overexpression prevented this decrease (***p<0.001). (E) In the AAV2-GFP group, CMS significantly decreased time spent in the open arms (*p=0.023) but did not affect open arm entries (p>0.05). HCN2 overexpression did not significantly affect open arm time nor entries (p=0.057) compared to the AAV2-GFP group. (F) CMS induced a significant increase in the latency to feed in the novel environment in the NSF test (**p=0.002), which was prevented by HCN2 overexpression (**p=0.001). Neither CMS nor HCN2 overexpression affected the latency to feed in the home cage (p>0.05). (G) CMS produced a significant increase in immobility in the FST (***p<0.001), and this increase was prevented by HCN2 overexpression (***p<0.001).
-
Figure 8—source data 1
VTA HCN2 overexpression effects on Ih current and CMS-induced changes in body weight and behavior in Figure 8A–G.
- https://doi.org/10.7554/eLife.32420.019
Tables
Key resources table
| Reagent type (species) or resource | Designation | Source or reference | Identifiers | Additional information |
|---|---|---|---|---|
| Strain, strain background (Mus musculus) | male C57BL/6J mice | The Jackson Laboratory | Stock#: 000664 RRID:IMSR_JAX:000664 | |
| Genetic reagent (Mus musculus) | male heterozygous Slc6a3Cre+/− (DAT-Cre) mice | The Jackson Laboratory | Stock#: 006660 RRID:IMSR_JAX:006660 | maintained on the C57BL/6J background |
| Genetic reagent (Mus musculus) | male Ai9 reporter mice | The Jackson Laboratory | Stock#: 007909 RRID:IMSR_JAX:007909 | maintained on the C57BL/6J background |
| Strain, strain background (Adeno-associated virus) | AAV2.shRNA.U6.ShRLuc. CMV.eGFP.SV40 | shRNA provided by Dr. Han-gang Yu (PMID: 19236845), packed into AAV2 at Penn Vector Core | ||
| Strain, strain background (Adeno-associated virus) | AAV2.scramble.U6.ShRLuc. CMV.eGFP.SV40 | Penn Vector Core | ||
| Strain, strain background (Adeno-associated virus) | AAV2.CMV.PI.HCN2. WPRE.eGFP.SV40 | HCN2 plasmid packed into AAV2 at Penn Vector Core | HCN2 plasmid provided by Dr. Dane Chetkovich at Northwestern University | |
| Strain, strain background (Adeno-associated virus) | AAV2.CMV.PI.eGFP.WPRE.bGH | Penn Vector Core | ||
| Antibody | Mouse anti-TH | Santa Cruz Biotechnology | SC-136100, Lot: G1309, RRID:AB_2287193 | monoclonal, 1:300 |
| Antibody | Rabbit anti-TH | Santa Cruz Biotechnology | SC-14007, Lot: C2707, RRID:AB_671397 | polyclonal, 1:300 |
| Antibody | Rabbit anti-NeuN | Millipore | ABN78, Lot: 2702139, RRID:AB_10807945 | polyclonal, 1:400 |
| Antibody | anti-mouse IgG Alexa Fluor 555 | Cell Signaling | Stock #4409, RRID:AB_1904022 | Goat anti-mouse, 1:300 |
| Antibody | anti-rabbit IgG Alexa Fluor 647 | Invitrogen | A21245, Lot: 1445259, RRID:AB_141775 | Goat anti-rabbit, 1:100 |
| Antibody | anti-mouse IgG Alexa Fluor 488 | Cell Signaling | Stock #4408, RRID:AB_10694704 | Goat anti-mouse, 1:300 |
| Antibody | anti-rabbit IgG Alexa Fluor 488 | Cell Signaling | Stock #4412, RRID:AB_1904025 | Goat anti-rabbit, 1:500 |
| Other | neurobiotin tracer | Vector Laboratories | SP-1120, RRID:AB_2336606 | 1.5% |
| Other | Texas Red avidin D | Vector Laboratories | A-2006, RRID:AB_2336751 | 1:100 |
| Software (Sigmaplot 11.2) | RRID:SCR_003210 |
Table 1
Experimental schedule for the chronic mild stress (CMS) procedure in mice
https://doi.org/10.7554/eLife.32420.020| Week | Monday | Tuesday | Wednesday | Thursday | Friday | Saturday | Sunday |
|---|---|---|---|---|---|---|---|
| 1 | Cold Wet bedding | Restraint No bedding | Light inversion Cage tilt | Cage rotation Strobe | Cold Food and water deprivation | Restraint Overcrowding | Light inversion Wet bedding |
| 2 | Cold Cage tilt | Cage rotation Food and water deprivation | Restraint Wet bedding | Rat bedding Strobe | Light inversion No bedding | Cage rotation Food and water deprivation | Cold Wet bedding |
| 3 | Rat bedding Strobe | Restraint Light inversion | Cage rotation No bedding | Light inversion Food and water deprivation | Cold Wet bedding | Cage tilt Strobe | Light inversion Overcrowding |
| 4 | Cold No bedding | Restraint Food and water deprivation | Cage rotation Strobe | Rat bedding Light inversion | Cold Cage tilt | Restraint Wet bedding | Cage rotation No bedding |
| 5 | Cold Food and water deprivation | Cage rotation Strobe | Light inversion Wet bedding | Cold Cage tilt | Cage rotation No bedding | Light inversion Overcrowding | Restraint Cage tilt |
Additional files
-
Supplementary file 1
Statistical results for Figure 1—figure supplement 1.
Abbreviations: CMS, chronic mild unpredictable stress; EPM, elevated plus maze; FST, forced swimming test; NSF, novelty-suppressed feeding; OFT, open field test; SPT, sucrose preference test
- https://doi.org/10.7554/eLife.32420.021
-
Transparent reporting form
- https://doi.org/10.7554/eLife.32420.022
Download links
A two-part list of links to download the article, or parts of the article, in various formats.
Downloads (link to download the article as PDF)
Open citations (links to open the citations from this article in various online reference manager services)
Cite this article (links to download the citations from this article in formats compatible with various reference manager tools)
HCN2 channels in the ventral tegmental area regulate behavioral responses to chronic stress
eLife 7:e32420.
https://doi.org/10.7554/eLife.32420


