SIRT2 and lysine fatty acylation regulate the transforming activity of K-Ras4a
- Cornell University, United States
- Cornell University College of Veterinary Medicine, United States
- Howard Hughes Medical Institute, Cornell University, United States
Figures
Figure 1 with 1 supplement
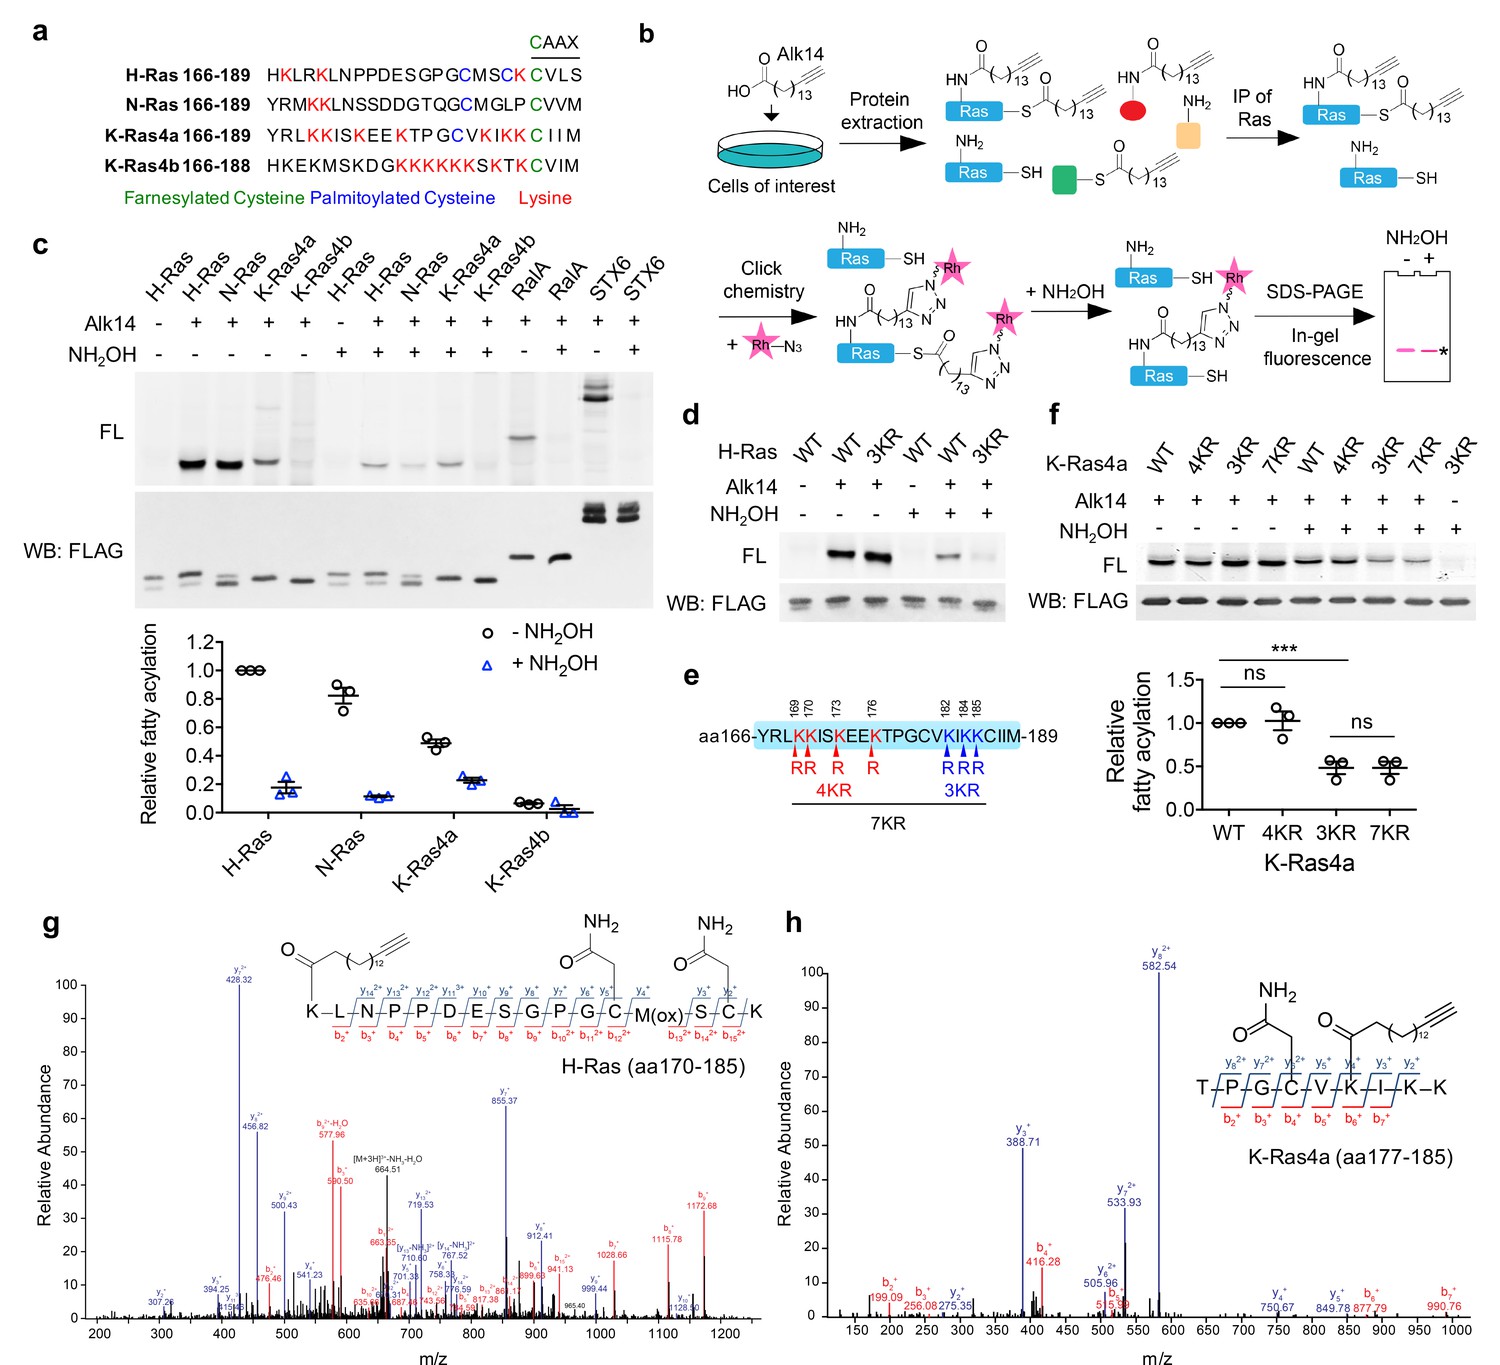
H-Ras and K-Ras4a contain lysine fatty acylation.
(a) Amino acid sequences of the HVRs of Ras proteins. (b) Scheme showing the Alk14 metabolic labeling method to study lysine fatty acylation. (c) In-gel fluorescence detection of the fatty acylation levels of Ras proteins, RalA and STX6 in HEK293T cells (top panel), and quantification of the relative fatty acylation levels (bottom panel). The fatty acylation level of H-Ras without NH2OH treatment was set to 1. (d) In-gel fluorescence showing the fatty acylation levels of H-Ras-WT and -3KR mutant without or with NH2OH treatment. (e) Scheme showing the lysine to arginine mutants (4KR, 3KR, and 7KR) used to identify potential fatty acylation sites. (f) In-gel fluorescence showing the fatty acylation levels of K-Ras4a-WT and KR mutants without or with NH2OH treatment (top panel) and quantification of fatty acylation levels with NH2OH treatment relative to that of K-Ras4a-WT (bottom panel). (g, h) Tandem mass (MS/MS) spectrum of triply charged H-Ras (g) and K-Ras4a (h) peptides with Alk14-modification on K170 and K182, respectively. The b- and y-ions are shown along with the peptide sequence. The cysteine residues were carbamidomethylated due to iodoacetamide alkylation during sample preparation and methionine was oxidized. FL, fluorescence; WB, western blot. Statistical evaluation was by unpaired two-tailed Student’s t test. Error bars represent SEM in three biological replicates. ***p<0.001; ns, not significant. Representative images from three independent experiments are shown.
Figure 1—figure supplement 1
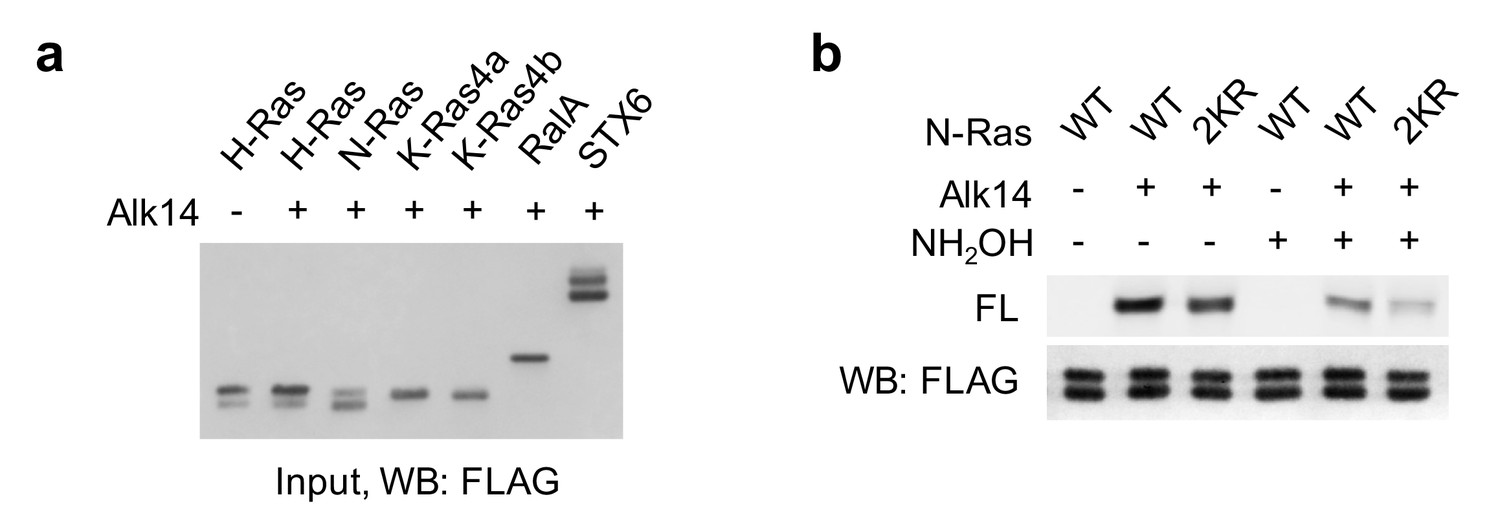
N-Ras proteins may be lysine fatty acylated.
(a) Representative western blot analyses of FLAG-tagged Ras protein, RalA and STX6 in whole cell extracts. (b) In-gel fluorescence showing the fatty acylation levels of N-Ras WT and 2KR mutant without or with NH2OH treatment. Representative images from three independent experiments are shown.
Figure 2 with 2 supplements

SIRT2 removes lysine fatty acylation from K-Ras4a.
(a, b) In-gel fluorescence detection of fatty acylation of H-Ras (a) and K-Ras4a (b) treated with 5 μM of SIRT1, 2, 3 and 6 without or with 1 mM of NAD in vitro. (c) Effect of SIRT2 KD on the fatty acylation level of H-Ras in HEK293T cells. (d, e) Effect of SIRT1 KD (d) and SIRT2 KD (e) on the fatty acylation level of K-Ras4a in HEK293T cells. (f) Quantification of the fatty acylation levels with NH2OH treatment in (c), (d) and (e). The fatty acylation level in the corresponding Ctrl KD was set to 1. (g) Effect of overexpressing SIRT2-WT and SIRT2-HY catalytic mutant on K-Ras4a fatty acylation level. (h) Fatty acylated lysine in K-Ras4a detected by formation of 32P-labeled fatty acyl-ADPR using 32P-NAD. (i) Lysine fatty acylation of endogenous K-Ras4a in Ctrl and SIRT2 KD (by shSIRT2-#2) HCT116 cells detected by Alk14 labeling and biotin pull-down. Sup, supernatant; Ac, H3K9 acetyl peptide; Myr, H3K9 myristoyl peptide. Statistical evaluation was by unpaired two-tailed Student’s t test. Error bars represent SEM in three biological replicates. *p<0.05; ns, not significant. Representative images from three independent experiments are shown.
Figure 2—figure supplement 1

SIRT2 regulates lysine fatty acylation of K-Ras4a.
(a) In-gel fluorescence detection of fatty acylation on H-Ras and K-Ras4a treated without or with 10 μM PfSir2A and 1 mM NAD in vitro. (b) Fatty acylation of K-Ras4a-3KR treated without or with 5 μM SIRT2 and 1 mM NAD in vitro. (c) High-performance liquid chromatography (HPLC) traces showing SIRT2 hydrolyzing myristoyl group from H3K9myr peptide but not K-Ras4a-C180myr peptide. The reaction with H3K9myr, SIRT2 and NAD serves as a control to show that SIRT2 was active. (d) Effect of SIRT2 KD on the fatty acylation level of N-Ras in HEK293T cells (e) Comparison of the activities of SIRT2-WT and SIRT2-HY on H3K9ac and H3K9myr peptides by HPLC-based in vitro assay. The conversion rates are shown on the right. (f) Acetylation of K-Ras4a in Ctrl or SIRT2 KD (by shSIRT2-#2) HEK293T cells treated with ethanol or TSA (1 μM) for 1 hr. The ‘*” points to the light chain of the anti-FLAG antibody, while the arrow points to K-Ras4a. (g) MS/MS spectrum of triply charged K-Ras4a peptide with palmitoylation on K182. The b- and y-ions are shown along with the peptide sequence. The cysteine residue was carbamidomethylated due to iodoacetamide treatment during sample preparation. (h) Subcellular fractionation showing the localization of SIRT2 and FLAG-K-Ras4a. (i) Co-IP of FLAG-K-Ras4a with endogenous SIRT2 in HEK293T cells. Representative images from three independent experiments are shown.
Figure 2—figure supplement 2
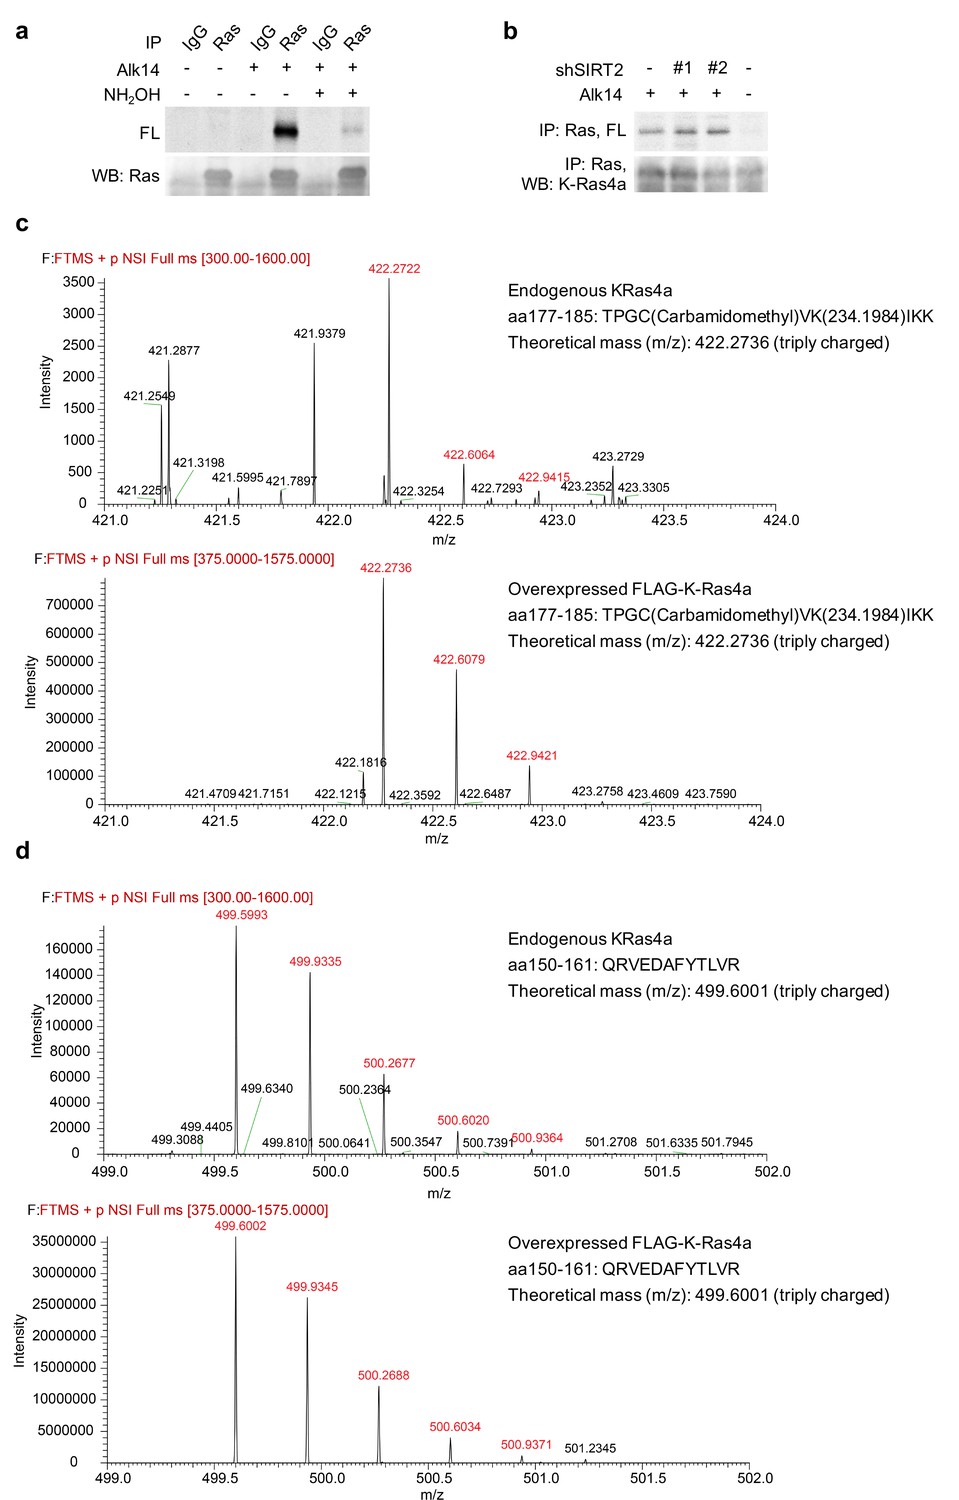
Endogenous K-Ras4a is lysine fatty acylated.
(a) In-gel fluorescence detection of fatty acylation on endogenous total Ras proteins immunoprecipiated from HCT116 cells. (b) Effect of SIRT2 KD on fatty acylation of endogenous Ras after NH2OH treatment. (c) Comparison of the MS spectra of Alk14-modified K-Ras4a aa177-185 peptide from endogenous Ras and overexpressed K-Ras4a. (d) Comparison of the MS spectra of K-Ras4a aa 150–161 peptide from endogenous Ras and overexpressed K-Ras4a. The ion intensities for the Alk14-modified aa177-185 and the unmodified aa 150–161 peptides were over 200 times lower than those from overexpressed K-Ras4a.
Figure 3 with 1 supplement
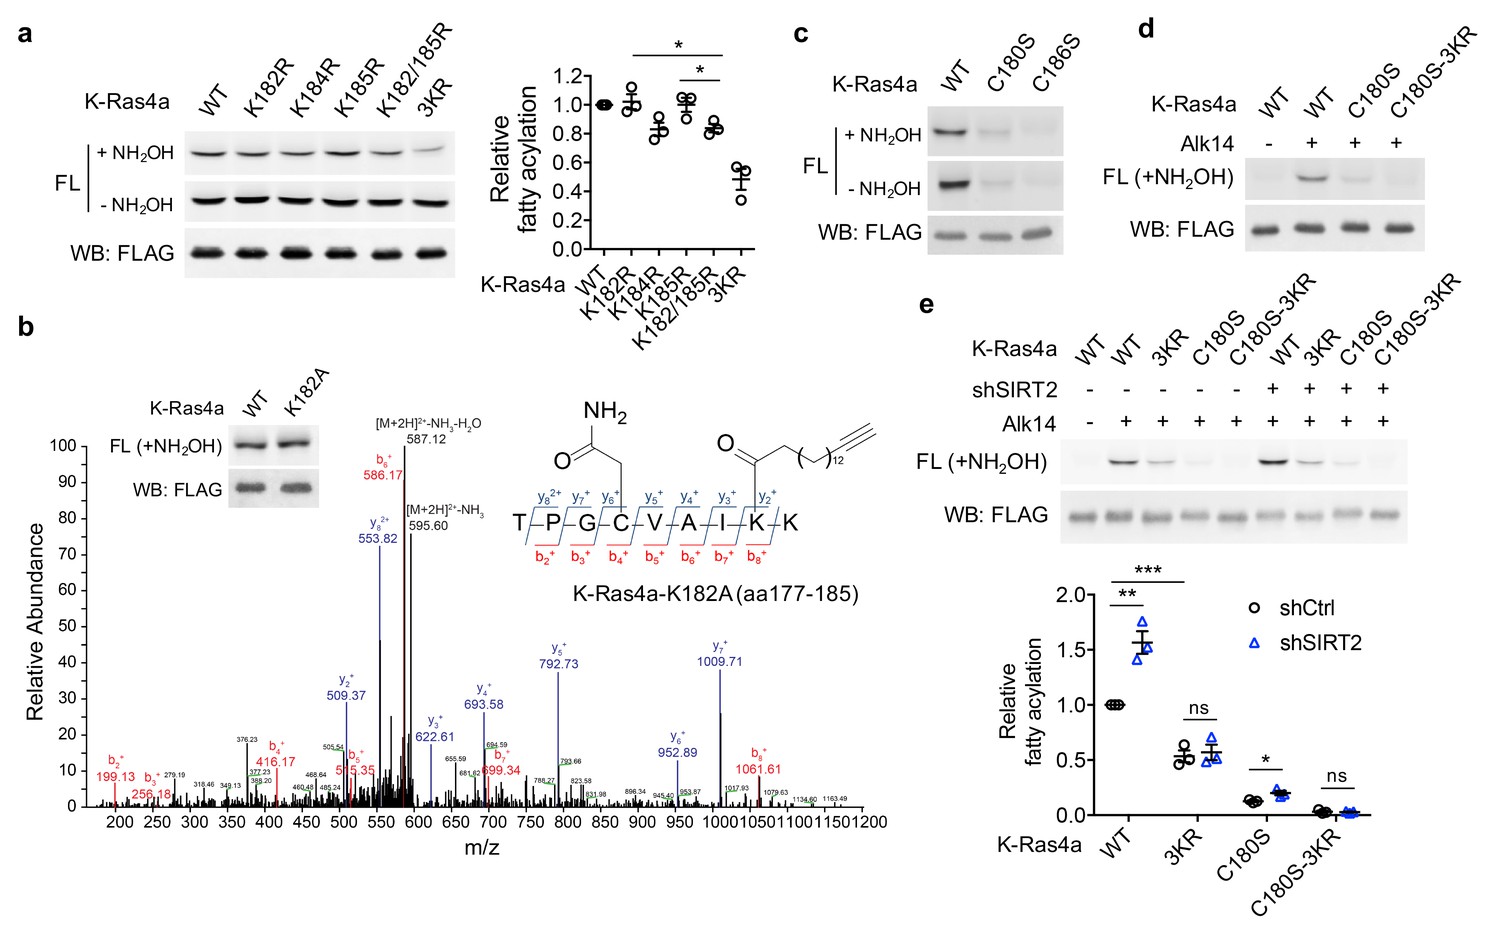
SIRT2 regulates lysine fatty acylation of K-Ras4a on K182/184/185.
(a) Fatty acylation levels of K-Ras4a-WT, -K182R, -K184R, -K185R, -K182/185R, and -3KR by in-gel fluorescence (left panel) and quantification of fatty acylation levels after NH2OH treatment relative to that of K-Ras4a-WT (right panel). (b) MS/MS spectrum of triply charged K-Ras4a-K182A peptide with Alk14 modification on K184. The b- and y-ions are shown along with the peptide sequence. The cysteine residue was carbamidomethylated due to iodoacetamide alkylation during sample preparation. Fatty acylation levels of K-Ras4a-WT and -K182A with NH2OH were also shown. (c) Fatty acylation levels of K-Ras4a-WT, -C180S, and -C186S. (d) Fatty acylation levels of K-Ras4a-WT, -C180S and -C180S-3KR after NH2OH treatment. (e) Fatty acylation levels of K-Ras4a-WT, -3KR, -C180S and -C180S-3KR after NH2OH treatment in Ctrl and SIRT2 KD (by shSIRT2-#2) HEK293T cells. Quantification of the fluorescent intensity relative to K-Ras4a-WT is shown in the bottom panel. Statistical evaluation was by unpaired two-tailed Student’s t test. Error bars represent SEM in three biological replicates. *p<0.05; **p<0.01; ***p<0.001. Representative images from three independent experiments are shown.
Figure 3—figure supplement 1
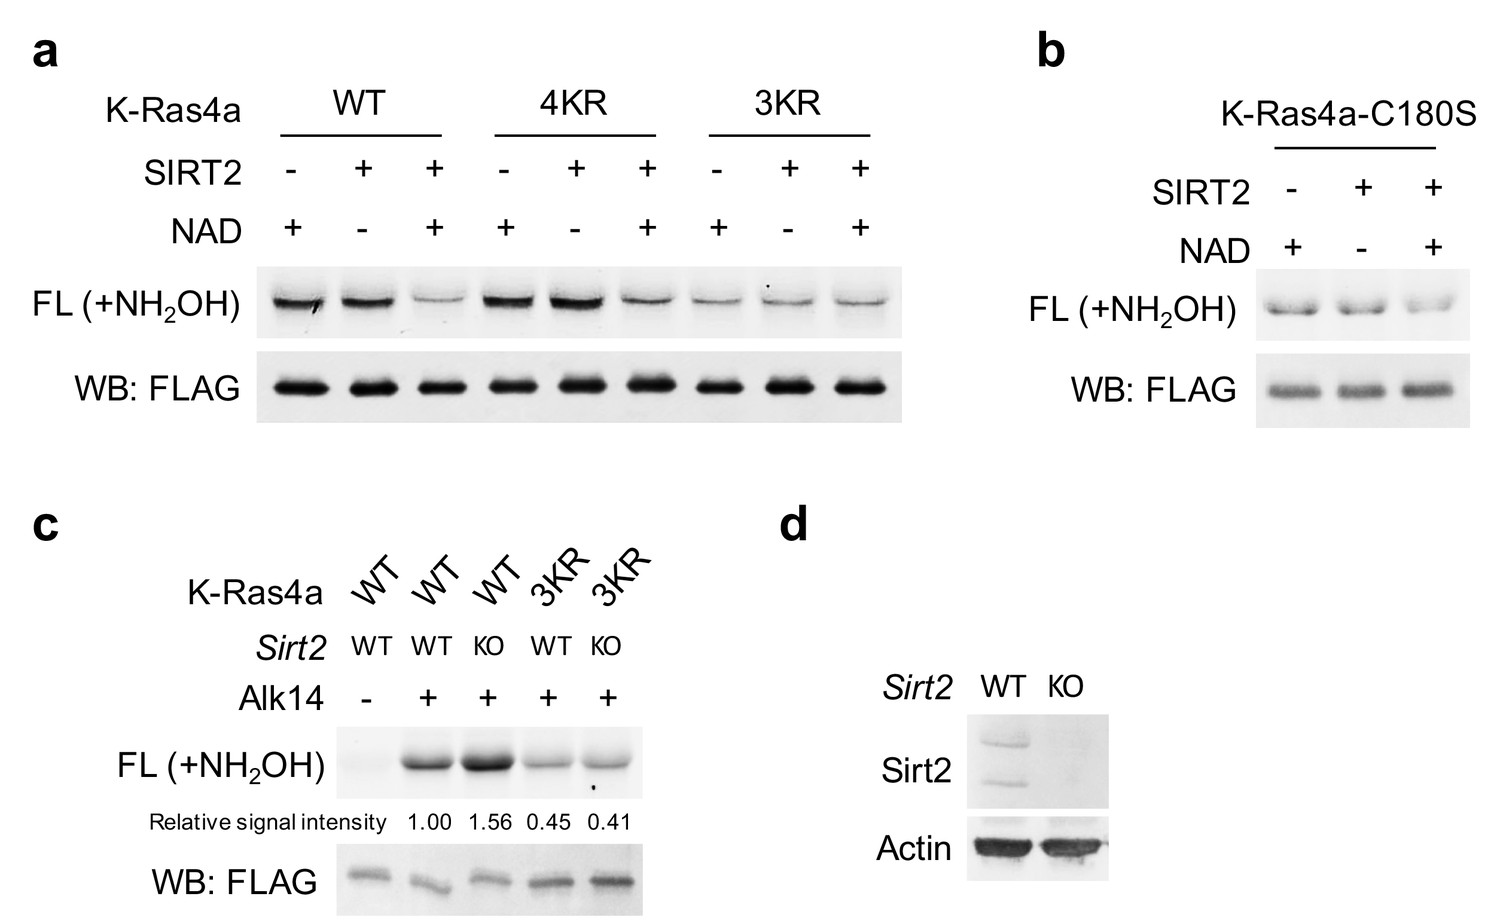
SIRT2 removes lysine fatty acylation from K-Ras4a-WT, −4KR and -C180S, but not −3KR.
(a, b) Representative images showing in-gel fluorescence detection of fatty acylation of K-Ras4a-WT, −4KR, −3KR (a) and -C180S (b) treated without or with 5 μM SIRT2 and 1 mM NAD in vitro. (c) In-gel fluorescence detection of fatty acylation on K-Ras4a-WT and −3KR in MEF sirt2 WT and KO cells after NH2OH treatment. (d) Western blot showing Sirt2 levels in MEF Sirt2 WT and KO cells. Representative images from three independent experiments are shown.
Figure 4 with 1 supplement
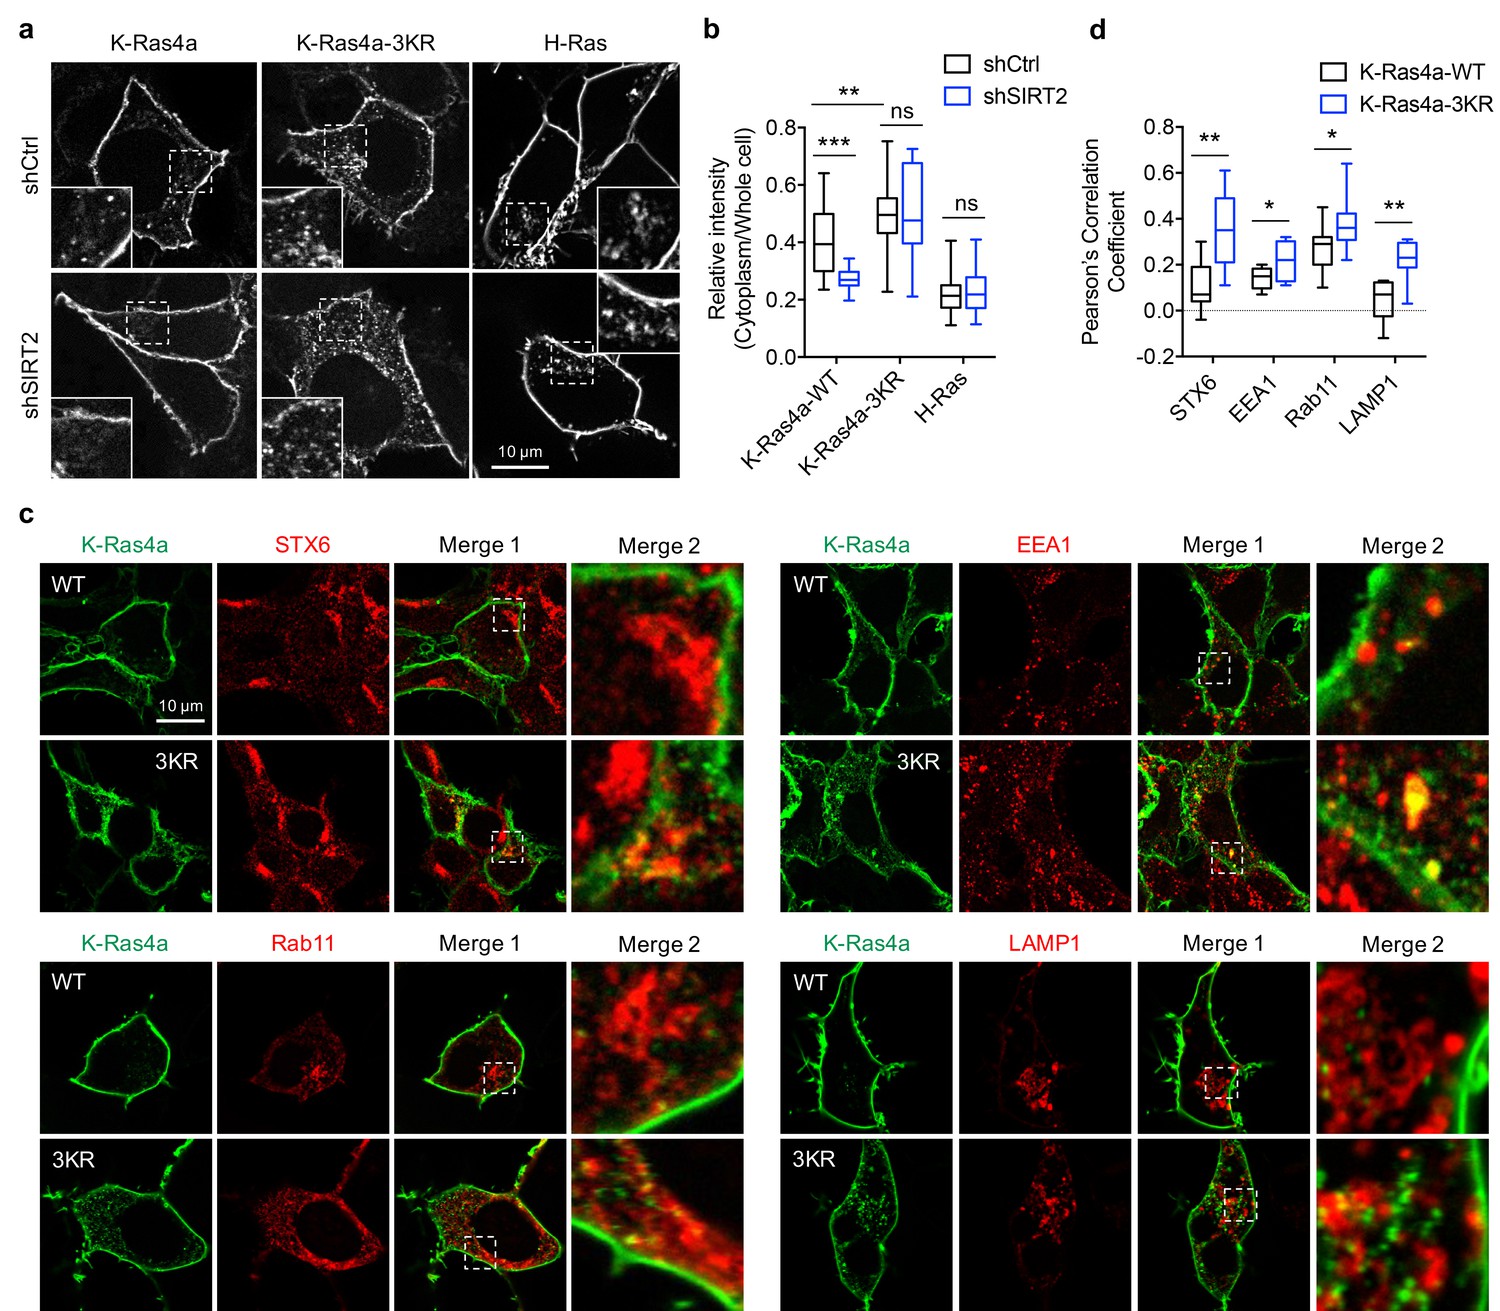
Lysine fatty acylation regulates subcellular localization of K-Ras4a.
(a) Confocal images showing subcellular localization of GFP-K-Ras4a-WT, -3KR, and GFP-H-Ras in HEK293T cells with Ctrl or SIRT2 KD (by shSIRT2-#2). Insets are magnifications of the regions enclosed by the white dashed squares. (b) Statistical analyses of the relative cytoplasm to whole cell intensity of K-Ras4a-WT, -3KR, and H-Ras from (a) (n = 16, 16, 16, 16, 21, 21 for each sample from left to right, respectively). (c) Images showing the colocalization of GFP-K-Ras4a-WT or-3KR with STX6, EEA1, Rab11, and LAMP1 in HEK293T cells. Merge 2 shows the magnified white dashed squares-enclosed regions in Merge 1. (d) Statistical analyses of the cytoplasmic colocalization of K-Ras4a-WT or -3KR with the indicated intracellular membrane markers from (c) using Pearson’s coefficient (n = 11, 11, 11, 11, 17, 17, 10, 10 cells for each sample from left to right, respectively). Statistical evaluation was by two-way ANOVA. Centre line of the box plot represents the mean value, box represents the 95% confidence interval, and whiskers represent the range of the values. *p<0.05; **p<0.01; ***p<0.001; ns, not significant. Representative images are shown.
Figure 4—figure supplement 1
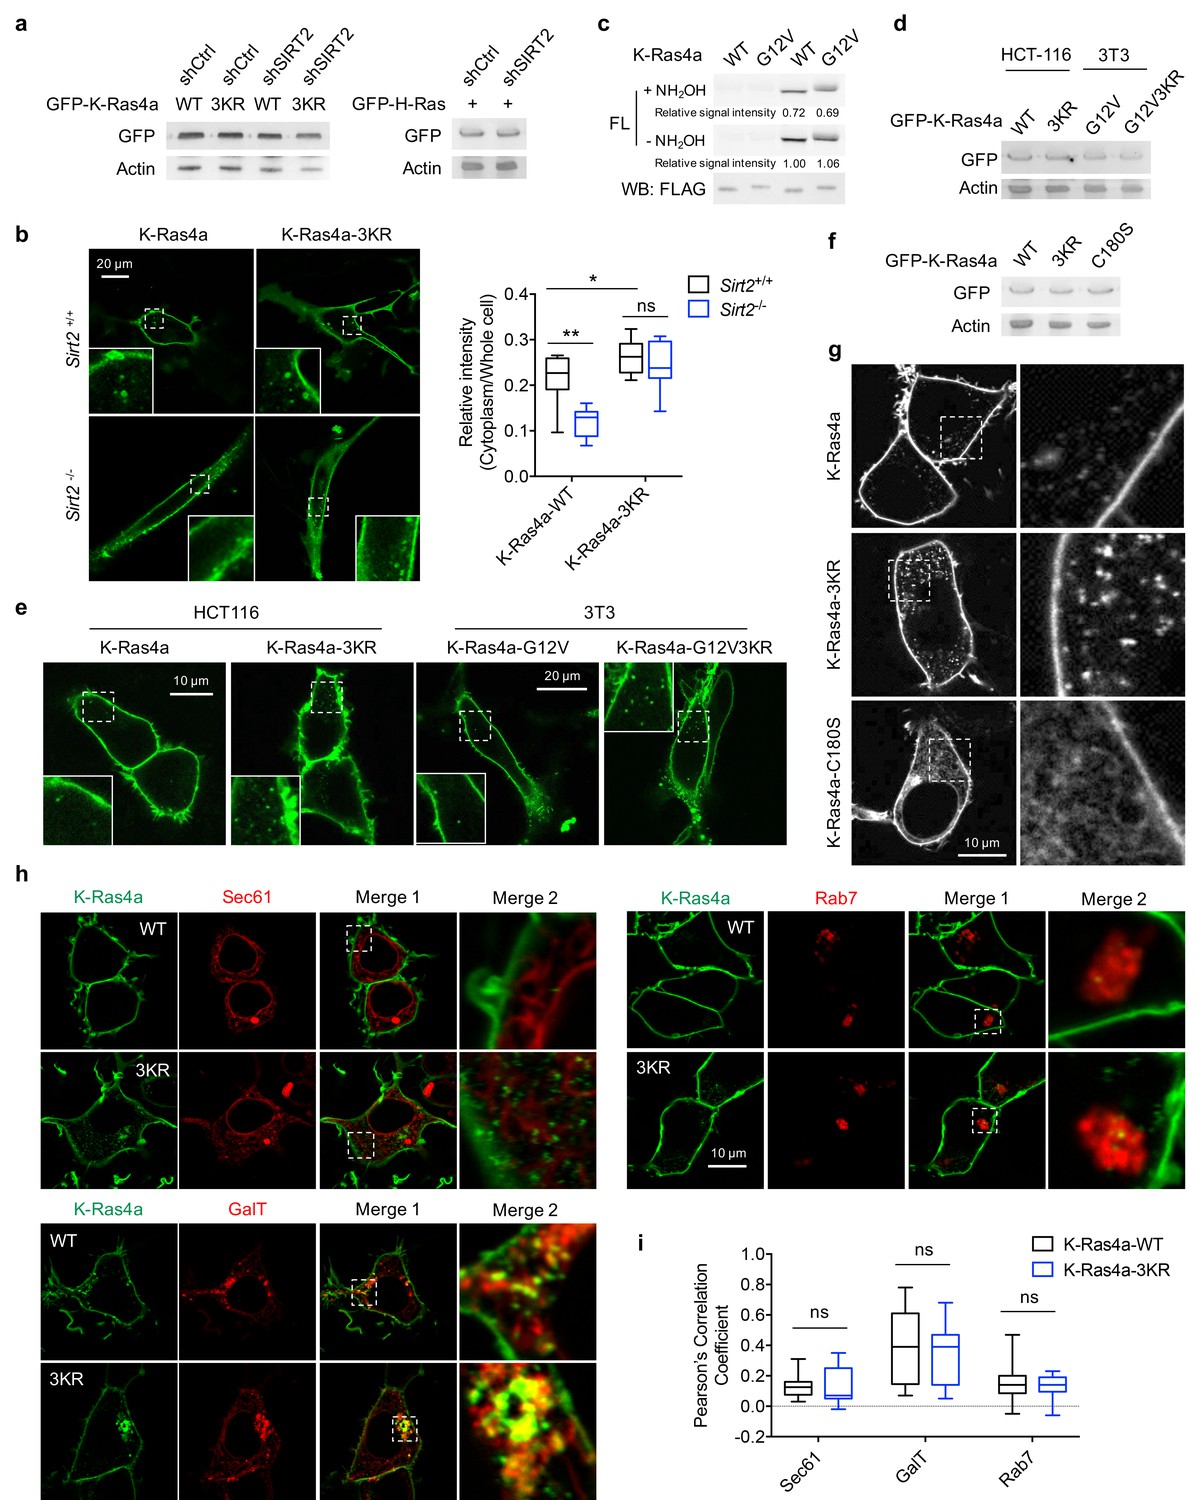
Lysine fatty acylation regulates subcellular localization of K-Ras4a.
(a) Western blot analyses showing equal overexpression of GFP-K-Ras4a-WT and-3KR in HEK293T cells with Ctrl and SIRT2 KD. (b) Live cell imaging of MEF Sirt2 WT and KO cells overexpressing GFP-K-Ras4a-WT and −3KR. Insets are magnifications of the regions enclosed by the white dashed squares. Statistical analyses of the relative cytoplasm to whole cell intensity of K-Ras4a-WT and −3KR (n = 8 for each sample) are shown on the right. (c) Fatty acylation levels of K-Ras4a-WT and G12V in HEK293T cells. (d) Western blot analyses showing equal protein levels for overexpressed GFP-K-Ras4a-WT and −3KR in HCT116 cells, and GFP-K-Ras4a-G12V and -G12V-3KR in 3T3 cells. (e) Live cell imaging of HCT116 cells overexpressing GFP-K-Ras4a-WT and −3KR and NIH3T3 cells overexpressing GFP-K-Ras4a-G12V and -G12V-3KR. Insets are magnifications of the regions enclosed by the white dashed squares. (f) Western blot showing equal protein levels for overexpressed GFP-K-Ras4a-WT, −3KR and -C180S in HEK293T cells. (g) Confocal images showing subcellular localization of GFP-K-Ras4a, −3KR, and -C180S in HEK293T cells. The right panels show the magnified images of the regions enclosed by the white dashed squares in the left panels. (h) Representative images for examining the colocalization of GFP-K-Ras4a or −3KR with Sec61, GalT, and Rab7 in HEK293T cells. Magnifications of the white dashed squares-enclosed regions in Merge 1 are shown as Merge 2. (i) Statistical analyses of the colocalization from (h) using Pearson’s coefficient (n = 11, 11, 11, 11, 13, 13 cells for each sample from left to right, respectively). The images shown are representative of 80–100% of the cells examined. Statistical evaluation was done using two-way ANOVA. Centre line of the box plot represents the mean value, box represents the 95% confidence interval, and whiskers represent the range of the values. ns, not significant.
Figure 5 with 1 supplement
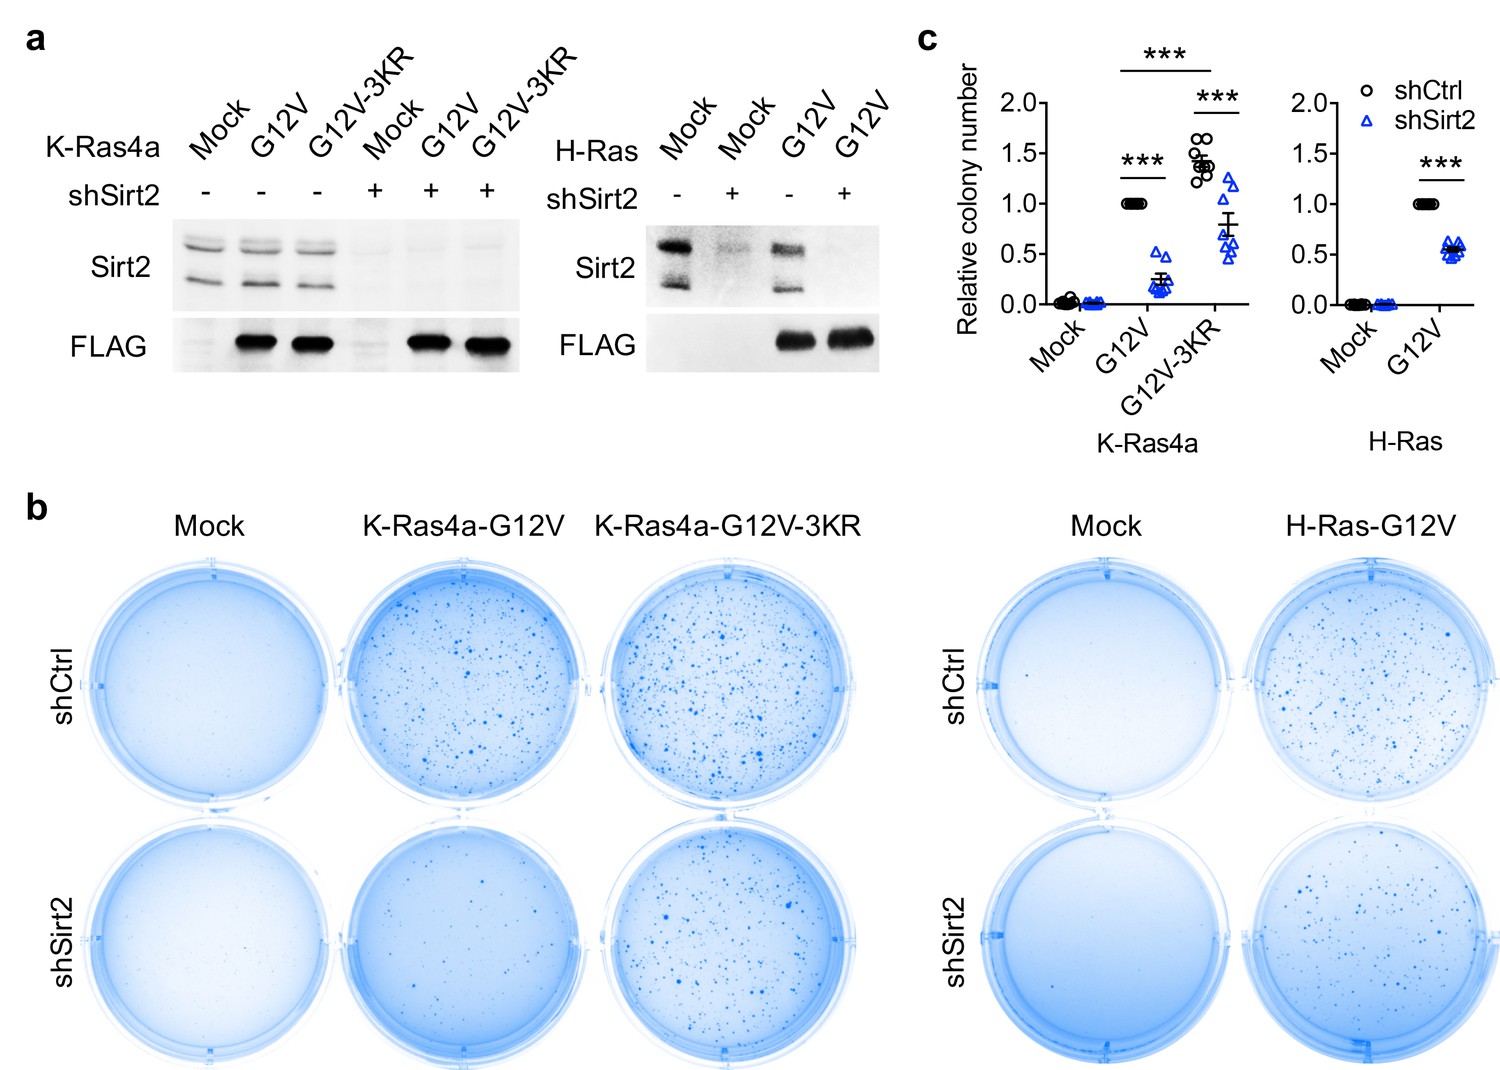
SIRT2-dependent lysine defatty-acylation increases K-Ras4a transforming activity.
(a) Representative western blot analyses of Sirt2, FLAG-K-Ras4a-G12V, FLAG-K-Ras4a-G12V-3KR, FLAG-H-Ras-G12V protein levels in NIH3T3 cells with Ctrl or Sirt2 KD used in (b and c). (b) Anchorage-independent growth of NIH3T3 cells stably expressing Mock, K-Ras4a-G12V, -G12V-3KR, or H-Ras-G12V with Ctrl or Sirt2 KD. (c) Quantification of the colony numbers in (b) relative to that of the cells expressing K-Ras4a-G12V-shCtrl or H-Ras-G12V-shCtrl. Statistical evaluation was by unpaired two-tailed Student’s t test. Error bars represent SEM in eight biological replicates or as indicated. ***p<0.001. Representative images (a, b) from at least three independent experiments are shown.
Figure 5—figure supplement 1
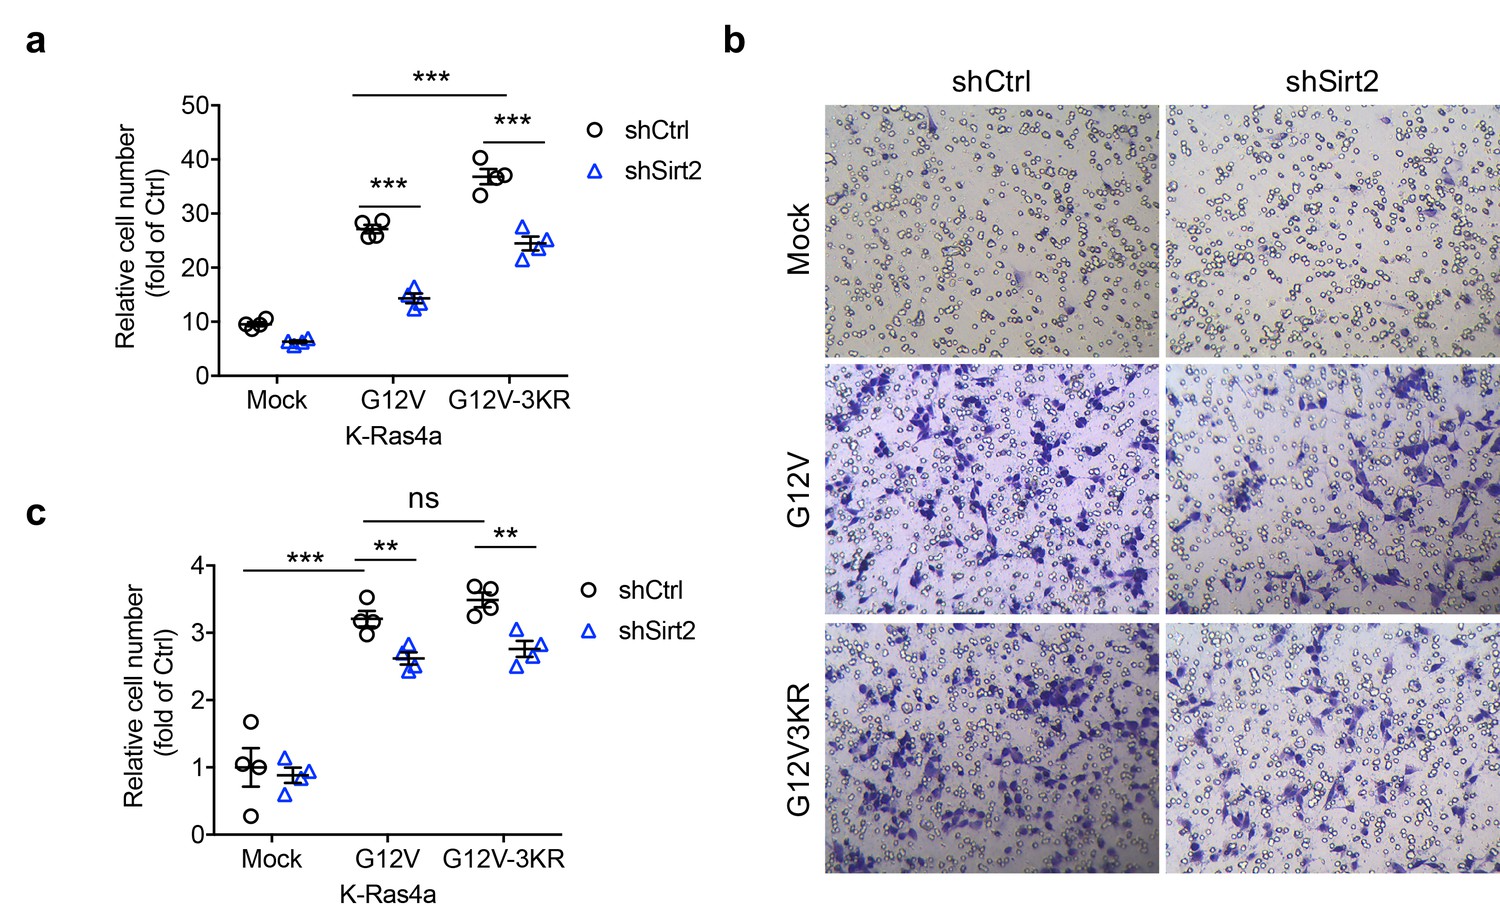
Lysine fatty acylation regulates K-Ras4a-G12V-mediated cell proliferation but not migration.
(a) Effect of Ctrl or Sirt2 KD on proliferation of NIH3T3 cells stably overexpressing Mock, K-Ras4a-G12V or -G12V-3KR. Cell numbers were determined by crystal violet staining 0 or 5 days after the transduction with shCtrl or shSirt2-carrying lentivirus. The y axis represents cell numbers normalized to that of the corresponding shCtrl group on Day 0. (b) Representative images of transwell migration assay in NIH3T3 cells stably overexpressing Mock, K-Ras4a-G12V or -G12V-3KR with Ctrl or Sirt2 KD. (c) Migration cell numbers in (b) relative to that of Mock with Ctrl KD. Statistical evaluation was done using unpaired two-tailed Student’s t test. Error bars represent SEM in four biological replicates. **p<0.01; ***p<0.001; ns, not significant.
Figure 6 with 4 supplements
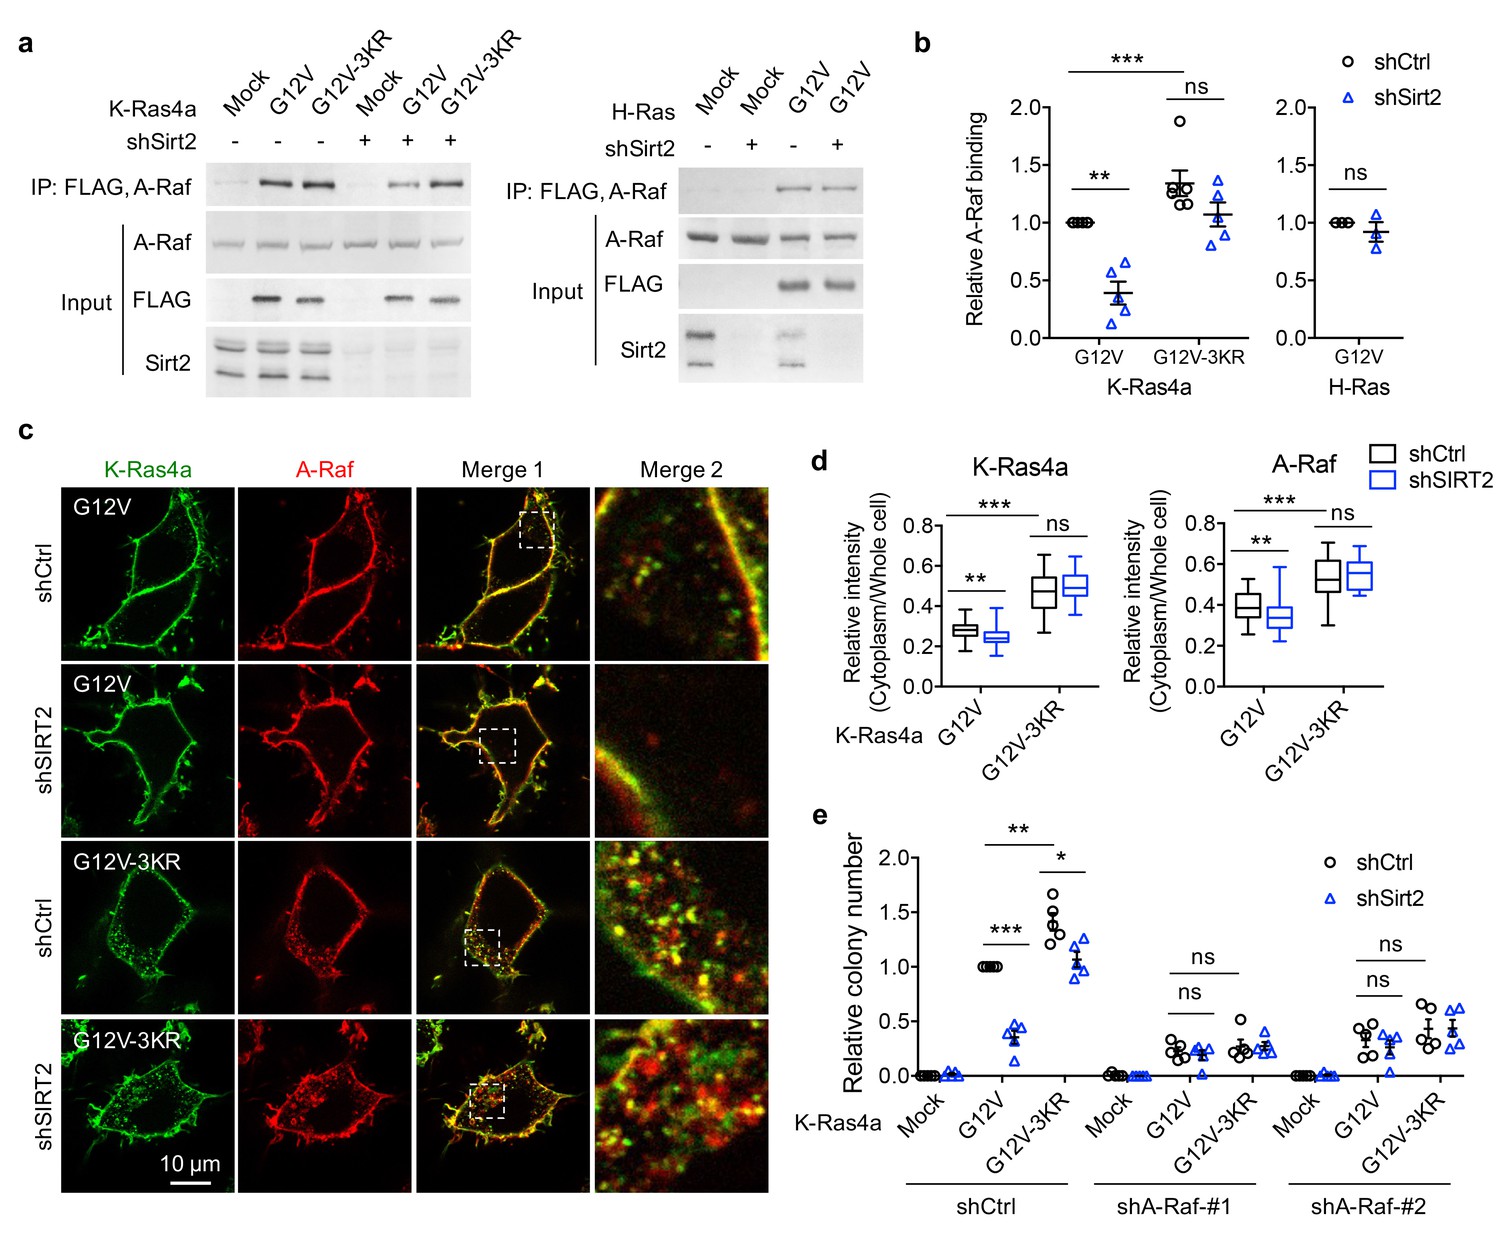
A-Raf is involved in the regulation of K-Ras4a transforming activity by lysine fatty acylation.
(a) Co-IP of A-Raf with an anti-FLAG antibody in NIH3T3 cells stably expressing Mock, FLAG-K-Ras4a-G12V, FLAG-K-Ras4a-G12V-3KR, or FLAG-H-Ras-G12V with Ctrl or Sirt2 KD. (b) Quantification of relative A-Raf binding levels in (a). The A-Raf binding levels in Ctrl KD cells were set to 1. Quantification was done with Fiji software. Signal intensity of A-Raf was normalized with the corresponding FLAG intensity. (c) Images showing the localization of GFP-K-Ras4a-G12V or -G12V-3KR and DsRed-A-Raf in live HEK293T cells with Ctrl or SIRT2 KD (by shSIRT2-#2). Merge 2 shows the magnified white dashed squares-enclosed regions in Merge 1. (d) Statistical analyses of the relative cytoplasm to whole cell intensity of K-Ras4a and A-Raf from (c) (n = 17 for all samples). (e) Anchorage-independent growth of NIH3T3 cells stably expressing Mock, K-Ras4a-G12V or -G12V-3KR with Ctrl or Sirt2 KD, and Ctrl or A-Raf KDs. The y axis represents colony numbers relative to that of the Sirt2 and A-Raf Ctrl KD cells expressing K-Ras4a-G12V. Statistical evaluation in (b) and (e) was by unpaired two-tailed Student’s t test. Error bars represent SEM in at least three biological replicates or as indicated. Statistical evaluation in (d) was by two-way ANOVA. Centre line of the box plot represents the mean value, box represents the 95% confidence interval, and whiskers represent the range of the values. *p<0.05; **p<0.01; ***p<0.001; ns, not significant. Representative images are shown.
Figure 6—figure supplement 1
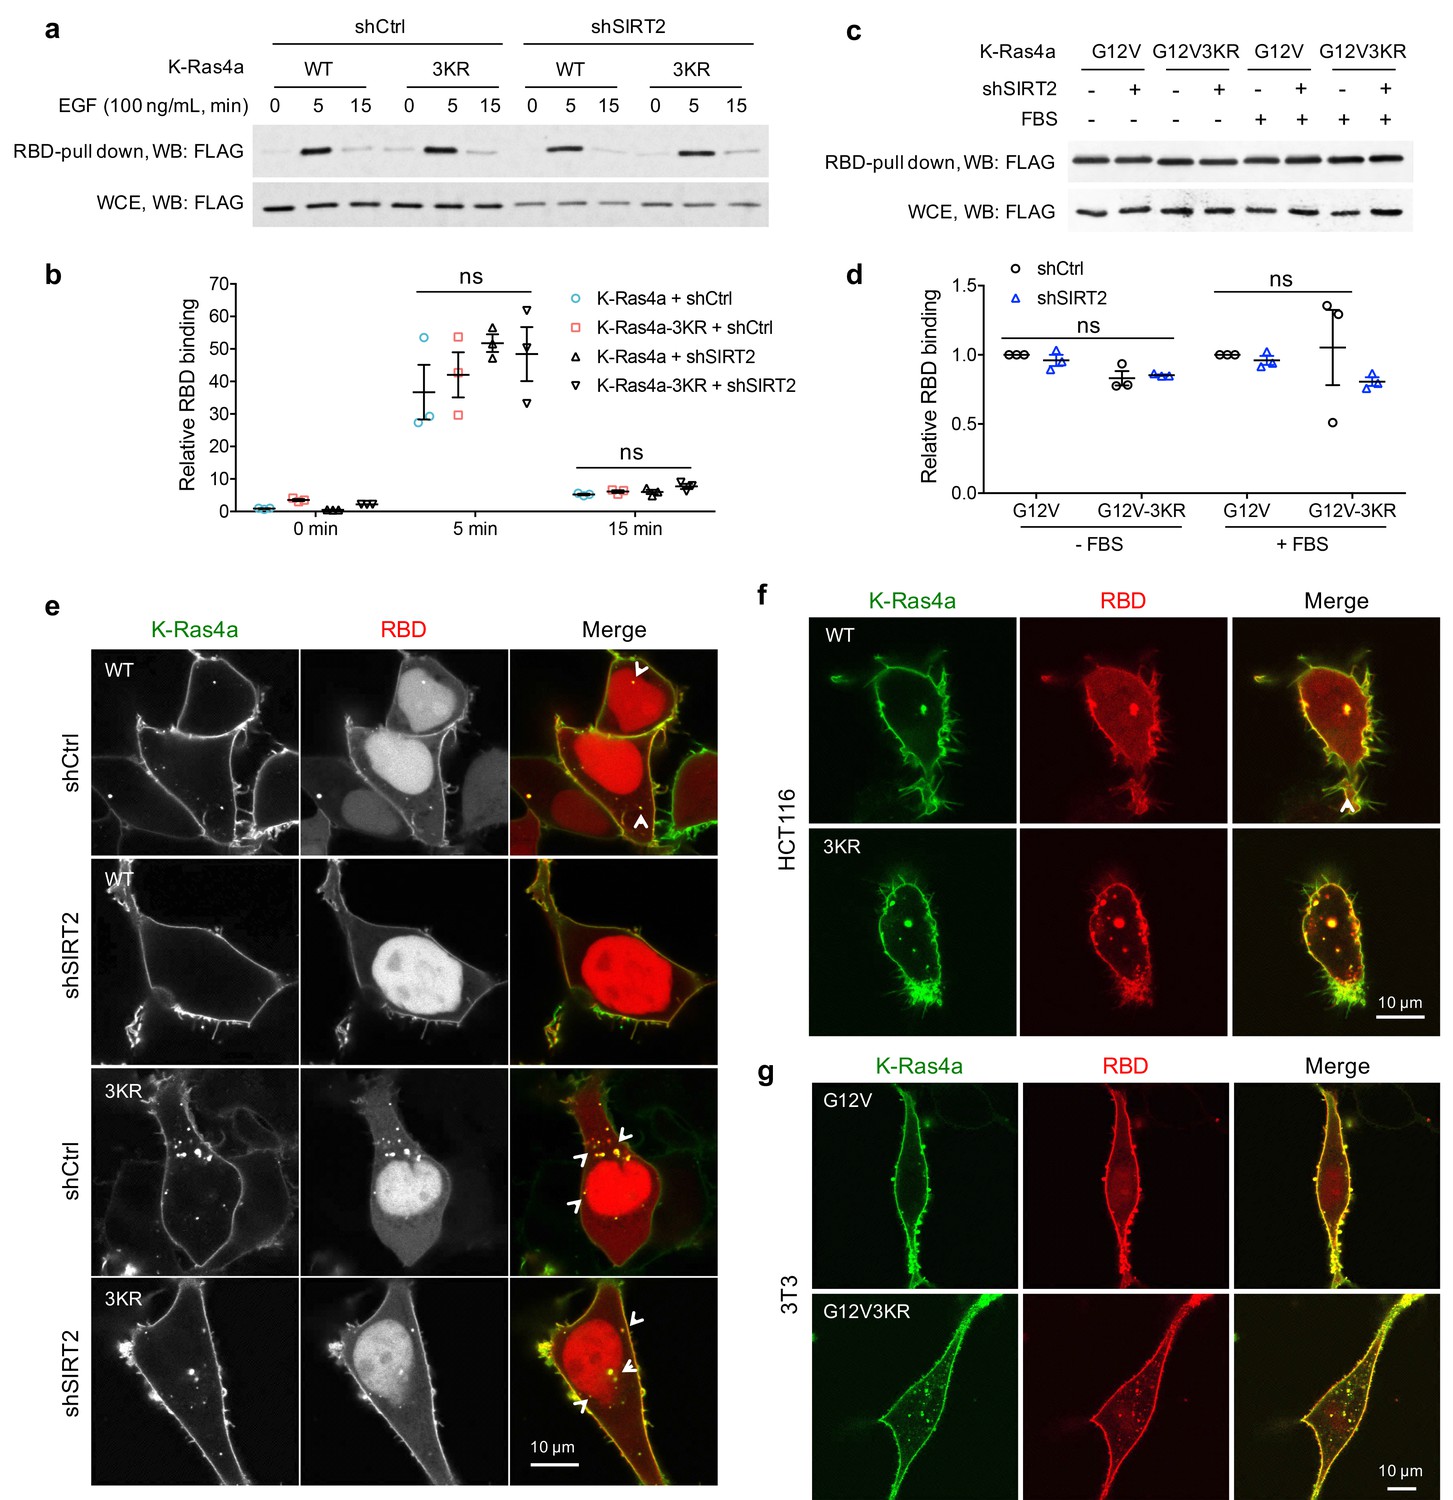
Lysine fatty acylation regulates the subcellular localization of active K-Ras4a.
(a, b) RBD pull-down assay in HEK293T cells expressing FLAG-K-Ras4a-WT or -3KR with Ctrl or SIRT2 KD (by shSIRT2-#2) (a). Cells were serum-starved overnight and treated with 100 ng/mL EGF for 0, 5, and 15 min. The relative RBD binding with respect to cells expressing K-Ras4a and shCtrl at 0 min was quantified in (b). (c, d) RBD pull-down assay in HEK293T cells expressing FLAG-K-Ras4a-G12V or -G12V-3KR with Ctrl or SIRT2 KD (c). Cells were cultured in FBS-free or complete medium for 12 hr before being subjected to RBD pull-down. RBD binding relative to cells expressing K-Ras4a-G12V-shCtrl was quantified in (d). (e) Co-localization of GFP-K-Ras4a-WT or-3KR with DsRed-RBD in live HEK293T cells with Ctrl or SIRT2 KD. (f) Live cell imaging showing the colocalization of GFP-K-Ras4a-WT or-3KR with DsRed-RBD in HCT116 cells. (g) Live cell imaging showing the colocalization of GFP-K-Ras4a-G12V or -G12V-3KR with DsRed-RBD in NIH3T3 cells. Error bars represent SEM in three biological replicates. The images shown are representative of 80–100% of the cells examined. Statistical evaluation was done using unpaired two-tailed Student’s t test. Error bars represent SEM in four biological replicates. ns, not significant.
Figure 6—figure supplement 2
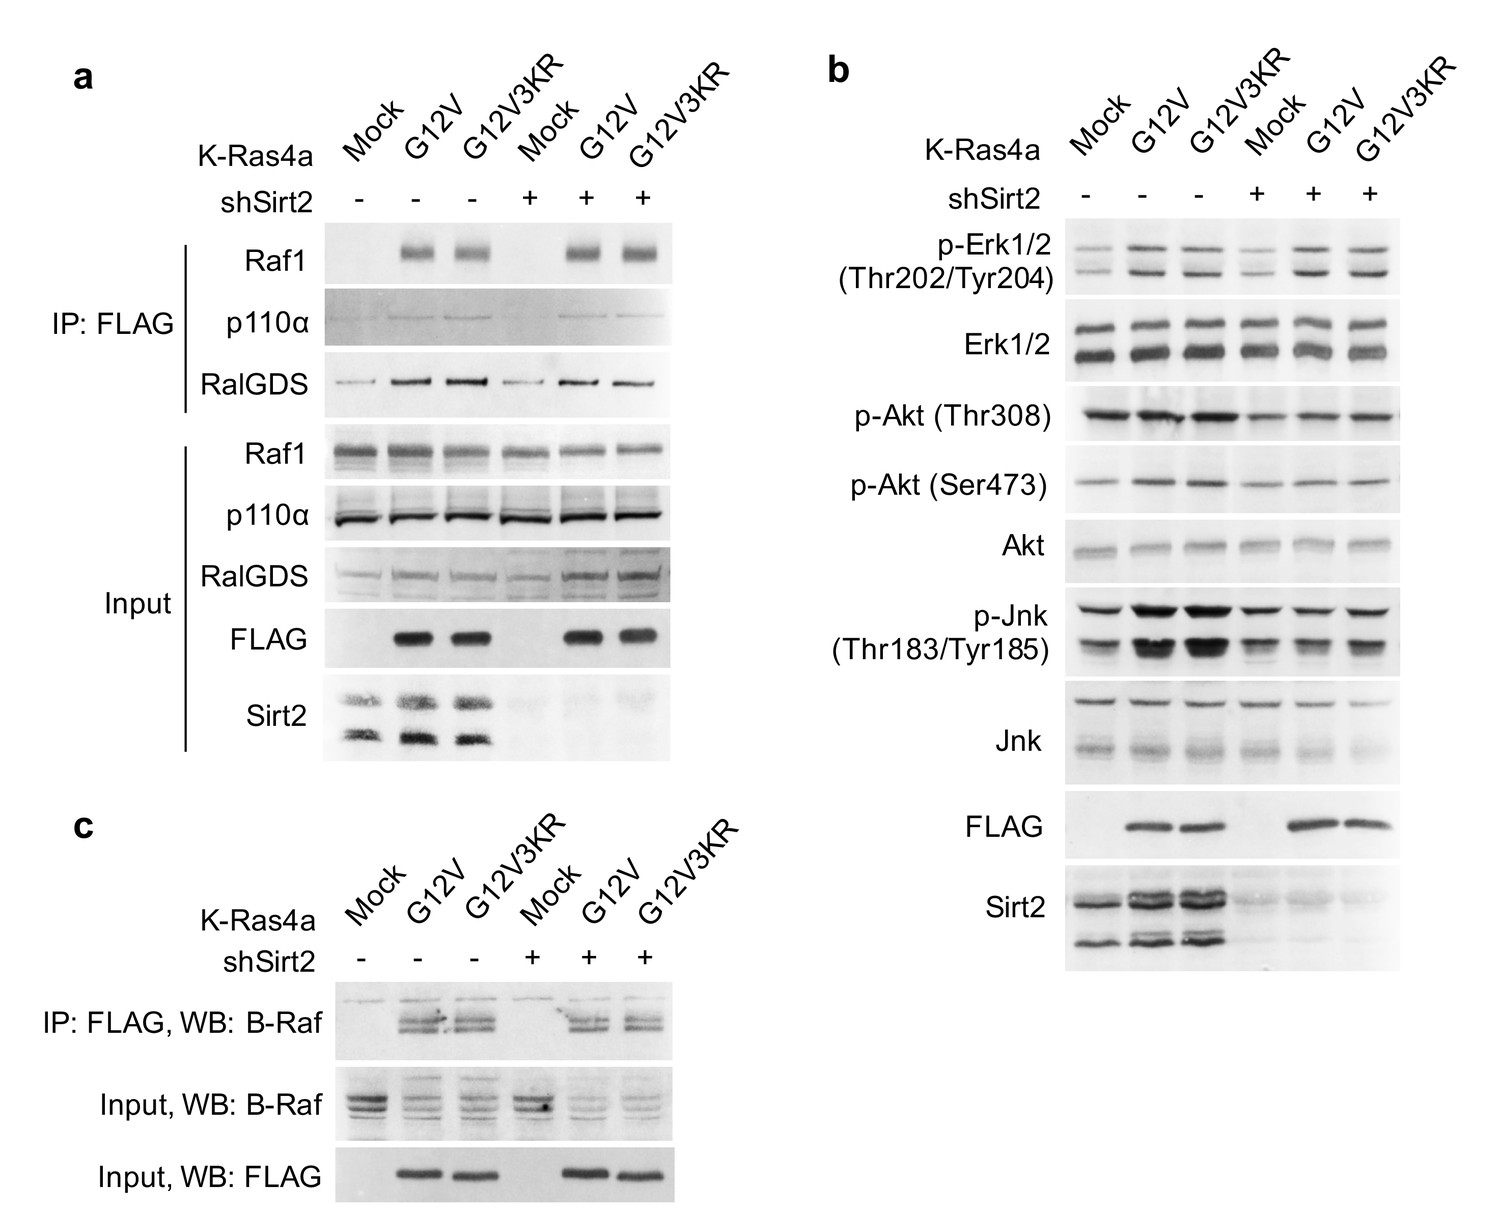
Lysine fatty acylation does not affect K-Ras4a signaling through Raf1, PI3K, RalGDS, or B-Raf.
(a) Co-IP of FLAG and Raf1, p110α, or RalGDS in NIH3T3 cells stably expressing Mock, FLAG-K-Ras4a-G12V, or -G12V-3KR with Ctrl or Sirt2 KD. (b) Western blot analyses of phospho-Erk, -Akt, and -Jnk in NIH3T3 cells stably expressing Mock, FLAG-K-Ras4a-G12V, or -G12V-3KR with Ctrl or Sirt2 KD. (c) Co-IP of FLAG and B-Raf in NIH3T3 cells stably expressing Mock, FLAG-K-Ras4a-G12V, or FLAG-K-Ras4a-G12V-3KR with Ctrl or Sirt2 KD. Representative images from three independent experiments are shown.
Figure 6—figure supplement 3
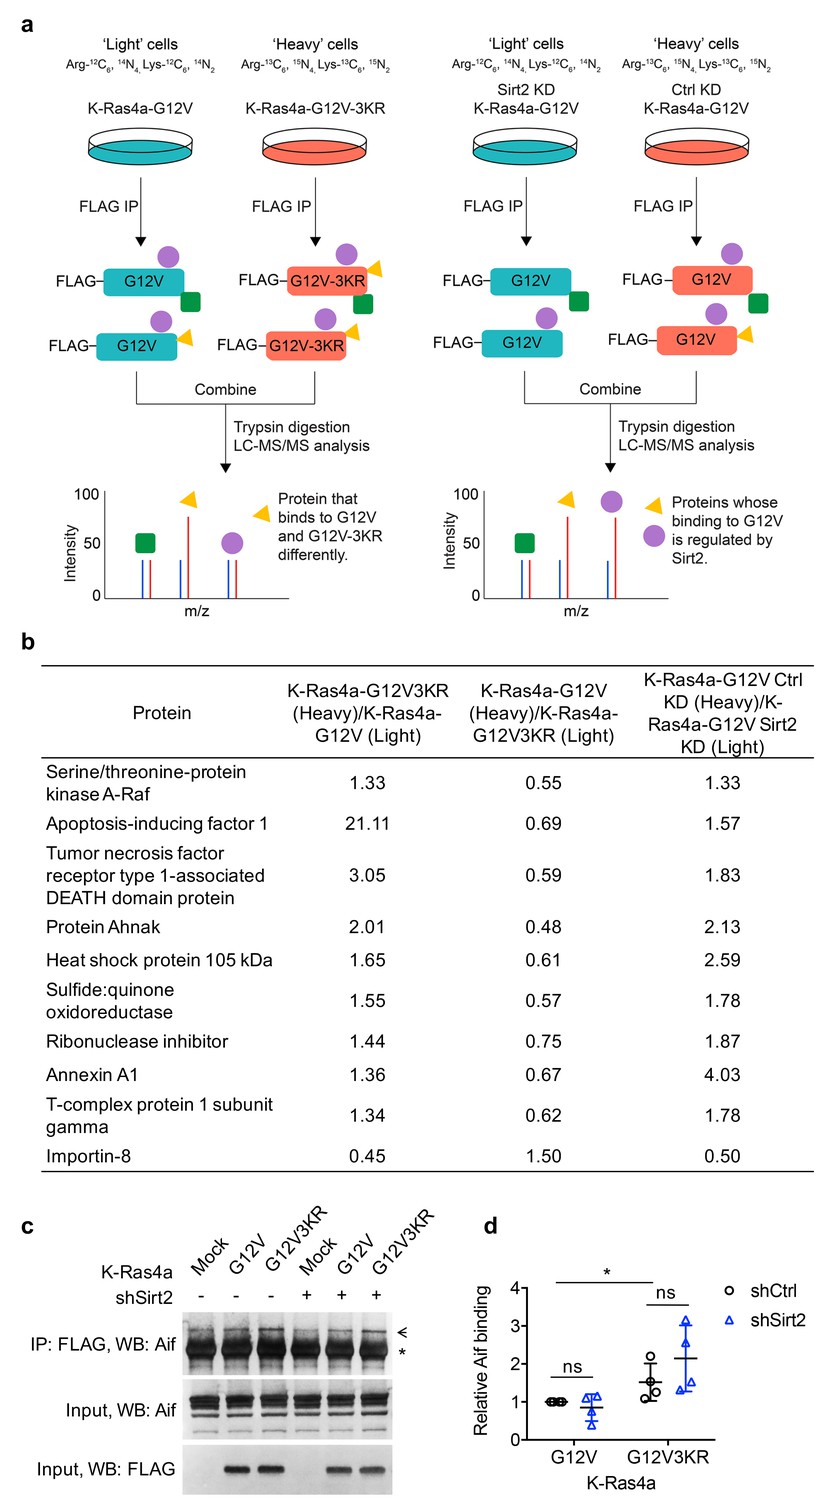
Interactome study identifies K-Ras4a-G12V interacting proteins that potentially mediate the effect of lysine fatty acylation.
(a) Schematic workflow of the K-Ras4a-G12V SILAC interactome study. (b) List of proteins whose binding to K-Ras4a-G12V may be altered (H/L > 1.3 or<0.77) by lysine fatty acylation. (c) Co-IP of FLAG and Aif in NIH3T3 cells stably expressing Mock, FLAG-K-Ras4a-G12V, or -G12V-3KR with Ctrl or Sirt2 KD. The ‘*” points to the heavy chain of the anti-FLAG antibody, while the arrow points to Aif. (d) Quantification of relative Aif binding level in (c) compared to that in cells expressing K-Ras4a-G12V-shCtrl. Statistical evaluation was by unpaired two-tailed Student’s t test. Error bars represent SEM in four biological replicates. *p<0.05; ns, not significant. Representative images from four independent experiments are shown.
-
Figure 6—figure supplement 3-source data 1
Results from SILAC-based K-Ras4a-G12V and K-Ras4a-G12V-3KR interactome study in NIH3T3 cells.
Proteins with at least two unique peptides and H/L ratios and shared by all three interactome experiments are shown. Heavy/Light ratios > 1.3 and<0.77 are highlighted.
- https://doi.org/10.7554/eLife.32436.020
Figure 6—figure supplement 4

A-Raf mediates the regulation of K-Ras4a-G12V transforming activity by lysine fatty acylation.
(a) Western blot analysis of A-Raf, Sirt2, and FLAG in NIH3T3 cells expressing Mock, FLAG-K-Ras4a-G12V, or -G12V-3KR with Ctrl or SIRT2 KD, and Ctrl or A-Raf KD. (b) Images showing anchorage-independent growth of NIH3T3 cells stably expressing the K-Ras4a-G12V or -G12V-3KR with Ctrl or Sirt2 KD, and Ctrl or A-Raf KDs. Representative images from three independent experiments are shown.
Figure 7
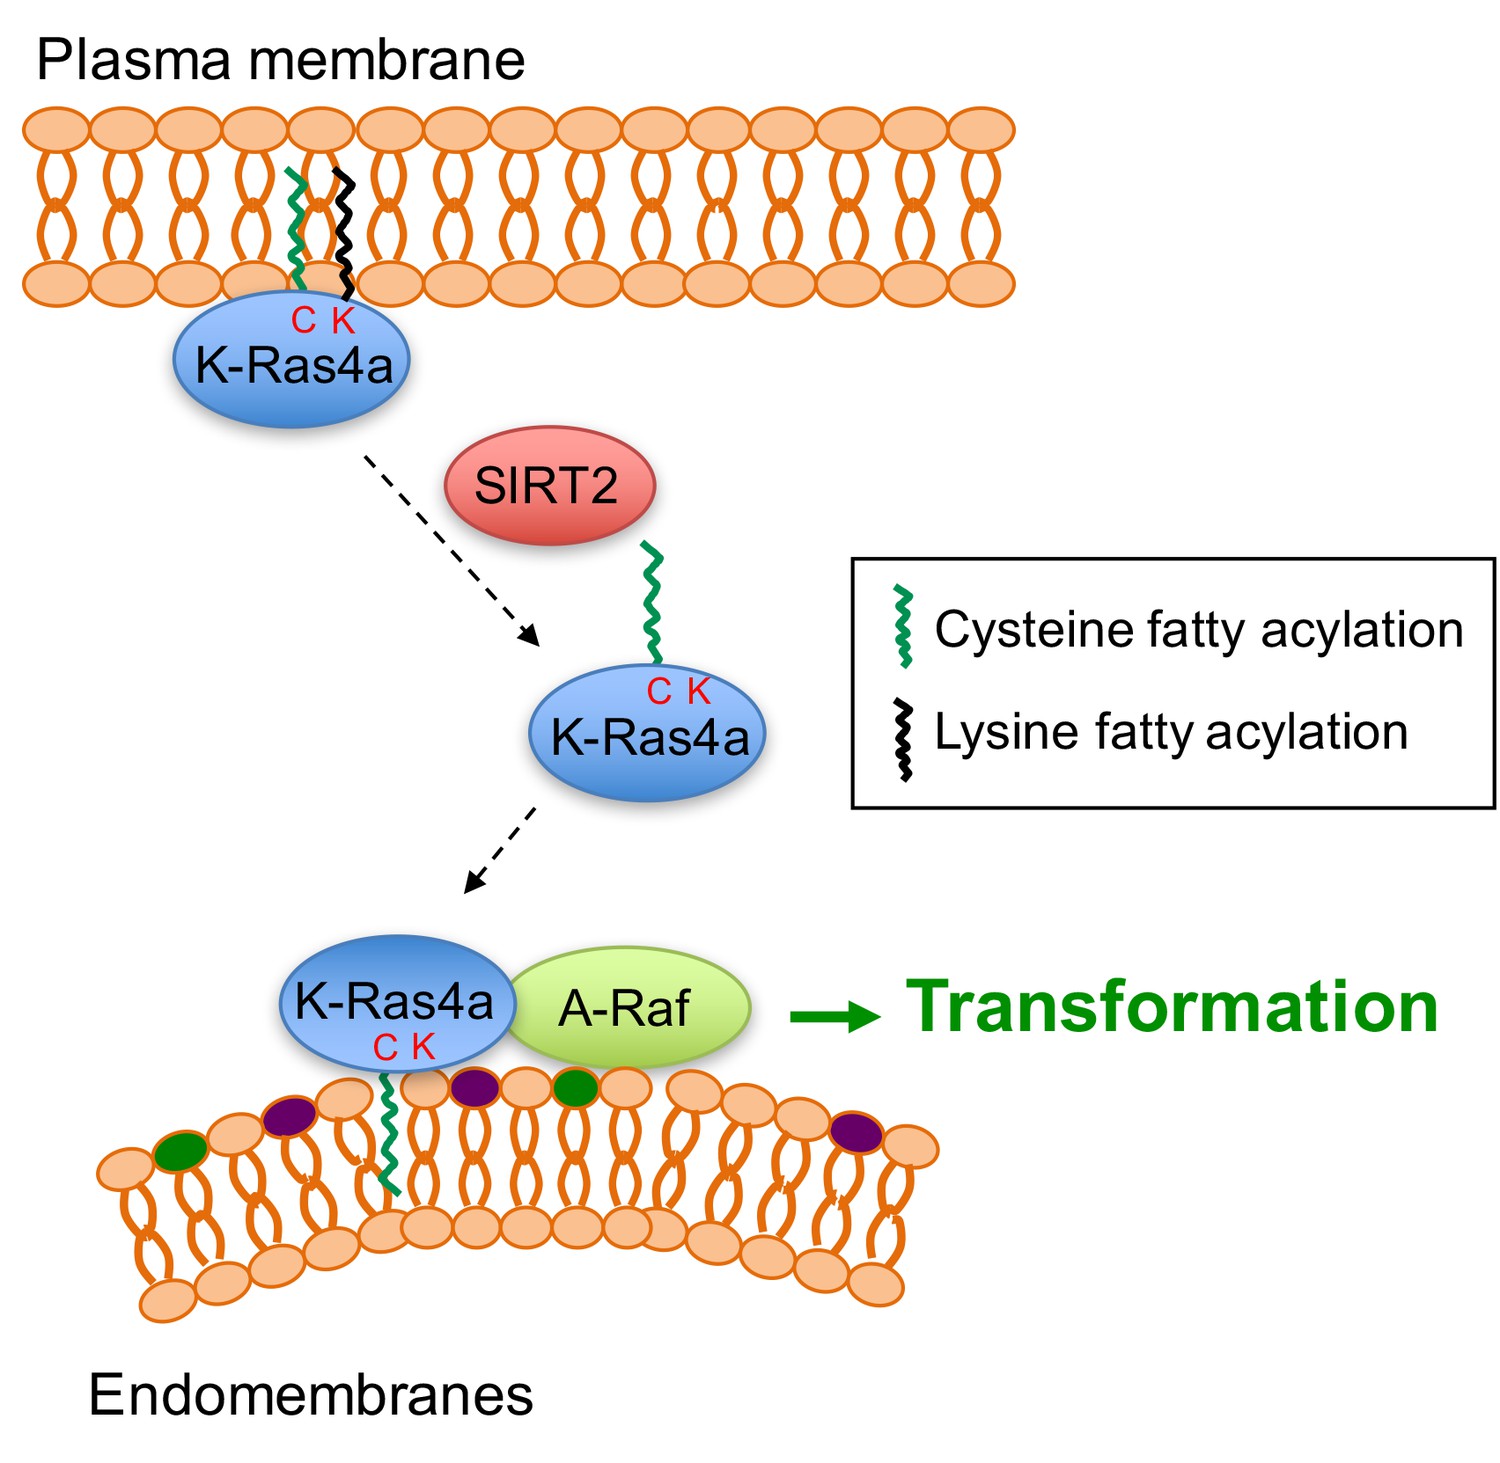
Model for the regulation of K-Ras4a by SIRT2-mediated removal of lysine fatty acylation.
Removal of lysine fatty acylation by SIRT2 facilitates K-Ras4a to localize to endomembranes and interact with A-Raf, and thus enhances its activity to transform cells.
Videos
Video 1
Dynamics of K-Ras4a in HEK293T cells.
Cells were transfected with GFP-K-Ras4a for 24 hr before being subjected to time-lapse confocal microscopy. Images were collected at 1 s intervals for 1 min of a single plane.
Video 2
Dynamics of K-Ras4a-3KR in HEK293T cells.
Cells were transfected with GFP-K-Ras4a-3KR for 24 hr before being subjected to time-lapse confocal microscopy. Images were collected at 1 s intervals for 1 min of a single plane.
Video 3
Dynamics of K-Ras4a-C180S in HEK293T cells.
Cells were transfected with GFP-K-Ras4a-C180S for 24 hr before being subjected to time-lapse confocal microscopy. Images were collected at 1 s intervals for 1 min of a single plane.
Tables
Key resources table
| Reagent type (species) or resource | Designation | Source or reference | Identifiers | Additional information |
|---|---|---|---|---|
| cell line (human) | HEK293T | ATCC | Cat#: CRL-3216, RRID: CVCL_0063 | |
| cell line (human) | HCT116 | ATCC | Cat#: CCL-247, RRID: CVCL_0291 | |
| cell line (mouse) | NIH3T3 | ATCC | Cat#: CRL1658, RRID: CVCL_0594 | |
| cell line (human) | MEF Sirt2 WT and KO | Other | N/A | Obtained from Dr. Toren Finkel's laboratory at NIH, Bethesda, MD |
| transfected construct | pLKO.1-shLuciferase | Sigma-Aldrich | SHC007 | |
| transfected construct (human) | pLKO.1-shSIRT1-#1 | Sigma-Aldrich | TRCN0000018980 | |
| transfected construct (human) | pLKO.1-shSIRT1-#2 | Sigma-Aldrich | TRCN0000018981 | |
| transfected construct (human) | pLKO.1-shSIRT2-#1 | Sigma-Aldrich | TRCN0000040219 | |
| transfected construct (human) | pLKO.1-shSIRT2-#2 | Sigma-Aldrich | TRCN0000310335 | |
| transfected construct (mouse) | pLKO.1-shSIRT2 | Sigma-Aldrich | TRCN0000012118 | |
| transfected construct (mouse) | pLKO.1-shA-Raf-#1 | Sigma-Aldrich | TRCN0000022612 | |
| transfected construct (mouse) | pLKO.1-shA-Raf-#2 | Sigma-Aldrich | TRCN0000022610 | |
| transfected construct (human) | pCMV5-FLAG-K-Ras4a | This paper | N/A | Cloning described in Cloning and mutagenesis |
| transfected construct (human) | pCMV5-FLAG-H-Ras | This paper | N/A | Provided by Dr. Maurine E. Linder |
| transfected construct (human) | pCMV5-FLAG-N-Ras | This paper | N/A | Provided by Dr. Maurine E. Linder |
| transfected construct (human) | pCMV5-FLAG-K-Ras4b | This paper | N/A | Provided by Dr. Maurine E. Linder |
| transfected construct (human) | pCMV5-FLAG-RalA | (Nishimura and Linder, 2013) | N/A | Provided by Dr. Maurine E. Linder |
| transfected construct (human) | pAcGFP-K-Ras4a | This paper | N/A | Cloning described in Cloning and mutagenesis. |
| transfected construct (human) | pAcGFP-H-Ras | This paper | N/A | Cloning described in Cloning and mutagenesis |
| transfected construct (human) | pCDH-FLAG-K-Ras4a | This paper | N/A | Cloning described in Cloning and mutagenesis |
| transfected construct (human) | pCDH-FLAG-H-Ras | This paper | N/A | Cloning described in Cloning and mutagenesis |
| transfected construct (human) | pCMV-tag-4a-SIRT2-FLAG | This paper | N/A | Cloning described in Cloning and mutagenesis |
| transfected construct (human) | pCMV-tag-4a-DsRed-A-Raf | This paper | N/A | Cloning described in Cloning and mutagenesis |
| transfected construct (human) | DsRed-GalT | (Luo et al., 2015) | N/A | Obtained from Dr. Yuxin Mao at Cornell University, Ithaca, NY |
| transfected construct (human) | mCherry-Sec61 beta | Addgene (Zurek et al., 2011) | #49155 | |
| transfected construct (human) | mCherry-Rab11 | Addgene (Choudhury et al., 2002) | #55124 | |
| transfected construct (human) | DsRed-Rab7 | Addgene (Choudhury et al., 2002) | #12661 | |
| transfected construct (human) | Lamp1-RFP | Addgene (Sherer et al., 2003) | #1817 | |
| antibody | anti-Ras (Y13-259) | EMD Chemicals Inc. | Cat#: OP01A, RRID: AB_10681741 | 1:5000 dilution for WB, 1 μg/1 mg total protein for IP |
| antibody | anti-RalA | EMD Chemicals Inc. | Cat#: ABS223, RRID: AB_11204894 | 1:1000 dilution for WB |
| antibody | anti-SIRT1 | EMD Chemicals Inc. | Cat#: 05–1243, RRID: AB_1163501 | 1:1000 dilution for WB |
| antibody | anti-SIRT2 | Abcam | ab134171 | 1:1000 dilution for WB |
| antibody | anti-SIRT2 | Cell Signaling Technology | 12650 | 1:1000 dilution for WB |
| antibody | anti-Transferrin Receptor | Abcam | Cat#: ab84036, RRID: AB_10673794 | 1:2000 dilution for WB |
| antibody | anti-K-Ras4a | Santa Cruz Biotechnology | Cat#: sc-522 RRID: AB_2134128 | 1:250 dilution for WB |
| antibody | anti-A-Raf | Santa Cruz Biotechnology | Cat#: sc-408 RRID: AB_630882 | 1:1000 dilution for WB |
| antibody | anti-B-Raf | Santa Cruz Biotechnology | Cat#: sc-166 RRID: AB_630938 | 1:5000 dilution for WB |
| antibody | anti-Raf1 | Santa Cruz Biotechnology | Cat#: sc-227 RRID: AB_632303 | 1:1000 dilution for WB |
| antibody | anti-FLAG M2 conjugated with HRP | Sigma-Aldrich | Cat#: A8592 RRID: AB_439702 | 1:5000 dilution for WB |
| antibody | anti-FLAG M2 affinity gel | Sigma-Aldrich | Cat#: A2220 RRID: AB_10063035 | 10 μL slurry/1 mg total protein for IP |
| antibody | anti-Syntaxin 6 | Cell Signaling Technology | Cat#: 2869 RRID: AB_2196500 | 1:50 dilution for IF |
| antibody | EEA1 | Cell Signaling Technology | Cat#: 3288 RRID: AB_2096811 | 1:100 dilution for IF |
| recombinant protein | SIRT1 | (Du et al., 2009) | N/A | |
| recombinant protein | SIRT2 | (Jing et al., 2016) | N/A | |
| recombinant protein | SIRT3 | (Du et al., 2009) | N/A | |
| recombinant protein | SIRT6 | (Jiang et al., 2013) | N/A | |
| peptide | acetyl H3K9 | (Zhu et al., 2012) | N/A | |
| peptide | myristoyl H3K9 | (Zhu et al., 2012) | N/A | |
| peptide | myristoyl K-Ras4a-C180 | This paper | N/A | Described in HPLC-based SIRT2 activity assay |
| peptide | triple FLAG peptide | Sigma-Aldrich | F4799 | |
| commercial assay or kit | Active Ras Pull-Down and Detection Kit | Thermo Fisher Scientific | 16117 | |
| chemical compound, drug | Alk14 | (Charron et al., 2009) | N/A | |
| chemical compound, drug | Rhodamine-azide | (Charron et al., 2009) | N/A | |
| chemical compound, drug | Azide-PEG3-Biotin | Sigma-Aldrich | 762024 | |
| chemical compound, drug | Tris[(1-benzyl-1H-1,2,3-triazol-4-yl)methyl]amine (TBTA) | Sigma-Aldrich | 678937 | |
| chemical compound, drug | Tris(2-carboxyethyl)phosphine (TCEP) | Sigma-Aldrich | 75259 | |
| chemical compound, drug | Hydroxylamine | Sigma-Aldrich | 159417 | |
| chemical compound, drug | L-lysine | Sigma-Aldrich | L9037 | |
| chemical compound, drug | L-arginine | Sigma-Aldrich | A8094 | |
| chemical compound, drug | [13C6, 15N2]-L-lysine | Sigma-Aldrich | 608041 | |
| chemical compound, drug | [13C6, 15N4]-L-arginine | Sigma-Aldrich | 608033 | |
| chemical compound, drug | 32P-NAD+ | PerkinElmer | BLU023 × 250UC | |
| Software | Fiji | N/A | https://fiji.sc/ RRID: SCR_002285 | |
| other | FuGene 6 | Promega | E2692 | |
| other | Sequencing grade modified trypsin | Promega | V5111 |
Additional files
-
Transparent reporting form
- https://doi.org/10.7554/eLife.32436.023
Download links
A two-part list of links to download the article, or parts of the article, in various formats.
Downloads (link to download the article as PDF)
Open citations (links to open the citations from this article in various online reference manager services)
Cite this article (links to download the citations from this article in formats compatible with various reference manager tools)
SIRT2 and lysine fatty acylation regulate the transforming activity of K-Ras4a
eLife 6:e32436.
https://doi.org/10.7554/eLife.32436


