MreB filaments align along greatest principal membrane curvature to orient cell wall synthesis
- Harvard University, United States
- MRC Laboratory of Molecular Biology, United Kingdom
- Harvard John A. Paulson School of Engineering and Applied Sciences, United States
- Leibniz Institute of Polymer Research, Germany
Figures
Figure 1 with 3 supplements
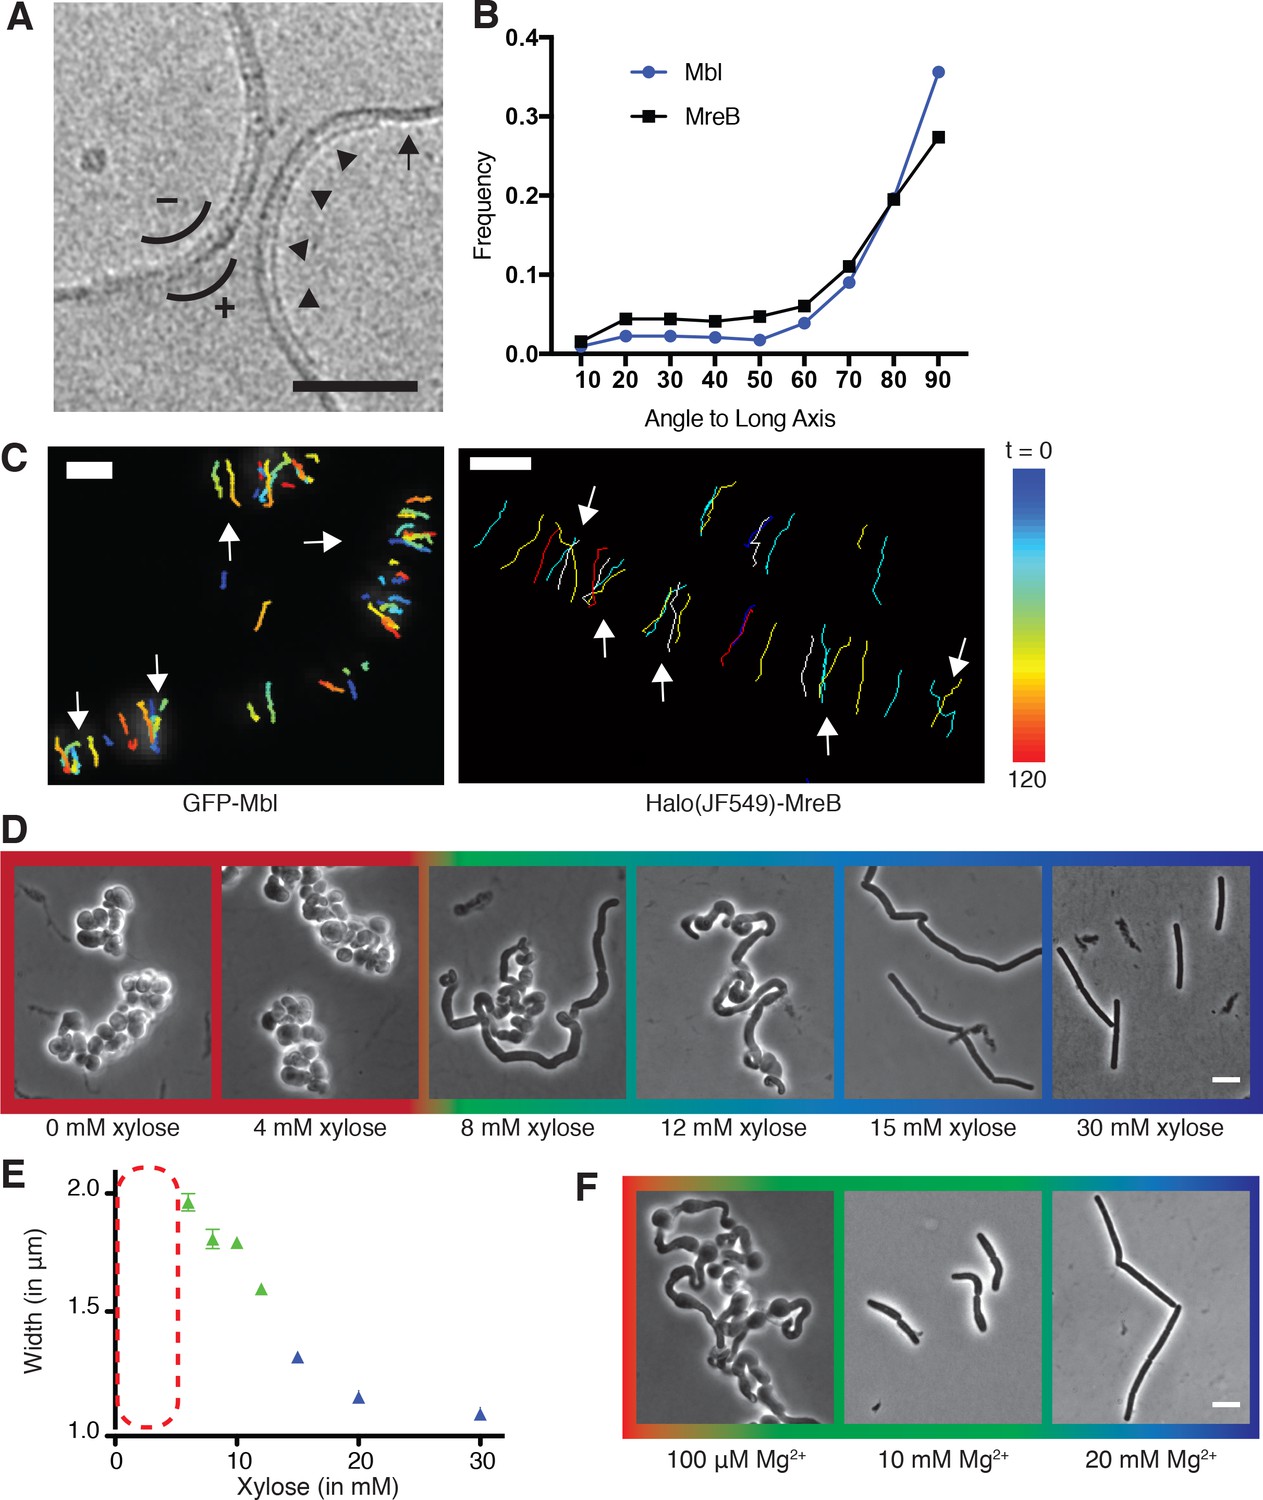
Curved MreB filament motions do not follow an ordered template (A–C).
(A) The negative curvature of MreB filaments (arrowheads) aligns with the negative principal curvature of the liposome surface (arrow). Scale bar is 50 nm. (B) Angular distribution of GFP-MreB and GFP-Mbl trajectories relative to the long axis of B subtilis cells indicates that while the distributions have a mode of 90°, they are broad (Mean Deviation = 34°, n = 1041 for GFP-MreB and Mean Deviation = 26°, n = 1772 for GFP-Mbl). (C) Particle tracking of GFP-Mbl (left) and Halo-JF549-MreB (right) during 120 s (~1 rotation) indicates trajectories close in time frequently cross paths (white arrows). Scale bar is 1 μm. See corresponding Figure 1—video 1. (D) Strains with tagO under inducible control display a teichoic acid-dependent decrease in width. Strain BEG300 was grown in LB supplemented with 20 mM Mg2+. (E) Plot of cell width as a function of tagO induction in LB supplemented with 20 mM Mg2+, calculated from rod-shaped cells (error bars are Standard Error of the Mean (SEM), n = 33, 56, 104, 175, 228, 489, 119). Areas not plotted at lower xylose levels (red dashed rectangle) are regions where cells are round (no width axis). Color scheme for D-F: red indicates round cells (no width axis), blue indicates rods (measurable width axis), and green indicates intermediate regimes where both rods and round cells are observed. (F) BEG300 at an intermediate level of tagO induction (15 mM xylose) shows a Mg2+ dependent decrease in width. All scale bars are 5 μm. See also Figure 1—figure supplement 1.
-
Figure 1—source data 1
Figure 1B – Raw GFP-MreB and GFP-Mbl track angle values from the cell midline and their associated frequency distributions.
- https://doi.org/10.7554/eLife.32471.006
-
Figure 1—source data 2
Figure 1—figure supplement 1B-left – Mean cell width, Standard Deviation (SD) and number of cells (N) analyzed at various magnesium and xylose concentrations.
Figure 1—figure supplement 1B-right – Tangential correlation along the cell contours at various xylose and magnesium concentrations. This data was used to calculate the correlation curves in Figure 1—figure supplement 1B.
- https://doi.org/10.7554/eLife.32471.007
Figure 1—figure supplement 1
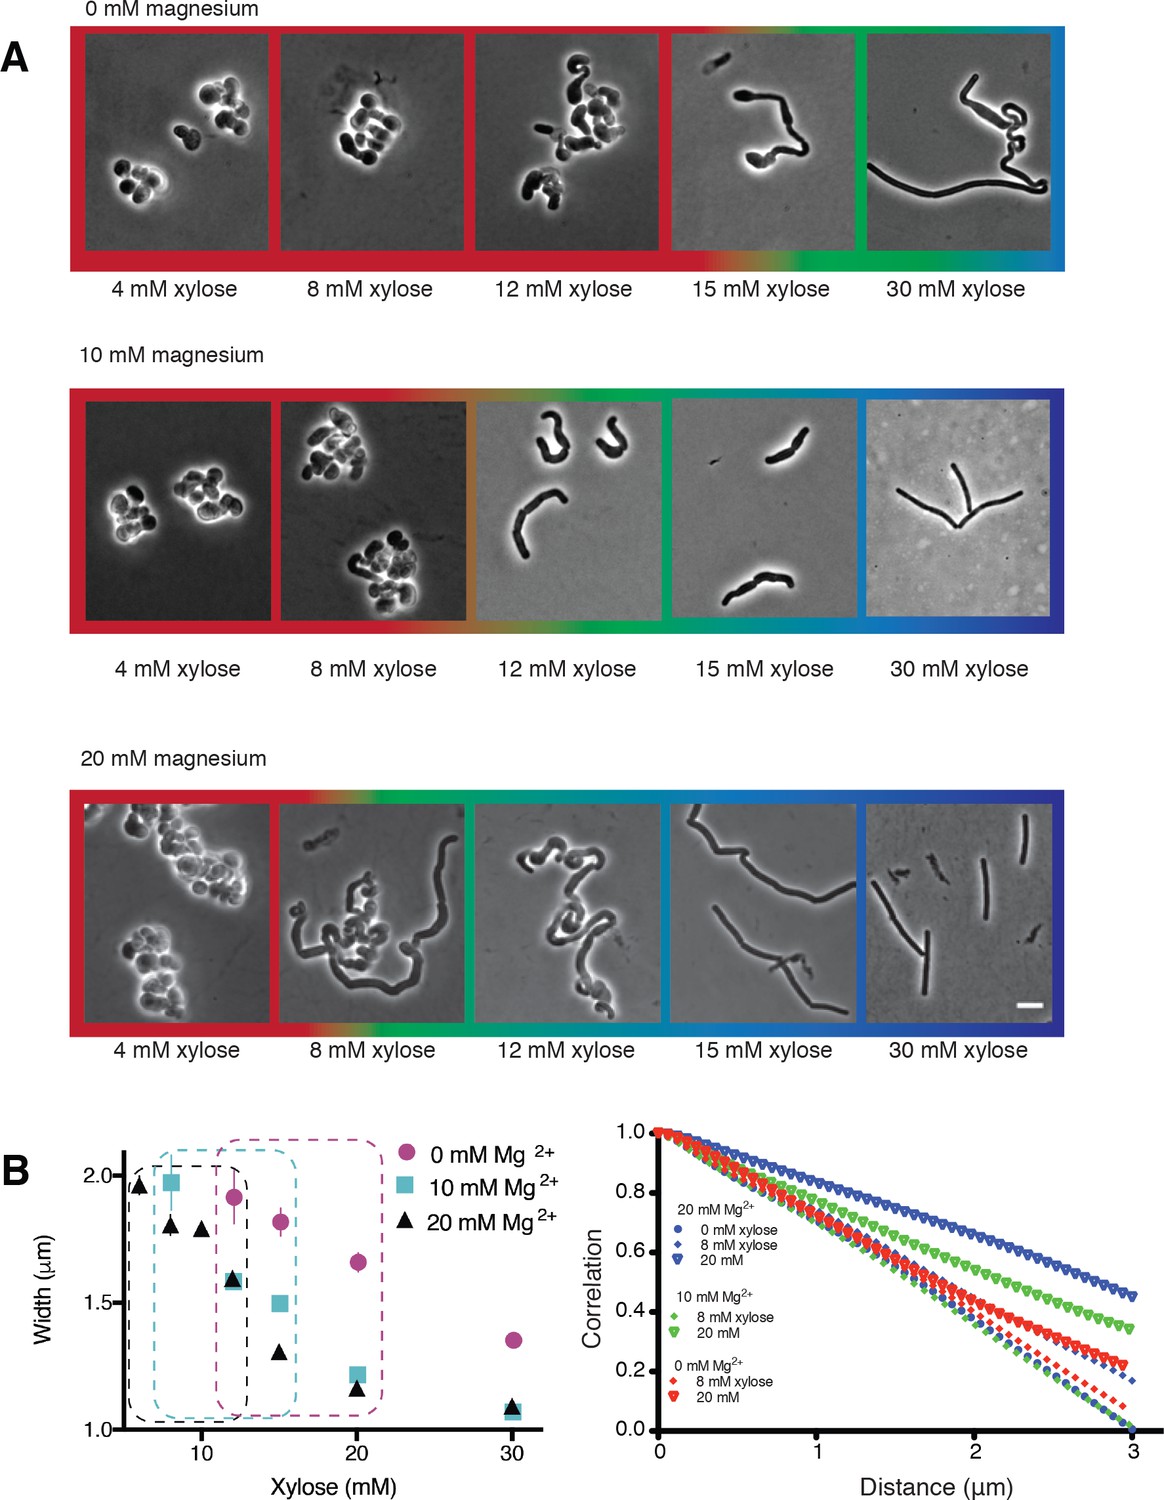
Varying magnesium levels in the growth medium changes cell shape.
(A) TagO inducible cells grown in LB supplemented with varying Mg2+ levels (0, 10 and 20 mM), show similar trends in cell shape across increasing xylose concentrations, with the appearance of more rod-shaped cells that become thinner as xylose levels increase. Exogenous Mg2+ reduces the amount of TagO induction needed for rod shape, evidenced by shift in the amount of xylose required to form rods as Mg2+ is increased. (Color Outlines: Blue = rods, Green = Mixed rods and non-rods, Red = non rods). (B) Left Plot of cell width as a function of TagO induction at different Mg2+ concentrations (error bars are SEM). Areas not plotted at lower xylose levels are regions where cells are round, with no width axis. Dotted rectangles mark conditions where both round cells and wide rods exist. Error bars are Standard Error of the Mean (SEM). Right At low xylose and magnesium levels, tangential correlation along the cell contours falls off faster, indicating loss of rod shape. Correlation of angles was calculated as described in methods. The curves shown are population averages of tangential correlations at selected xylose and magnesium concentrations. A cutoff of 3 μm is applied as this is the mean cell length of B. subtilis.
Figure 1—figure supplement 2
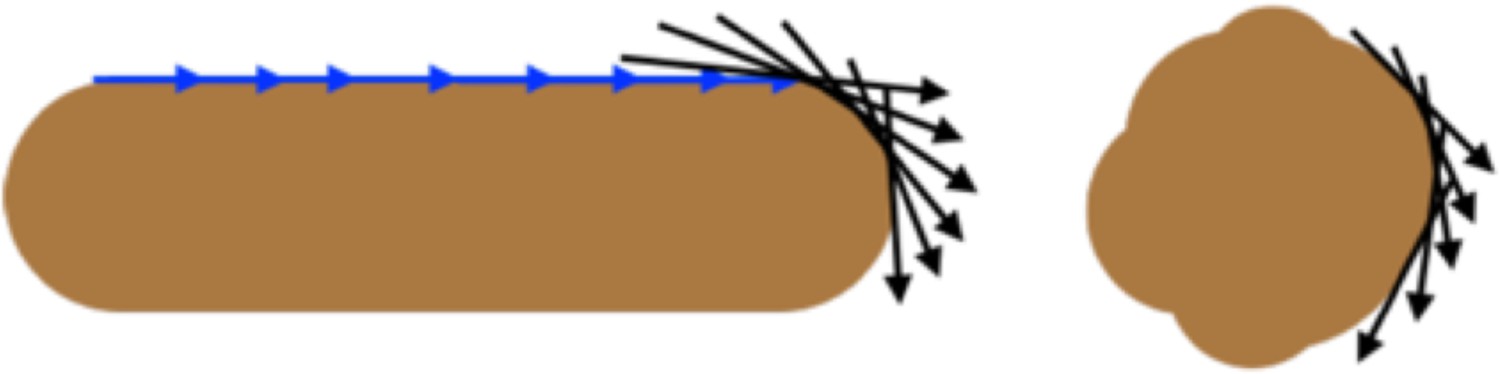
Schematic of cell contours and correlation.
For straight rods, the contour angles on average remain highly correlated over larger distances (blue arrows), becoming uncorrelated at the cell pole (black arrows). In spherical cells the angles become uncorrelated at shorter distances.
Figure 1—video 1
Movie showing the trajectories taken by MreB and Mbl filaments frequently cross each other close in time.
(First sequence) BDR2061, containing GFP-Mbl expressed at the native locus under a xylose-inducible promoter, was induced with 10 mM xylose and imaged with TIRFM. (Second sequence) bYS40 containing an endogenous HaloTag fusion to MreB at the native locus and promoter was labeled with 25 pm JF549. Frames are 1 s apart. Scale bar is 5 μm.
Figure 2 with 3 supplements
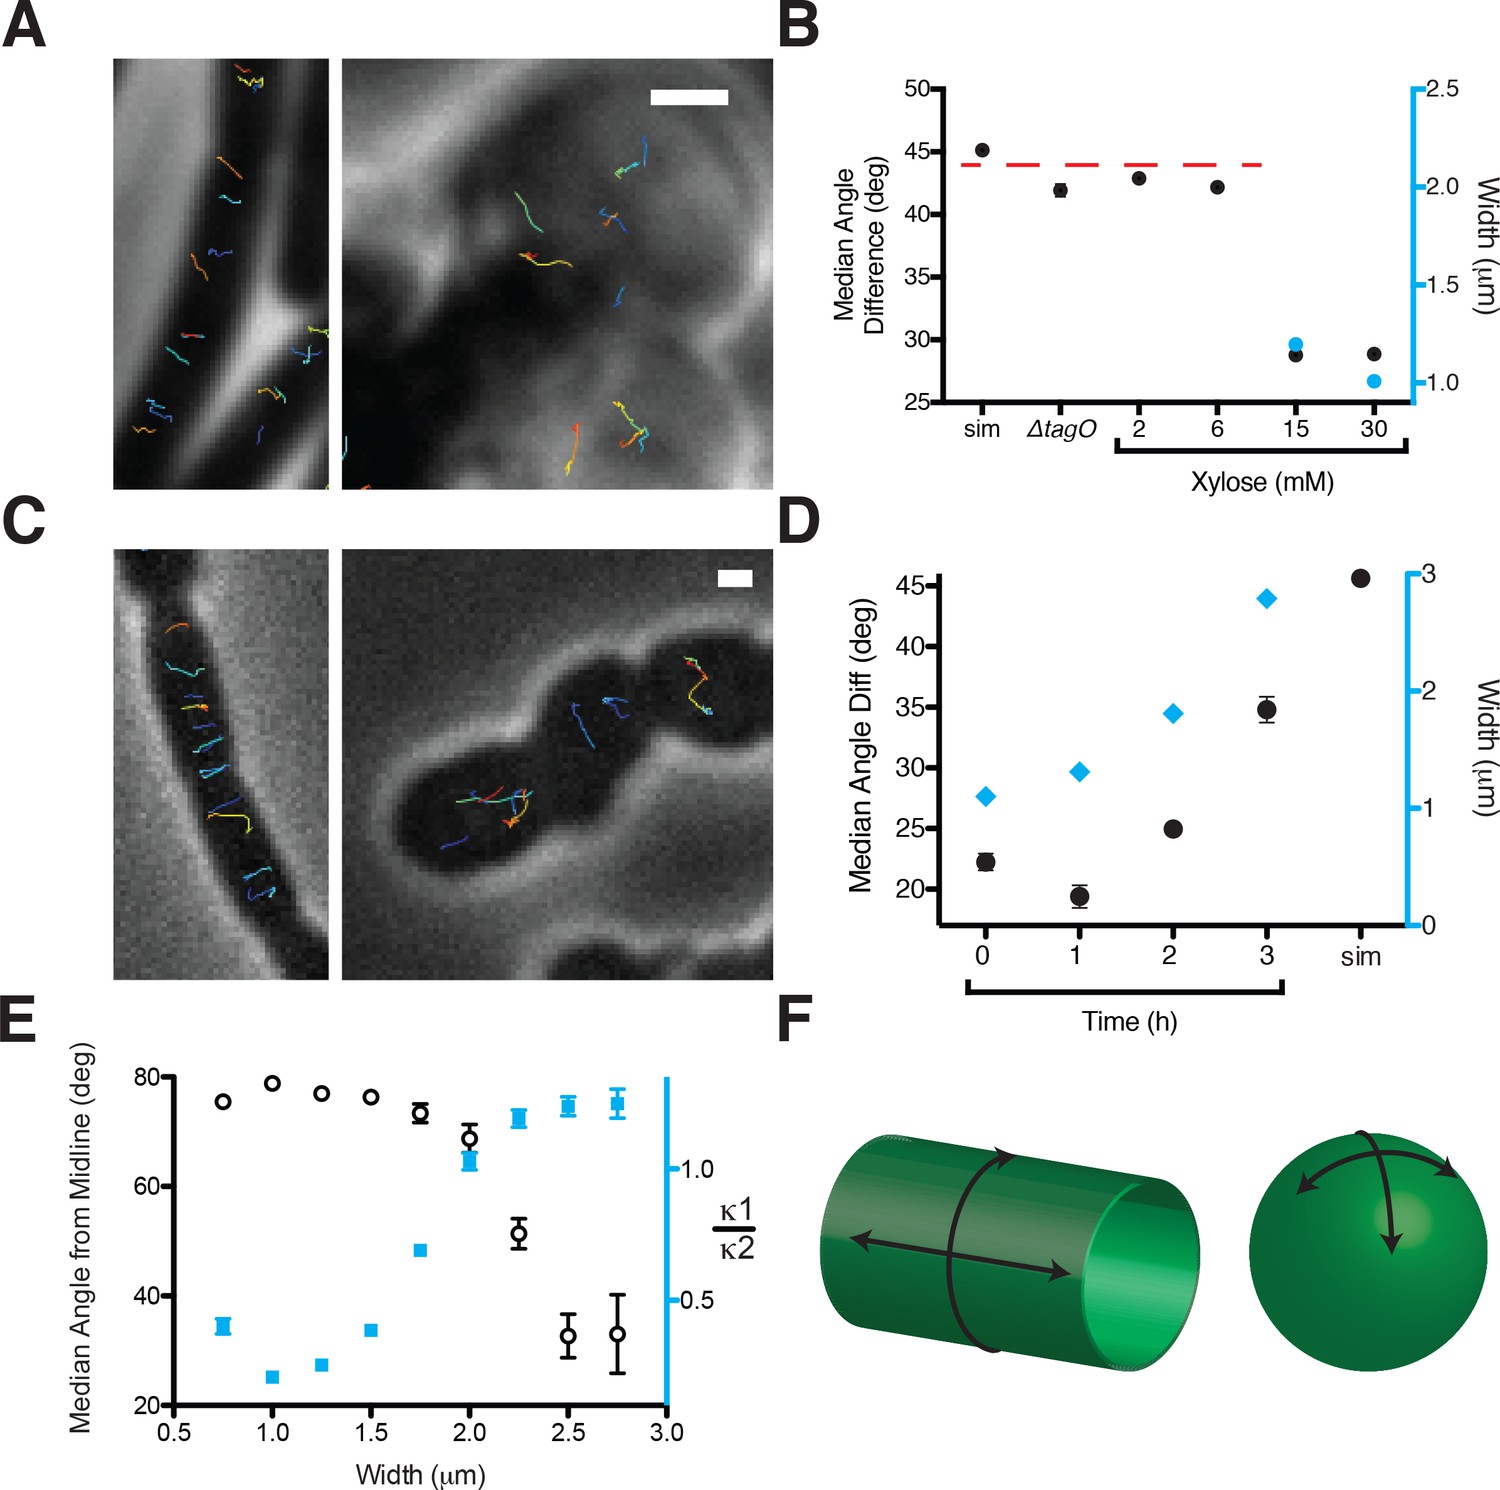
Oriented MreB motion correlates with rod shape.
(A) BEG300 at maximum tagO induction (30 mM) is rod-shaped, and MreB tracks are largely oriented perpendicular to the midline of the cell (left). ∆tagO cells show round morphologies with unaligned MreB motion (right). (B) Median inter-track angle difference for track pairs ≤ 1 μm apart, plotted for BEG300 at several tagO induction levels, ∆tagO cells, and a simulation of randomly oriented angles (sim). n > 1300 for all data points. For spherical cells width is not measurable, indicated with a dashed red line. (C) ∆pbpH cells with pbpA under IPTG control display aligned MreB motion when pbpA is fully induced and cells are rods (left), but display unaligned MreB motion as Pbp2a levels reduce and cells become round (right). (D) Median inter-track angle difference for track pairs 1 μm apart during Pbp2a depletion with cell widths at each time point. Error bars are SEM, n > 600 for all data points. (E) Median angle from the midline (white circles) calculated for all rod-shaped cells from experiments in 2A-D plotted as a function of cell width. MreB filament alignment falls off rapidly beyond 2 μm, a point corresponding to where cells become round, as shown by the ratio of principal curvatures (blue squares) approaching 1. Error bars are SEM, n = 2993. See Figure 2—figure supplement 1E for further explanation. (F) Schematic showing the difference between the 2D surface curvature profile of rods and spheres. On the inside surface of spheres, all points have negative, yet equal values for both principal curvatures. In rods, however, one principal curvature is negative (the radius), while the other is 0 (the flat axis along the rod). All scale bars are 1 μm. All error bars are SEM. See also Figure 2—figure supplement 1.
-
Figure 2—source data 1
Figure 2B – Median angle difference between track pairs at 2 mM, 6 mM, 15 mM and 30 mM xylose and in the tagO knockout, along with Standard Deviation (SD) values and the number of track pairs analyzed (N).
This data was used to create Figure 2B. Figure 2D – Changes in (i) the median angle difference between track pairs and (ii) mean cell width over time during a Pbp2 depletion, along with Standard Deviation (SD) and the number of track pairs (N). This data was used to create Figure 2D. Figure 2E – Median track angles from the cell midline binned as a function of cell width and the ratio of principal curvatures k1/k2 also binned over the same cell width. This data was used to create Figure 2E.
- https://doi.org/10.7554/eLife.32471.011
-
Figure 2—source data 2
Figure 2—figure supplement 1A – Angular correlation between track pairs binned as a function of the distance between the pair at various xylose concentrations and in the tagO knockout.
Figure 2—figure supplement 1B – Mean curvature of cell contours (curvature) and the median track angle (angle) over time during a Pbp2 depletion, along with Standard Deviation and the number of tracks used in the analysis at each time point. Figure 2—figure supplement 1C – Data from Figure 2E is split here to show the median angle from the cell midline as a function of cell width during a Pbp depletion and at various steady state TagO levels, along with Standard Deviation (SD) and the number of tracks (N). This data was used to create Figure 2—figure supplement 1C. Figure 2—figure supplement 1D – Raw track angle values of GFP-MreB from the cell midline in rod-shaped cells at various xylose levels (8, 12 and 30 mM), along with their associated frequency distributions.
- https://doi.org/10.7554/eLife.32471.012
Figure 2—figure supplement 1
Relationships between cell width, MreB orientation, and cell shape.
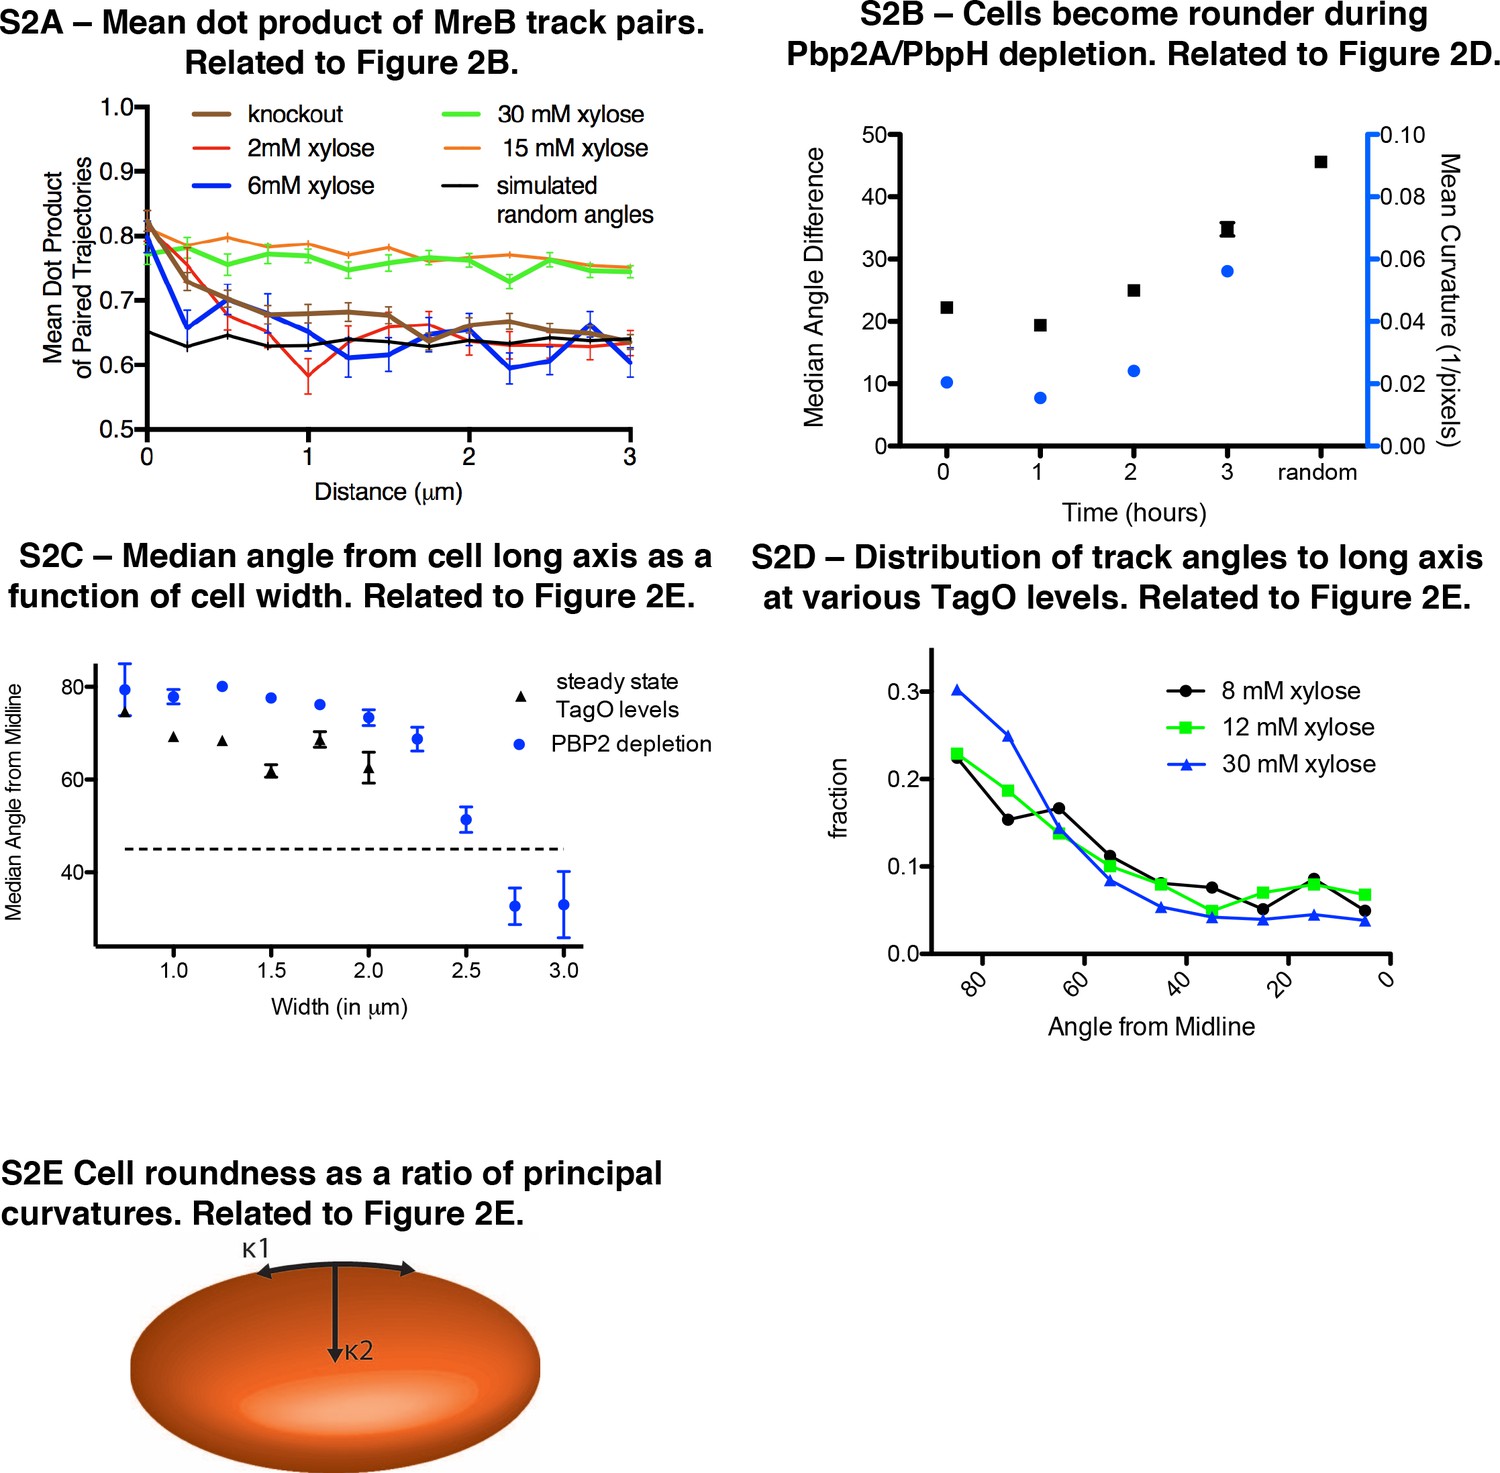
(A) The mean dot product of MreB track pairs vs. distance between the pairs was calculated and binned at 0.25 μm intervals. This shows a high alignment between pairs across the cell length for rods at high xylose (15 and 30 mM). Round cells (2 and 6 mM xylose) show a high alignment at very short distances (<500 nm), beyond which alignment falls off rapidly, approaching the value expected for randomly oriented angles (black line represents a simulation of a uniform angular distribution). n > 1300 for each xylose condition. (B) Mean sidewall curvature of cells increases during a Pbp2a/PbpH depletion (blue circles), along with a decrease in aligned MreB motion (black squares). n > 600 at each time point. (C) Median angle from the long axis of cells as a function of cell width at steady state TagO levels (n = 2062) and PBP2a depletions (n = 2407) (shown separately). (D) MreB filament motion is predominantly circumferentially oriented over a range of xylose levels (8–30 mM) even though cells show varying widths. At 8 and 12 mM xylose, cells are a mix of rods and spheres, and therefore angles were only calculated for cells with identifiable long axes. n > 400 for each xylose condition. (E) The principal curvatures along the cell length (κ1) and cell width (κ2) are calculated and the ratio κ1/κ2 is taken as a measure of cell roundness. Cells become round as this ratio approaches 1. All error bars are SEM.
Figure 2—video 1
Timelapse showing circumferential motions of GFP-MreB in rod shaped cells with high TagO expression (BEG300 with 30 mM xylose, and GFP-MreB induced with 50 μM IPTG).
(Second sequence) Timelapse of GFP-MreB trajectories in equivalent conditions. (Third sequence) Timelapse showing isotropic motions of GFP-MreB in a tagO knock out strain (BEG203, GFP-MreB was induced with 5 mM xylose. (Fourth sequence) Timelapse of GFP-MreB trajectories in equivalent conditions. (Fifth sequence) Timelapse showing circumferential motions of GFP-Mbl in wild type rod shaped cells (BJS18, GFP-Mbl was induced with 10 mM xylose). (Sixth sequence) Timelapse of GFP-Mbl trajectories in equivalent conditions. (Seventh sequence) Timelapse showing isotropic motions of GFP-Mbl in a tagO knock out strain (BEG203, GFP-Mbl was induced with 5 mM xylose). (Eighth sequence) Timelapse of GFP-Mbl trajectories in equivalent conditions. Frames are 1 s apart in sequence 1–2, 5 s apart in sequence 3–4, and 2 s apart in sequences 5–8. All scale bars are 1 μm.
Figure 2—video 2
Timelapse of GFP-Mbl trajectories occurring 2 hr after the initiation of Pbp2a depletion.
(middle and bottom) Timelapse of GFP-Mbl trajectories occurring 3 hr after initiation of Pbp2a depletion, where cells become a mixture of rod shaped and round cells. GFP-Mbl shows a mixture of circumferential (bottom) and isotropic (middle) motion. (Second sequence) Timelapse of GFP-MreB trajectories occurring 1 hr (top), 2 hr (middle), and 3 hr (bottom) after the initiation of Pbp2a depletion. After 1 hr, cells are rods and only show circumferential motion. At 2 hr after initiation of depletion, cells are wider rods, but still show mostly circumferential motion. BRB785 (for GFP-Mbl) or BRB786 (for GFP-MreB) was grown in 1 mM IPTG, washed, then grown in media lacking IPTG. Cells were placed under a pad at the indicated times and imaged with spinning disk confocal. Frames are 5 s apart. Scale bar is 2.5 μm.
Figure 3 with 3 supplements
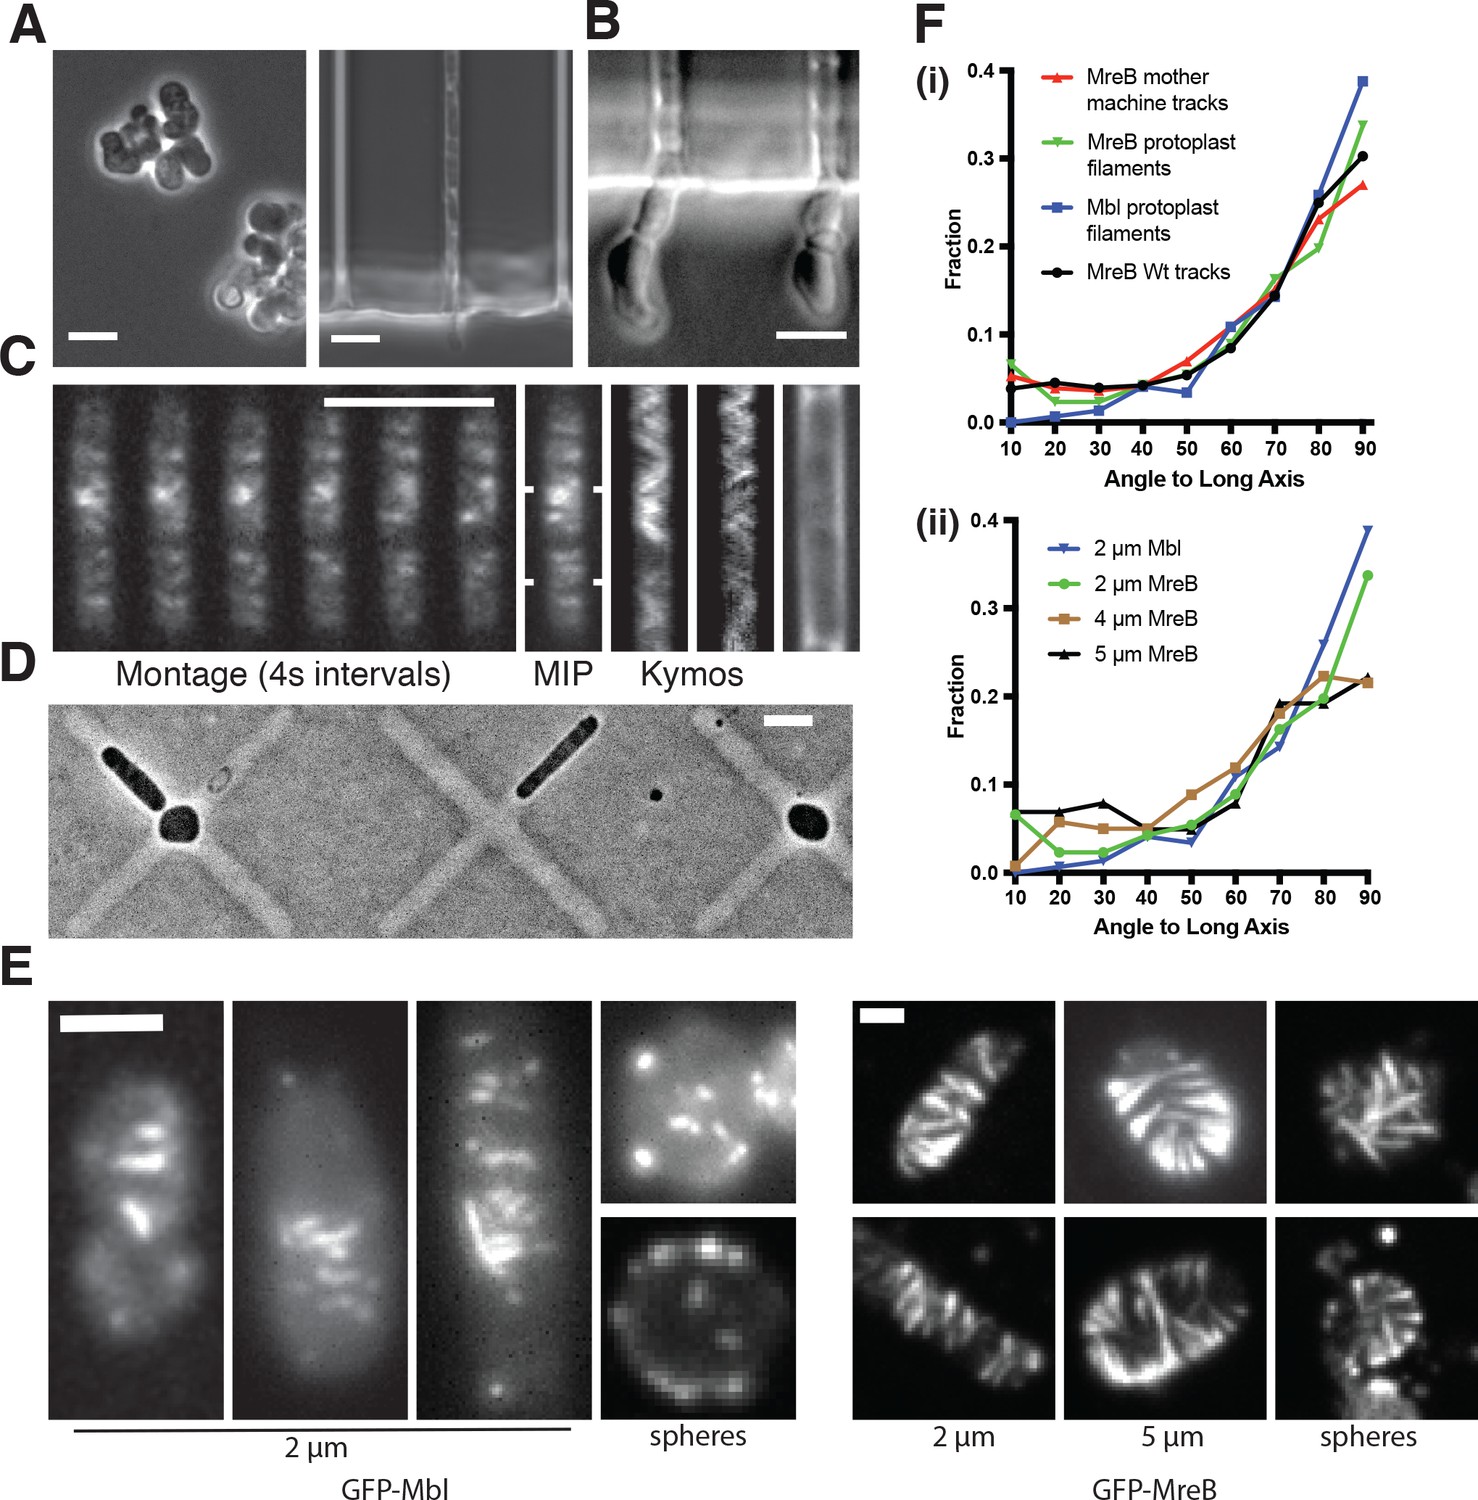
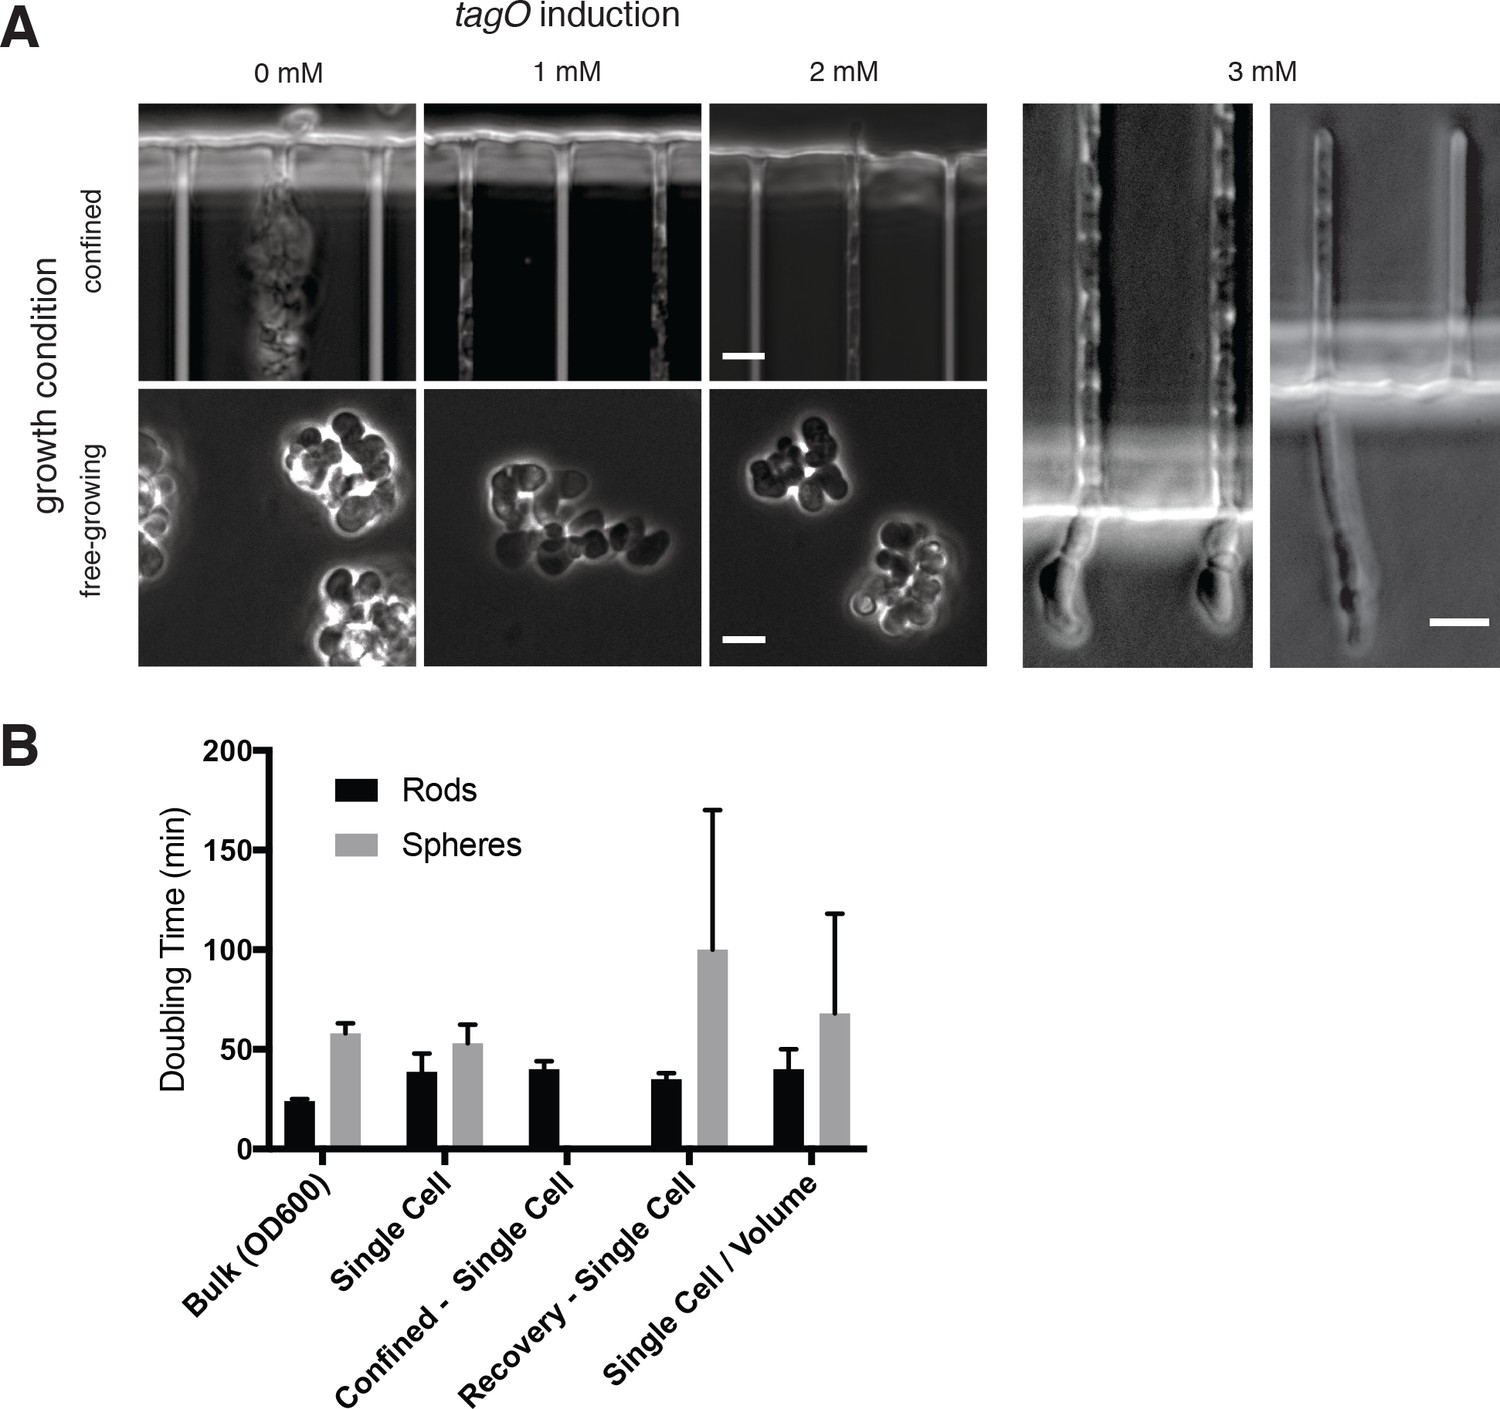
MreB filaments orient when rod shape is induced by external confinement.
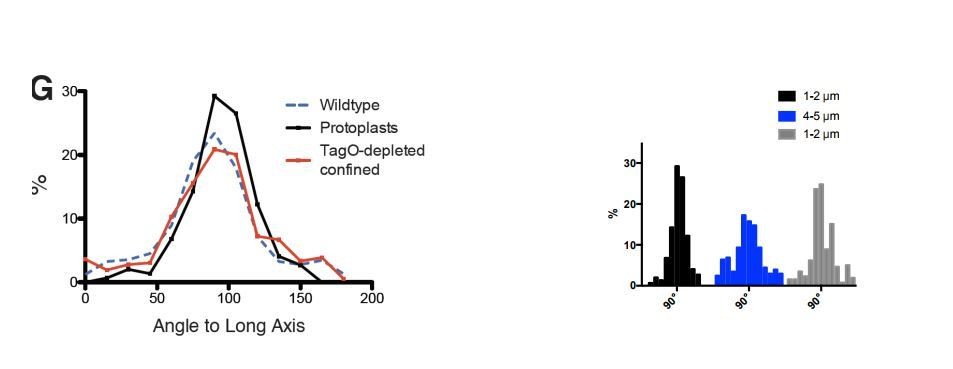
(A) Phase contrast images of BEG300 grown in LB supplemented with 2 mM xylose and 20 mM Mg2+ in bulk culture (left) or confined into microfluidic channels of 1.5 1.5 μm (right). (B) Confined cells induced at 3 mM xylose in 20 mM Mg2+ progressively swell upon escaping confinement into free culture. See also Figure Figure 3—figure supplement 1A. (C) (Left) Fluorescence microscopy montage of MreB filaments moving across a confined cell of BEG300 induced at 2 mM xylose in 20 mM Mg2+. (Right) Maximal intensity projection of montage, kymographs of marked points and a phase contrast image of the cell. Scale bars for a-c = 5 μm. (D) Phase contrast images of protoplasts contained in agar crosses. Cells in the center grow to be round while cells in arms grow as elongated rods. (E) (left) Short GFP-Mbl filaments orient circumferentially in rod-shaped protoplasts (2 μm) but lack orientation in round protoplasts (spheres). (right) Long GFP-MreB filaments orient in rod-shaped protoplasts (2 μm); GFP-MreB filaments are still oriented in wider rod-shaped protoplasts (5 μm), but not to the same extent. In round protoplasts, GFP-MreB filaments are unoriented (spheres). Scale bar is 2 μm. (F) (i)The angular distribution of filaments within protoplasts (Protoplast filaments) is peaked at 90° (mean deviation = 34°, n = 147), similar to that of MreB motion in TagO-depleted, confined cells (Mother machine tracks) (mean deviation = 36°, n = 359) and MreB motion in wild-type cells (Wt. tracks) (mean deviation = 34°, n = 1041). (ii) In channels of varying widths (2, 4 and 5 μm), the orientation of GFP-MreB filaments remains circumferential, peaking at 90° but the filament angles deviate more from 90° as channel width increases (mean deviation = 34°, n = 258 at 2 μm), (mean meviation = 35°, n = 260 at 4 μm) and (Mean Deviation = 41°, n = 203 at 5 μm.). All mean deviation”values are calculated as the mean deviation from 90°.
-
Figure 3—source data 1
Figure 3Fi – Raw angle values from the cell midline of wildtype MreB tracks (tracks), MreB tracks in confined cells (mother machine) and MreB filaments in protoplasts (filaments), along with their associated frequency distributions.
Figure 3Fii – Raw angle values from the cell midline of GFP-MreB filaments at varying cells widths (1–2 um, 3–4 um and 4–5 um) and GFP-Mbl filaments (mbl), along with their associated frequency distributions.
- https://doi.org/10.7554/eLife.32471.017
-
Figure 3—source data 2
Figure 3—figure supplement 1B – Doubling times (min) and Standard Deviation (SD) of rod-shaped and spherical cells measured by taking bulk OD600 measurements (Bulk), using single cell measurements (Single Cell), single cell measurements in cells recovering rod shape (Recovery Single), single cell measurements normalized to the cell volume (Single/Volume) and single cell measurements in spherical cells confined to rod shape (Confined).
This data was used to create Figure 3—figure supplement 1B.
- https://doi.org/10.7554/eLife.32471.018
Figure 3—figure supplement 1
TagO levels and confinement.
(A) Microfluidic confinement controls cell shape in cells with low TagO levels. (Left) Phase contrast images of BEG300 grown under differing teichoic acid induction levels in bulk culture or confined in chambers. (Right) Cells swell upon escaping from confinement. Swelling is visible both at initial stages of depletion, corresponding to when MreB movies were collected (left panel, cf. Figure 3C and Supplementary Movie 3), or at longer stages when cells were chained (right panel). Scale bars = 5 μm. (B) Doubling time of BEG300 in different conditions. ‘Bulk’ indicates cultures grown in liquid suspension and measured by OD600.‘Single Cell’ indicates cells were grown under agarose pads, with doubling time measured by assaying the change in cell area over time using phase contrast microscopy. ‘Confined - Single Cell’ indicates the doubling time of cell area of TagO-depleted cells confined into rod shape in microchambers as in Figure 3A and Figure 3—figure supplement 1A; ‘Recovery –Single Cell’ is the single-cell doubling time (in volume) of TagO-depleted cells during rod shape recovery in a cellASIC microfluidic device as in Figure 5B. Note that spherical cells in these recoveries show a slower doubling time with a larger standard deviation due to a subpopulation of cells dying during the experiment; ‘Single cell/Volume’ indicates the doubling time of the volume of single cells grown in a cellASIC microfluidic device. As this chamber has a fixed Z height, cell volume can be approximated from measures of the 2D area. Error bars are standard deviation.
Figure 3—video 1
Timelapse showing circumferential motion of GFP-MreB in BEG300 induced at low TagO levels (2 mM xylose) when confined into long 1.5 × 1.5 μm channels.
GFP-MreB was induced with 50 μM IPTG. Frames are 2 s apart. Scale bar is 5 μm.
Figure 3—video 2
Timelapse showing GFP-MreB (top) and GFP-Mbl (bottom)in protoplasted cells showing Mbl does directionally.
BJS18 (containing GFP-Mbl) or BEG300 (containing GFP-MreB) expressed at an ectopic site under xylose control) were induced with 30 mM xylose. Cells were then protoplasted in SMM and grown in molds as detailed in methods. Frames are 1 s apart. Scale bar is 5 μm. Movie was gamma-adjusted,γ = 0.8.
Figure 4 with 2 supplements
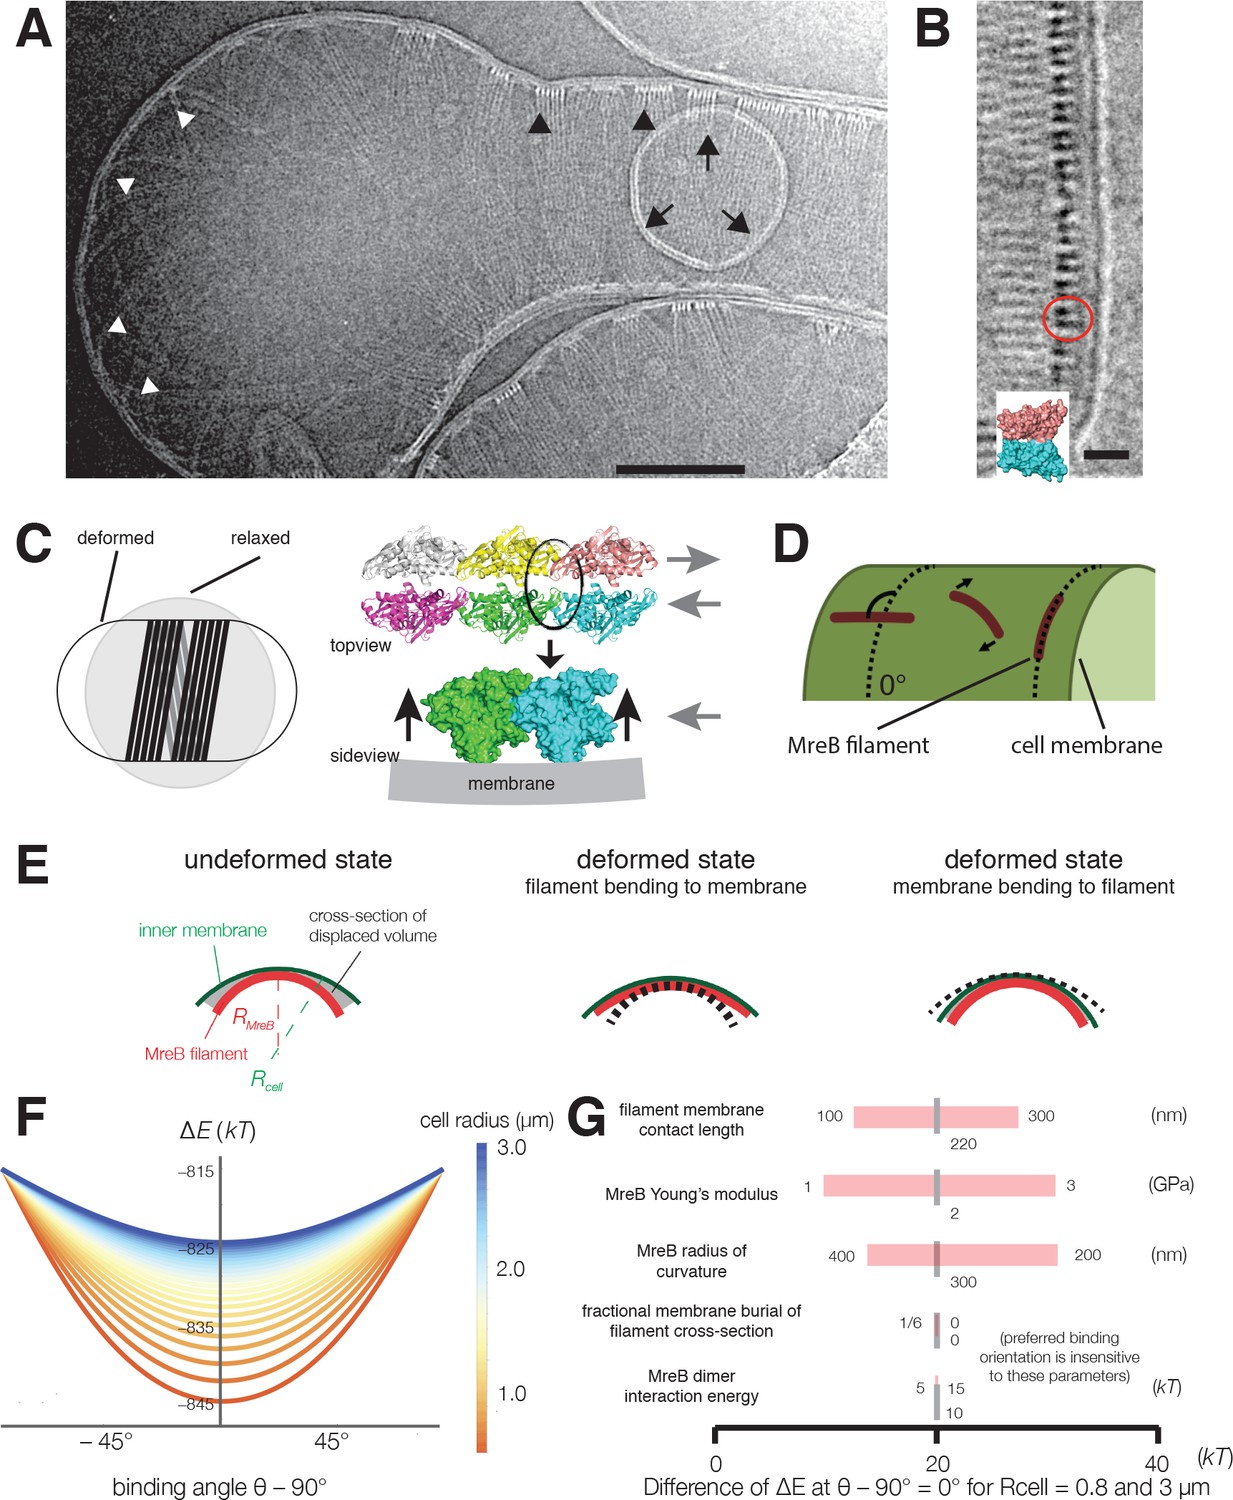
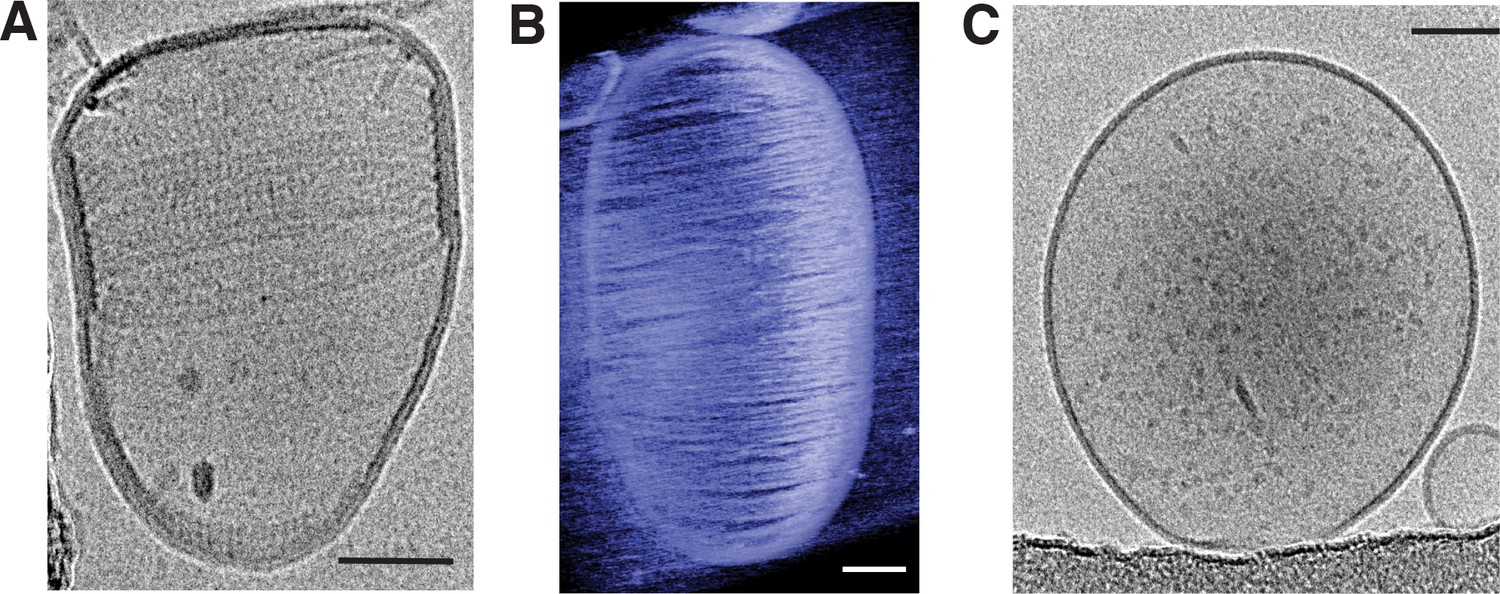
Cryoelectron tomography shows T. maritima MreB filaments assembled in liposomes align perpendicular to the rod axis.
(A) Cryoelectron tomography of T. maritima MreB filaments assembled inside liposomes. Black arrowheads show aligned bundles of filaments in a tubulated liposome, white arrowheads show unaligned bundles in a spherical region of the same liposome. Arrows show a positively curved surface inside the liposome, to which no MreB filaments bind. Scale bar is 100 nm. See also Figure 4—figure supplement 1. (B) Zoomed in view of MreB filaments within a tubulated liposome shows MreB adopts a double-stranded antiparallel protofilament arrangement (dark lobes), consistent with previous models of MreB monomer interactions (colored structure in inset) (van den Ent et al., 2014). The red circle indicates the cross-section of an MreB filament, modelled in the inset. Scale bar is 50 nm. (C) (left) Schematic drawing depicting the cause of the shape change from spherical to rod-shaped liposomes: MreB wants to attain greater curvature and since there are many filaments, they are laterally stabilized. As the liposome is much more easily deformable than cells, the resulting energy minimum is a deformed liposome with an MreB helix on the inside. (right) Model showing why the unusual architecture of MreB filaments might have been selected during evolution: its juxtaposed subunits in the two antiparallel protofilaments produce putative hinges that could be the region of bending for these filaments. Canonical F-actin filament architectures, with staggered subunits, would need bending within the subunits, which is less easily achieved. Modeling of MreB – membrane interactions and filament orientation. (D, E) Hydrophobic residues are located on the outer edge of the antiparallel MreB double filament, which is here modeled as an elastic cylindrical rod. To achieve maximum hydrophobic burial, membrane deformation, MreB bending, or a combination of the two may occur. (F) A plot of the change in total energy (∆E) caused by the MreB-membrane interaction against the binding angle θ for various cell radii shown in the color scheme on the right. Note that ∆E is minimal at θ = 90°, which agrees with the observed orientation of MreB binding and motion. At larger rod radii, the energetic well becomes flatter and MreB binding becomes more susceptible to thermal fluctuations and other sources of stochasticity, which would result in a broader angular distribution of filaments. (G) A sensitivity analysis of the model over a range of model parameters.
Figure 4—figure supplement 1
T. maritima MreB filaments assembled in liposomes support alignment around the rod axis.
(A) Cryoelectron tomography shows that the arrangement of MreB filaments inside liposomes is helical. Scale bar is 50 nm. (B) Many long T. maritima MreB filaments inside an artificial liposome, assembled in vitro and imaged by cryoelectron tomography. Almost the entire inner surface of the liposome is covered with filaments, leading to deformation of the normally spherical liposome. Corresponding movie: SM5, first part. Scale bar is 50 nm. (C) Control showing that liposomes are spherical in the absence of MreB. Scale bar is 50 nm.
Figure 4—video 1
(first sequence) PyMOL volume rendering of an electron cryotomography 3D map of T. maritima MreB included in a liposome (corresponds to liposome depicted in Figure 4E.
(second sequence) Typical field view of an MreB liposome reconstitution experiment. The movie scans through consecutive Z-layers of the tomographic 3D reconstruction. Note that the smaller, round liposomes trapped inside the rod-shaped liposomes are not decorated with MreB filaments.
Figure 5 with 3 supplements
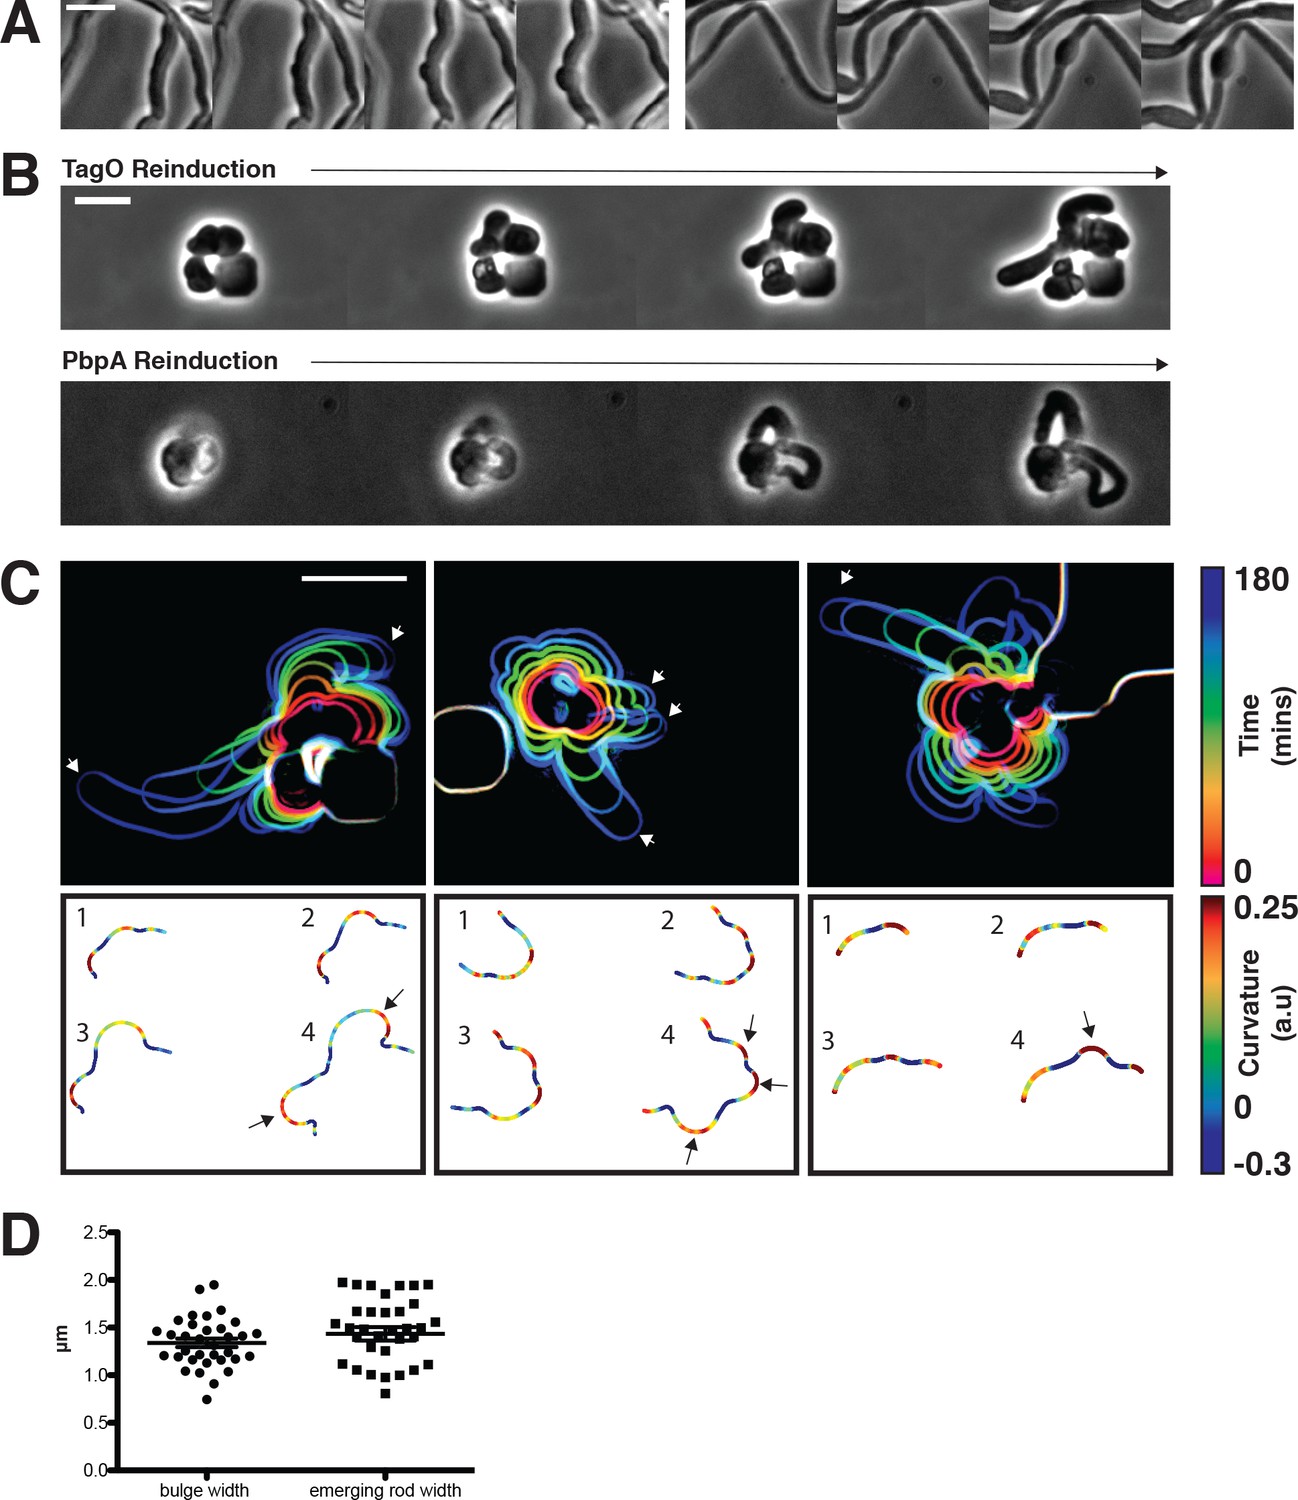
Sphere to rod transitions occur locally, then rapidly propagate.
(A) Loss of rod shape proceeds continuously and without reversals, as shown by BEG300 cells grown in 12 mM xylose, shifted from 1 mM Mg2+ to 100 μM Mg2+ on a pad. Frames are 5 min apart. (B) Increases in expression of tagO or pbpA from depleted spherical cells causes cells to emit rapidly elongating rods from discrete points. (Top) BEG300 cells in 20 mM Mg2+ were grown in 0 mM xylose for 4 hr, then transferred to a microfluidic chamber and grown in 0 mM xylose and 20 mM Mg2+ for 1 hr. Following this, tagO expression was induced with 30 mM xylose at the first frame. (Bottom) BRB785 cells in 20 mM Mg2+ were depleted of Pbp2a by growth in 0 mM IPTG for 4 hr. At the start of the frames, they were transferred to an agar pad containing 1 mM IPTG to induce pbpA expression. Frames are 30 min apart. (C) Plots of cell contours as cells recover from TagO depletion: (top) cell outlines are colored in time red to blue (0–180 min). White arrows indicate emerging rods; (bottom) heat maps of curvature show that rods emerge from small outward bulges (red) flanked by inward curvatures (blue). Black arrows indicate points where emerging rods form. (D) The width of initial bulges and the rods that emerge from them are highly similar, indicating the initial deformations may set the starting width of the rods. Error bars are SEM, n = 33. All scale bars are 5 μm.
-
Figure 5—source data 1
Figure 5D – Widths of the initial outward bulges (bulge) and eventual emerging rods (emerging rod) during multiple sphere to rod transitions by the re-induction of tagO.
- https://doi.org/10.7554/eLife.32471.026
-
Figure 5—source data 2
Figure 5—figure supplement 1C – 1/doubling time measured at various points in the xylose, magnesium phase space.
This data was used to create Figure S5C.
- https://doi.org/10.7554/eLife.32471.027
Figure 5—figure supplement 1
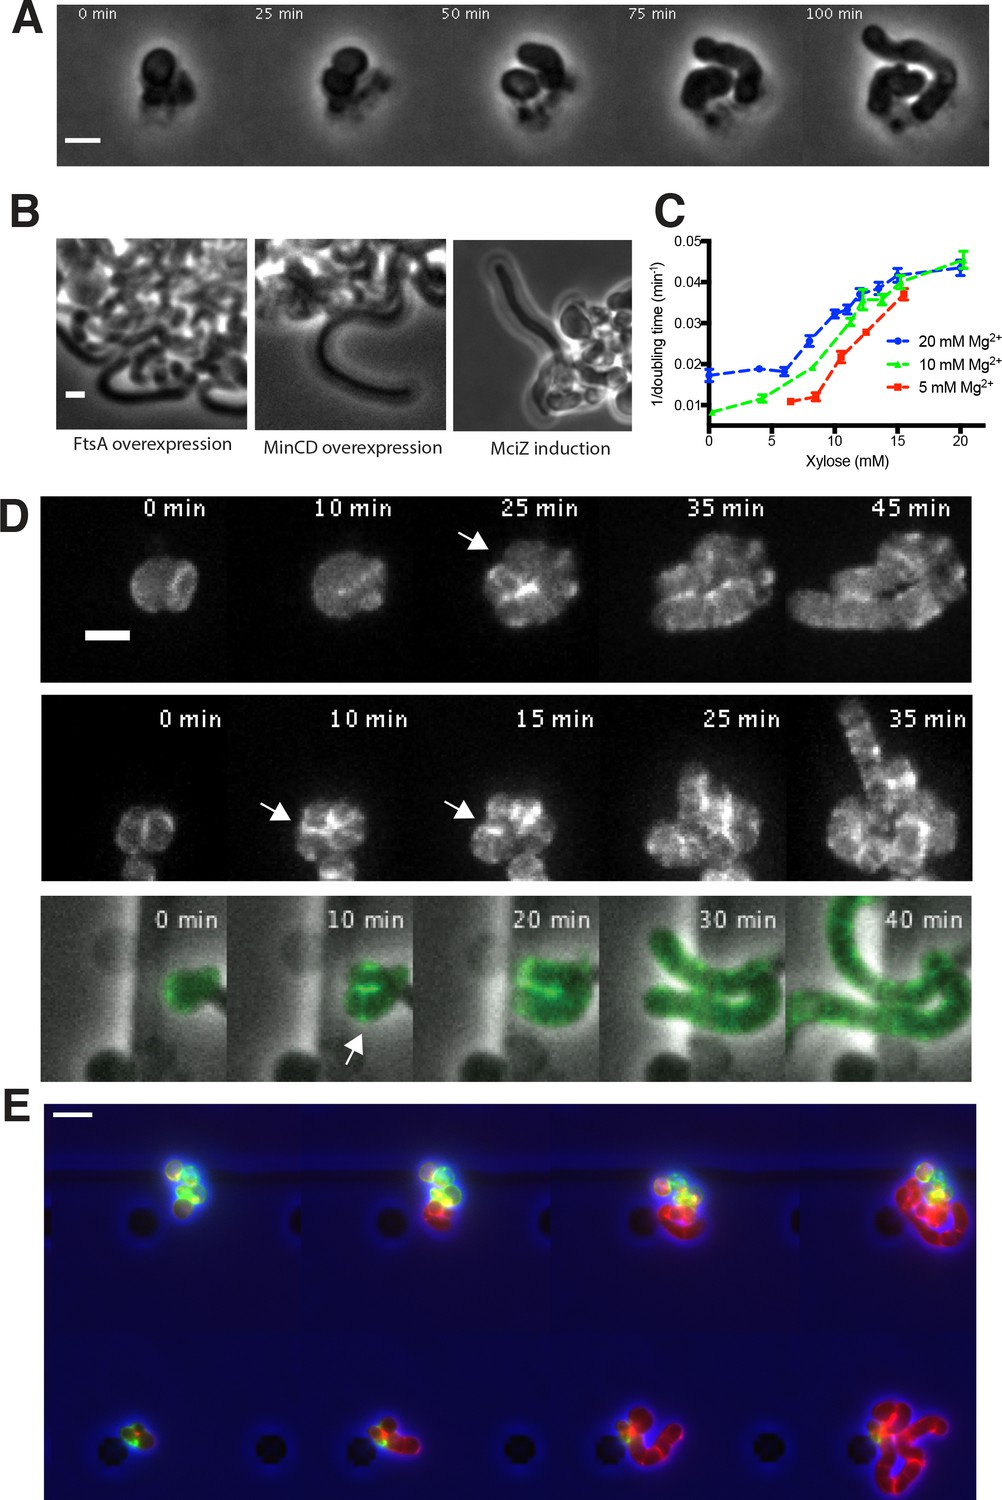
Growth of rod-shaped and spherical cells measured by doubling times, and rod shape recovery.
(A) A montage of a rod shape recovery occurring after a division that produced an ovoid, near rod-shaped cell that subsequently elongated as a rod. This example taken from an experiment with BRB785, where Pbp2a was first depleted (in a pbpH null) to make round cells, then Pbp2a was reinduced with 1 mM IPTG. See also bottom panel of Figure 5—figure supplement 1D. (B) Rod shape recovery occurs in the absence of cell division and FtsZ filaments. Inhibition of FtsZ filaments was conducted by three means: FtsA overexpression (bAB388, grown with 1 mM IPTG and 60 mM xylose), MinCD overexpression (bAB327 grown with 1 mM IPTG and 60 mM xylose), and MciZ induction (bAB343 grown in 1 mM IPTG and 30 mM xylose). In all cases, cells recovered rod shape. (C) Rate of doubling (1/doubling time), calculated from OD600, increases with increasing levels of TagO as round cells become more rod-like. Increasing Mg2+ causes these curves to shift leftward, as Mg2+ stabilizes rod shape in combination with WTAs (see Figure 1—figure supplement 1). Error bars are SEM. (D) MreB localizes in a ring-like structure (white arrows) at the neck of emerging bulges, immediately prior to rod shape formation. BEG300, containing GFP-MreB was depleted of TagO by growing in bulk culture in media lacking xylose. Cells were then loaded into a cellASIC device and grown for 2 hr in the same media with 1 mM IPTG added to induce GFP-MreB expression. At the start of imaging, the media was switched to 30 mM xylose to induce TagO expression, and Z-stacks of GFP MreB were taken using a spinning disk confocal every 5 min. Shown is the maximal intensity projection of entire cell. (E) Pulse chase labeling with FDAAs during TagO recoveries indicates that while emerging rods are composed of new cell wall, both spheres and rods incorporate new cell wall material. BCW82 was grown in a microfluidic chamber with 0 mM xylose, 20 mM Mg2+, and 3 μM HADA (green). Prior to imaging the medium was switched to 30 mM xylose (to induce TagO expression), 20 mM Mg2+ and 3 μM cy3B-ADA (red, to visualize new cell wall incorporation). Cell outline (from phase) is shown in blue. Scale bar is 5 μm; frames 30 min apart.
Figure 5—video 1
(top and middle) Timelapses showing the local recovery of rod shape upon TagO reinduction from depleted cells.
Note the relatively fast growth of rods compared to parent spheres. BEG300 was grown in media lacking xylose, then either loaded into a cellASIC device (top row) or placed under an agar pad (middle row). Both rows were shifted to 30 mM xylose to induce rod-shape recovery, prior to image acquisition. Frames are 10 min apart. Scale bar is 5 μm. (bottom) Timelapse showing the local recovery of rod shape upon Pbp2a reinduction from cells depleted of Pbp2a/PbpH. BRB785 was grown media lacking IPTG for 4.5 hr, then placed on a pad with 1 mM IPTG before the start of imaging. Frames are 5 min apart. Scale bar is 5 μm.
Figure 5—video 2
Timelapse showing the loss and recovery of rod shape in cells with intermediate TagO levels, induced by removal and subsequent readdition of MgCl2.
BCW51 was grown in LB supplemented with 8 mM xylose and 20 mM MgCl2, then loaded into a cellASIC chamber, and grown in the same media for 30 min. At the start of the video the media is switched to contain 0 mM MgCl2, causing the cells to lose rod shape. At 4:00:00 the media is switched to contain 20 mM MgCl2 where the cells revert back into rod-shaped cells. Frames are 20 min apart. Scale bar is 1 μm.
Figure 6 with 5 supplements
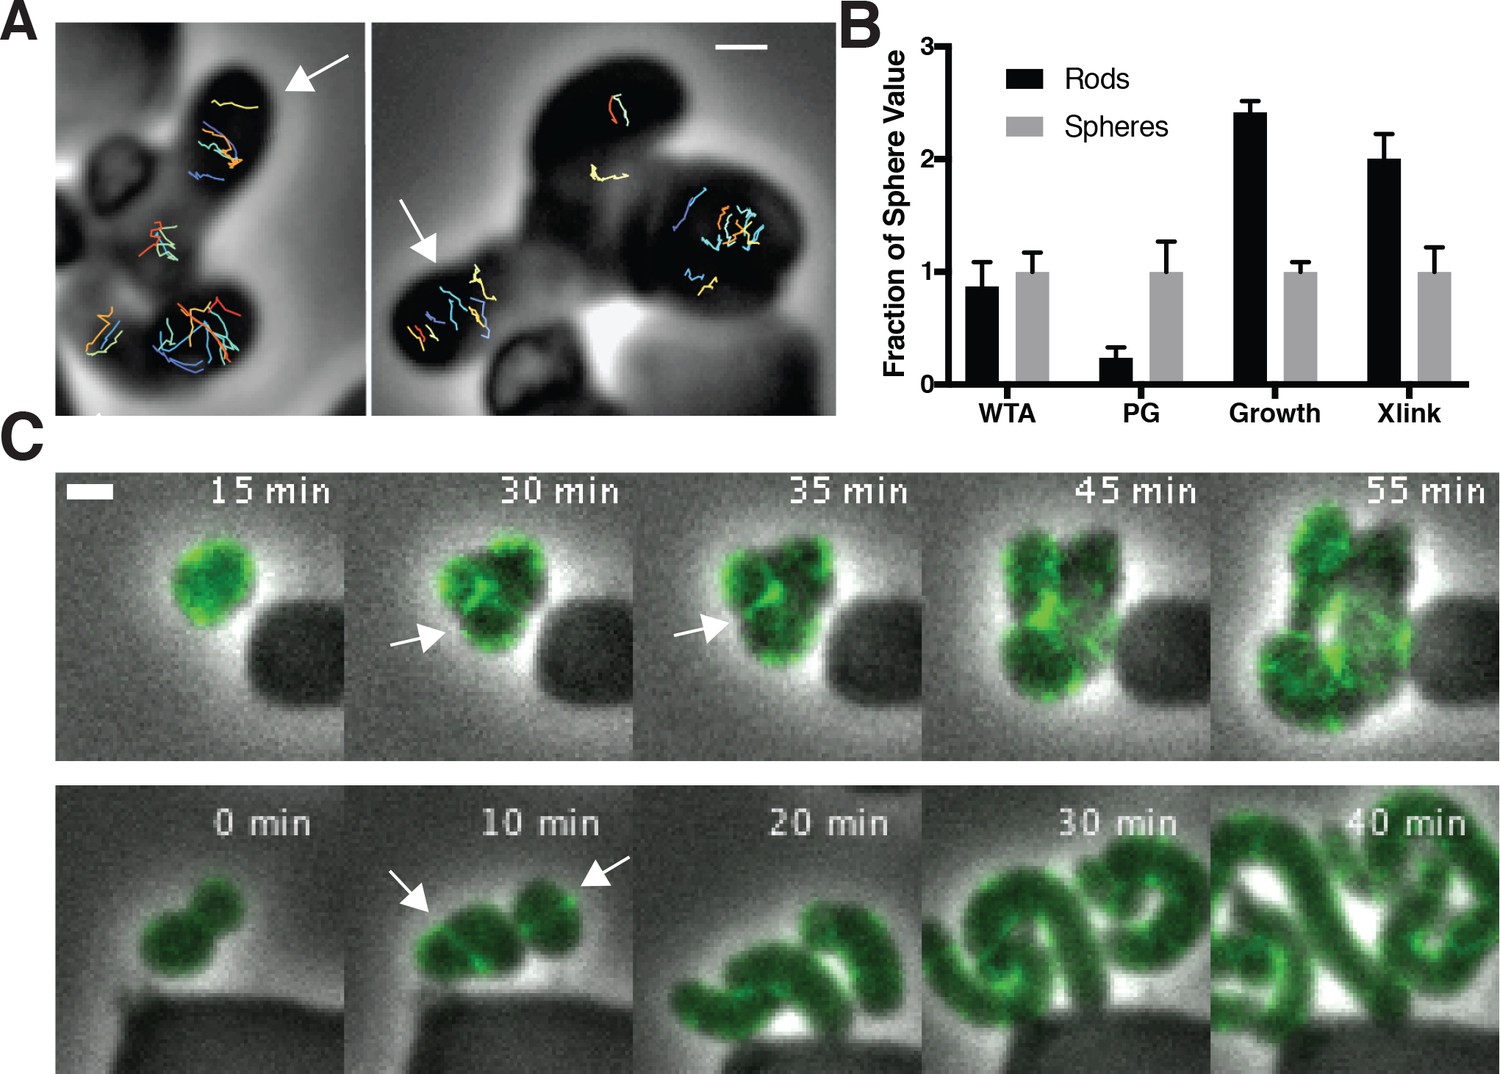
Oriented MreB motion is coupled to rod shape formation and preceded by transient MreB accumulation at the bulge neck.
(A) (left) GFP-MreB trajectories during a sphere to rod transition. Emerging rods exhibit oriented MreB motion (white arrows) while attached round cells have unoriented motion. Scale bar is 1 μm. (B) During shape recoveries, immediately before rod emergence, MreB transiently accumulates in a bright ring where the bulge connects to the parent sphere. See also Figure 5—figure supplement 1D. Scale bar is 2 μm. (C) Fold change between spheres and rods in the teichoic acid incorporation and growth rate, assayed by OD600 measurements (inducible TagO with 30 mM xylose in LB with 20 mM Mg2+). Error bars are SD. See also Figure 3—figure supplement 1B and Figure 6—figure supplement 1B.
-
Figure 6—source data 1
Figure 6C – Ratio of wall teichoic acid localization (WTA) as measured by ConA staining, and single cell growth rates in rod-shaped and spherical cells.
- https://doi.org/10.7554/eLife.32471.033
-
Figure 6—source data 2
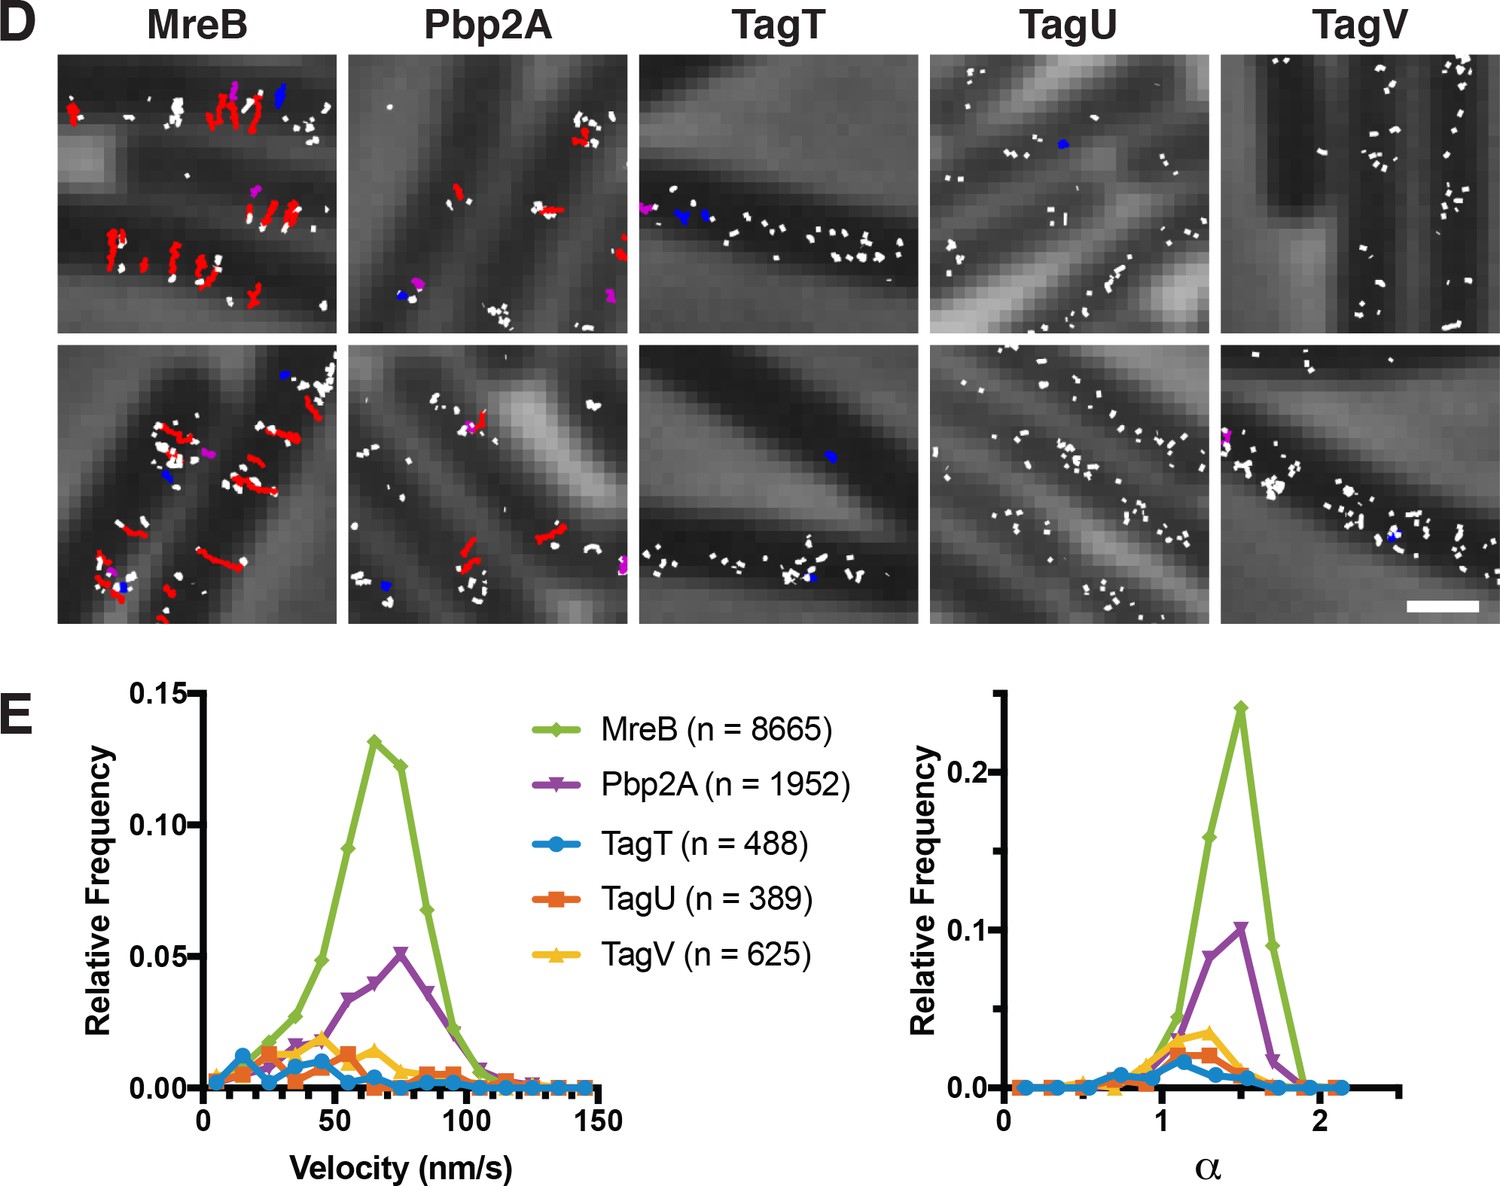
Figure 6—figure supplement 1E – Frequency distributions of the velocity and alpha values of TagT, TagU, TagV, MreB and Pbp2A tracks.
This data was used in Figure S6E.
- https://doi.org/10.7554/eLife.32471.034
Figure 6—figure supplement 1
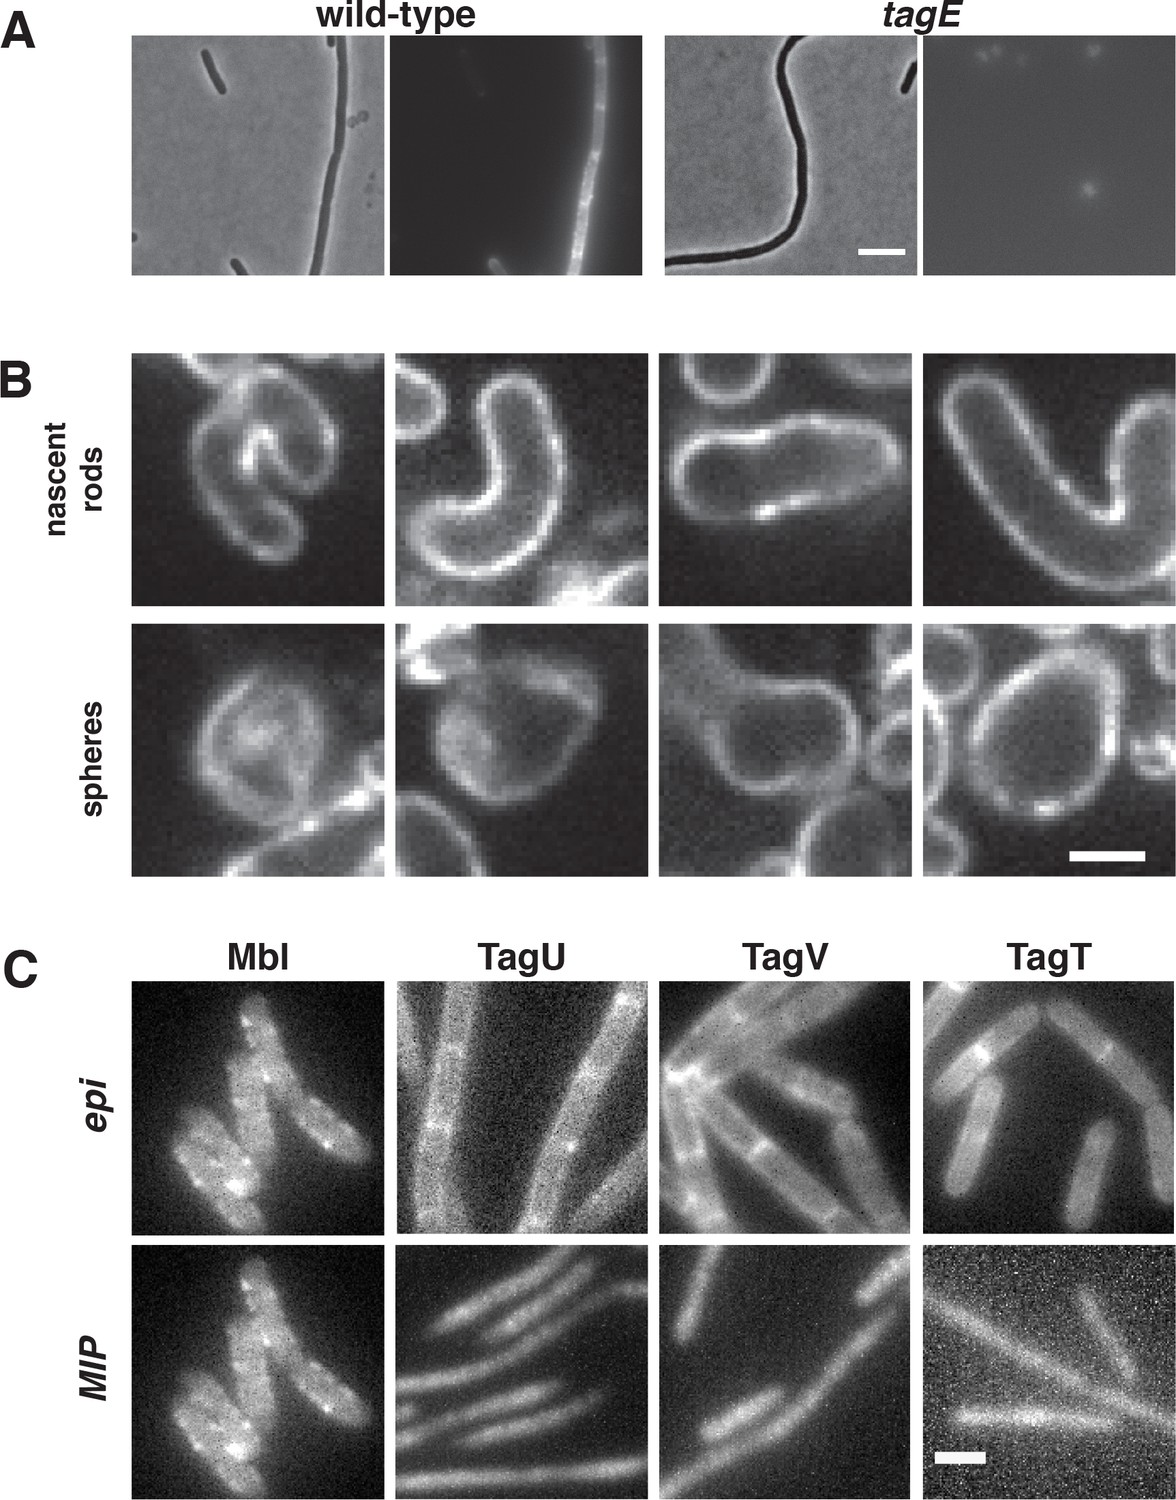
ConA staining of cells during rod shape recovery and localization of WTA ligases.
Concanavalin A conjugated to Alexa Fluor 647 specifically stains wall teichoic acids and localizes equally to both rods and spheres during sphere to rod transitions. (A) A comparison of PY79 and ΔtagE cells stained with ConA-A647 reveals specificity of ConA for WTAs. The tagE gene is responsible for the glycosylation of wall-teichoic acids, rendering them susceptible to ConA binding. Scale bar is 5 μm. (B) Fluorescence intensity of Alexa647-ConA, is comparable in rod shaped and round cells during sphere to rod recoveries. Furthermore, the WTA incorporation is diffuse, and not banded or localized. BEG300 was grown in bulk culture and rod shape was induced by increasing TagO levels (0 to 30 mM xylose). Scale bar is 2.5 μm. (C) Wall teichoic acid ligases diffuse homogenously across the cell surface. Ligases were tagged at the native locus and promoter with msfGFP and imaged continuously with 100 ms exposures. Epifluorescent images were collected under oblique laser illumination and maximal intensity projections (MIPs) were created over 100 frames of TIRF illumination (see Figure 6—video 2). For comparison, msfGFP-tagged Mbl, which localizes in discrete patches, is shown. Scale bar is 2 μm.
Figure 6—figure supplement 2
Single molecule tracking of WTA ligases.
(D) Single molecule tracking of TagT, TagU, and TagV indicates these proteins do not move directionally like MreB. HaloTag fusions to MreB, Pbp2a, TagT, TagU, and TagV, expressed from the native promoter and locus, were sparsely labeled using JF549, then imaged with TIRFM at a 250 msec frame rate. At this acquisition speed directional motion is easily tracked, while particles diffusing on the membrane cannot be tracked for more than a few frames. Trajectories from representative fields are overlayed on a phase image. Trajectories that show directional movement (α >1.25) are colored red, diffusive trajectories (0.75 < α <1.25) purple, and confined/subdiffusive (α <0.75) blue. Trajectories too short for analysis (<10 frames) are colored white. As shown, most MreB molecules move directionally, while Pbp2A has both diffusive and directionally moving molecules. In contrast, no directional motion is observed for TagT, TagU, and TagV, although a small fraction of molecules appear confined for a few seconds. (E) While only 1–5% of the ligase molecules could be tracked for over 10 frames due to their rapid motion, we analyzed the few molecules we could track. We calculated the velocities (V) (left) by fitting MSD versus t to MSD = (Vt)2 + 4Dt+4σ2 of all molecules that moved in a consistent manner during their lifetime [>0.95 r2 fit to log(MSD) versus log(t)]. α values (right) were calculated by linear fits to log(MSD) versus log(t). Shown are only molecules with velocity >5×10⁻⁵ nm/s. ‘Relative frequency’ was determined by normalizing to the number of trajectories above 10 frames in length. As expected, most MreB (54%) molecules show directional motion (α >1.25) as do a substantial, but lesser fraction of Pbp2a molecules (20%). In contrast, only a small percentage of the ligase trajectories exceeding 10 frames (which is already a small subfraction, 1–5% of the total) show α >1.25 (TagT = 1.4%, TagU = 2.8% TagV=4.8%). Furthermore, these velocities of these tracks do not appear to be drawn from the same distribution as MreB and Pbp2A. This suggests the molecules in this subset are either (1) independent of MreB, or (2) the small fraction of ‘apparently directional’ motions expected when analyzing a large number of particles undergoing random walks.
Figure 6—video 1
Timelapse of rod shape recoveries showing that circumferential MreB-GFP motion.
(A) occurs immediately upon the formation of rod shape, and (B) that circumferential motion only occurs in rod-shaped cells, even while attached non-rod cells show unaligned motion. BEG300 was grown overnight in 0 mM xylose to deplete TagO. Cells were then loaded into a cellASIC chamber and grown in the same media with 1 mM IPTG to induce GFP-MreB. Prior to imaging, tagO expression was reinduced by switching media to contain 30 mM xylose. GFP-MreB was imaged with TIRFM. Frames are 2 s apart in the fluorescent channel (green) and 10 min apart in the phase contrast channel (grayscale). Scale bar is 5 μm.
Figure 6—video 2
Timelapse movies showing that msfGFP fusions to the teichoic acid ligases TagT, TagU, and TagV do not move circumferentially.
Strains shown are BMD61, BCW81, BCW79 and BCW78, where Mbl, TagU (LytR), TagV (YvhJ), and TagT (YwtF) respectively are fused to msfGFP, and expressed from their native promoters. Cells were grown in CH medium and imaged using TIRF illumination every 100 ms. Scale bar is 5 μm.
Figure 6—video 3
Timelapse and tracking overlays of single molecule imaging of HaloTag-JF549 tagged MreB, Pbp2a, TagT, TagU, and TagV, all expressed from at the native promoter and locus, and sparsely labeled using low concentrations of HaloTag-JF549 dye.
Trajectories too short for analysis (<10 frames) are colored white. Analyzed trajectories show directional movement (α > 1.25) are colored red, diffusive trajectories (0.75 < α < 1.25) purple, and confined/subdiffusive (α < 0.75) are blue. Frames are 250 msec apart. Scale bar is 1 μm.
Figure 7 with 3 supplements

Model for how MreB filament orientation along the greatest curvature can both maintain and establish rod shape.
(A) Rod-shaped cells present a single curved axis along which MreB filaments orient (1). This orientation determines the direction of MreB motion (2), thus orienting the insertion of new cell wall material around the rod (3). Thiscircumferential arrangement of cell wall material reinforces rod shape (1), leading to more aligned MreB filaments, thus creating a local feedback between the orientation of MreB filaments, oriented cell wall synthesis, structural integrity of the rod, and overall rod shape. (B) MreB motion in spherical cells is isotropic (1), but the introduction of an outward bulge (2, upper) creates a curved geometry (red) at the neck of the bulge that initiatesrod shape formation. Due to the high energy of alignment in this region, (two lower and chart), any filaments that encounter the neck of the bulge would prefer to align to point around the neck rather than cross it, creating a ring-shaped region of aligned MreB motion that nucleates rod formation.Repeated rounds of oriented synthesis around the ring could initiate the elongation of a rod from the initial bulge site (3), beyond which rod shaped elongation would be self-sustaining. Colors correspond to the difference of alignment energies along the two principal curvatures at the negatively-curved neck region (red), flat regions with one dimension of curvature (yellow), and the positively-curved sphere/bulge (blue). (C) Model for how filament orientation can explain the absence of MreB at poles. (Left) MreB filaments, predominantly oriented to move around the rod width, rarely enter the poles. As filaments move directionally, any filaments within the poles will eventually translocate out of them into the cell body, where the difference in curvatures would cause them to reorient to move around the circumference. (Right) Average intensity projection of 70 s of SIM TIRF imaging of mNeonGreen-MreB at the poles of B. subtilis. The intensity projection (white) shows that most filaments rarely enter the poles. However, a few filaments are observed entering (blue traces) or leaving (red traces) the poles. Notably, filaments that move out of the poles reorient their motion to move around the rod circumference when they enter the cell body. See corresponding Movie Figure 7-video 1. Scale bar is 1 μm.
-
Figure 7—source data 1
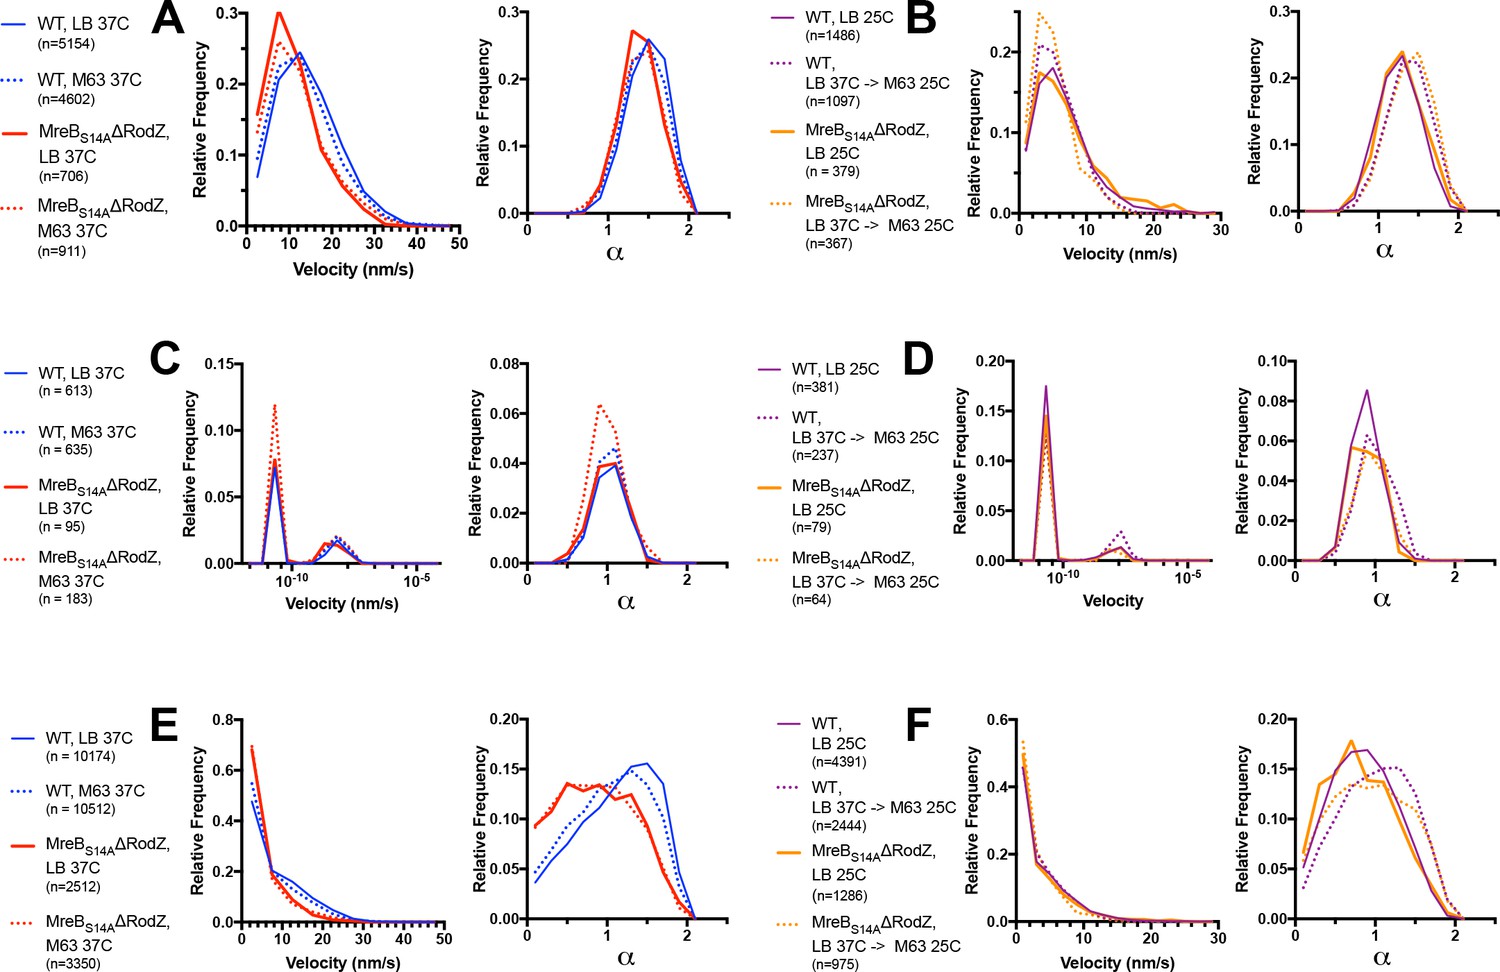
Figure 7—figure supplement 1A – Frequency distributions of the velocity and alpha values for tracks of wildtype E. coli MreB and of MreB(S14A) in ∆rodZ cells grown in (i) LB at 37° and (ii) M63 at 37°C.
Only includes trajectories that moved in a consistent manner during their lifetime [>0.95 r2 fit to log(MSD) versus log(t)], that have a velocity greater than 5 × 10⁻⁵ nm/sec. This data was used in Figure 7—figure supplement 1A. Figure 7—figure supplement 1B – Frequency distributions of the velocity and alpha values for tracks of wildtype E. coli MreB and of MreB(S14A) in ∆rodZ cells grown in (i) LB at 25°C and (ii) LB at 37°C and switched to M63 at 25°C (LB 37°C - > M63 25°C). Only includes trajectories that moved in a consistent manner during their lifetime [>0.95 r2 fit to log(MSD) versus log(t)], that have a velocity greater than 5 × 10⁻⁵ nm/sec. This data was used in Figure 7—figure supplement 1B. Figure 7—figure supplement 1C – Frequency distributions of the velocity and alpha values. Tracks with velocity greater than 5 × 10⁻⁵ nm/sec of wildtype E. coli MreB and of MreB(S14A) in ∆rodZ cells grown in (i) LB at 37° and (ii) M63 at 37°C. Only includes trajectories that moved in a consistent manner during their lifetime [>0.95 r2 fit to log(MSD) versus log(t)], that have a velocity less than 5 × 10⁻⁵ nm/sec. This data was used in Figure 7—figure supplement 1C. Figure 7—figure supplement 1D – Frequency distributions of the velocity and alpha values for tracks of wildtype E. coli MreB and of MreB(S14A) in ∆rodZ cells grown in (i) LB at 25°Cand (ii) LB at 37°C and switched to M63 at 25°C (LB 37°C - > M63 25°C). Only includes trajectories that moved in a consistent manner during their lifetime [>0.95 r2 fit to log(MSD) versus log(t)], that have a velocity less than 5 × 10⁻⁵ nm/sec. This data was used in Figure 7—figure supplement 1D. Figure 7—figure supplement 1E – Frequency distributions of the velocity and alpha values for tracks of wildtype E. coli MreB and of MreB(S14A) in ∆rodZ cells grown in (i) LB at 37° and (ii) M63 at 37°C. All traces (no filtering by the r2 fit to log(MSD) versus log(t))). This data was used in Figure 7—figure supplement 1E. Figure 7—figure supplement 1F – Frequency distributions of the velocity and alpha values for tracks of wildtype E. coli MreB and of MreB(S14A) in ∆rodZ cells grown in (i) LB at 25°C and (ii) LB at 37°C and switched to M63 at 25°C (LB 37°C - > M63 25°C). All traces (no filtering by the r2 fit to log(MSD) versus log(t))). This data was used in Figure 7—figure supplement 1F.
- https://doi.org/10.7554/eLife.32471.040
Figure 7—figure supplement 1
MreB(S14A) moves directionally and processively in E. coli lacking RodZ.
Velocity and α calculated for wild type E. coli MreB (strain NO50 - msfGFP-MreB) and E. coli lacking RodZ (strain RM478 - ΔrodZ, mreBS14A-msfGFP) under a variety of temperature and media conditions. Velocity was calculated by fitting MSD versus t to (Vt)2 + 4Dt+4σ 2. α was calculated by the slope of log(MSD) versus log(t). .α=1 is considered diffusive, α >1 directional. (A, B) Shows trajectories that moved in a consistent manner during their lifetime [>0.95 r2 fit to log(MSD) versus log(t)], that have a velocity greater than 5 × 10⁻⁵ nm/sec. (C, D) Shows trajectories that moved in a consistent manner with a velocity beneath 5 × 10⁻⁵ nm/sec. (A, C) Shows velocity and α for NO50 and RM478 both grown and imaged in (1) LB at 37° C or (2) M63-Glucose at 37°C. (B, D) Shows the velocity and α for NO50 and RM478 (1) grown and imaged in LB at 25°C, or (2) grown in LB at 37°C, then shifted to M63-Glucose pads and imaged at 25°C. Note that this analysis only examines trajectories that show directional motion, and cannot report on the fraction of moving/immobile filaments See corresponding Movie Figure 7—video 2. (E and F) Show the velocity and α calculated for all traces (corresponding to A-D), regardless of how consistent their motion (no filtering by the r2 fit to log(MSD) versus log(t)).
Figure 7—video 1
SIM TIRF timelapse of mNeonGreen-MreB at cell poles, showing that filaments moving out of the poles reorient when they move into the cell body.
(Top) – unannotated SIM TIRF timelapse sequences of filaments near cell poles. (Bottom) annotated timelapses of above cells. Cell outlines are in white, trajectories of filaments that move into the poles are blue, and trajectories that move out of the cell poles are red. Frames are 1 s apart.
Figure 7—video 2
TIRF time lapse imaging of E. coli strain RM478 (ΔrodZ, mreBS14A-msfGFP).
The MreB filaments in strain was reported to not undergo any directional motion, even though cells still retained rod shape (Morgenstein et al., 2015). In contrast, our imaging of this strain with TIRFM observes directional MreB motion at a variety of growth conditions. The first sequence shows cells both grown and imaged at 37°C in LB (top) or M63-glucose (bottom). The second sequence shows cells both grown and imaged at 25°C in LB (top) or M63-Glucose (bottom). The third sequence reproduces the growth and imaging conditions in Morgenstein Morgenstein et al. (2015), where cells were first grown at 37°C, then placed under agar pads of M63-Glucose media and imaged at 25°C.
Author response image 1
Tables
Key resources table
| Reagent type (species) or resource | Designation | Source or reference | Identifiers |
|---|---|---|---|
| strain (Bacillus subtilis) | BCW51 | This work | ycgO::Pxyl-tagO, tagO::erm, amyE::sfGFP-mreB, sinR::phleo |
| strain (B. subtilis) | BCW61 | This work | tagE::erm |
| strain (B. subtilis) | BCW72 | This work | yvhJ::PxylA-mazF (cat) |
| strain (B. subtilis) | BCW77 | This work | ywtF::PxylA-mazF (cat) |
| strain (B. subtilis) | BCW78 | This work | ywtF::msfGFP-ywtF |
| strain (B. subtilis) | BCW79 | This work | yvhJ::msfGFP-yvhJ |
| strain (B. subtilis) | BCW80 | This work | lytR::PxylA-mazF (cat) |
| strain (B. subtilis) | BCW81 | This work | lytR::msfGFP-lytR |
| strain (B. subtilis) | BCW82 | This work | tagO::erm, ycgO::PxylA-tagO, amyE::Pspac-gfp-mreB (spec), dacA::kan |
| strain (B. subtilis) | BDR2061 | (Carballido-López and Errington, 2003) 10.1016/S1534-5807(02)00403–3 | amyE::PxylA-gfp-mbl (spec), mblΩpMUTIN4 (erm) |
| strain (B. subtilis) | BEB1451 | (D'Elia et al., 2006) 10.1128/JB.01336–06 | hisA1 argC4 metC3 tagO::erm |
| strain (B. subtilis) | BJS18 | (Defeu Soufo and Graumann, 2004) 10.1038/sj.embor.7400209 | amyE::PxylA-gfp-mbl (spec) |
| strain (B. subtilis) | BMD61 | This work | mbl::mbl-msfGFP (spec) |
| strain (B. subtilis) | BRB785 | (Garner et al., 2011) 10.1126/science.1203285 | yhdG::Pspank-pbpA (phleo), pbpH::spec, pbpA::erm, mblΩPxylA-gfp-mbl (cat) |
| strain (B. subtilis) | BRB786 | (Garner et al., 2011) 10.1126/science.1203285 | yhdG::PspanK-pbpA (phleo), pbpH::spec, pbpA::cat, yvbJ::PxylA-gfp-mreB (erm) |
| strain (B. subtilis) | BEG202 | (Schirner et al., 2015) 10.1038/nchembio.1689 | ∆tagO::erm amyE::Pxyl-gfp-mbl (spec) |
| strain (B. subtilis) | BEG203 | (Schirner et al., 2015) 10.1038/nchembio.1689 | ∆tagO::erm amyE::Pxyl-gfp-mreB (spec) |
| strain (B. subtilis) | BEG281 | This work | ycgO::PxylA-tagO |
| strain (B. subtilis) | BEG291 | This work | tagO::erm, ycgO::PxylA-tagO, |
| strain (B. subtilis) | BEG275 | (Meeske et al., 2016) 10.1038/nature19331 | amyE::Pspac-gfp-mreB (spec) |
| strain (B. subtilis) | BEG300 | This work | tagO::erm, ycgO::PxylA-tagO, amyE::Pspac-gfp-mreB (spec), |
| strain (B. subtilis) | BRB4282 | (D'Elia et al., 2006) 10.1128/JB.01336–06 | 168 trpC2 ΔtagO::erm |
| strain (B. subtilis) | bAB343 | This work | ftsZ::mNeonGreen-15aa-ftsZ, amyE::spc-Pspank-mciZ, ycgO::cat-Pxyl-tagO, tagO::erm |
| strain (B. subtilis) | bAB327 | This work | ftsZ::mNeonGreen-15aa-ftsZ, amyE::Phyperspank-minCD, ycgO::Pxyl-tagO, tagO::erm |
| strain (B. subtilis) | bAB388 | This work | ftsZ::mNeonGreen-15aa-ftsZ, amyE::Physpank-ftsA ycgO::cat-Pxyl-tagO, tagO::erm |
| strain (B. subtilis) | bYS09 | This work | mreB::mreB-40aa-mNeonGreen |
| strain (B. subtilis) | bYS40 | This work | mreB::HaloTag–MreB |
| strain (B. subtilis) | bYS201 | This work | HaloTag-Pbp2A::cat |
| strain (B. subtilis) | bAB198 | This work | tagT::erm-Pxyl-HaloTag-15aa-tagT |
| strain (B. subtilis) | bAB197 | This work | tagV::erm-Pxyl-HaloTag-15aa-tagV |
| strain (B. subtilis) | bAB196 | This work | tagU::erm-Pxyl-HaloTag-15aa-tagU] |
| strain (Escherichia coli) | NO50 | (Ouzounov et al., 2016) 10.1016/j.bpj.2016.07.017 | E. coli - msfGFP-MreB(sw) |
| strain (E. coli) | RM478 | (Morgenstein et al., 2015) 10.1073/pnas.1509610112 | E. coli - ΔrodZ (cam), mreBS14A-msfGFPSW (kan) |
| software, algorithm | uTrack | (Jaqaman et al., 2008) 10.1038/nmeth.1237 | |
| software, algorithm | Trackmate | (Tinevez et al., 2017) 10.1016/j.ymeth.2016.09.016 | |
| software, algorithm | Morphometrics | (Ursell et al., 2017) 10.1186/s12915-017-0348-8 |
Additional files
-
Supplementary file 1
Strains used in this study.
- https://doi.org/10.7554/eLife.32471.043
-
Supplementary file 2
Oligonucleotides used in this study.
- https://doi.org/10.7554/eLife.32471.044
-
Supplementary file 3
Model Parameters.
Related to Figure 4 and Appendix 1.
- https://doi.org/10.7554/eLife.32471.045
-
Transparent reporting form
- https://doi.org/10.7554/eLife.32471.046
Download links
A two-part list of links to download the article, or parts of the article, in various formats.
Downloads (link to download the article as PDF)
Open citations (links to open the citations from this article in various online reference manager services)
Cite this article (links to download the citations from this article in formats compatible with various reference manager tools)
MreB filaments align along greatest principal membrane curvature to orient cell wall synthesis
eLife 7:e32471.
https://doi.org/10.7554/eLife.32471


