Molecular structure of human KATP in complex with ATP and ADP
- Howard Hughes Medical Institute, The Rockefeller University, United States
Figures
Figure 1 with 7 supplements
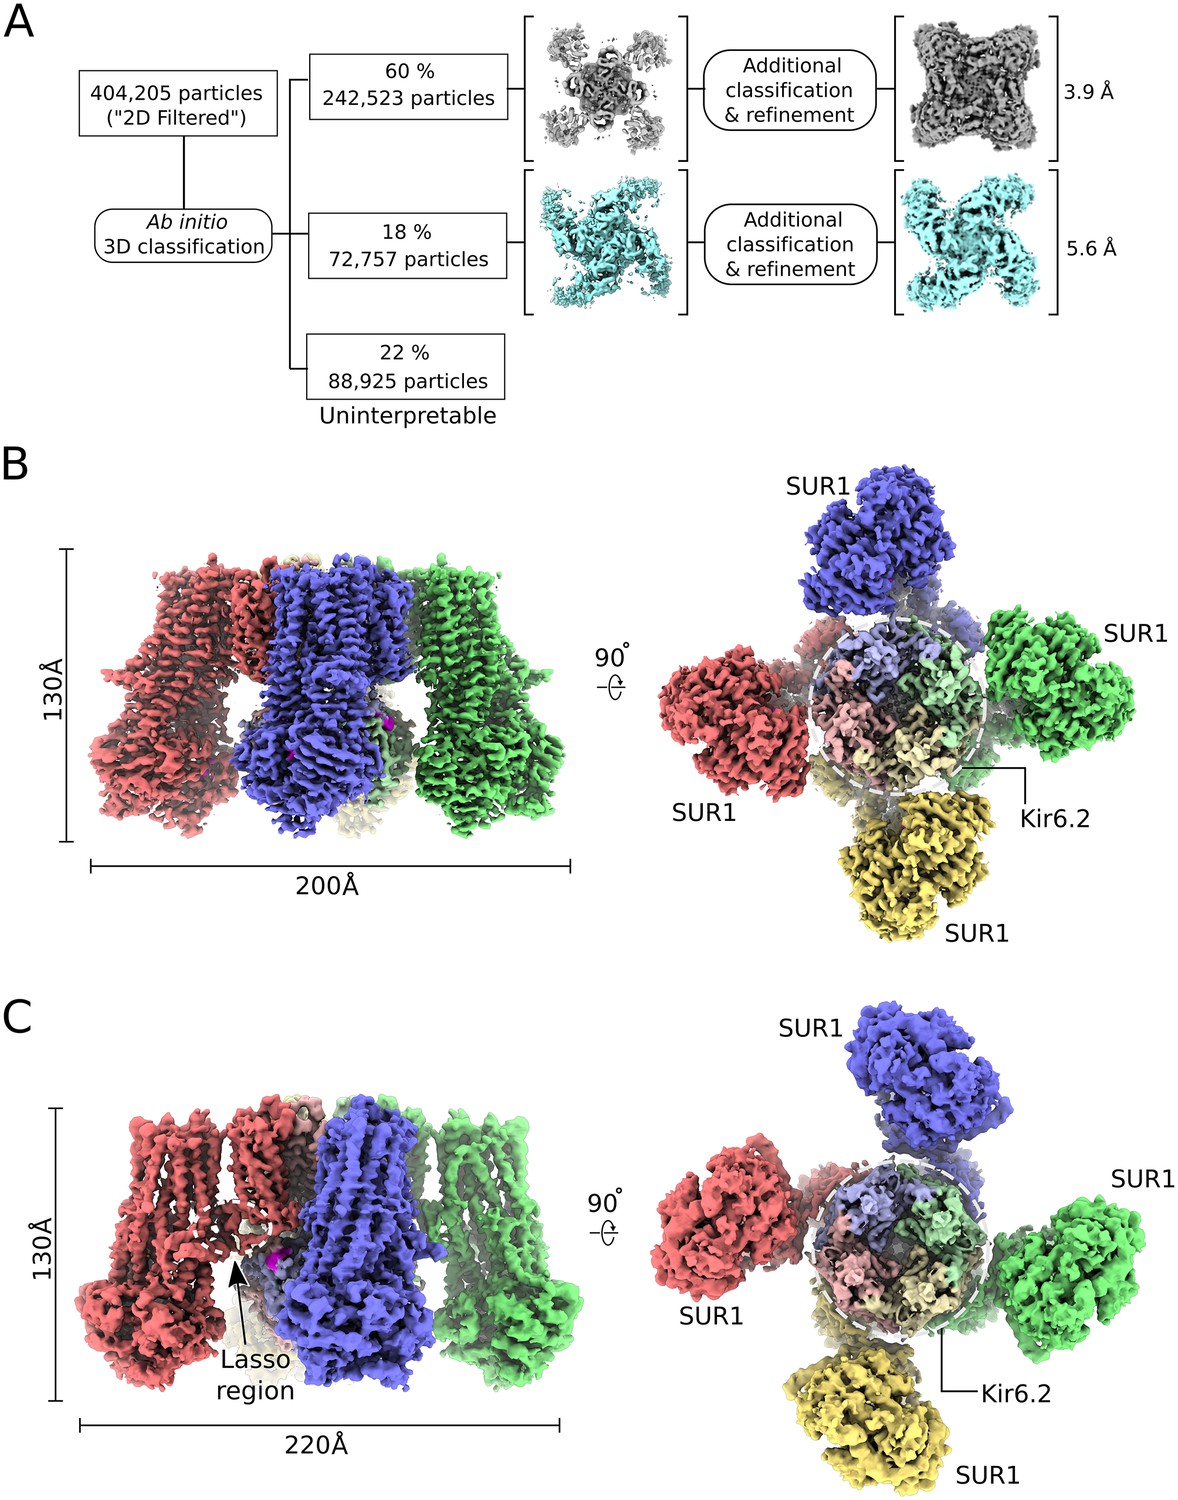
CryoEM reconstruction of the human KATP channel.
(A) Ab-initio 3D classification separates KATPem particles into two distinct structures - the quatrefoil form (grey) and the propeller form (light blue). (B) EM density map of the KATP channel quatrefoil form. Left – Sideview of the EM density map. Right – cytoplasmic view of the EM density map. The CTDs of KIR6.2 are visible in this orientation. SUR1-KIR6.2 fusion protomers are colored red, green, blue or yellow, respectively. The final symmetrized composite map is shown. (C) EM density map of the KATP channel propeller form. See also Figure 1-figure supplements 1 to 7.
Figure 1—figure supplement 1
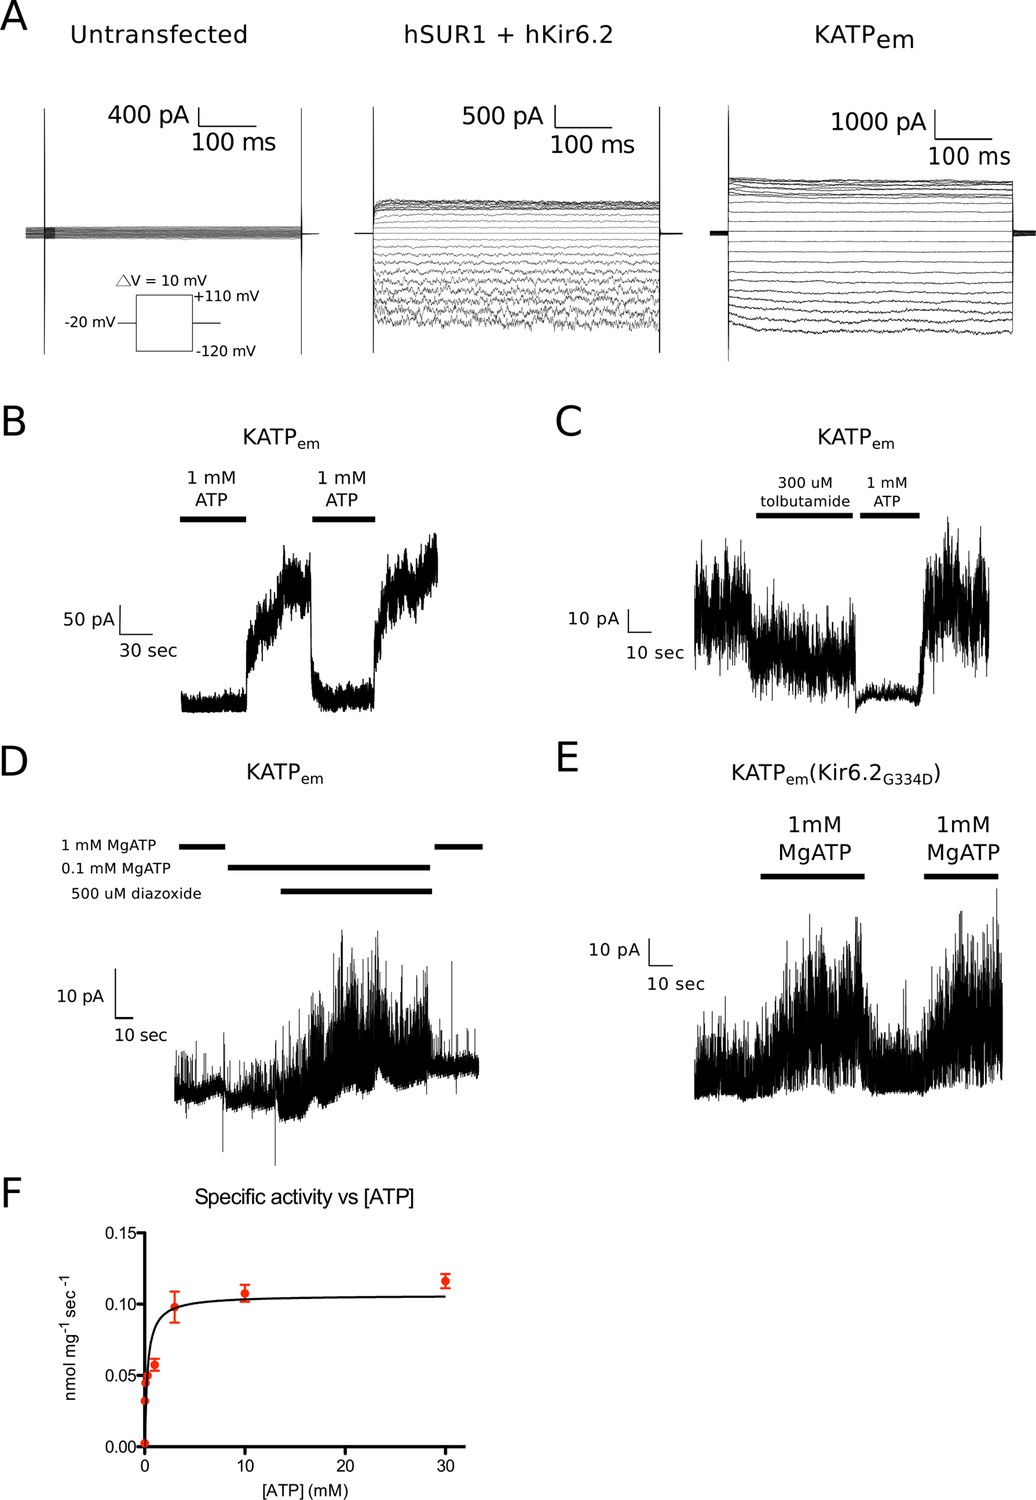
Functional characterization of the human KATP channel.
(A) Whole-cell recordings of human SUR1-KIR6.2 fusion expressed in HEK cells. Voltage families stepping between -120mV and +110mV at 10mv intervals were recorded in whole-cell mode. Cells were kept at a holding potential of -60 mV. Cells were returned to the holding potential of -20 mV for 500 ms in between test pulses before the next voltage step. Left – untransfected control. Middle – co-transfected human SUR1 and human Kir6.2. Right – transfected with the human SUR1-Kir6.2 fusion used for structure determination. (B-E) Inside-out recordings of KATPem expressed in HEK cells. A holding potential of +50 or +80 mV was maintained throughout the recordings. (B) Inside-out patches were excised into solution containing 1 mM ATP. Perfusion with nucleotide-free solution reversibly alleviates ATP inhibition of ion flow through KATP channels. A holding potential of +80 mV was maintained throughout the recording. (C) Inside-out patches were excised into nucleotide-free solution. Exposure to 300 μM tolubutamide partially inhibits KATPem spontaneous opening in a reversible manner. (D) Diazoxide promotes KATPem opening in the presence of an inhibitory concentration of Mg2+-ATP. (E) Membrane patch excised from cells expressing KATPem containing the G334D mutation in the Kir6.2 inhibitory ATP binding site KATPem(Kir6.2G334D). The Kir6.2G334D gain-of-function mutation unmasks the potentiating effect of Mg2+-ATP binding to SUR1 in KATPem (Proks et al., 2010). (F) ATPase activity of KATPem purified in digitonin. By non-linear regression of the Michaelis-Menten equation, the Km for ATP was determined to be 284 ± 75 μM and the maximal ATPase activity was determined to be 6.4 ± 0.3 nmol/mg/min (assuming the monomeric molecular weight of KATPem to be 220 kDa, the specific turnover rate is 1.4 min-1 or ~0.02 sec-1) Measurements were performed in triplicate at 28°C. Error bars represent SD.
Figure 1—figure supplement 2
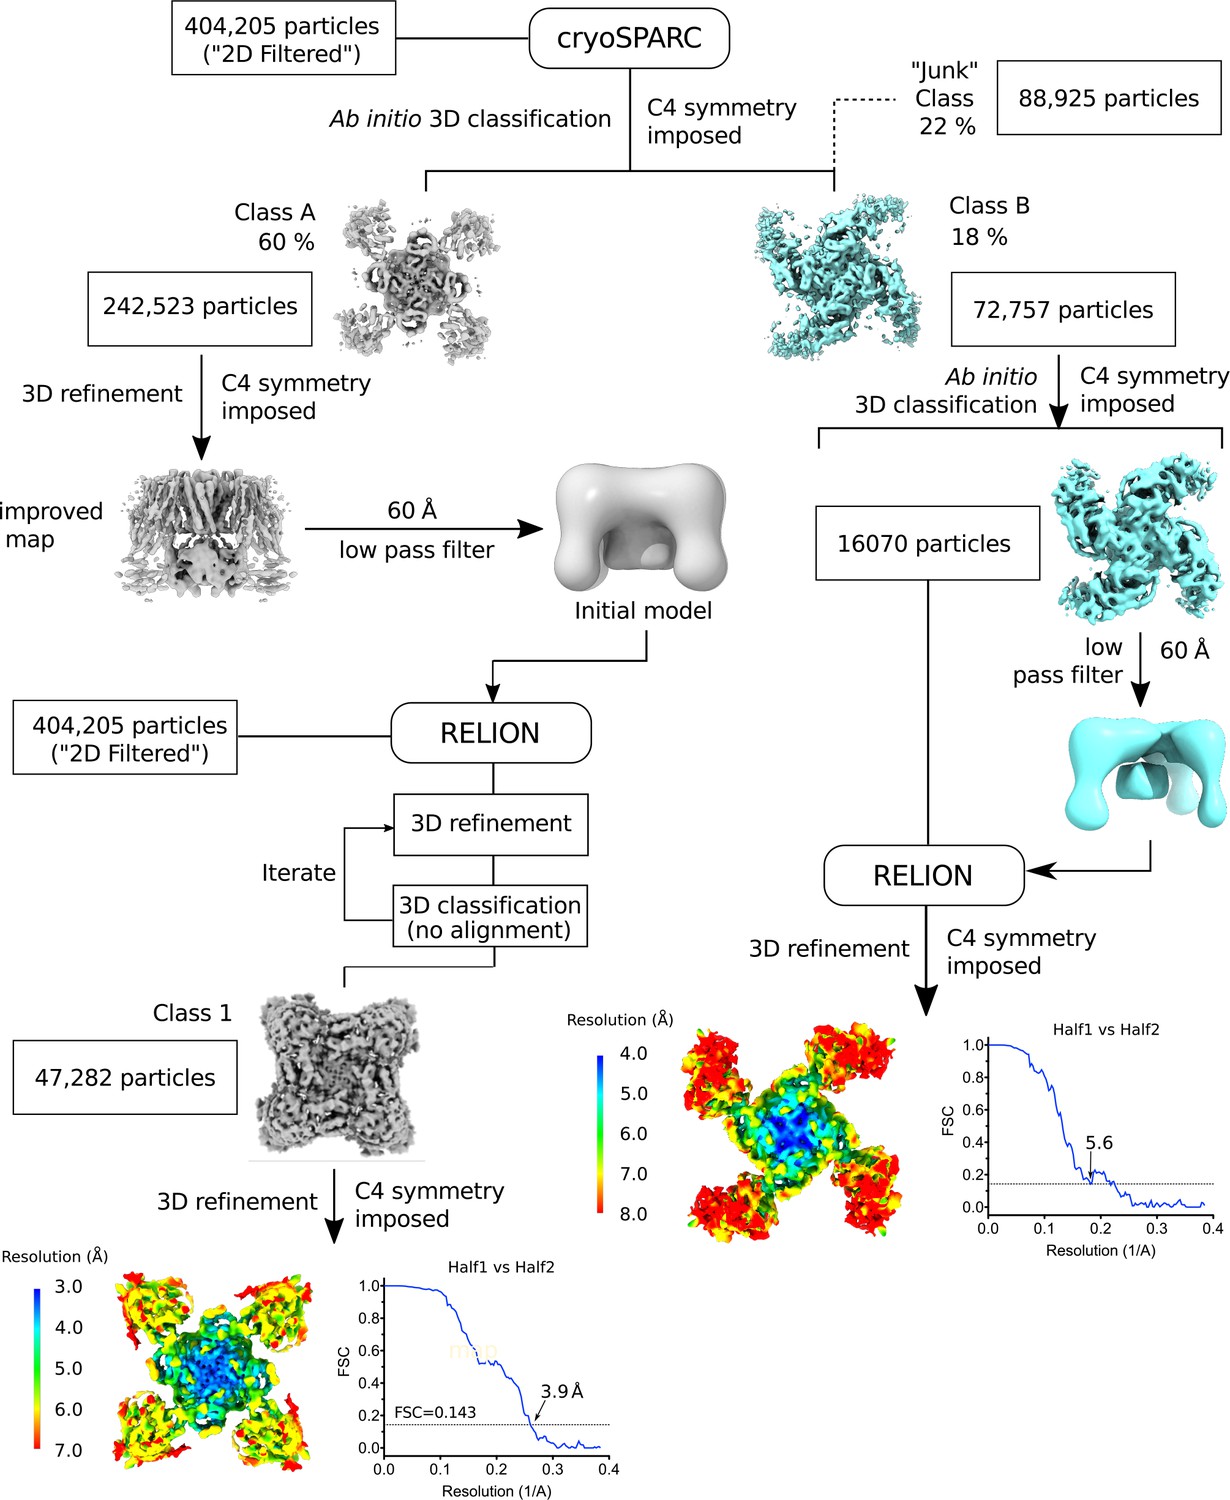
Flow chart of the image processing workflow.
The steps leading up to the determination of the quatrefoil and propeller form structures are shown. Symmetry expansion, focused 3D classification, and refinement (see Materials and methods) are omitted for clarity. Local resolution of the quatrefoil and propeller form maps estimated by Blocres are shown at the end of the data processing steps. Gold-standard FSC curves corresponding to the quatrefoil and propeller form are shown next to the mapped local resolution estimates.
Figure 1—figure supplement 3
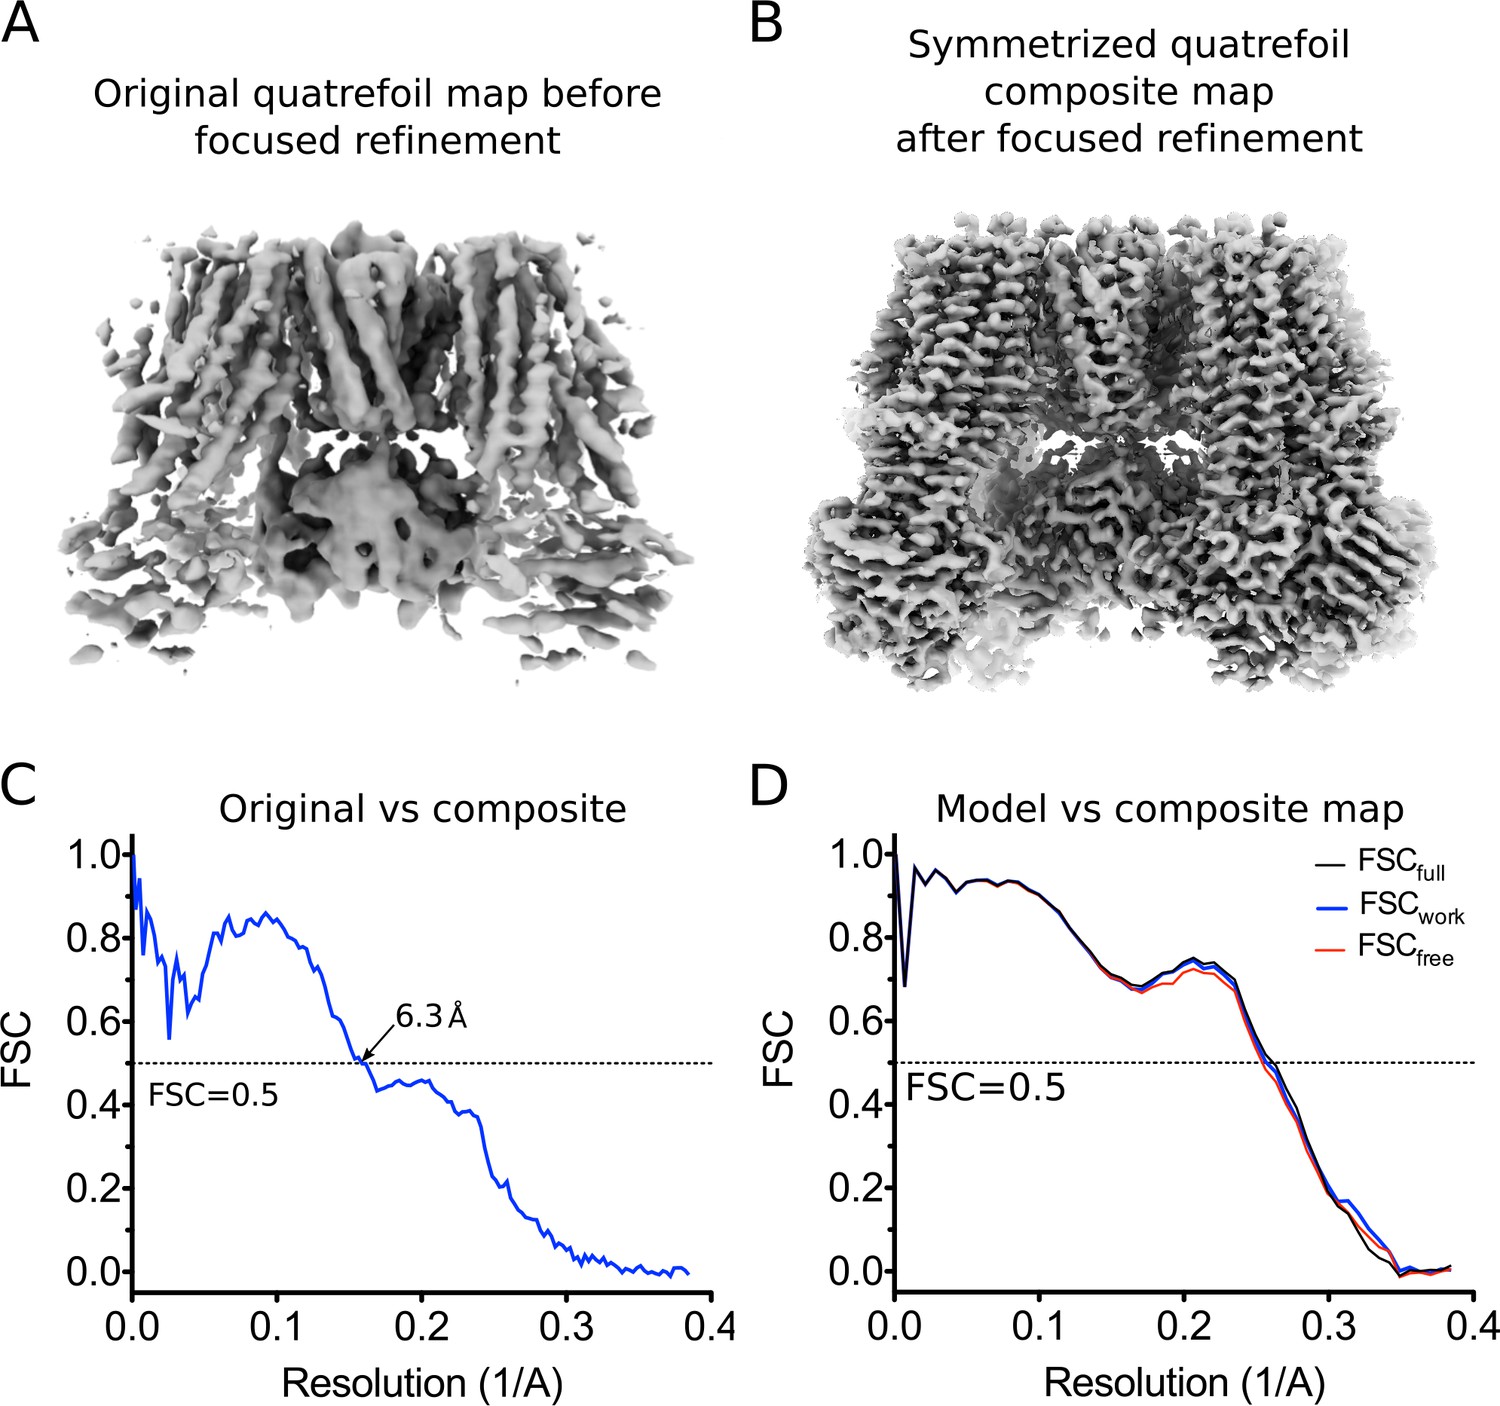
CryoEM reconstruction of the quatrefoil form KATP channel.
(A) The quatrefoil reconstruction before focused classification and refinement. The map shown is low-pass filtered to 3.9 Å without sharpening. (B) The symmetrized quatrefoil form composite map after symmetry expansion, iterative focused 3D classification and refinement. The map shown is low-pass filtered to 3.5 Å and sharpened with a B-factor of −100 Å2. (C) Fourier shell correlation (FSC) curves between the original quatrefoil map before focused refinement and the symmetrized quatrefoil composite map. (D) FSC curves for cross-validation of the quatrefoil form model. The curves show the correlation between a synthetic map calculated from the final model and composite maps of the quatrefoil form reconstruction. Model map vs. Full composite map (FSCfull, black). Model map vs. half composite map used for structure refinement (FSCwork, blue). Model map vs. half composite map excluded from structure refinement (FSCfree, red).
Figure 1—figure supplement 4
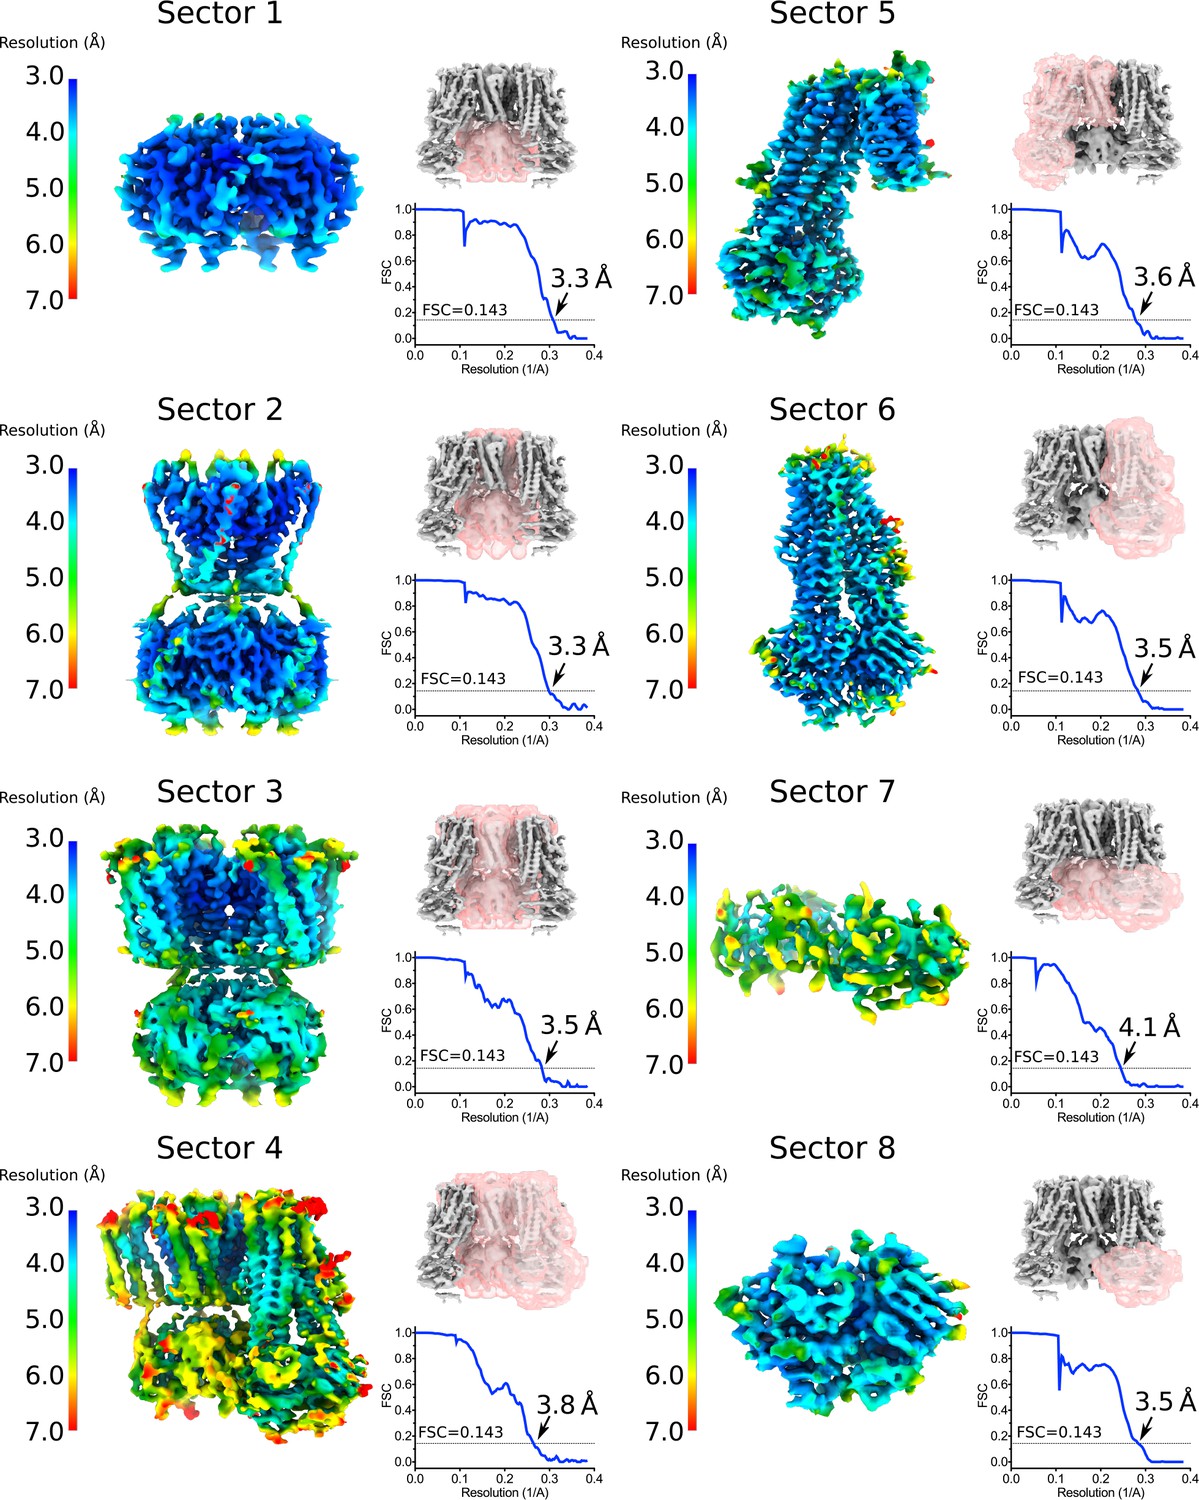
Focus maps of the quatrefoil form KATP channel used for composite map generation.
Local reconstructions using various focus masks corresponding to eight overlapping regions (denoted as Sectors) in the quatrefoil form. The maps are the final focus maps obtained after iterative focused 3D classification and refinement, colored according to local resolution estimates from Blocres. Focus masks for each sector are shown as transparent pink surfaces on the initial quatrefoil reconstruction. Also shown are the gold-standard FSC curves for each local reconstruction. The resolution at FSC = 0.143 is indicated. Sector 1 – Kir6.2 CTD (tetramer). Sector 2 – Kir6.2 channel (tetramer). Sector 3 – Kir6.2 (tetramer) and four TMD0s. Sector 4 - Kir6.2 (tetramer), four TMD0s and one transporter module. Sector 5 – one transporter module and two neighboring TMD0s. Sector 6 – onne transporter module. Sector 7 – CTD (tetramer) and NBD-dimer from one transporter module. Sector 8 – NBD-dimer.
Figure 1—figure supplement 5
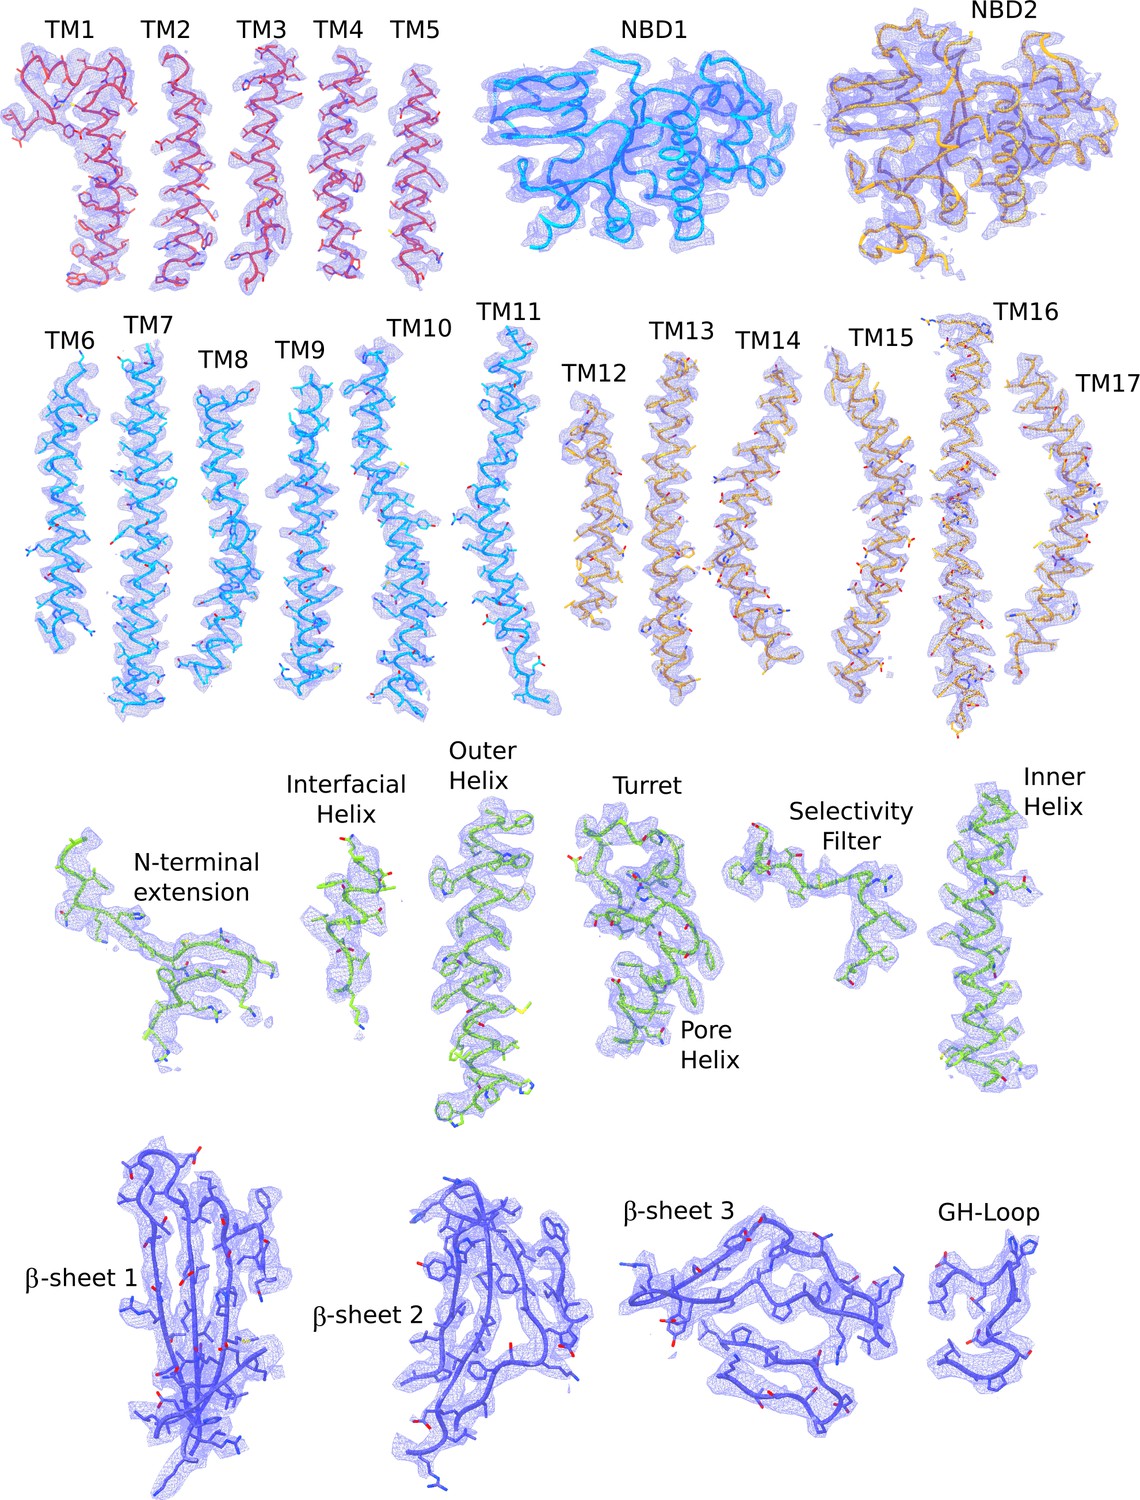
Cryo-EM densities of different regions of the quatrefoil form KATP channel.
The atomic model shown are colored according to the color scheme used in Figure 2b (TMD0 – red; TMD one and NBD1 – light blue; TMD2 and NBD2 – gold; Kir6.2 pore – green; Kir6.2 CTD – dark blue). Note that the segment corresponding to the Lasso extension and Lasso motif was not built because of poor density in that region. In contrast, these regions are ordered and visible in the propeller form.reconstruction. The map segments correspond to the composite map of the quatrefoil form sharpened with a B-factor of −100 Å2.
Figure 1—figure supplement 6
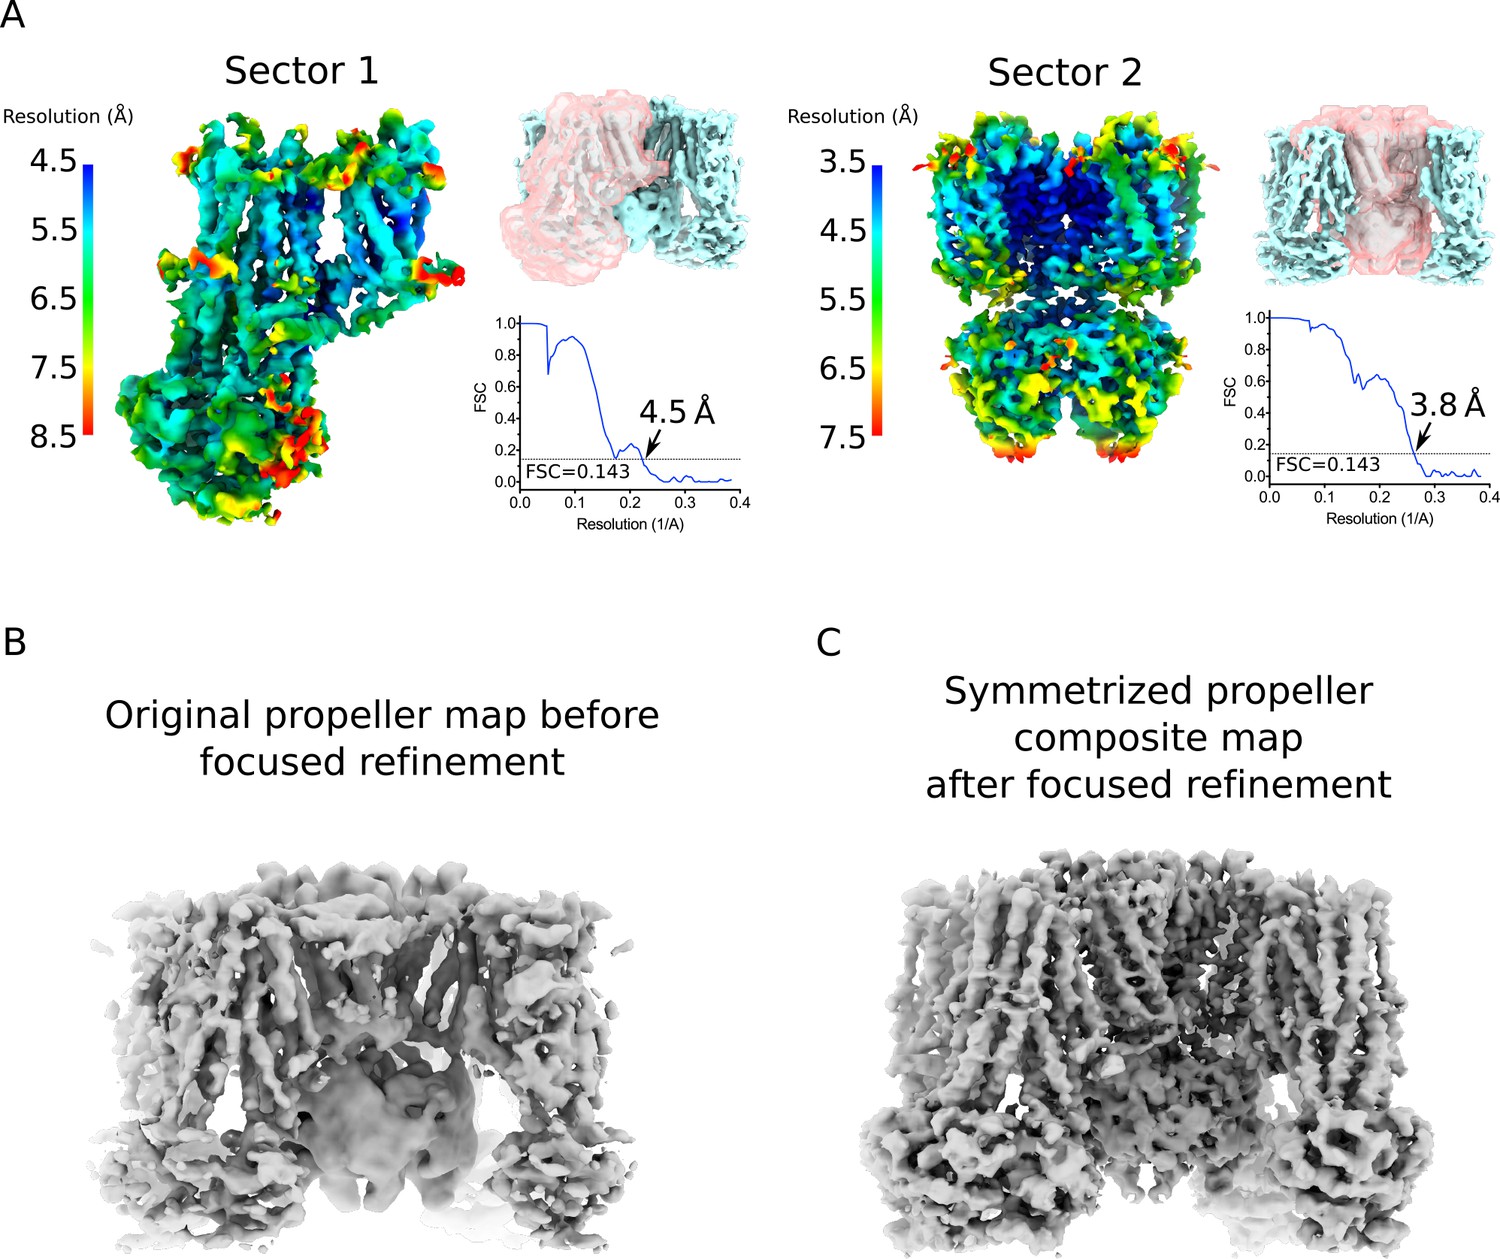
Focus maps of the propeller form KATP channel used for composite map generation and comparison with original map.
(A) Local reconstructions using various focus masks corresponding to two overlapping regions (denoted as Sectors) in the propeller form. The maps are the final focus maps obtained after iterative focused 3D classification and refinement, colored according to local resolution estimates from Blocres. Focus masks for each sector are shown as transparent pink surfaces on the initial quatrefoil reconstruction. Also shown are the gold-standard FSC curves for each local reconstruction. The resolution at FSC = 0.143 is indicated. Sector 1 – one SUR1 subunit. Sector 2 – Kir6.2 (tetramer) and four TMD0s. (B) The propeller form reconstruction before focused classification and refinement. The map shown is low-pass filtered to 5.6 Å without sharpening. (C) The symmetrized propeller form composite map after symmetry expansion, iterative focused 3D classification and refinement. The map shown is low-pass filtered to 4.0 Å and sharpened with a B-factor of −50 Å2.
Figure 1—figure supplement 7
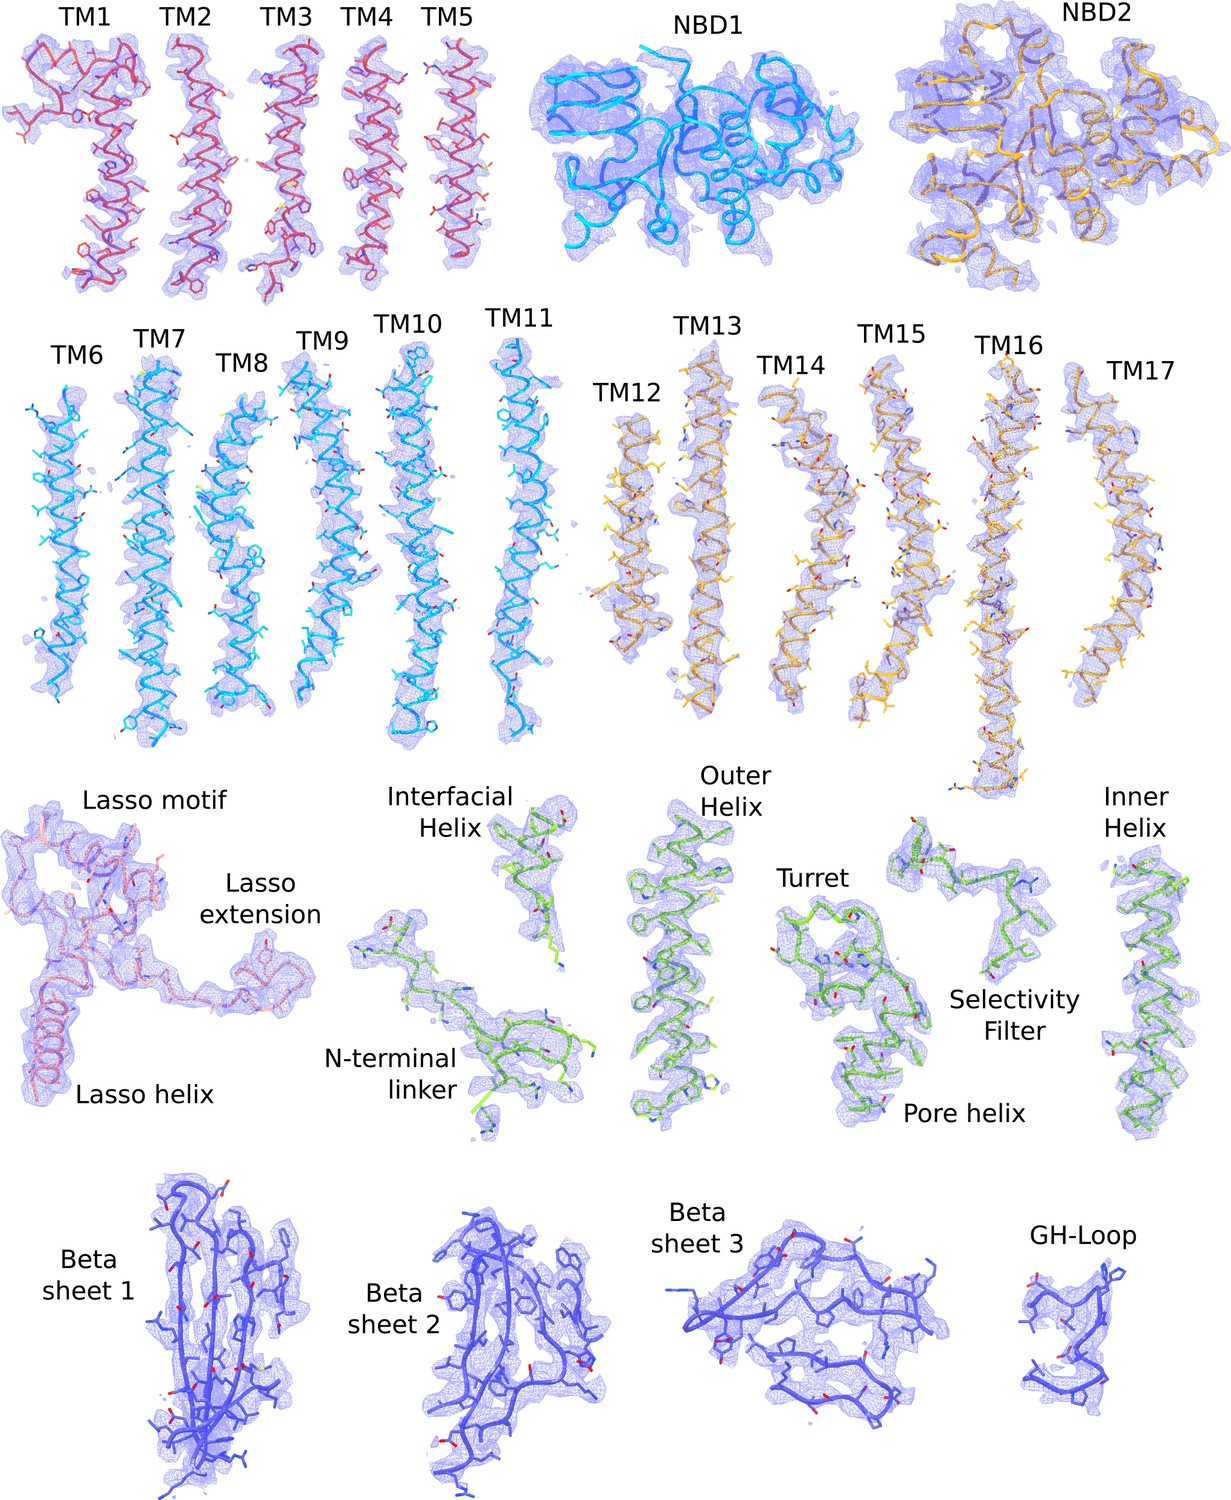
Cryo-EM densities of different regions of the propeller form KATP channel.
The atomic model shown are colored according to the color scheme used in Figure 2b (TMD0 – red; TMD one and NBD1 – light blue; TMD2 and NBD2 – gold; Kir6.2 pore – green; Kir6.2 CTD – dark blue). The L0-loop (Lasso helix, Lasso extension and Lasso motif) are visible in the propeller form. Map segments correspond to the composite map of the propeller form sharpened with a B-factor of −50 Å2.
Figure 2 with 1 supplement
Architecture of the KATP channel.
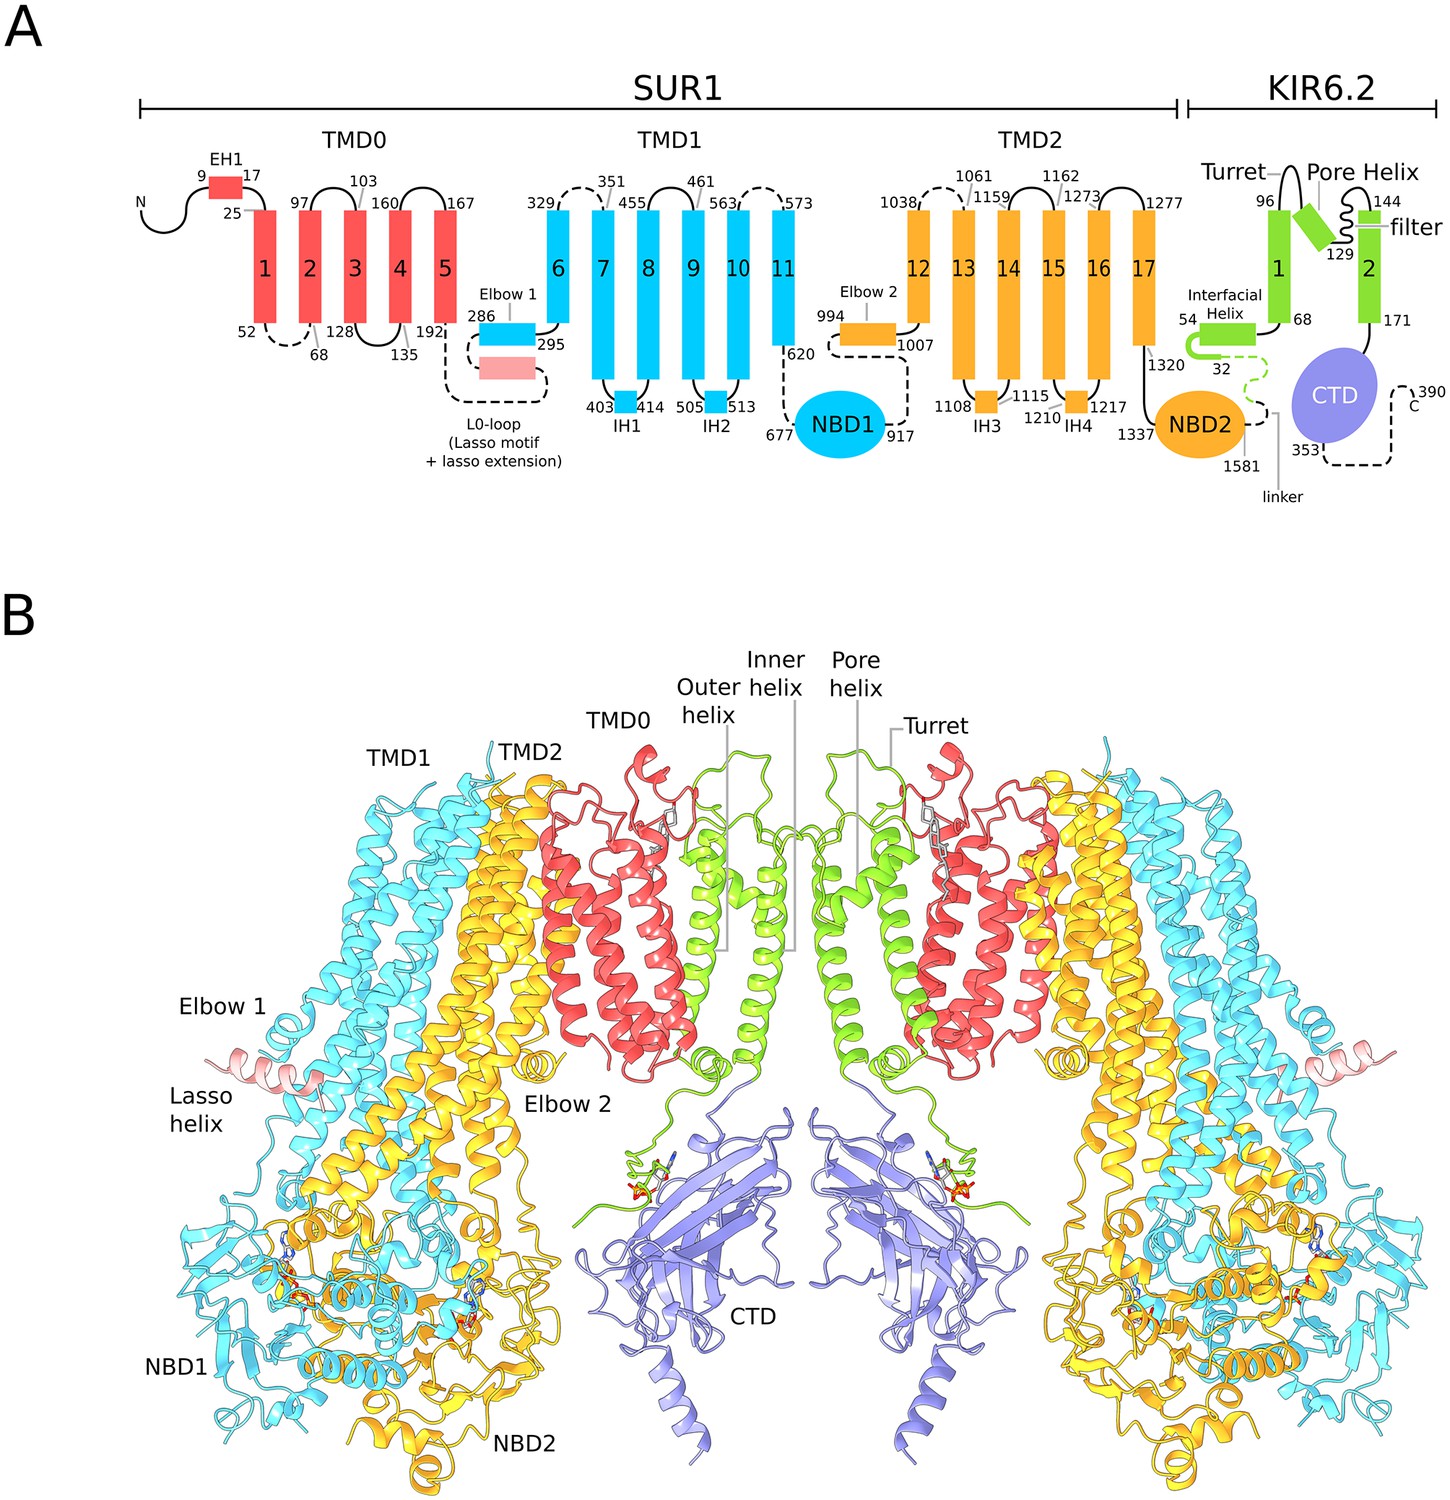
(A) Domain architecture of the SUR1-KIR6.2 fusion construct with a flexible six-amino acid linker joining the C-terminal end of SUR1 to the KIR6.2 N-terminus. The numbering scheme conforms to the native human SUR1 and human KIR6.2 sequences. Dashed lines denote regions where clear density was not observed in the quatrefoil form reconstruction. The lasso motif and lasso extension is visible in the propeller form but not the quatrefoil. (B) Ribbons representation of two SUR1-KIR6.2 fusion protomers in the quatrefoil form.
Figure 2—figure supplement 1
Comparison of quatrefoil and propeller forms.
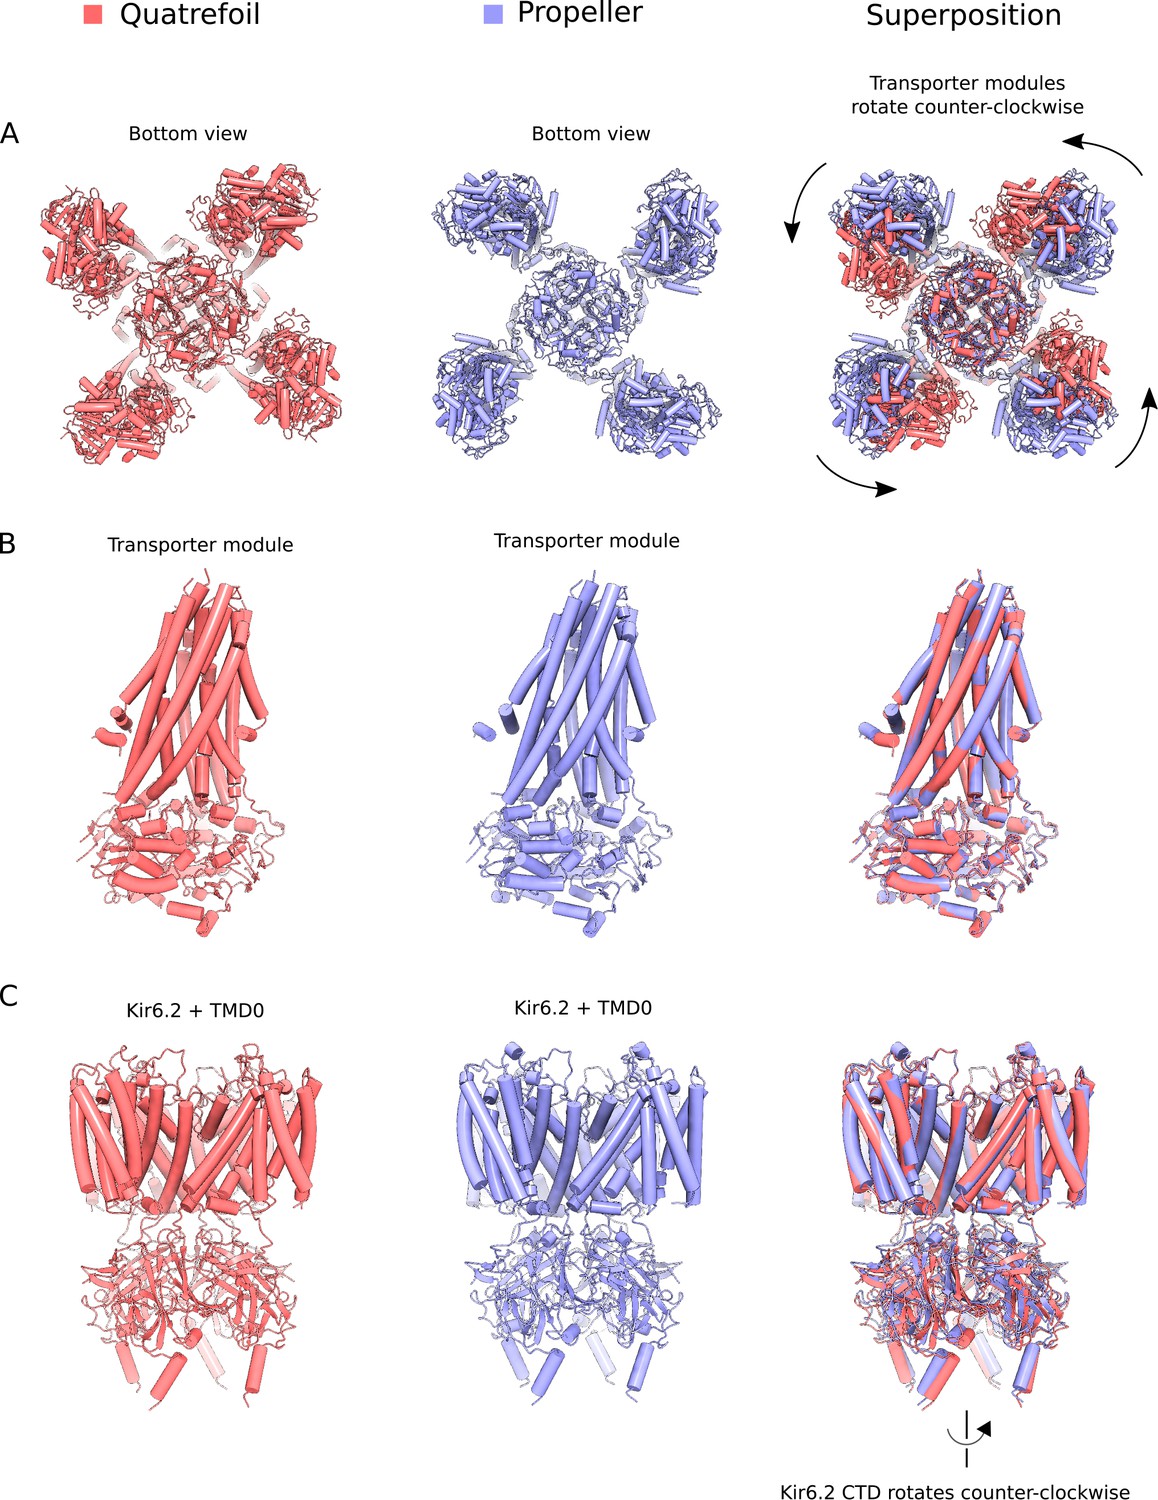
The Mg2+-ATP and Mg2+-ADP bound quatrefoil (red) and propeller (blue) forms of KATP are compared. (A) Superposition of the quatrefoil and propeller forms of the entire KATP channel complex. The two structures were aligned using the selectivity filter of the Kir6.2 pore and are shown when viewed from the bottom. Rotation of the transporter module around the TMD0 domain converts the propeller form into the quatrefoil form. (B) Superposition of the SUR1 transporter modules in the quatrefoil and propeller forms. The transporter modules are essentially identical in the two states. (C) Superposition of Kir6.2 and TMD0 domains of the quatrefoil and propeller forms. The transmembrane portions of Kir6.2 and TMD0 are very similar in the two states. In the quatrefoil form, the CTD of Kir6.2 is rotated by ~10° counter-clockwise in relative to the propeller form when viewed from the extracellular side.
Figure 3 with 2 supplements
Structure of human SUR1 in complex with Mg2+-ATP and Mg2+-ADP.
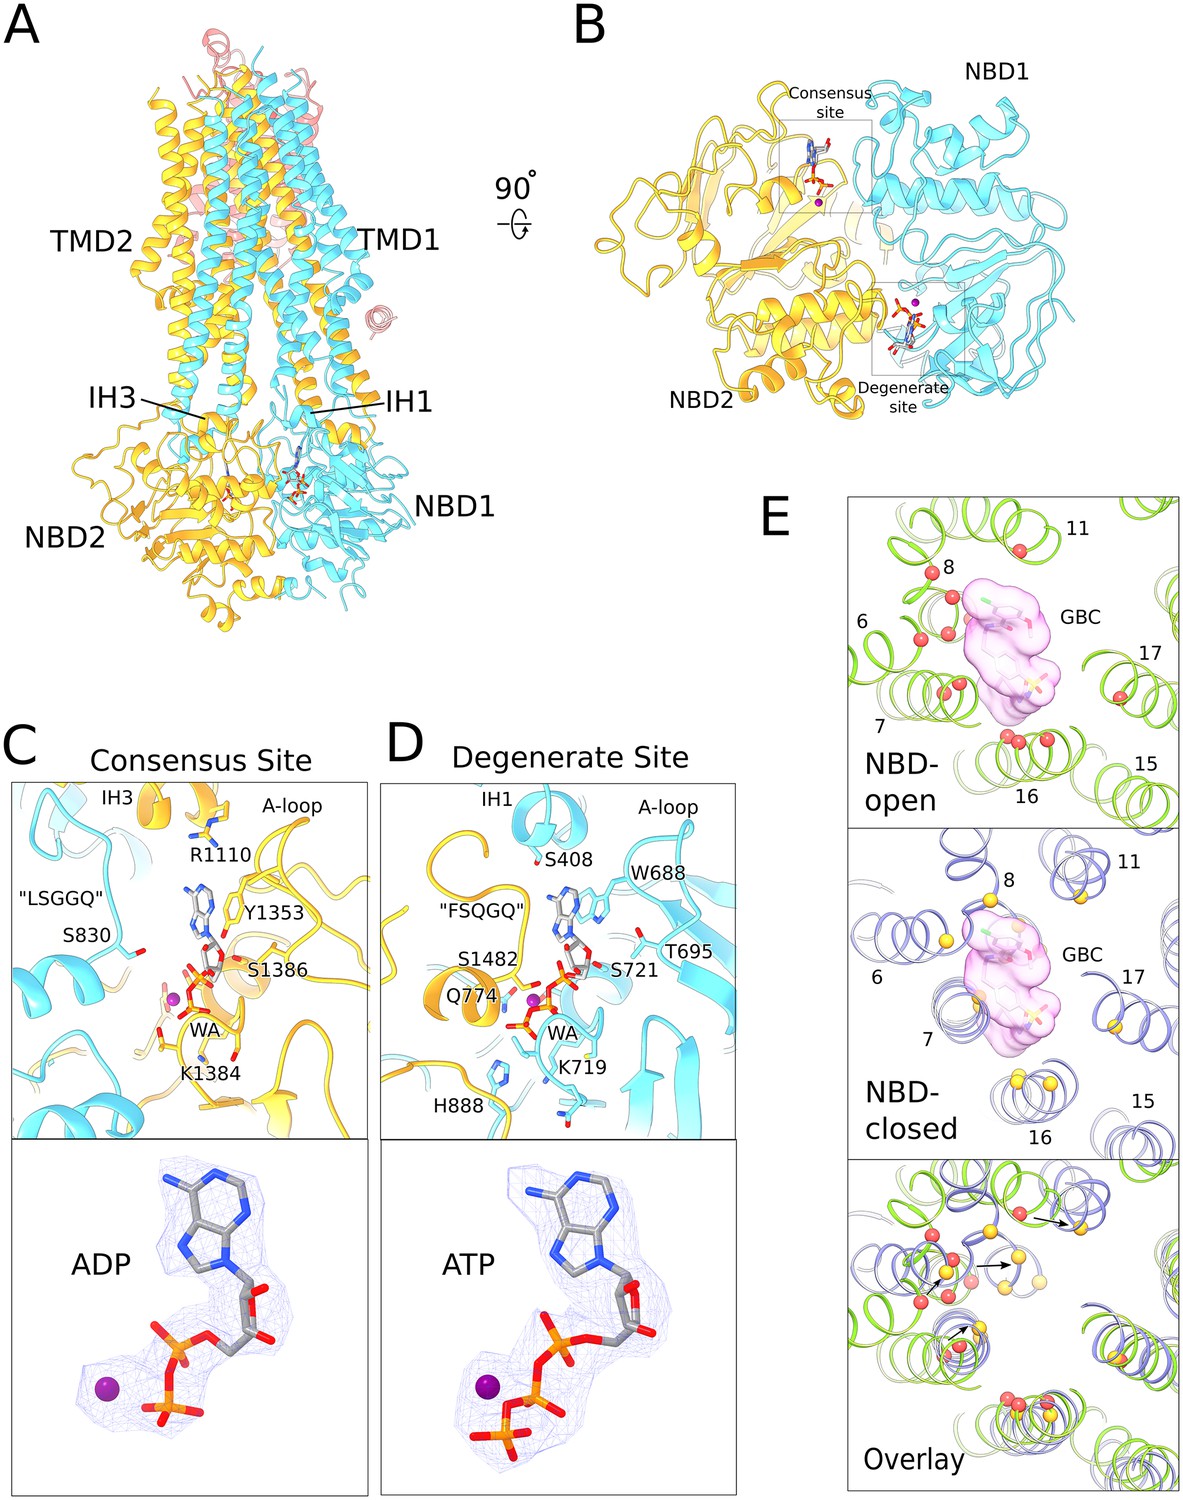
(A) Ribbons representation of the SUR1 subunit. Color scheme: TMD0, pink; TMD1-NBD1, blue; TMD2-NBD2, yellow. Mg2+-ADP and Mg2+-ATP are shown in stick model. (B) The NBD dimer viewed from the membrane. Mg2+-ADP and Mg2+-ATP bind to the consensus and degenerate ATPase sites, respectively, to generate an asymmetric NBD dimer. (C) Close-up view of the SUR1 consensus ATPase site. Top - Residues in contact with Mg2+-ADP are shown. The signature ‘LSGGQ’ motif in NBD1 is disengaged from the bound nucleotide, resulting in a relatively ‘open’ consensus ATPase site. Bottom - shows EM density corresponding to Mg2+-ADP as a blue mesh. (D). Close-up view of the SUR1 degenerate ATPase site. Top - Residues in contact with Mg2+-ATP are shown. The signature sequence in NBD2 is mutated to ‘FSQGQ’ and makes direct contacts with the bound ATP molecule. This results in a ‘closed’ degenerate ATPase site. Bottom - shows EM density corresponding to Mg2+-ATP as a blue mesh. (E) Structural changes in the glibenclamide (GBC)-binding pocket in the NBD-open and NBD-closed states. Top panel – The GBC-binding pocket mapped to the NBD-open SUR1 structure (PDB: 6BAA). Residues in contact the GBC are indicated by red spheres (Martin et al., 2017b). A surface representation of the modeled GBC molecule is shown (pink). Middle panel – GBC binding residues (yellow spheres) mapped onto the NBD-closed SUR1 in the quatrefoil form. GBC is shown to indicate potential steric clashes between the inhibitor and the transporter. Bottom panel – Superposition of the NBD-open and NBD-closed states of SUR1 showing the displacement of GBC-binding residues upon nucleotide binding. The superposition shown was obtained by alignment of the half-transporter from the NBD-closed and NBD-open SUR1 comprised of: TM9,10,12–14,17 and NBD2. Unless stated otherwise, the quatrefoil form is displayed in all panels.
Figure 3—figure supplement 1
Comparison of ATP and ADP densities.
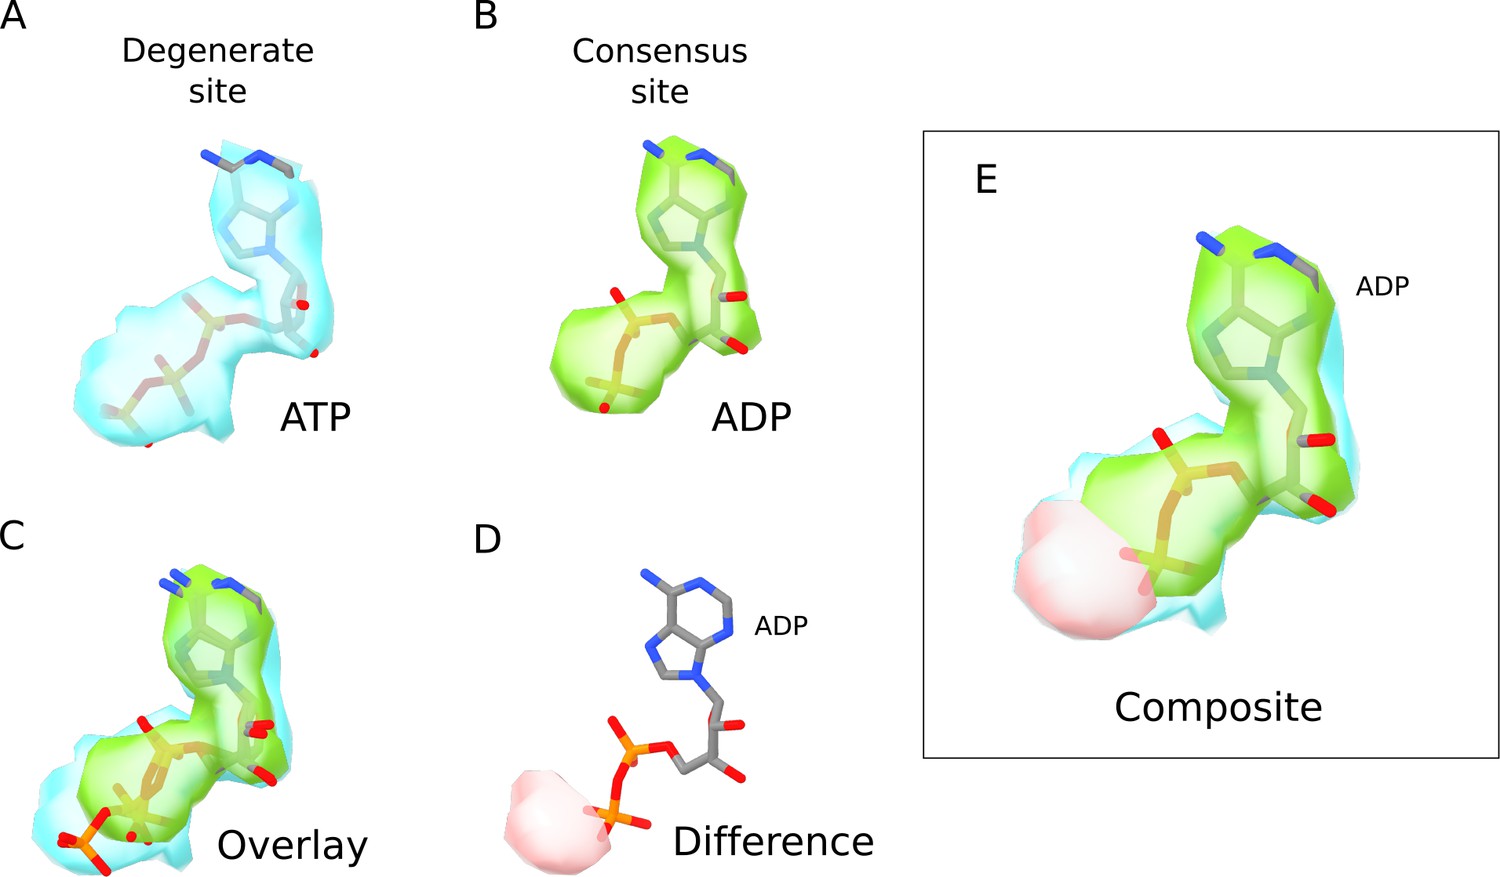
(A) Nucleotide density (blue) in the degenerate site of SUR1 in the quatrefoil form. The ATP model is shown in ball-and-stick representation. (B) Nucleotide density (green) in the consensus site of SUR1 in the quatrefoil form. The ADP model is shown in ball-and-stick representation. (C) Direct comparison of the nucleotide densities shown in A and B. The densities are aligned by superposition of the EM map segments corresponding to NBD1 and NBD2. Only the nucleotide densities in the ATPase active site are shown. The ATP model in the degenerate site is shown in ball-and-stick representation. (D) Difference density of nucleotide EM-densities in the degenerate and consensus site. After alignment, the ADP density is subtracted from the ATP density to obtain the difference density shown (pink) that corresponds to the γ-phosphate position in the ATP density. ADP is shown for comparison. (E) A composite image where the EM densities for ATP and ADP as well as the difference density shown in D are overlayed. ADP is included for comparison. It is apparent that the density corresponding to the γ-phosphate of ATP is absent in the consensus site nucleotide density.
Figure 3—figure supplement 2
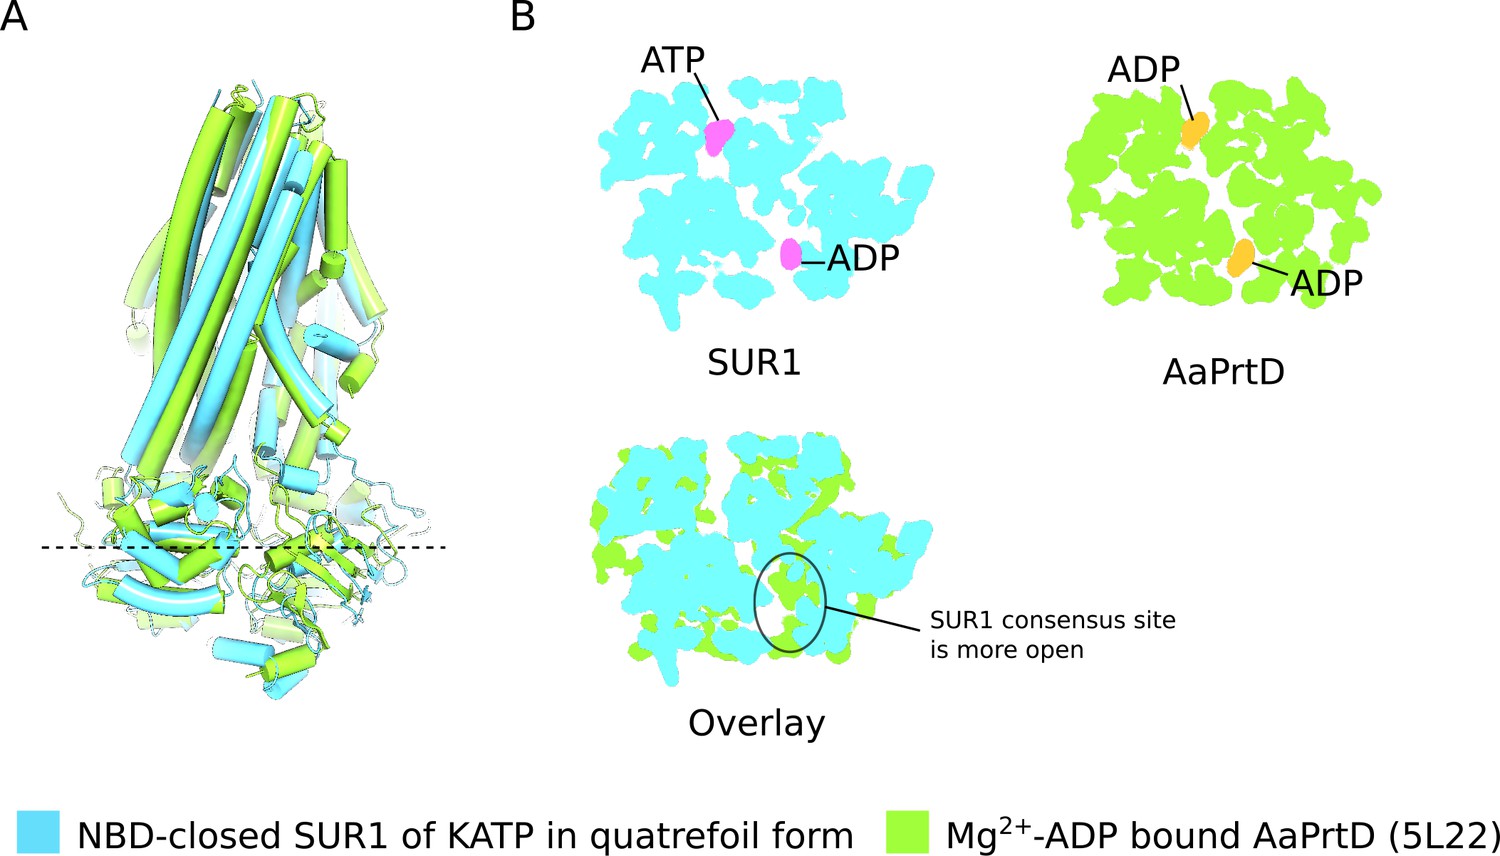
Comparison of NBD-closed SUR1 and ADP bound AaPrtD.
(A) Side-view of the SUR1 transporter module (blue) superimposed on the Mg2+-ADP AaPrtD ABC transporter (PDB ID: 5L22) (green). The overall similarity of the two structures is apparent. (B) Cross-sections of the superimposed space-filling models of SUR1 and AaPrtD shown in C. The location of the cross-section is indicated by the dashed line in C, which spans the ATPase active sites. Inspection of these cross-sections indicate that the while the conformation of the ATPase active sites in SUR1 is assymmetric (the consensus site is slightly more open than the degenerate site), the ADP liganded ATPase active sites in AaPrtD are symmetrically closed.
Figure 4 with 2 supplements
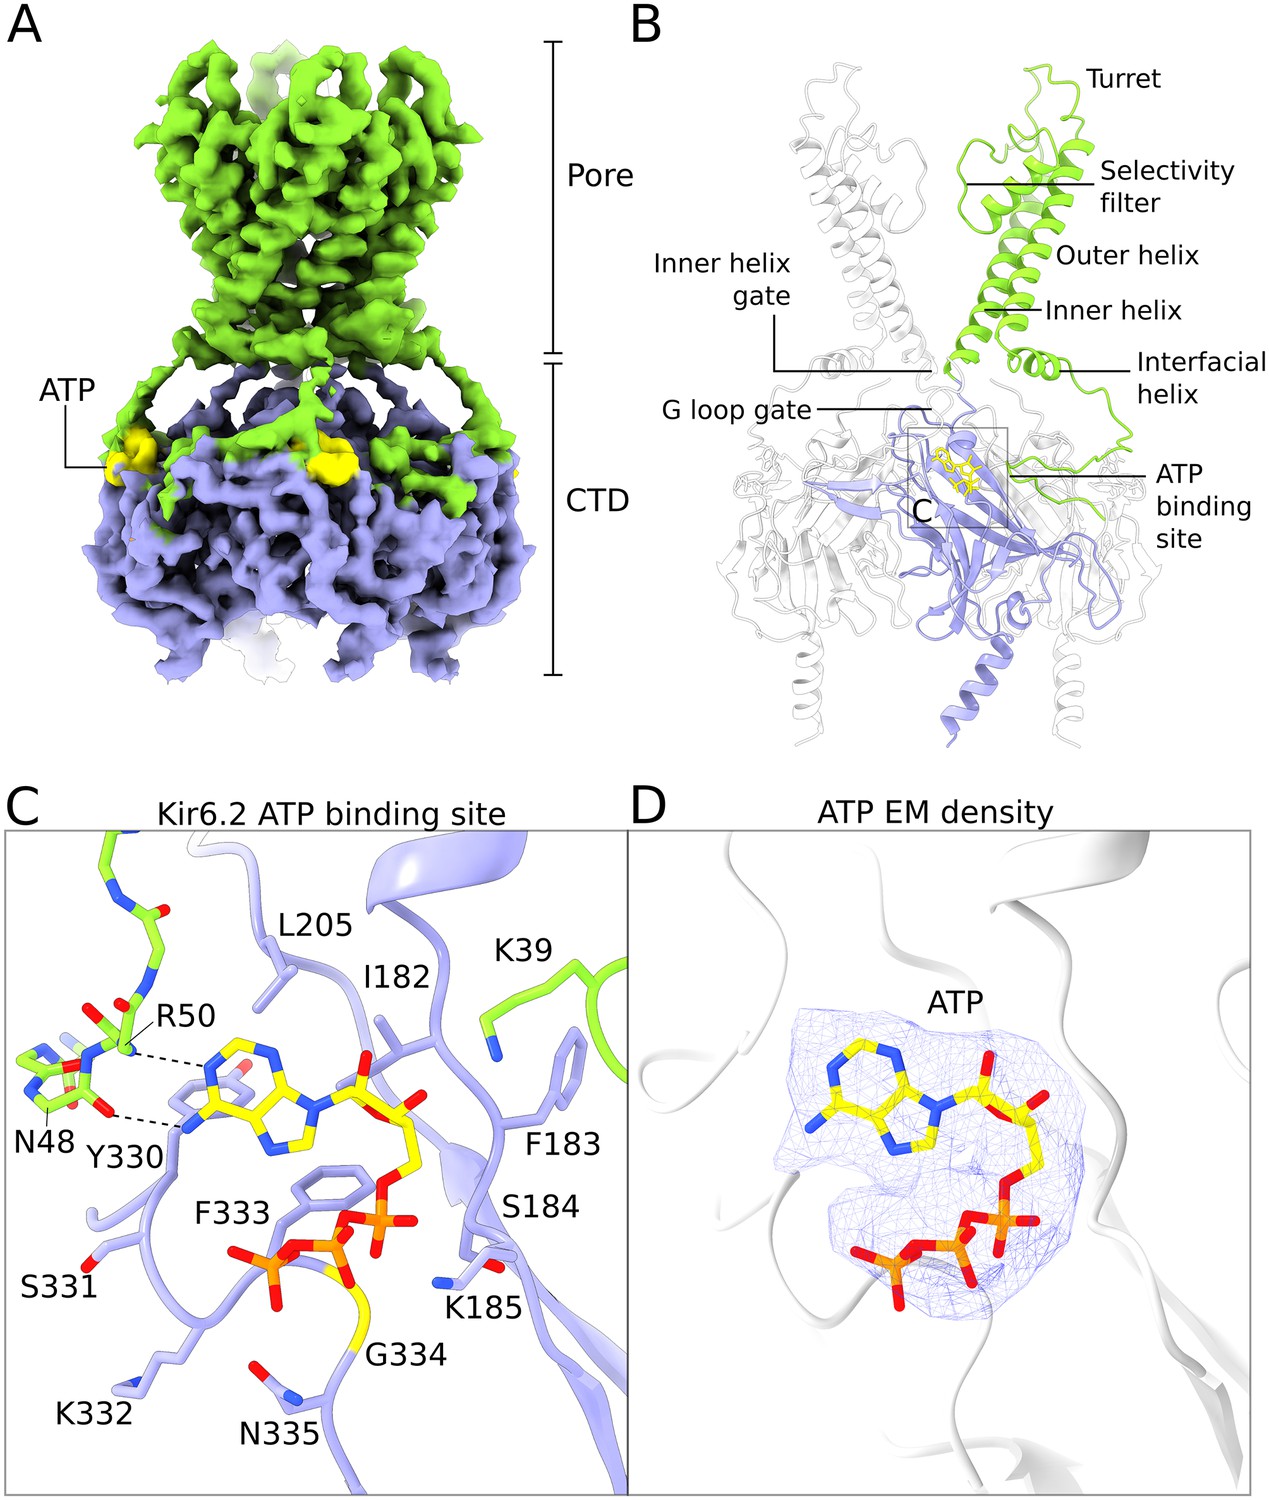
Structure of human Kir6.2 bound to ATP.
(A) EM density of the Kir6.2 tetramer. Sidechain density is clearly observed and β-strands are well resolved. EM densities corresponding to bound ATP molecules are colored yellow. (B) Ribbons representation of the Kir6.2 atomic model. For clarity only two pore domains are shown. The CTD domain in the back is also omitted. One Kir6.2 subunit is colored according to the coloring scheme using in Figure 2A. Important structural elements are indicated. The ATP molecule bound to the colored Kir6.2 subunit is shown as a yellow ball-and-stick model. (C) Close-up view of the Kir6.2 ATP binding site. Residues in contact with the bound ATP molecule are shown. The N-terminal extension of the interfacial helix from a neighboring Kir6.2 subunit contacts the purine base of ATP via mainchain interactions and is shown in ball-and-stick representation. Hydrogen-bonding interactions between mainchain atoms in the Kir6.2 N-terminus and the adenine base are shown as dashed lines. ATP is shown as a ball-and-stick model, with carbon atoms colored yellow. (D) EM density corresponding to the bound ATP molecule, shown as a blue mesh. ATP is displayed in the same fashion as in (C). The unusual horseshoe-shaped conformation of ATP is evident. The quatrefoil form is displayed in all panels.
Figure 4—figure supplement 1
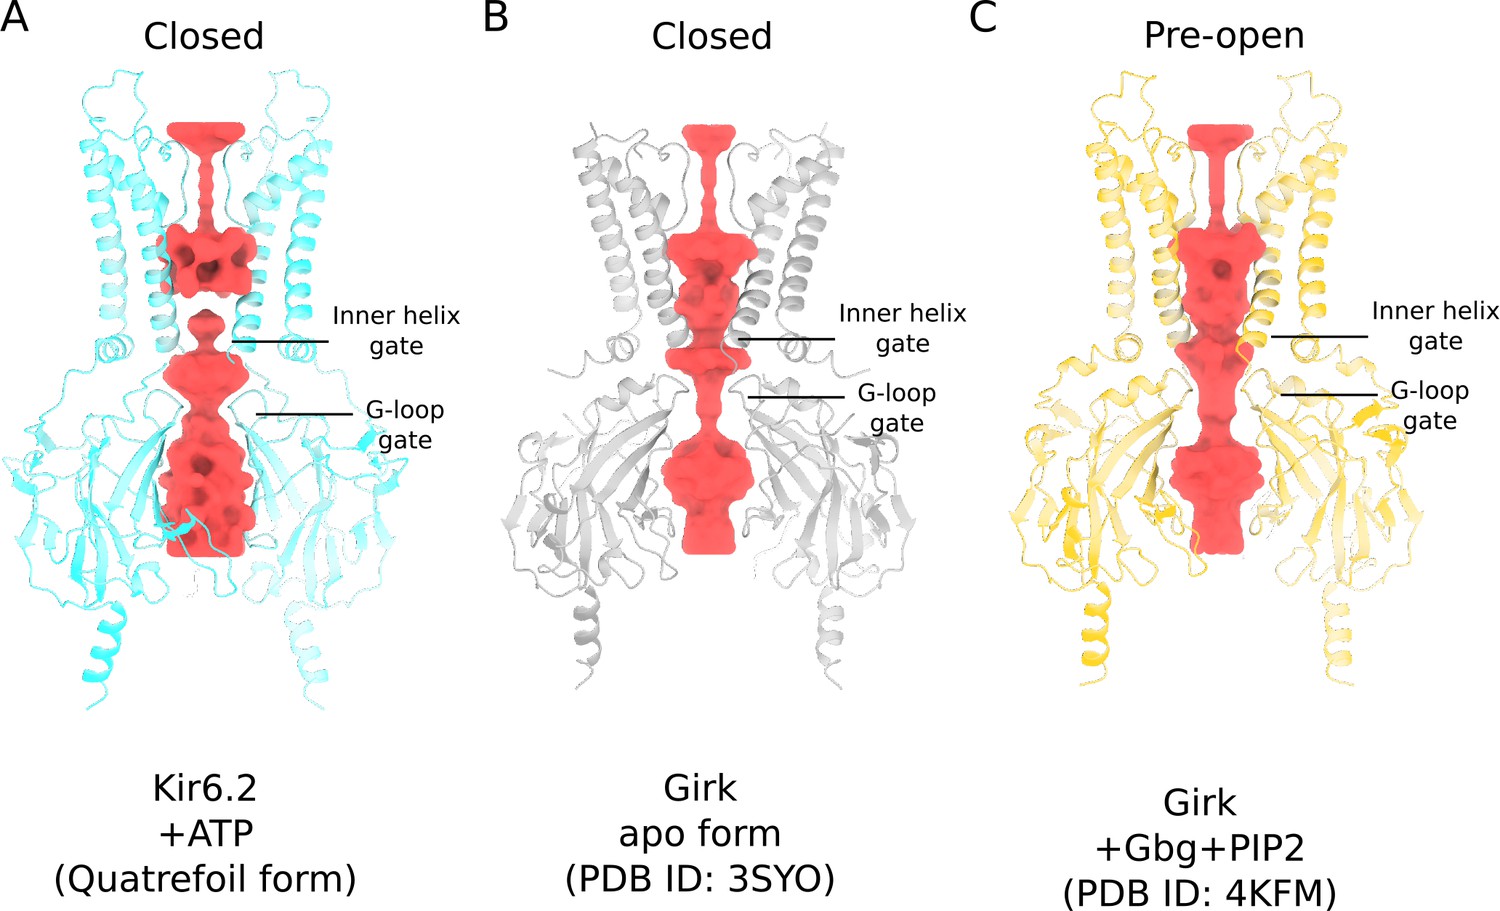
Comparison of Kir6.2 and GIRK ion conduction pathways.
(A) Kir6.2 in the quatrefoil form of KATP (blue). (B) GIRK in the absence of PIP2 (grey). (C) GIRK in the presence of Gβγ and PIP2 (yellow). All protein models are shown in ribbons representation. The ion conduction pathways, visualized using HOLLOW (Ho and Gruswitz, 2008), in all three structures are depicted in surface representation (red).
Figure 4—figure supplement 2
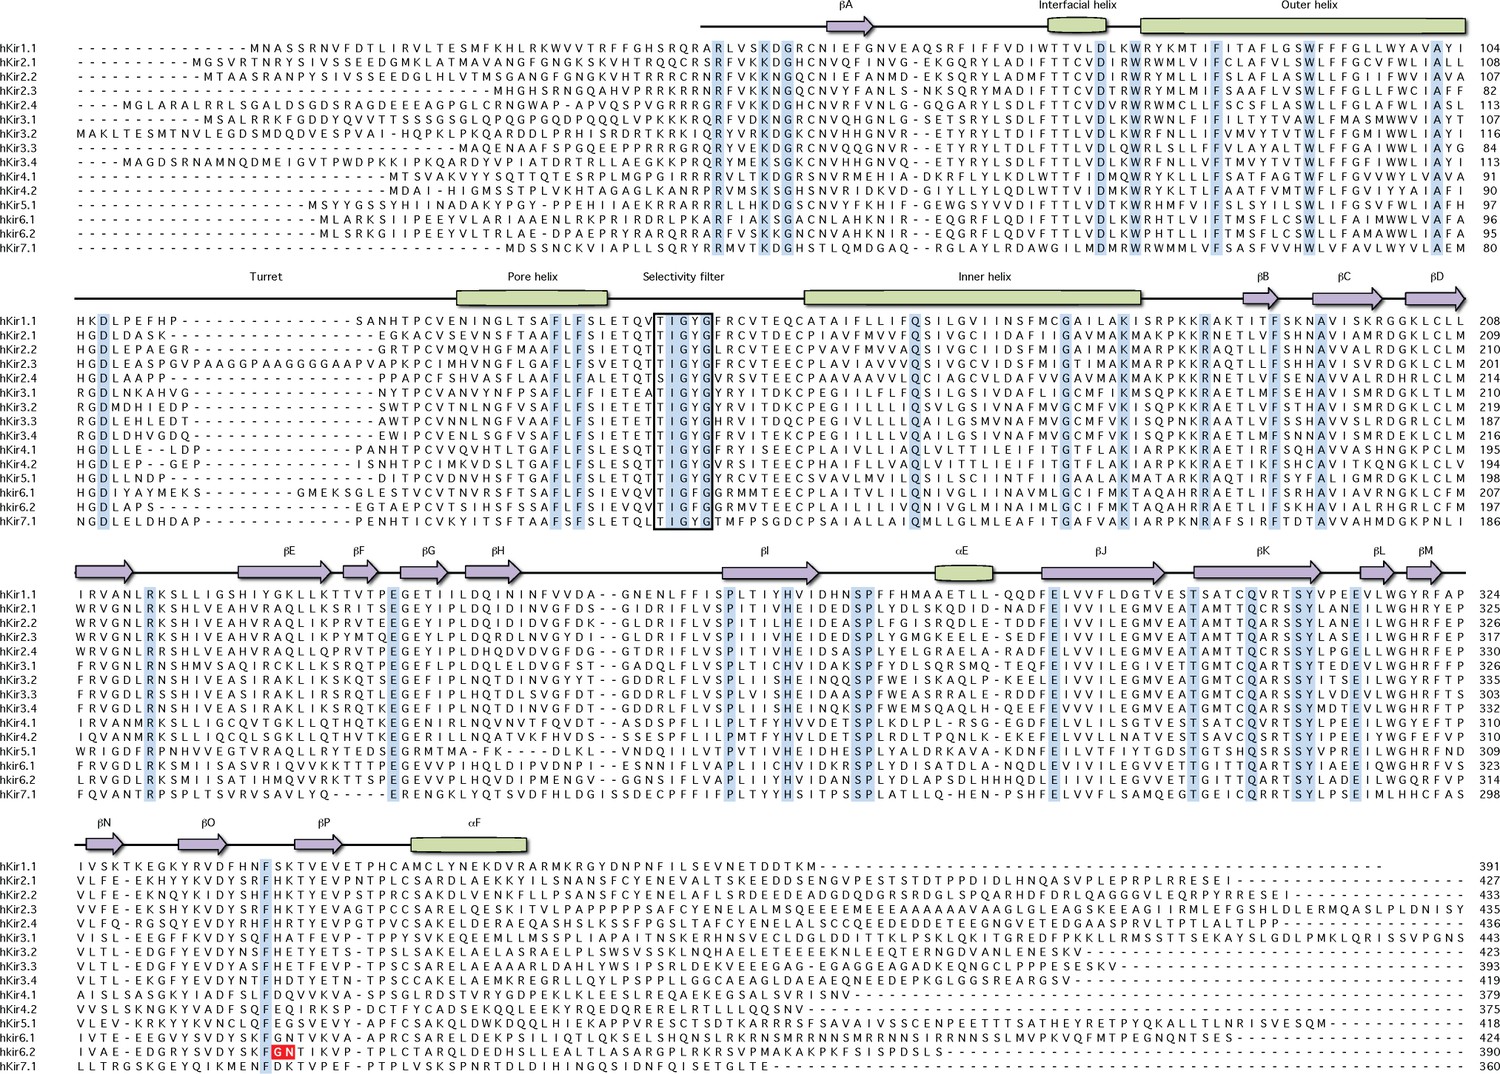
Sequence alignment of KIR channels.
A multiple sequence alignment of all human KIR channels is shown. The alignment is performed using clustalW and adjust manually. Secondary structure elements correspond to Kir6.2 in the quatrefoil form. Arrows denote β-strands; bars denote α-helices. Residues G334 and N335 are highlighted in red.
Figure 5 with 1 supplement
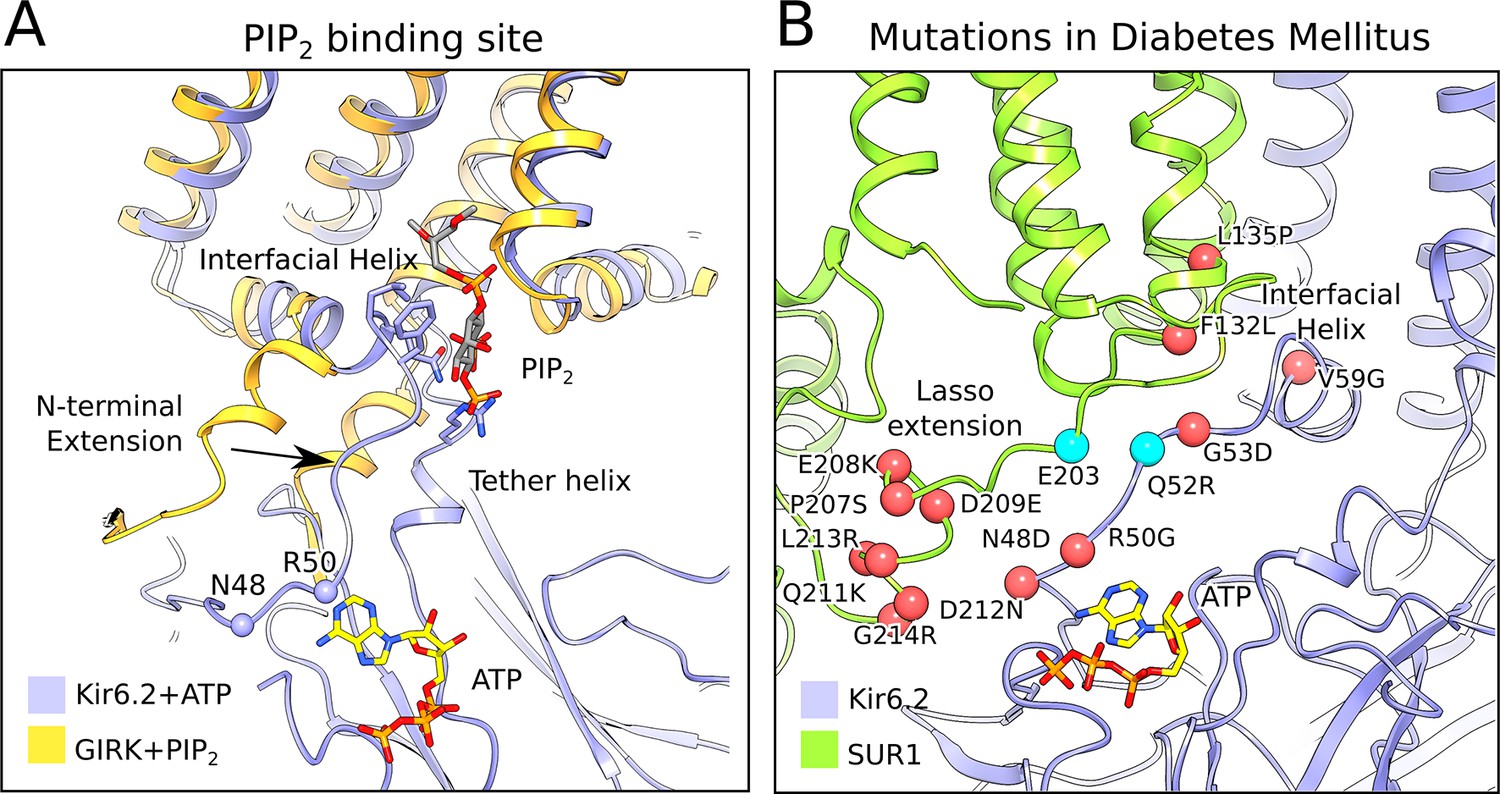
The PIP2-binding site and mutations associated with neonatal diabetes.
(A) Superposition of the ATP-bound Kir6.2 with PIP2-bound GIRK (PDB: 3SYA), showing the linkage between the two ligand binding sites. The arrow indicates the movement of the N-terminal extension from the interfacial helix, as compared to GIRK, that accompanies ATP binding. Structural overlay was obtained by alignment of the selectivity-filter sequences of GIRK and Kir6.2. The quatrefoil form of KATPem is shown. (B) A close-up view of the Lasso extension-Kir6.2 interface. SUR1 and Kir6.2 in the propeller form are shown in ribbons representation and are colored in green and blue, respectively. Mutations associated with diabetes are indicated by red spheres. Cyan spheres indicate the location of residues E203 in SUR1 and Q52 in Kir6.2, which irreversibly inhibits channel opening when cross-linked via a disulphide-bridge (Pratt et al., 2012). The model shown corresponds to the propeller form of KATPem.
Figure 5—figure supplement 1
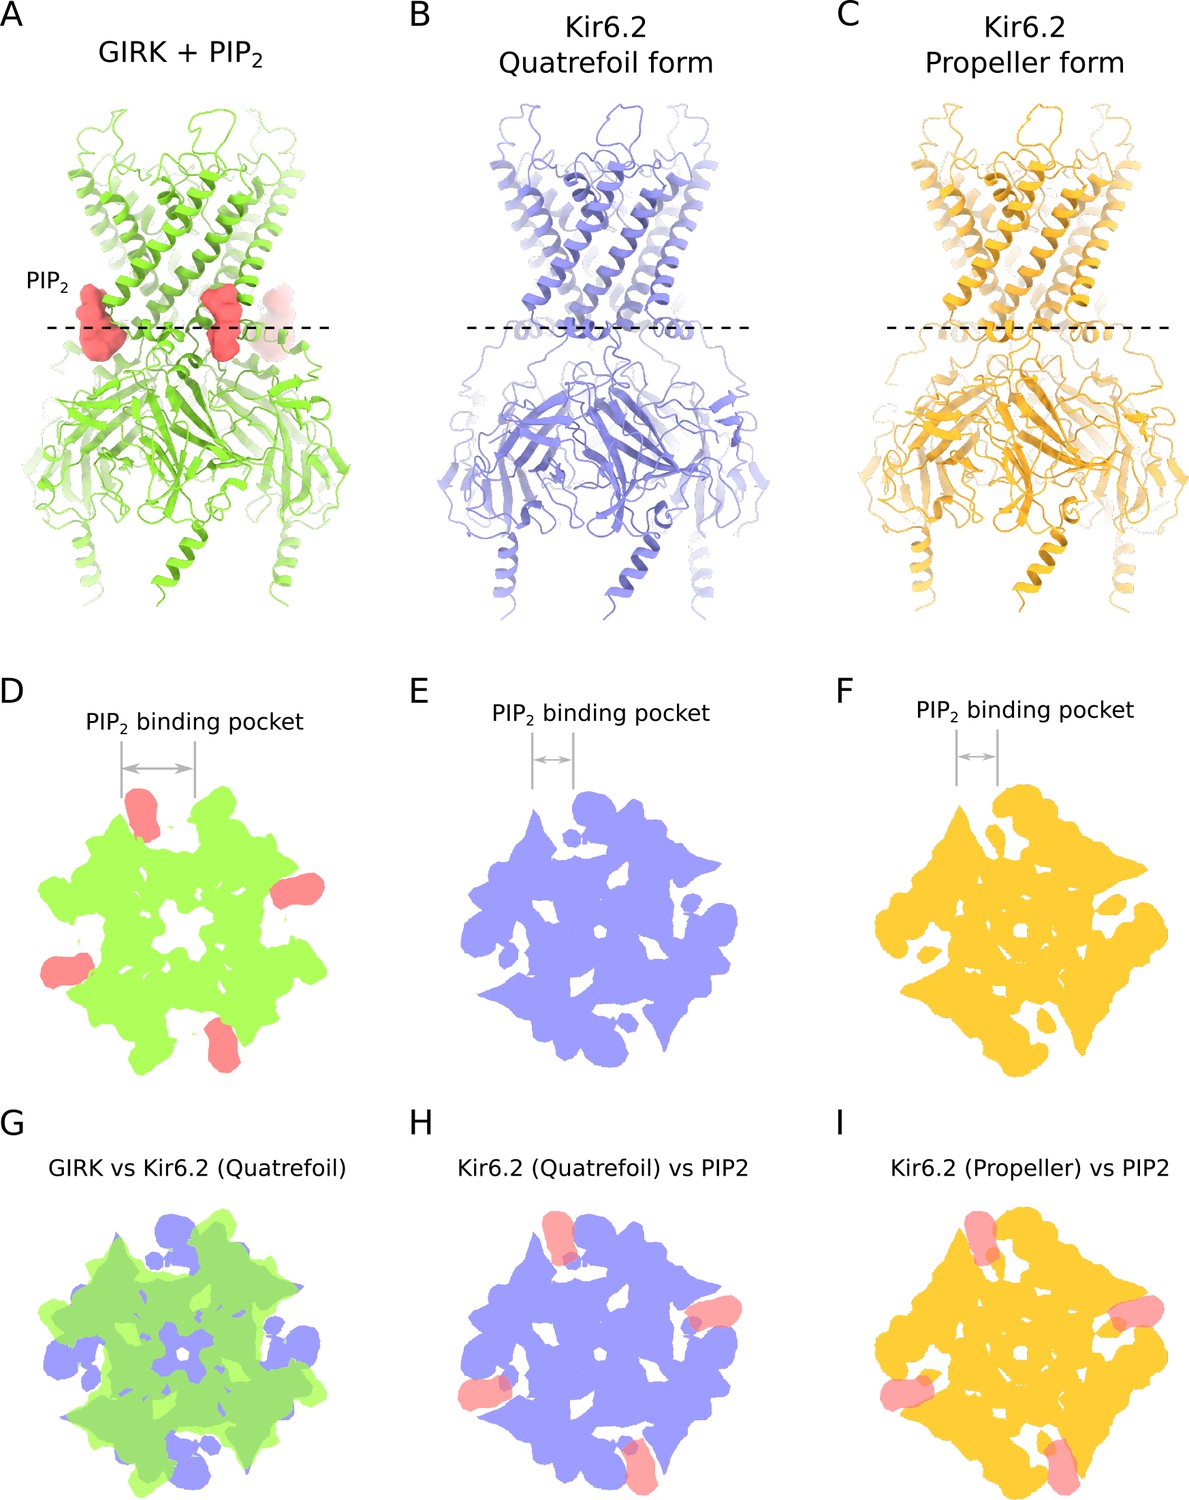
Comparison of PIP2-binding site in KIR channels.
(A) Ribbons reprentation of GIRK in complex with PIP2 (PDB ID: 3SYA). PIP2 is shown in surface representation, colored red. (B) Ribbons reprentation of Kir6.2 in the quatrefoil form of KATP. (C) Ribbons reprentation of Kir6.2 in the propeller form of KATP. (D–I) Cross-sections of the KIR channels shown in panels A-B spanning the PIP2 binding pocket. Dashed lines in panels A,B and C indicate the location of the cross-sections shown in panels D through I. These cross-sections illustrate that the large PIP2-binding pocket in GIRK is substantially compressed in Kir6.2. (D) Cross-section of a space-filling representation of the GIRK-PIP2 complex shown in A. (E) Cross-section of a space-filling representation of Kir6.2 in the quatrefoil form of KATP shown in B. (F) Cross-section of a space-filling representation of Kir6.2 in the propeller form of KATP shown in C. (G–I) Superposition of the cross-sections of the PIP2-binding pockets of GIRK and Kir6.2 shown in D, E and F. The KIR channels were aligned on the basis of their conserved selectivity filter regions. (G) Superposition of GIRK and Kir6.2 in the quatrefoil form of KATP. PIP2 is omitted for clarity. (H) Superposition of PIP2 from the GIRK crystal structure and Kir6.2 in the quatrefoil form of KATP. (I) Superposition of PIP2 from the GIRK crystal structure and Kir6.2 in the propeller form of KATP. The following coloring scheme is used in all panels: green – GIRK; blue – Kir6.2 (quatrefoil form); yellow – Kir6.2 (propeller form); red – PIP2.
Figure 6 with 3 supplements
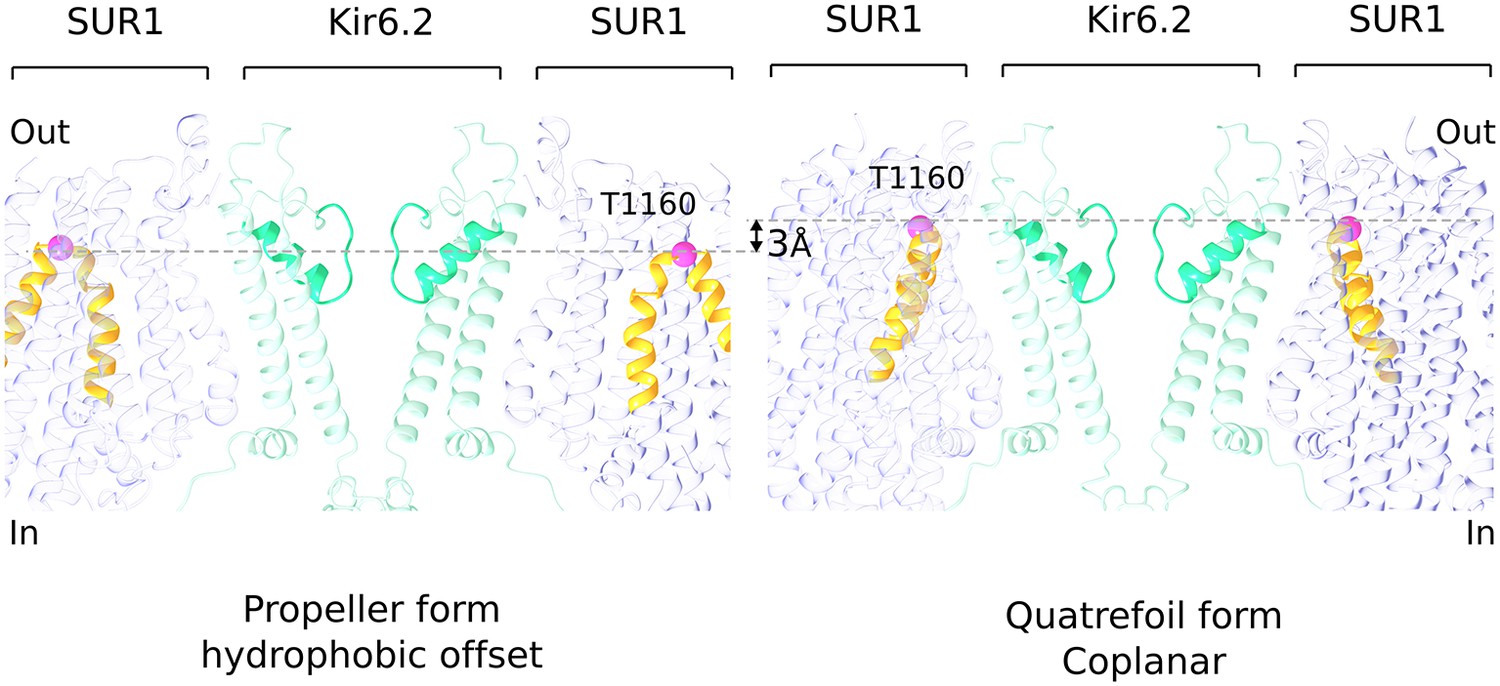
Hydrophobic offset of SUR1 relative to Kir6.2.
The grey lines connect the Cα position of T1160 residues (pink sphere) located in an extracellular loop on diagonally-opposed SUR1 subunits. The pictures of propeller and quatrefoil forms are aligned to each other with respect to the Kir6.2. This representation emphasizes that the SUR1 subunits in the two structural forms are offset from each other with respect to the Kir subunit.
Figure 6—figure supplement 1
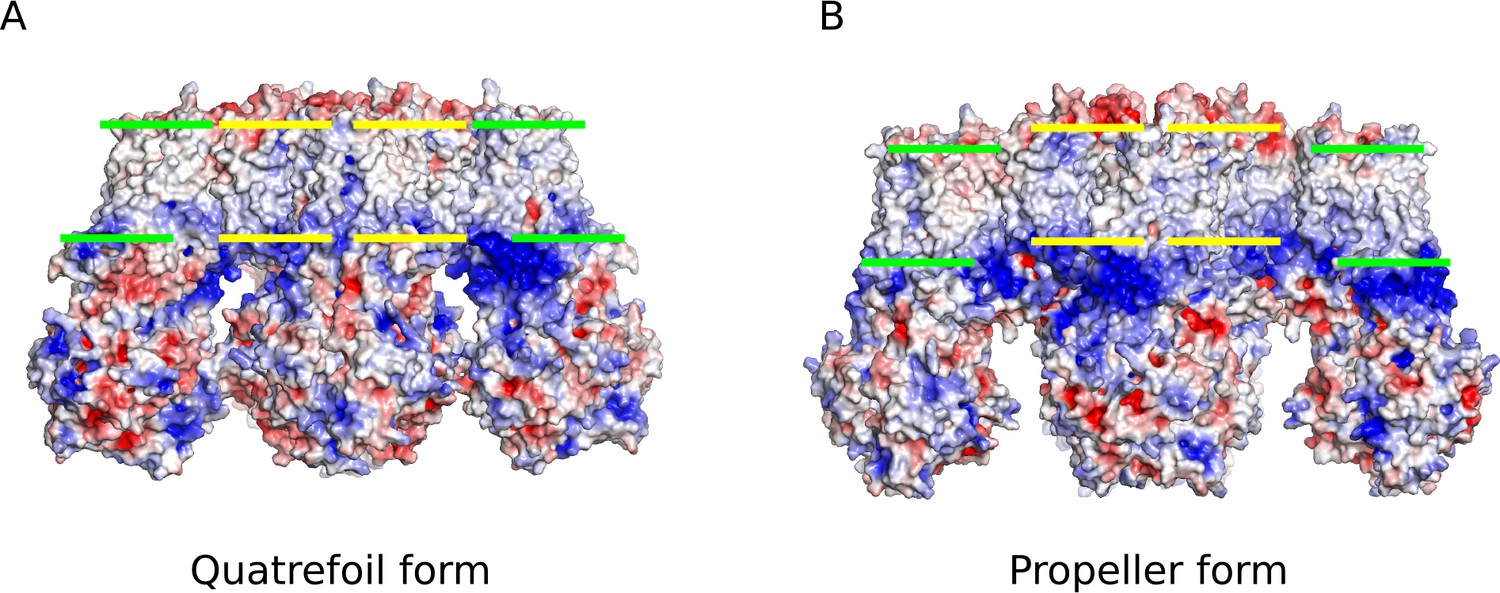
Comparison of the electrostatic potential surfaces of the quatrefoil and propeller forms.
Side-views of the electrostatic potential surfaces of both quatrefoil and propeller forms are shown to illustrate the offset in the hydrophobic membrane delimited regions between the two forms. (A) Electrostatic surface representation of the quatrefoil form. (B) The propeller form in the same representation. Green bars indicate the inferred hydrophobic boundaries of the transmembrane domains of the SUR1 transporter modules. Yellow bars indicate the inferred hydrophobic boundaries of the transmembrane portion of the Kir6.2 pore and TMD0 ‘core’ region that is very similar between the quatrefoil and propeller forms.
Figure 6—figure supplement 2
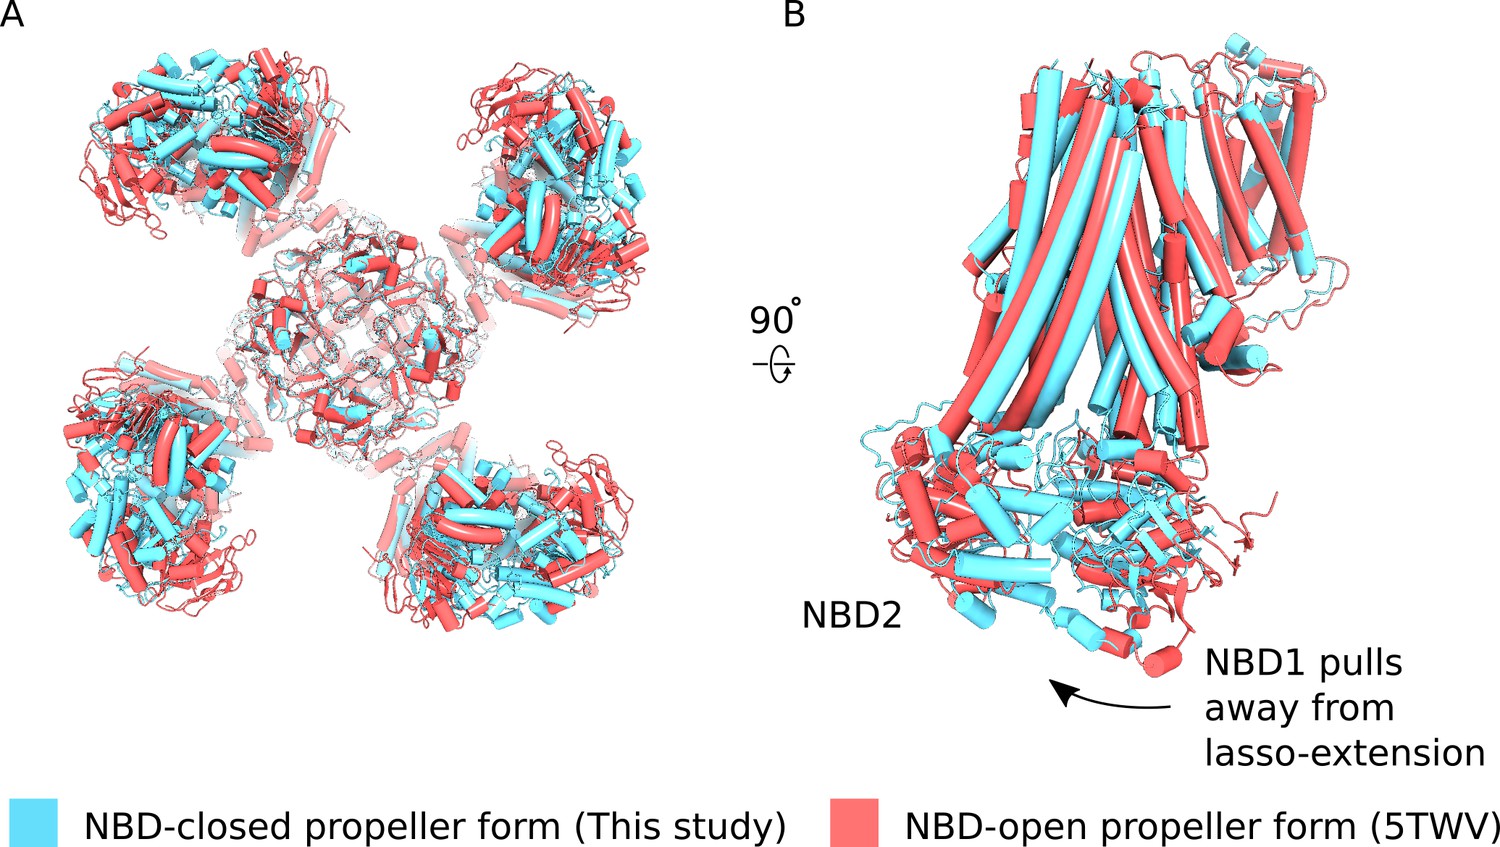
Comparison of NBD-closed and NBD-open propeller forms.
(A) The propeller forms of KATP bound to Mg2+-ATP and Mg2+ADP NBD-closed state (blue) or Mg2+-nucleotide free NBD-open state (PDB ID: 5TWV) (red) brought into co-incidence by alignment of their selectivity filters. The structure alignment is viewed from the bottom. The two propeller form states are very similar overall but differences in the disposition of NBDs of the two states are evident. (B) Side-view of one SUR1 subunit in the NBD-closed and NBD-open states from the alignment shown in (A). Nucleotide engagement correlates with tilting of NBD1 away from the lasso-extension. See main text for discussion.
Figure 6—figure supplement 3
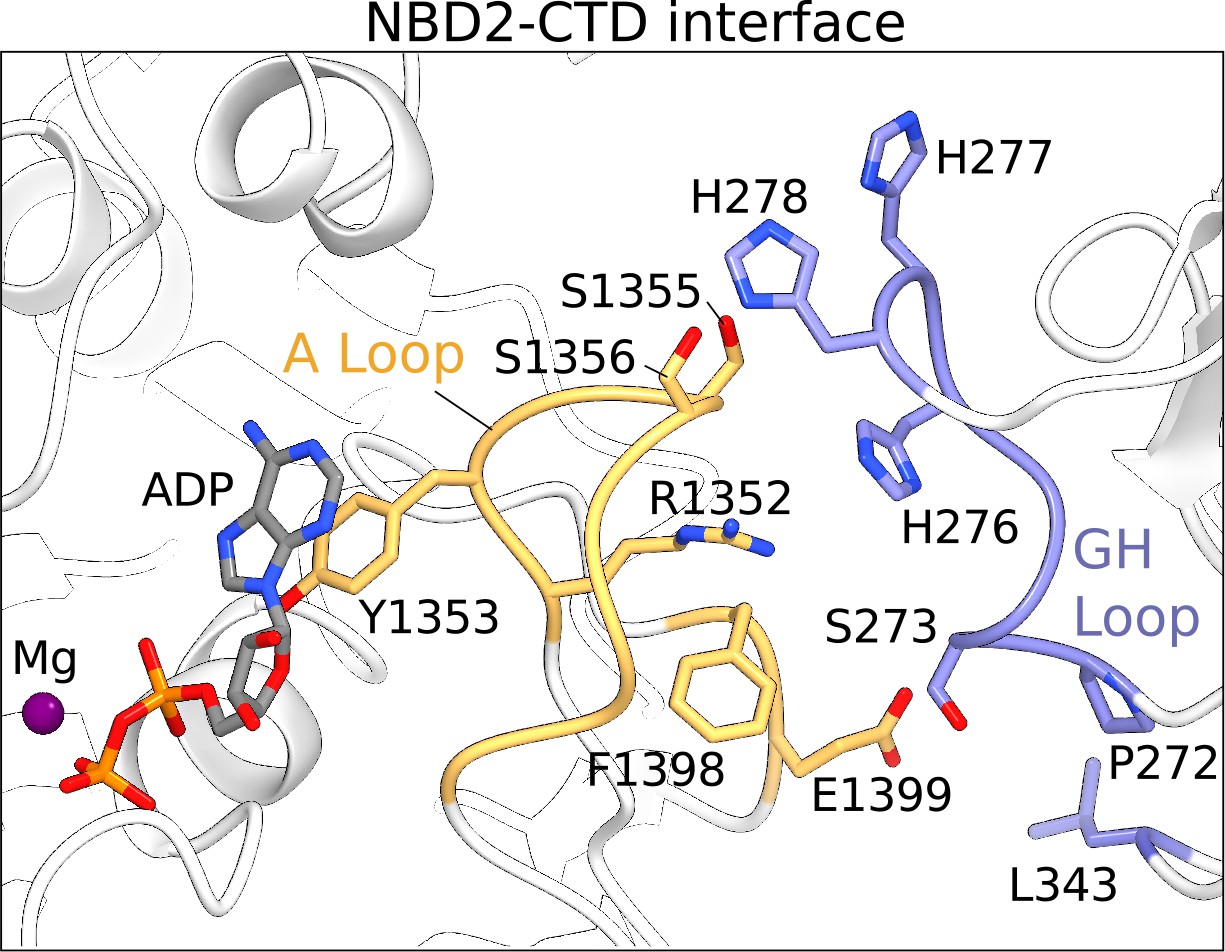
The NBD2-CTD interface.
The NBD2 of SUR1 and the CTD of KIR6.2 are shown in ribbons representation. Residues populating the NBD2-CTD interface reside mainly in the A-loop of NBD2 in SUR1 (orange) and GH-loop of the CTD in KIR6.2 (blue). The sidechains of residues contributing to the interface are shown. Mg2+-ADP in the consensus ATPase site of SUR1 is immediately adjacent to the NBD2-CTD interface and is shown as a ball-and-stick model.
Tables
Key resources table
| Reagent type (species) or resource | Designation | Source or reference | Identifiers | Additional information |
|---|---|---|---|---|
| Gene (Homo sapiens) | SUR1 | Uniprot | Q09428 | |
| Gene (Homo sapiens) | Kir6.2 | Uniprot | Q14654 | |
| Cell line (Spodoptera frugiperda) | Sf9 | ATCC | RRID: CVCL_0549 | |
| Cell line (Homo sapiens) | HEK293S GnTI- | ATCC | RRID: CVCL_A785 | |
| Recombinant DNA reagent | pEG BacMam | doi: 10.1038/nprot.2014.173 | ||
| Software, algorithm | RELION | doi: 10.1016/j.jsb.2012.09.006 | ||
| Software, algorithm | cryoSPARC | doi: 10.1038/nmeth.4169 |
Table 1
| KATP with Mg2+-ATP | ||
|---|---|---|
| Data acquisition | ||
| Microscope | Titan Krios | |
| Voltage (kV) | 300 | |
| Camera | Gatan K2 Summit | |
| Camera mode | Super-resolution | |
| Defocus range (μm) | 0.9 to 2.5 | |
| Pixel size (Å) | 1.3 (super-resolution = 0.65) | |
| Movies | 3179 | |
| Frames/movie | 40 | |
| Total electron dose (e-/Å2) | 47 | |
| Exposure time (s) | 10 | |
| Dose rate (e-/pixel/s) | 8 | |
| Quatrefoil form | Propeller form | |
| Reconstruction | ||
| Software | RELION | RELION |
| Symmetry | C4 | C4 |
| Particle number | 47,282 | 16,070 |
| Resolution (masked, Å) | 3.9 | 5.6 |
| Resolution range after focused refinement (masked, Å) | 4.1 to 3.3 | 4.5 to 3.8 |
| Model statistics | ||
| Residues built | 1596/1977 | 1667/1977 |
| Map CC (masked) | 0.825 | 0.743 |
| Cβoutliers | 0 | 0 |
| Molprobity score | 2.18 | 2.33 |
| EMRinger score | 1.82 | 0.95 |
| Ramachandran | ||
| Favored (%) | 92.48 | 90.99 |
| Allowed (%) | 7.51 | 8.73 |
| Outliers (%) | 0.00 | 0.28 |
| RMS deviations | ||
| Bond length | 0.007 | 0.006 |
| Bond angles | 1.074 | 1.134 |
Additional files
-
Transparent reporting form
- https://doi.org/10.7554/eLife.32481.026
Download links
A two-part list of links to download the article, or parts of the article, in various formats.
Downloads (link to download the article as PDF)
Open citations (links to open the citations from this article in various online reference manager services)
Cite this article (links to download the citations from this article in formats compatible with various reference manager tools)
Molecular structure of human KATP in complex with ATP and ADP
eLife 6:e32481.
https://doi.org/10.7554/eLife.32481


