The kinetics of pre-mRNA splicing in the Drosophila genome and the influence of gene architecture
- Massachusetts Institute of Technology, United States
- National Institute of Environmental Health Sciences, United States
- Harvard Medical School, United States
Figures
Figure 1 with 3 supplements
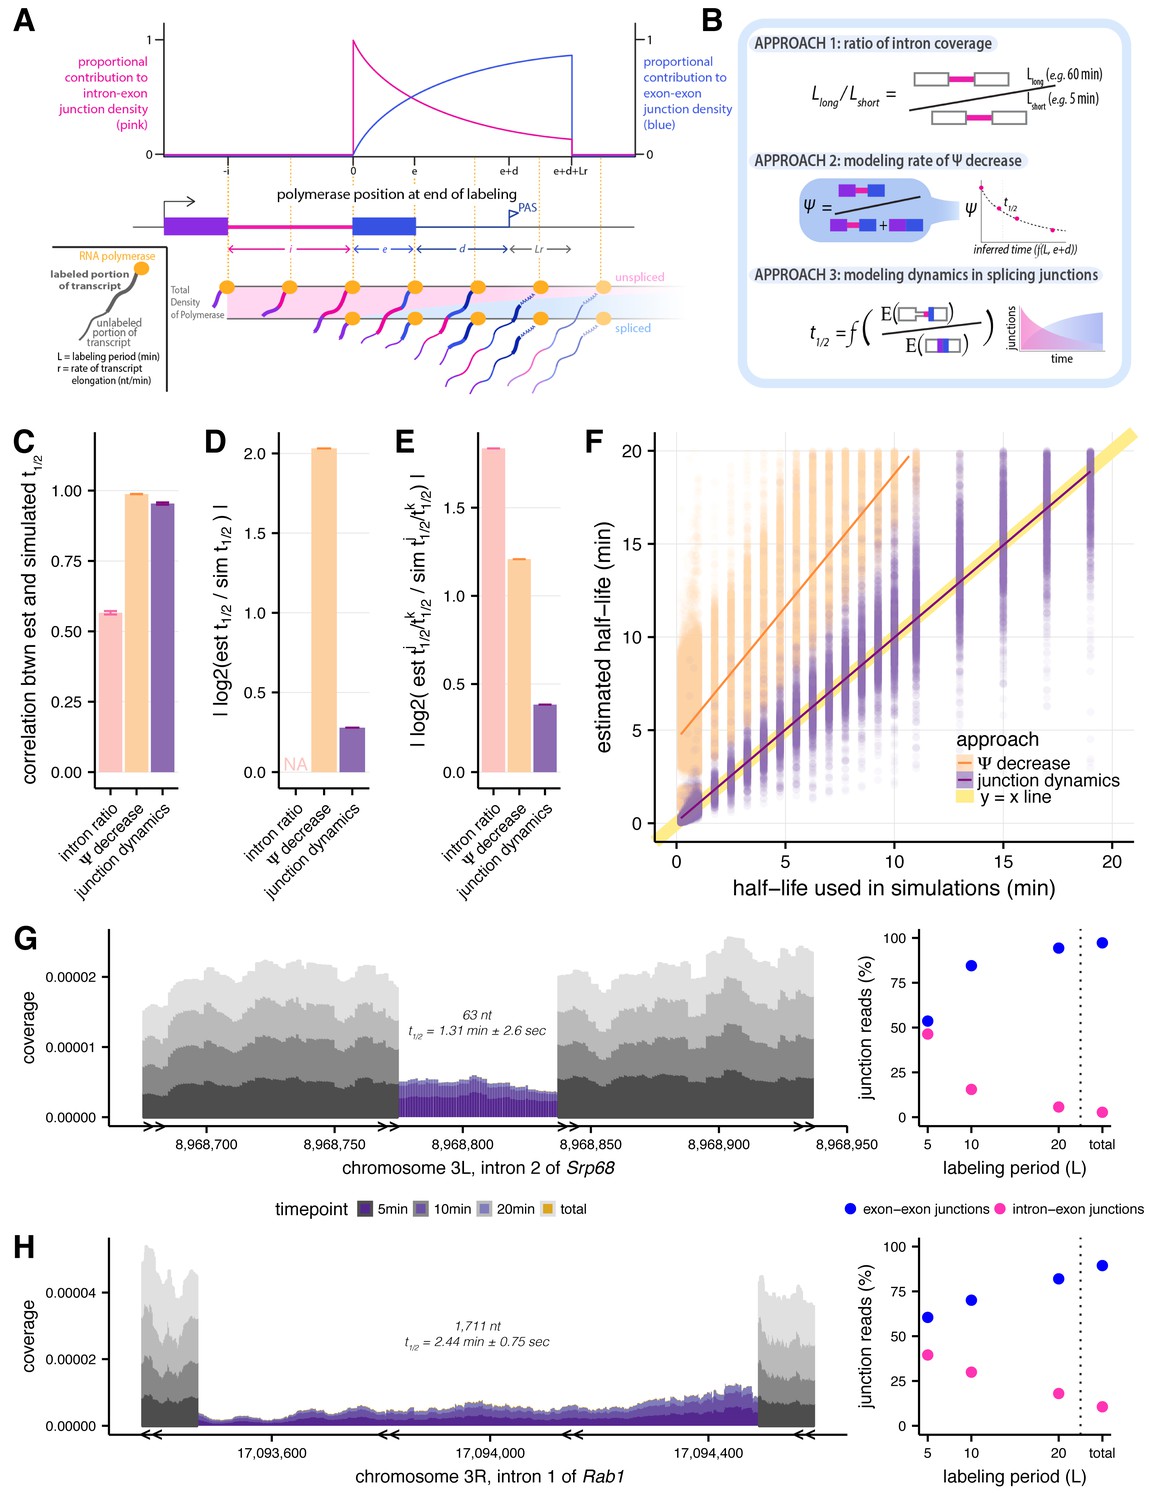
Estimating intron-specific splicing half-lives.
(A) Progressive labeling with 4sU results in sampling of nascent RNA molecules from polymerase molecules distributed across a gene (bottom). The probability of sampling reads from unspliced or spliced transcripts, represented by intron-exon (pink) and exon-exon (blue) junction reads respectively, is dependent on the intron half-life and the location of the polymerase at the completion of the labeling period (top). (B) Schematics outlining the three approaches assessed for measuring rates of intron excision. (C) Mean Spearman correlations between simulated half-lives and estimated splicing rates from each of our three approaches (error bars are ± standard error). (D) Absolute percent error of our estimated splicing rates relative to simulated half-lives. Intron ratios are relative measures of half-lives, thus were not included in this comparison (error bars are ± standard error). (E) Relative absolute percent error of the estimated and simulated half-lives between two introns, allowing comparisons of metrics not expected to be drawn from the same distribution (error bars are ± standard error). (F) Estimated half-lives from Ψ decrease and junction dyanmics approaches (x-axis) versus to the half-lives used to simulate read data (y-axis). Yellow line indicates y = x line of perfect correlation. (G and H) Nascent RNA coverage across the second intron of Srp68 (G) and the first intron of Rab1 (H). Colors represent time points, with 5 min after 4sU labeling (darkest shade), through 10 min, 20 min, and total RNA sample (lightest shade). Right panels show the proportions of intron-exon (pink) and exon-exon (blue) junction reads out of all 3’ junction reads in each labeling period.
Figure 1—figure supplement 1
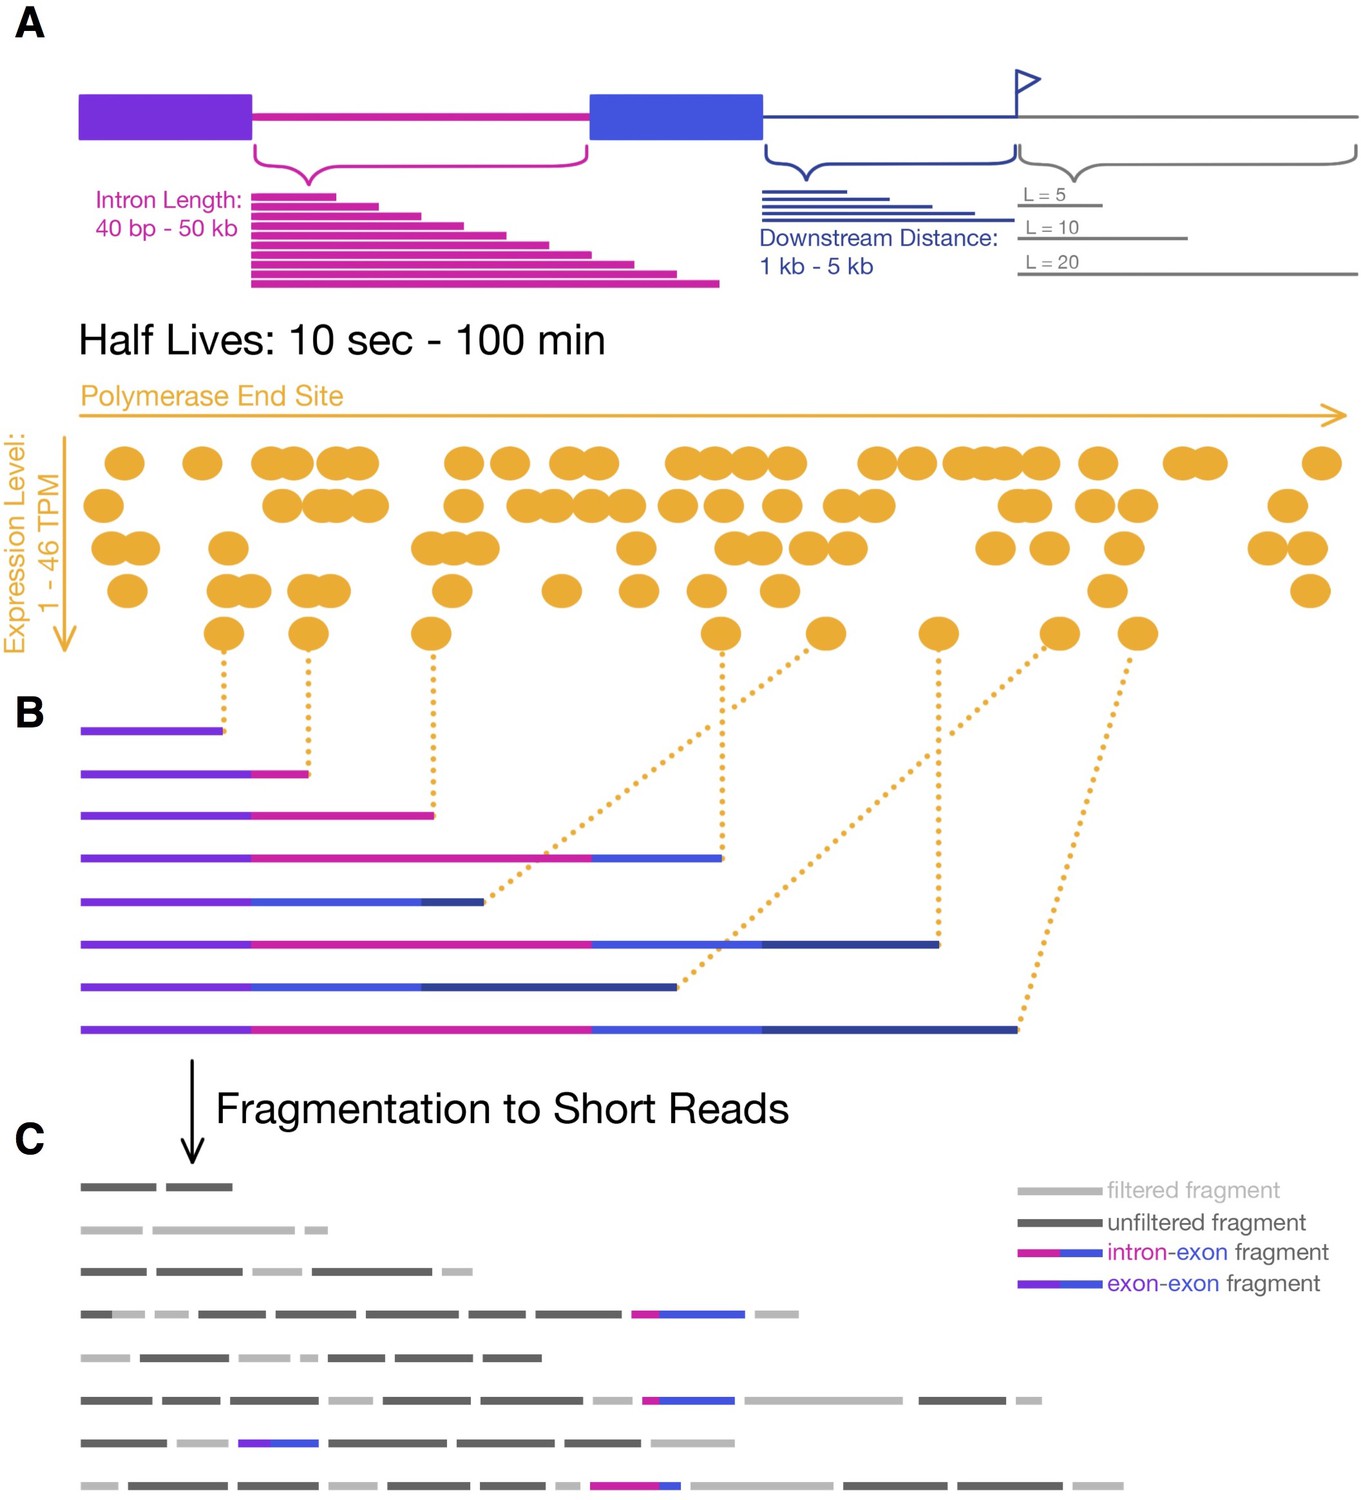
Simulating 4sU-seq reads.
(A) Parameters over which 4sU-seq reads where simulated, including intron length (pink; 40 nt – 50 kb), distance downstream of 3’ splice site (dark blue; 1–5 kb), labeling period (grey; 5, 10, 20, and 60 min), expression levels (orange; 1–46 TPM), and half-lives (0.2–100 min). (B) Transcripts are selected from a uniform distribution of polymerase end sites (determined by the progression of transcription within a labeling period) and a probability of splicing (dependent on the half-life). (C) Transcripts are fragmented, all fragments between [200-300] nt are retained (dark grey; simulating the size-selection step in library preparation), and the first 50 nt of each fragment is considered a read. For the junction dynamics approach, only intron-exon (pink-blue) and exon-exon (purple-blue) reads are used.
Figure 1—figure supplement 2
Assessing approaches for estimating intron-specific splicing half-lives.
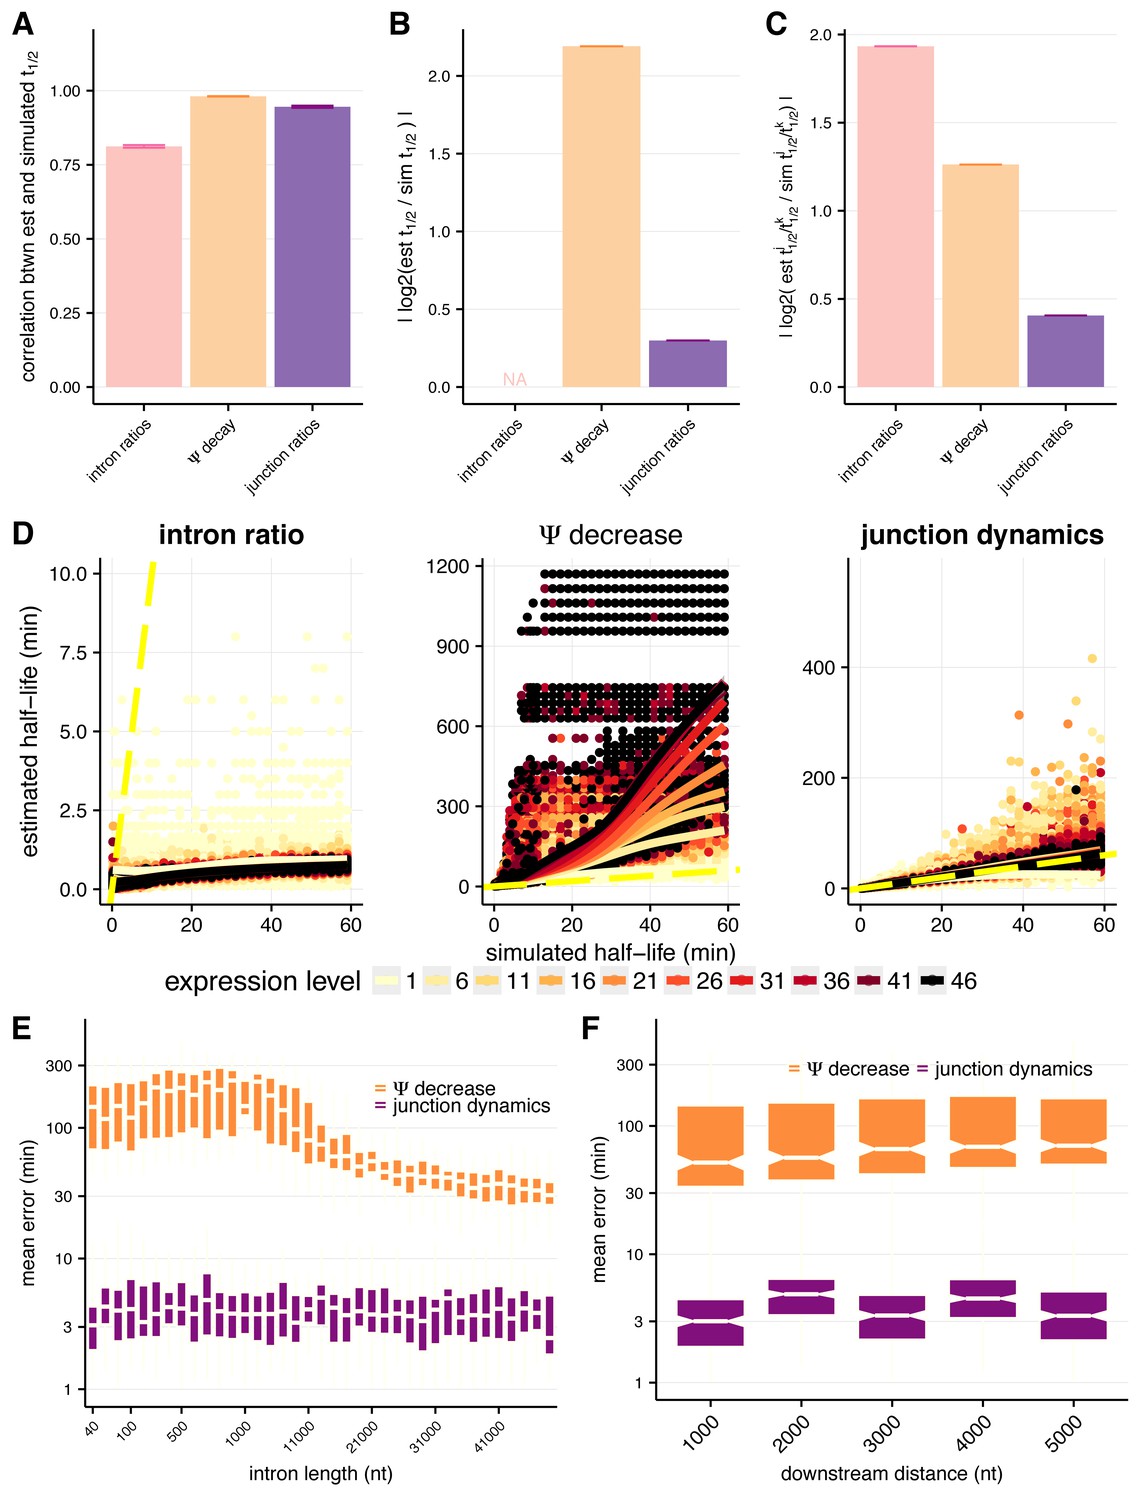
(A) Mean Spearman correlations between simulated half-lives and estimated splicing rates from each of our three approaches for the full distribution of simulated half-lives (0.2–100 min). Error bars are ± standard error. (B) Absolute percent error of our estimated splicing rates relative to simulated half-lives for the full distribution of simulated half-lives (0.2–100 min). Intron ratios are relative measures of half-lives, thus were not included in this comparison (error bars are ± standard error). (C) Relative absolute percent error of the estimated and simulated half-lives between two introns for the full distribution of simulated half-lives (0.2–100 min), allowing comparisons of metrics not expected to be drawn from the same distribution (error bars are ± standard error). (D) Estimated half-lives (x-axis) relative to the half-lives used to simulate read data (y-axis) for each approach to estimate splicing rates. Colors indicate introns sampled from different expression levels (in TPM) and dotted yellow line represents the y = x line. (E) Mean error across the range of simulated half-lives (y-axis) for our estimated splicing rates relative to simulated half-lives across the range of simulated intron lengths (x-axis) for the Ψ decrease and junction dynamics approaches (orange and purple, respectively). (F) Mean error across the range of simulated half-lives (y-axis) for our estimated splicing rates relative to simulated half-lives across the range of distances downstream of the 3’ splice site (x-axis, representative of 3’ transcript length) for the Ψ decrease and junction ratio approaches (orange and purple, respectively).
Figure 1—figure supplement 3
Applying the junction dynamics approach to estimate intron-specific half-lives in Drosophila cells.
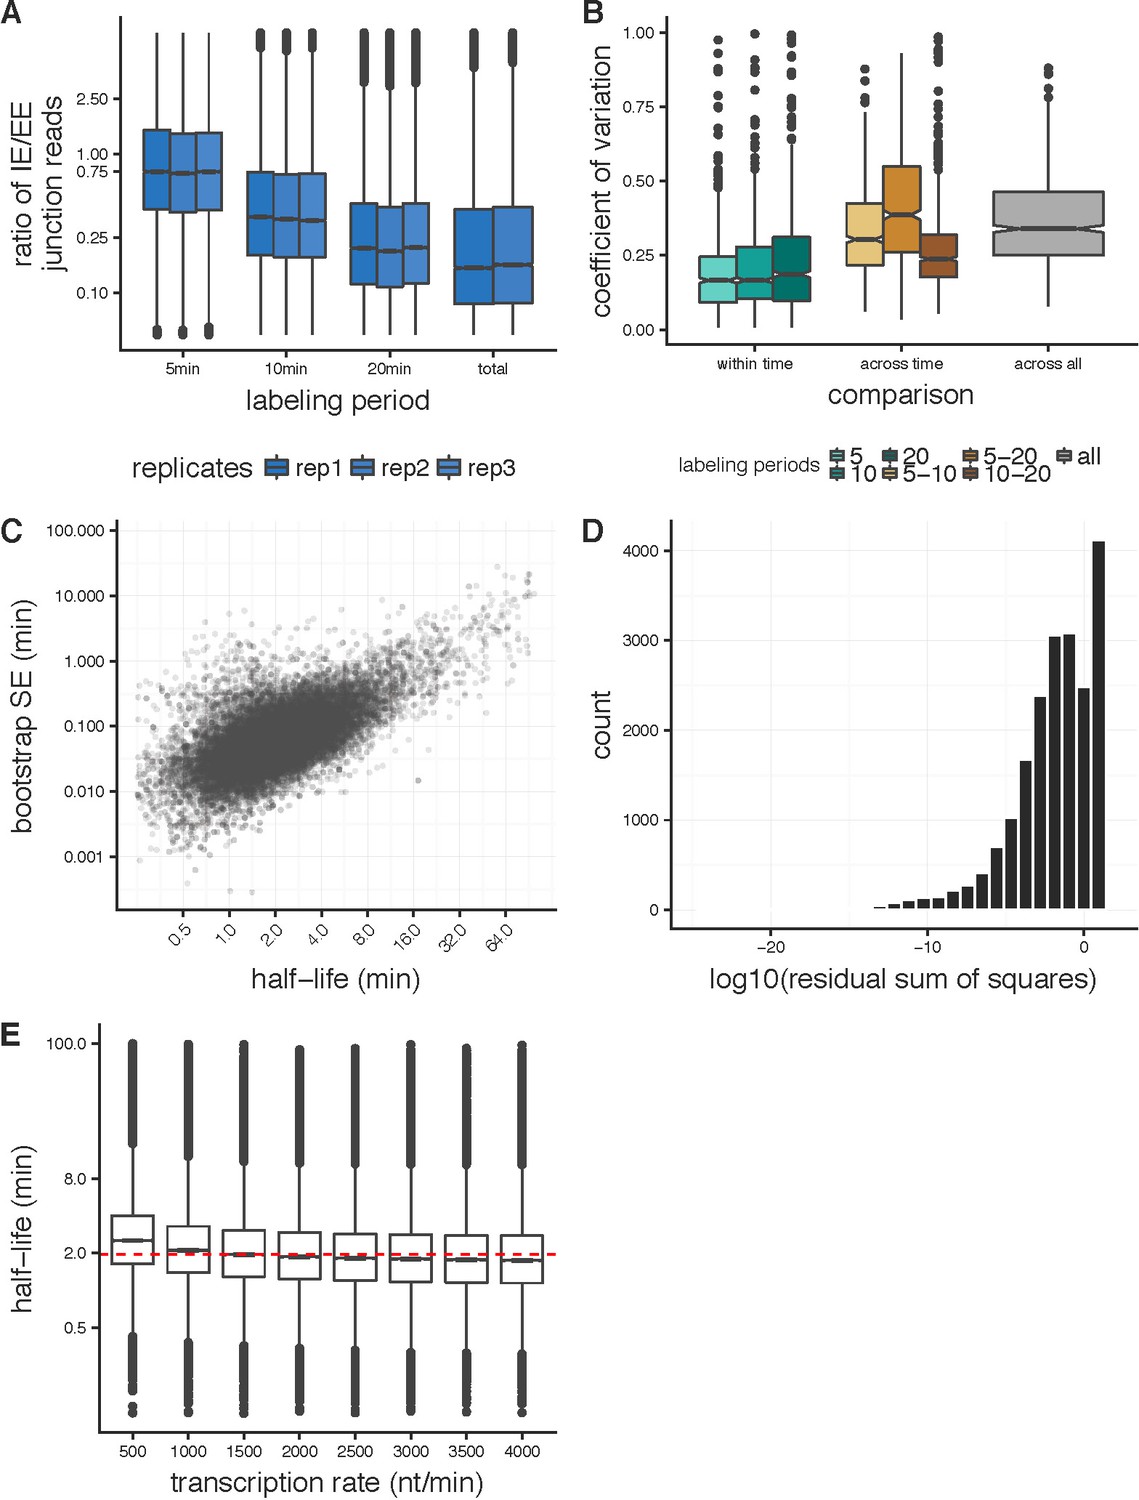
(A) Ratio of intron-exon (IE) to exon-exon (EE) junction reads for an intron (y-axis) for nascent RNA collected 5 min, 10 min, and 20 min after 4sU labeling, with a time point labeled overnight representing steady-state or total RNA levels. The overall decrease in IE/EE ratios with increasing labeling periods indicates increased completed splicing over time. (B) For the 1000 highest expressed introns in Drosophila S2 cells, the coefficient of variation between splicing half-lives for half-lives calculated across replicates within labeling period (shades of green), across pair-wise sets of labeling periods (shades of orange) and across all replicate and labeling periods (grey). (C) Standard error estimates on half-lives (y-axis) calculated from bootstrapping across sub-sampled read populations (see Materials and methods) across a range of splicing half-lives (x-axis). (D) Distribution of the residual sum of squares (log10, x-axis) assessing the goodness-of-fit for the junction dynamics model across the three labeling periods. (E) Distributions of splicing half-lives (y-axis) estimated using the junction dynamics approach across a range of constant transcription rates (x-axis) input in the model, which are consistent with the range of transcription rates that have been observed previously.
Figure 2 with 1 supplement

Splicing efficiency is variable across classes of intron length and regulatory potential.
(A) Running median of splicing half-lives across distribution of intron lengths. Median is computed in sliding bins of 50 introns. (B) Splicing half-lives across bins of 10 nt intron lengths. Background bars display number of Drosophila introns in each bin. (C) Mean position of branchpoint ‘A’ in the strongest branchpoint motif in each bin of intron length (error bars are ± standard error). Motif logos (left) were created using branchpoint motif across all introns in the intron length bin. (D) Splicing half-lives in different categories of intron regulation, where constitutive introns (blue) are spliced out faster than either annotated regulated retained introns (RI, orange) or introns flanking annotated alternative exons (SEflanking, yellow), for cases where the RI is fully spliced and the SE is fully included in S2 cells.
Figure 2—figure supplement 1
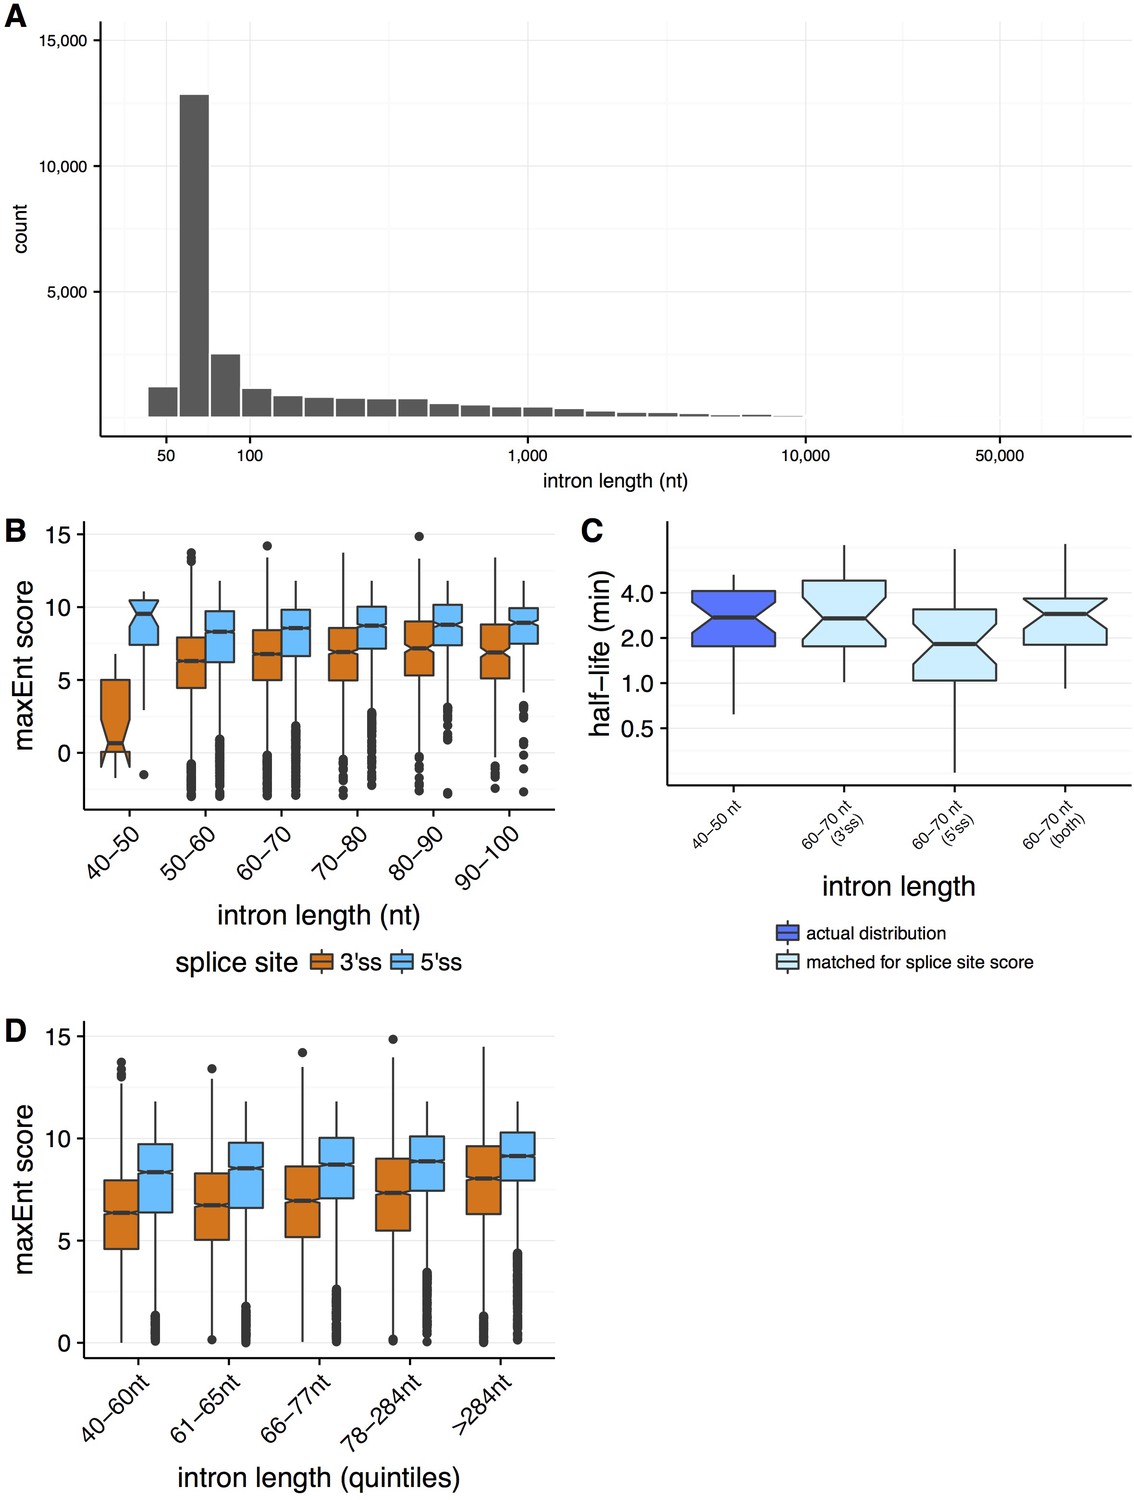
Properties of splicing efficiency across varying intron lengths.
(A) Distribution of intron lengths in the Drosophila melanogaster genome. (B) Distribution of splice site strengths (MaxEnt score, y-axis) across both 3' splice sites (orange) and 5' splice sites (blue) for introns between 40 and 100 nt (x-axis). (C) The distribution of splicing efficiency (half-lives, y-axis) for very short 40–50 nt introns (dark blue), relative to the distributions for 60–70 nt introns matching for the distributions of 40-50nt 3' splice site strength (light blue, t-test p=0.995), 5' splice site strength (light blue, t-test p=0.280), and both 5' and 3' splice site strengths (light blue, t-test p=0.342). (D) The distributions of splice site strengths (MaxEnt score, y-axis) across both 3’ and 5’ splice sites for introns binned into quantiles of intron length (x-axis).
Figure 3 with 2 supplements
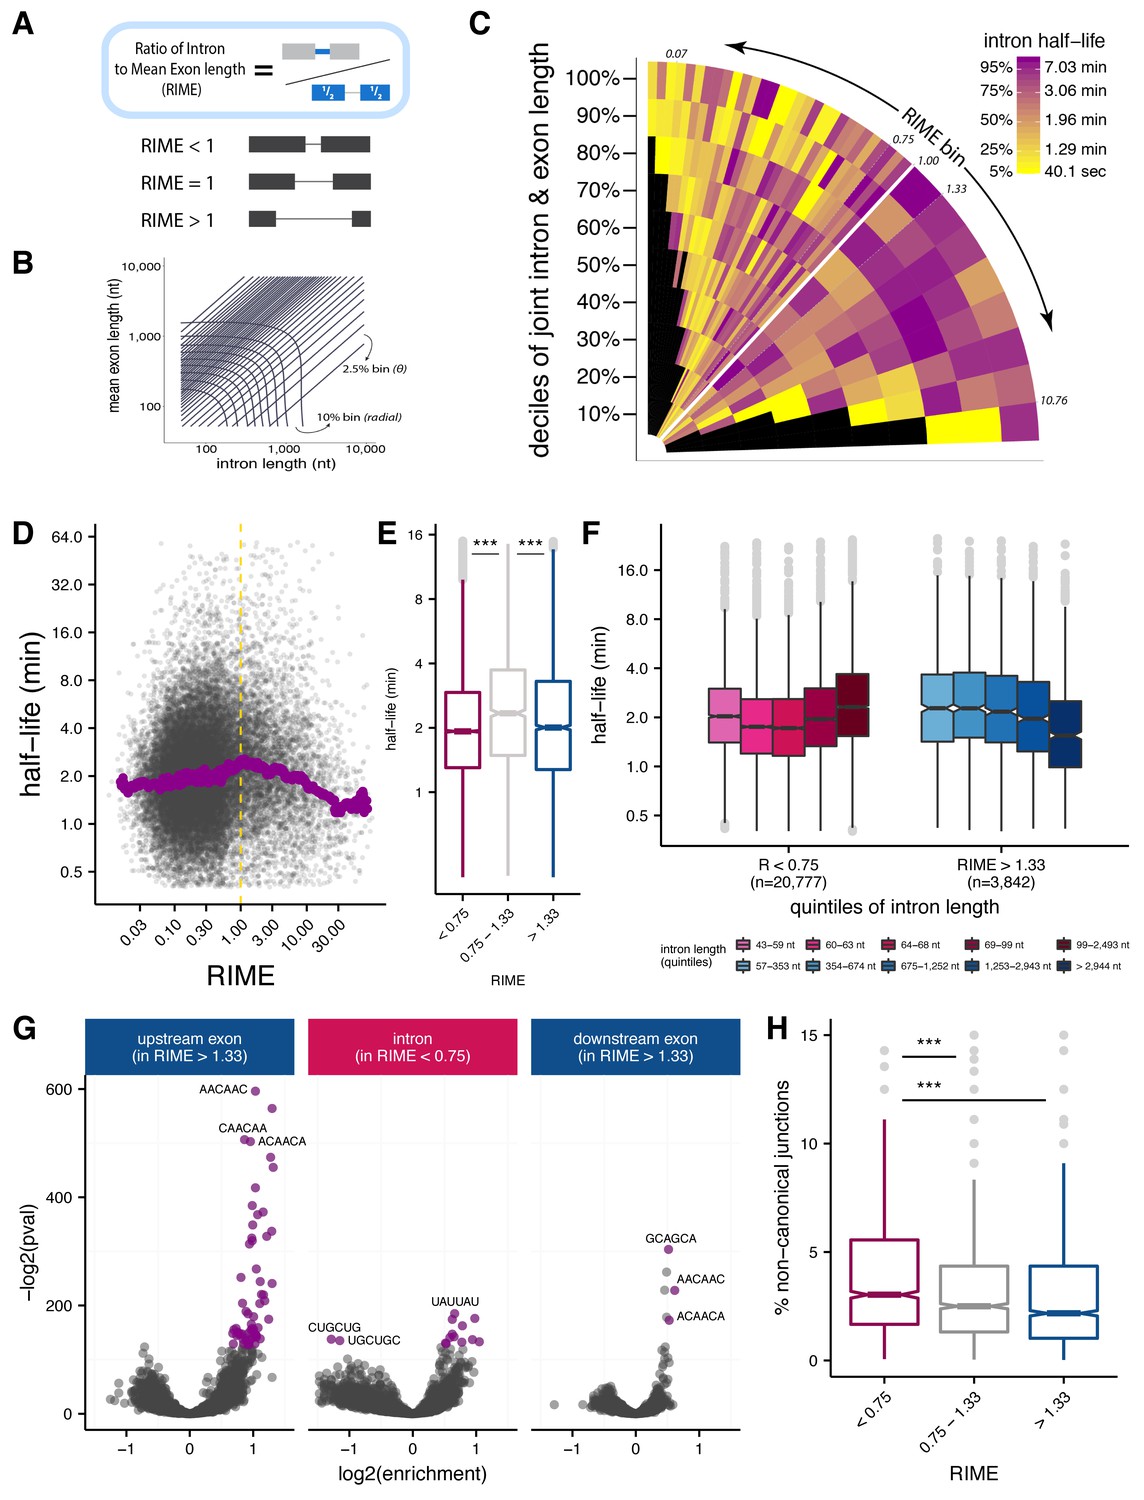
Splice site recognition mode influences the efficiency of splicing.
(A) The Ratio of Intron to Mean Exon (RIME) metric is defined as the ratio of a given intron length to the mean length of the exons flanking that intron. (B) Schematic of binning to capture intron length (x-axis, nt), mean flanking exon length (y-axis, nt), and RIME values in a single plot. Radial bins capture both intron and and mean exon length (10% bins), while diagonal bins (2.5% bins, θ axis) capture the RIME distribution. (C) Distribution of mean splicing half-lives across bins of RIME (θ axis) and deciles of joint intron and exon lengths (r axis). Yellow represents short mean half-lives and dark purple represents longer mean half-lives. (D) Running median of splicing half-lives across distribution of RIME values. Median is computed in sliding bins of 200 introns. (E) Distribution of splicing half-lives for introns with RIME <0.75 (pink), 0.75 < RIME < 1.33 (grey), and RIME >1.33 (blue). (F) Splicing half-lives across quintiles of intron length in each RIME class (RIME <0.75 in shades of pink on left and RIME >1.33 in shades of blue on right). (G) Enrichment of 6mers in exons upstream of introns with RIME >1.33 (left), intronic regions of introns with RIME <0.75 (middle), and exon downstream of introns with RIME >1.33 (right). Significant 6mers are in purple (Benjamini-Hochberg corrected p-value<10−30). (H) Splicing accuracy measured by percentage of non-canonical unannotated reads for introns with RIME <0.75 (pink), 0.75 < RIME < 1.33 (grey), and RIME >1.33 (blue).
Figure 3—figure supplement 1

Jointly evaluating effects of intron and exon length on splicing half-lives.
(A) Deciles of joint intron and mean exon length (x-axis and y-axis, respectively) shown across shades of green. Deciles are taken across the distribution of each intron’s length distance from [0 nt,0 nt]. (B): RIME values in 40 bins with 2.5% percent of the total number of introns in each bin. Bins are initiated at RIME = 1 (~80 percentile), with 32 bins in the RIME < 1 regime and eight bins in the RIME > 1 regime. (C) Intron length (left, nt) and exon length (right, nt) versus RIME values (2.5% bins, y-axis), broken into 5% length bins and shading indicates half-life. Bins filled with blue indicate no data and yellow line represents RIME = 1. (D) Highlighting stripes of ultra-short introns (purple, left stripe), short introns 60-70 nt (yellow vertical stripe), and long introns (yellow horizontal stipe). (D) Mean intron length (numbers) for a subset of bins of joint intron and mean exon length and RIME value, as indicated in the inset (grey bins are not shown, outlined bins have mean intron lengths shown). Colors indicate splicing half-life. (E) Splicing half lives across quintiles of exon length in each RIME class (RIME < 0.75 in shades of pink on left and RIME > 1.33 in shades of blue on right).
Figure 3—figure supplement 2
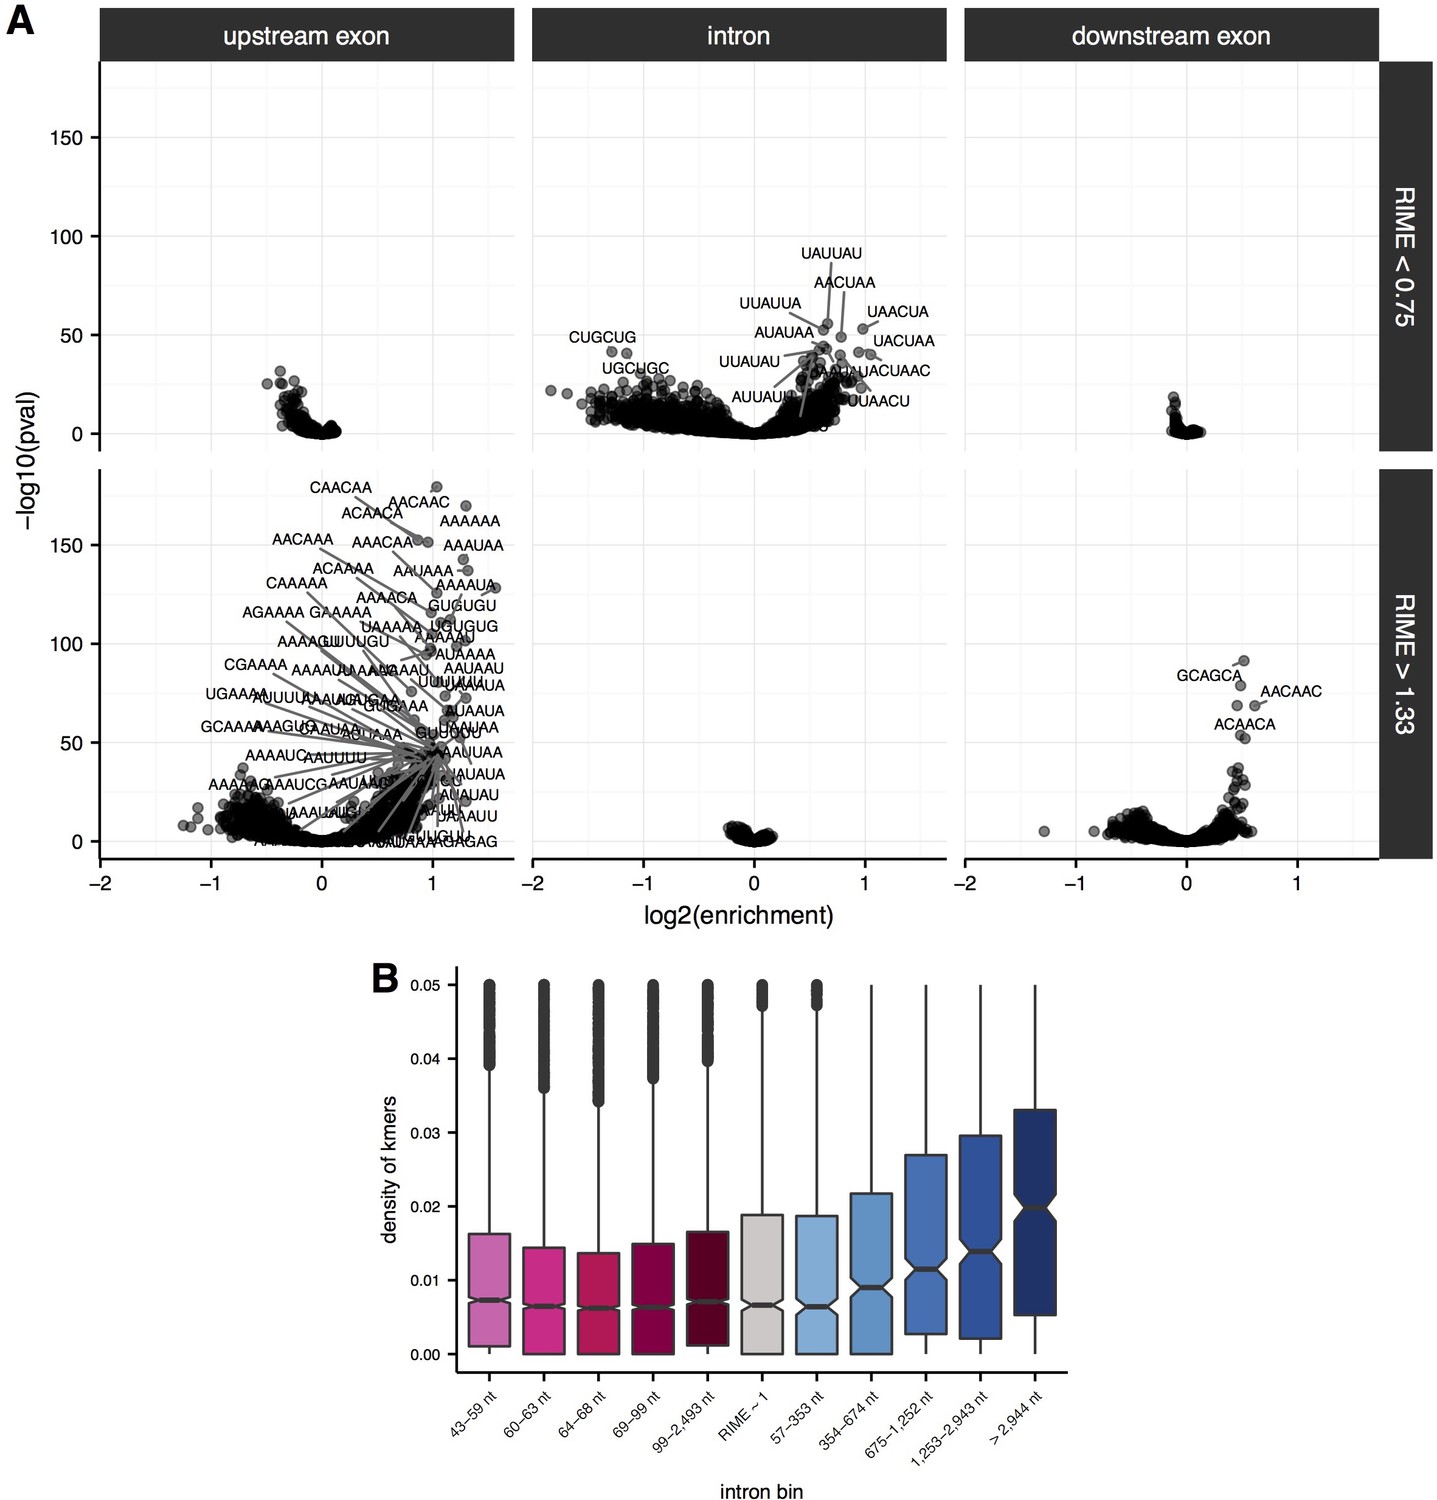
Enrichment of sequence elements in and around introns with variable RIME values and lengths.
(A) Enrichment of 6mers in flanking upstream exons (left), intronic regions (middle) and flanking downstream exons (right) for introns with RIME < 0.75 (top) and RIME > 1.33 (bottom). 6mer sequences are indicated for significant 6mers (Benjamini-Hochberg corrected p-value<10−30). (B) Density of significant 6mers (number of kmers/length of region; y-axis) for each quintile of intron length for introns with RIME < 0.75 (shades of pink), RIME > 1.33 (shades of blue) and 0.75 < RIME < 1.33 (grey).
Figure 4 with 2 supplements
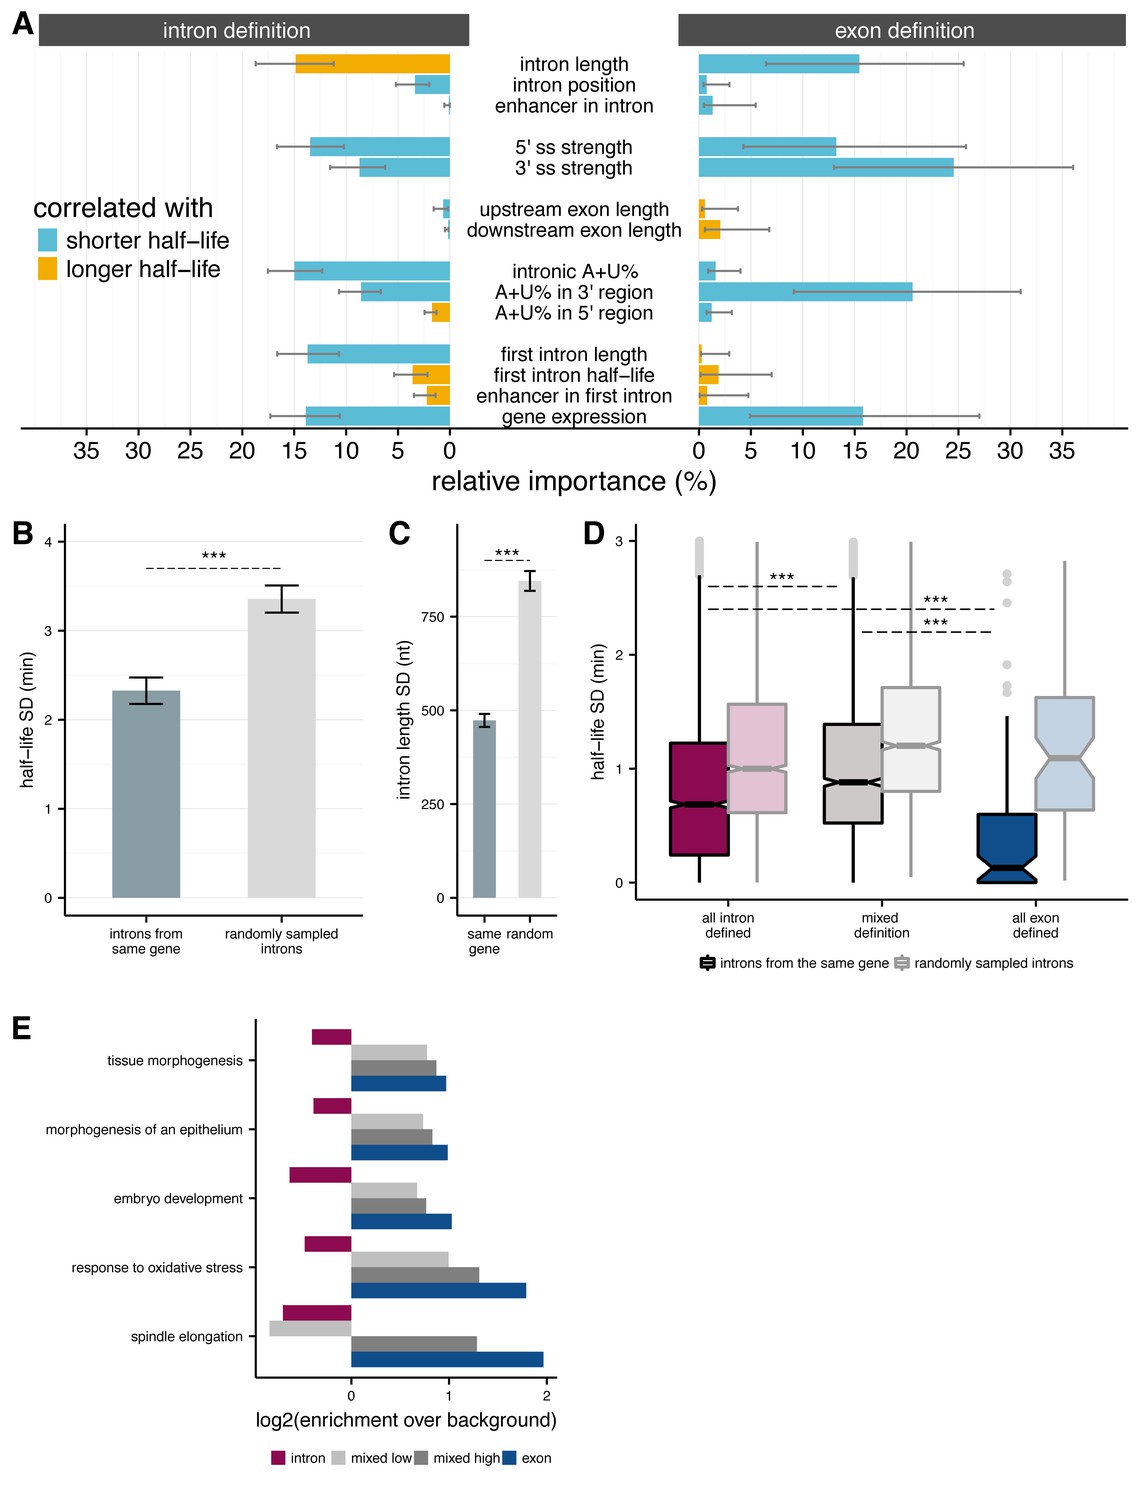
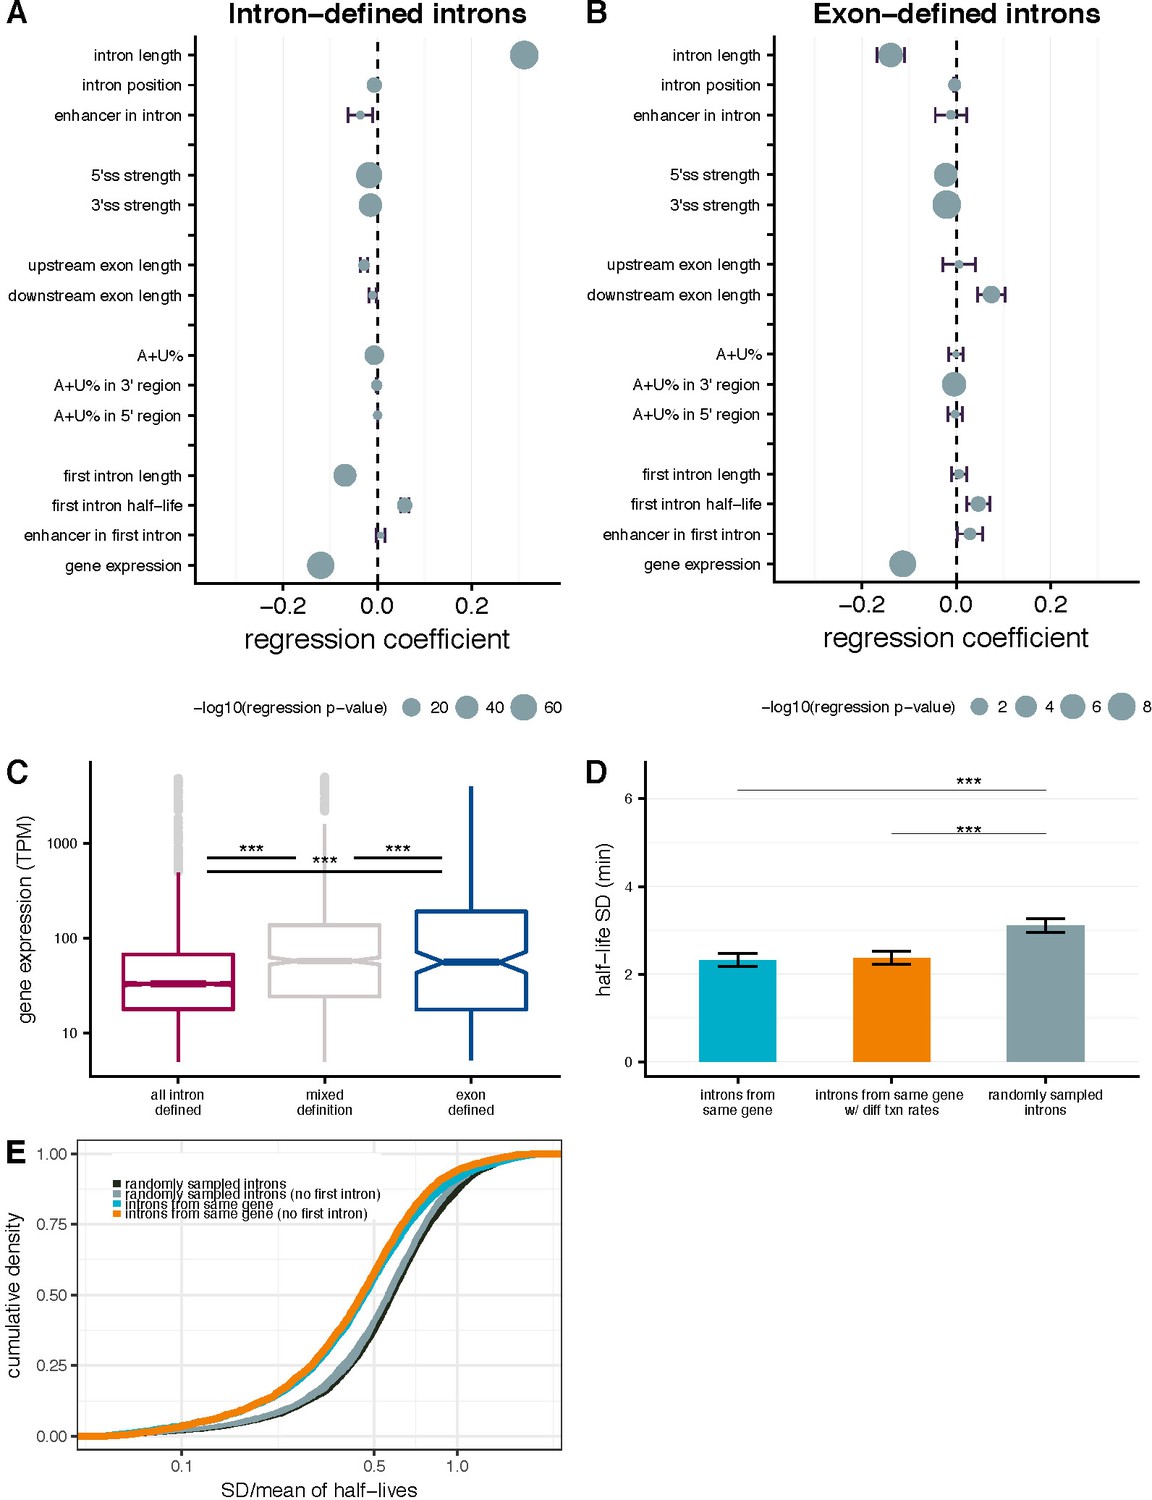
Splicing efficiency across introns within a gene.
(A) Relative importance of variables influencing variance in splicing half-lives in intron-defined (left) and exon-defined (right) introns, using a multiple linear-regression to account for variance in half-lives for non-first introns. (B) Mean variance of splicing half-lives across introns within a gene relative to randomly sampled introns (chosen to match the distribution of lengths within actual genes; error bars are ± standard error). (C) Average standard deviation of intron lengths across introns within a gene relative to randomly sampled introns (error bars are ± standard error). (D) Average standard deviation of splicing half-lives across introns within genes with mostly intron-defined introns (left), mostly exon-defined defined introns (right), and a mixture of definition classes (middle), relative to randomly sampled introns within each category of genes (lighter colors). (E) Enrichment of genes (x-axis; log2) within Gene Ontology categories that are significantly over-represented among exon-defined genes (y-axis) for classes of genes with increasing proportions of exon-defined genes: all intron-defined (pink), mixed-definition (grey), and exon-defined (blue).
Figure 4—figure supplement 1
Intron- and gene-specific variables contributing to variability in splicing half-lives.
Coefficients from a multiple linear-regression with several parameters (y-axis), where the coefficient represents the % change in half-life concordant with a 1% change in each parameter for intron-defined (A) and exon-defined (B) introns. Bars indicate the standard error and the size of the mean dot indicates the –log10 p-value for the significance of the individual parameter. (C) Distribution of gene expression (TPM; y-axis) for genes with have introns that are mostly intron-defined (pink), mostly exon-defined (blue) or have mixed definition of their introns (grey). (D) Mean variance of splicing half-lives across introns within a gene (left) relative to splicing half-lives calculate using random transcription rates (between 0.5 and 5 kb/min) across introns with a gene (middle) and randomly sampled introns (right, chosen to match the distribution of lengths within actual genes; error bars are ± standard error). (E) The cumulative distribution of variance in splicing half-lives (coefficient of variation; x-axis) across introns within a gene (blue) and introns randomly sampled to match the distribution of length so fintrons within actual genes (black). This trend is consistent when excluding the first intron of each gene (orange) and doing a similar sampling strategy excluding selection of first introns (grey).
Figure 4—figure supplement 2

First-intron length and splicing efficiency.
(A) The distribution of splicing efficiency (median half-lives, y-axis) vs. intron length (mean nucleotides, x-axis) for introns in different positions across a gene. First introns are longer and more slowly spliced than non-first introns. (B) The percentage of enhancers within an intron (y-axis) for first introns (blue) and non-first introns (grey) binned by quintiles of intron length (x-axis). (C) The distribution of intron half-lives (y-axis) for introns containing an enhancer (blue) and without an enhancer (grey) binned by quintiles of intron length (x-axis). (D) Median splicing half-lives of non-first introns (mean within a bin; y-axis) within a gene for quantiles of first intron lengths (x-axis), with standard errors across the mean. (E) Selected genes with five or more total introns, of which all of the non-first introns are 60-70 nt in length and have low variance across their splicing half-lives. Varying first intron lengths across these genes (nt, x-axis) shows a correlation between first intron length and the median half-lives for these genes (y-axis). (F) Cumulative distributions of first-intron lengths (x-axis) for groups of genes classified by number of annotated introns (colors).
Tables
Key resources table
| Reagent type (species) or resource | Designation | Source or reference | Identifiers | Additional information |
|---|---|---|---|---|
| Cell line (Drosophila melanogaster) | S2 | Drosophila Genome Resource Center | Stock #6 | |
| Chemical compound | 4-thiouridine (4sU) | Sigma | T4509 | |
| Software | Tophat 2.0.4 | Trapnell et al. (2009); PMID: 19289445 | ||
| Software | Kallisto | Bray et al., 2016; PMID: 27043002 | ||
| Software | MaxEntScan | Yeo and Burge, 2004; PMID: 15285897 | ||
| Software | MEME | Bailey et al. (2009); PMID: 19458158 | ||
| Software | STAR v2.5 | Dobin et al. (2013); PMID: 23104886 |
Additional files
-
Supplementary file 1
Summary of introns analyzed.
Column 1 – intron: Coordinates of introns, with chr:start:end:strand for the upstream flanking exon and the chr:start:end:strand for the downstream flanking exon separated with a ‘@’. Column 2 – gene: FlyBase gene symbol for parent gene. Column 3 – TPM: Gene expression values calculated with kallisto. Column 4 – PSI: MISO-derived Ψ values of intron in total time point (average across two replicates). Column 5 – intron_position: Position of intron relative to other introns in the transcript. Column 6 – intron_length: Length of intron (nucleotides). Column 7 – intron_type: Regulatory type of intron, where CI is constitutively spliced intron, RI is an annotated retained intron, and SEflanking is an intron that flanks a retained intron. Column 8 – ss5_maxEnt: maxEnt-derived splice site score for the 5’ splice site of the intron. Column 9 – ss3_maxEnt: maxEnt-derived splice site score for the 3’ splice site of the intron. Column 10 – contains_enhancer: Flag for whether the intron contains a transcriptional enhancer as defined by STARR-seq. Column 11 – upexon_length: Length of upstream exon (nucleotides). Column 12 – downexon_length: Length of downstream exon (nucleotides). Column 13 – three_length: Length of the region from the 3’ splice site of the intron to the polyA site of the transcript. Columns 14–16 – ie_count_[timepoint]: count of intron-exon junction reads for each of the labeling periods (summed across three replicates per labeling period). Columns 17–19 – ee_count_[timepoint]: count of exon-exon junction reads for each of the labeling periods (summed across three replicates per labeling period). Column 20 – halflife: Half-life of intron computed using the junction dynamic approach. Column 21 – halflife_error: Standard error around the half-life estimate, derived from bootstrapping the half-life across subsampled populations of reads. Column 22 – accuracy: percent of junction reads from unannotated, non-canonical splice sites within the intron
- https://doi.org/10.7554/eLife.32537.014
-
Supplementary file 2
Gene Ontology for mostly intron-defined genes.
Summary output from clusterProfiler for significantly enriched biological process gene ontology categories.
- https://doi.org/10.7554/eLife.32537.015
-
Supplementary file 3
Gene Ontology for mostly exon-defined genes.
Summary output from clusterProfiler for significantly enriched biological process gene ontology categories.
- https://doi.org/10.7554/eLife.32537.016
-
Transparent reporting form
- https://doi.org/10.7554/eLife.32537.017
Download links
A two-part list of links to download the article, or parts of the article, in various formats.
Downloads (link to download the article as PDF)
Open citations (links to open the citations from this article in various online reference manager services)
Cite this article (links to download the citations from this article in formats compatible with various reference manager tools)
The kinetics of pre-mRNA splicing in the Drosophila genome and the influence of gene architecture
eLife 6:e32537.
https://doi.org/10.7554/eLife.32537


