Clathrin coat controls synaptic vesicle acidification by blocking vacuolar ATPase activity
- Max Planck Institute for Biophysical Chemistry, Germany
- Max Delbrück Center for Molecular Medicine, Germany
- University Medical Center Göttingen, Germany
- Sciloop, Germany
- University of Texas Health Science Center at San Antonio, United States
- Kungliga Tekniska Högskolan, Sweden
- Karolinska Institute, Sweden
Figures
Figure 1 with 2 supplements
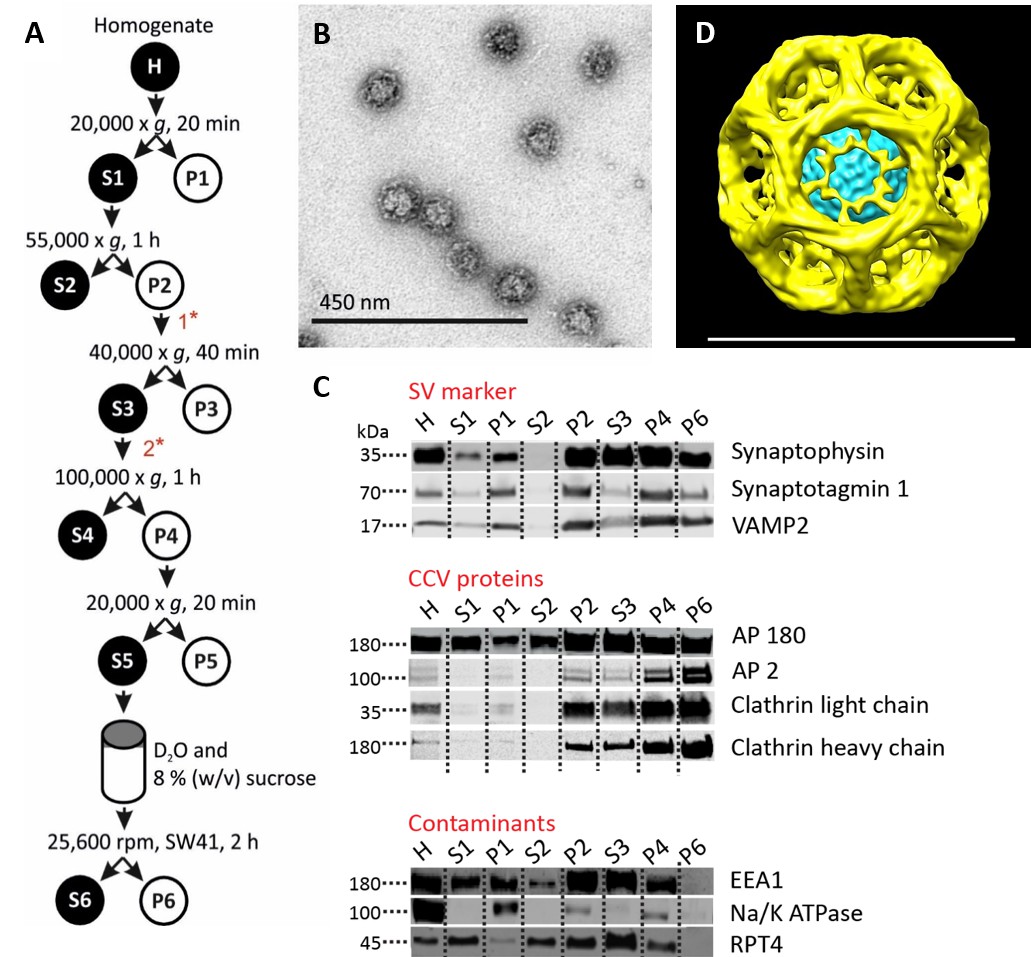
Isolation of clathrin-coated vesicles from mouse brain.
(A) Schema illustrating the isolation procedure of CCVs from mouse brains. Numbers 1 and 2 represent steps where Ficol and sucrose (at final conc. of 6.25 (wt/v)) were added to the sample, and where the sample was diluted 5x with buffer, respectively. See Suppl. Data for details. (B) Electron micrograph of isolated CCVs after negative staining. (C) Immunoblots of fractions collected during the CCV isolation protocol for various marker proteins (proteins were separated at the 4–15% gradient gel and detected by the Li-COR Odyssey imaging system). See also Supplementary file 1 for mass spectrometry analysis of SVs and CCVs samples. (D) Reconstructed CCV from 6114 particles sized up to a diameter of 80 nm, with a D6 symmetry imposed, shows that ex vivo CCVs adopt the same ‘barrel-like’ structure as previously reported, and reveal the position of vesicle in its center (see also Suppl. Data and Figure 1—figure supplement 2). The median values extracted from the reconstruction of clathrin coat and vesicle within the coat are (note that the structure is a barrel): coated vesicle diameter 75 nm x 73.5 nm, coat thickness 15 nm, vesicle diameter 40 × 35 nm.
Figure 1—figure supplement 1
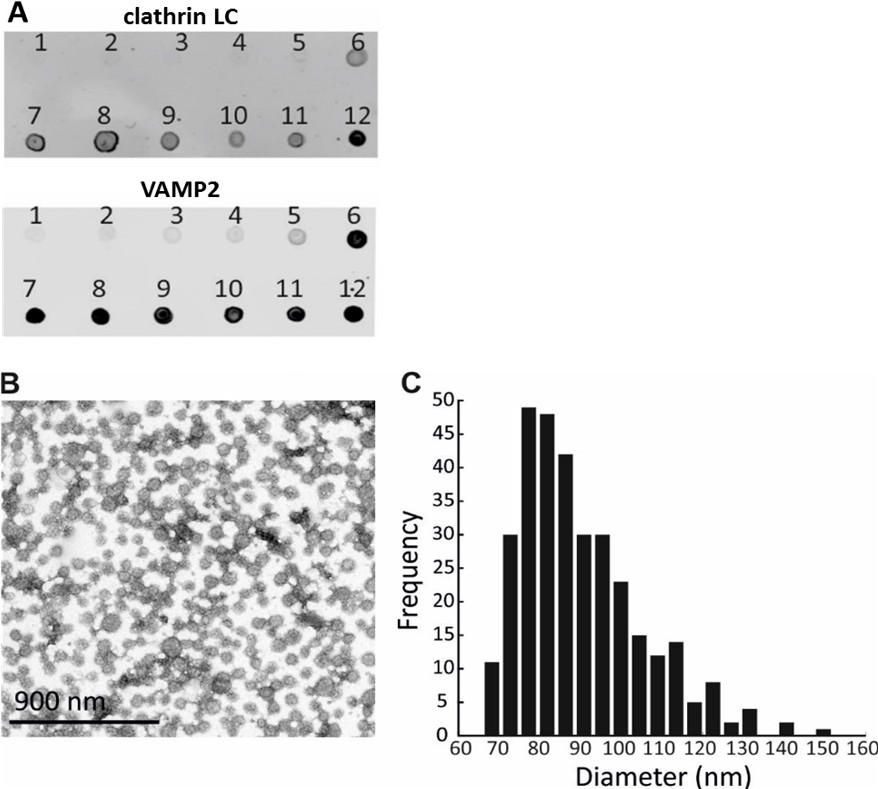
Optimization of a procedure for the CCV isolation from mouse brains, and characterization of CCV size.
(A) Enrichment of CCVs in lower fraction of the sucrose gradient, as detected by clathrin LC and VAMP2 immunoblotting. (B) Electron micrograph of isolated CCVs after negative staining. (C) Histogram representing the distribution of CCV sizes (in nm).
Figure 1—figure supplement 2
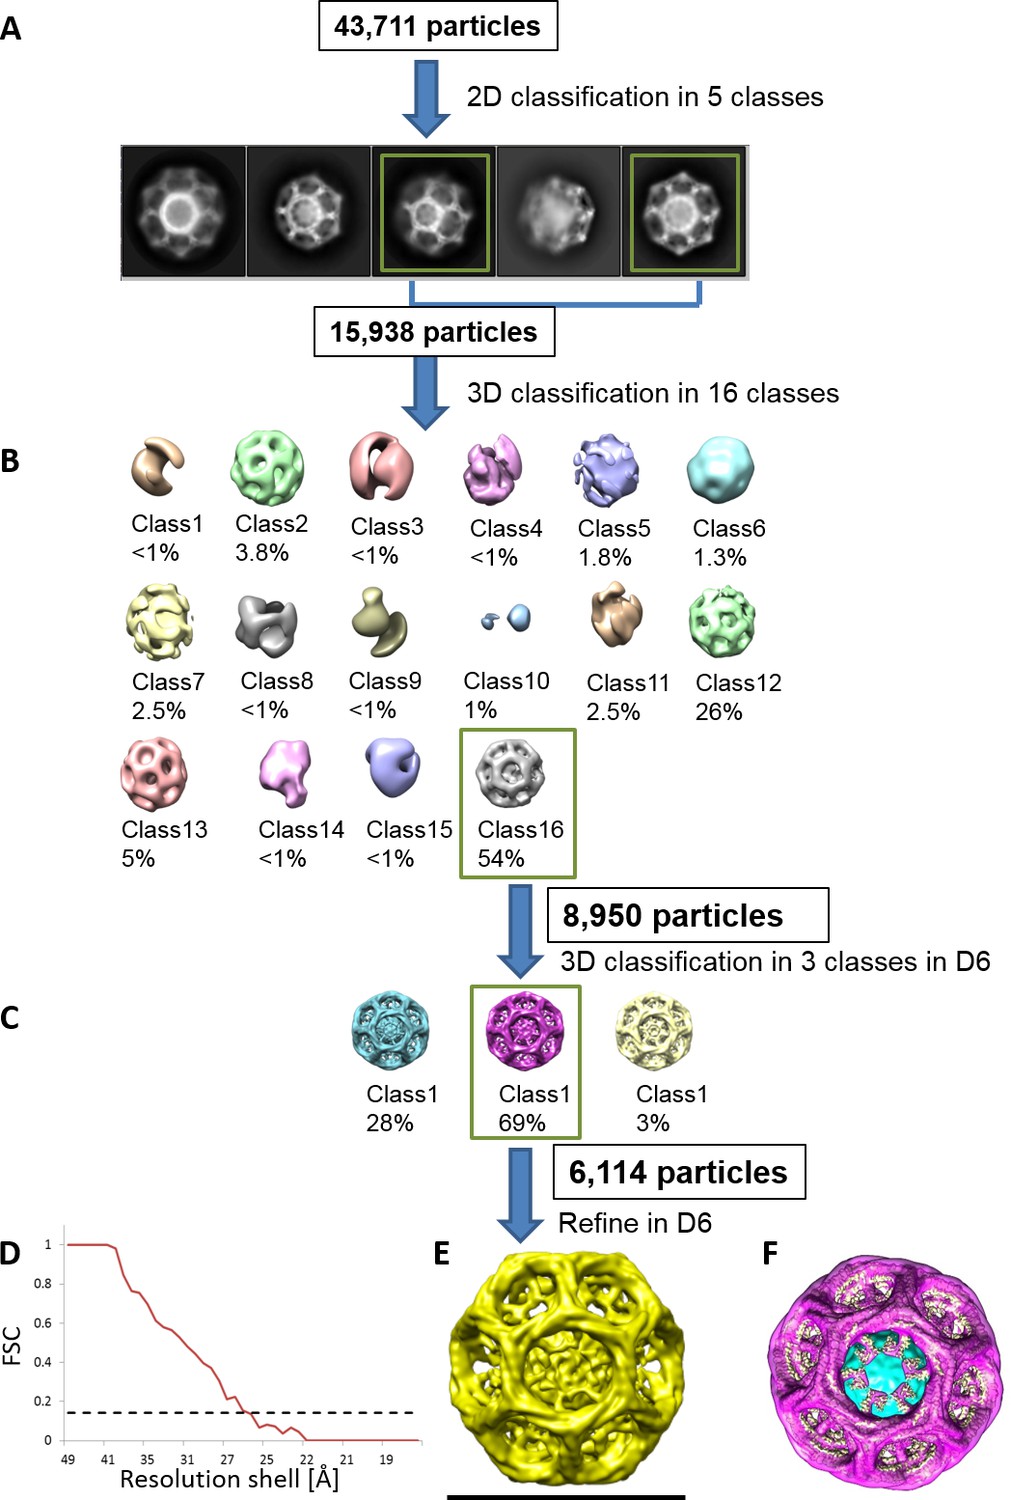
Determining the quality and the properties of clathrin coat of CCVs isolated from mouse brains by cryo-EM.
(A–C) Reconstruction scheme for CCVs isolated from mouse brains by cryo-EM in RELION. (A) 43,711 particles were manually picked and classified into five 2D classes in RELION. The distribution of five classes was as follows: (1) 19.7% (distance 79.3 nm); (2) 17% (distance 62.7 nm); (3) 21.8% (distance 72,5); (4) 26.8% (distance 64 nm); and (5) 14.7% (distance 72.8 nm). From those five classes, we have selected two most abundant classes (classes 3 and 4) for the further processing (due to particle abundance, quality and sizes comparable to the size of previously reported ‘barrel-like’ clathrin coat). The length of each image is 123.5 nm. (B) The selected particles were classified into sixteen 3D classes without any symmetry (=C1) enforced. Of resulting structures, class 16 has the highest population among all classes, and it also exhibits a symmetry that resembles D6. Therefore, we continued with the class #16. (C) Re-classification in 3D of the ‘class #16’ particles from the previous classification. D6 was enforced in the classification this time. We continued again with the highest populated class (class #2). (D–E) The particles from the class 2 of the previous run were chosen for the refinement to calculate the final structure (shown in E). (D) Fourier Shell Correlation (FSC) for the final reconstruction. For the 0.143 Gold Standard FSC criterion (dotted line), the calculated resolution is ~26 Å. (F) The reconstructed particle (shown in purple; deposited with the EMDB-ID #4335) was comparable in size and symmetry to the ‘barrel-like’ empty clathrin cages reported in Fotin et al. (2004) (shown in yellow in F; EMDB-ID 5119).
Figure 2 with 4 supplements
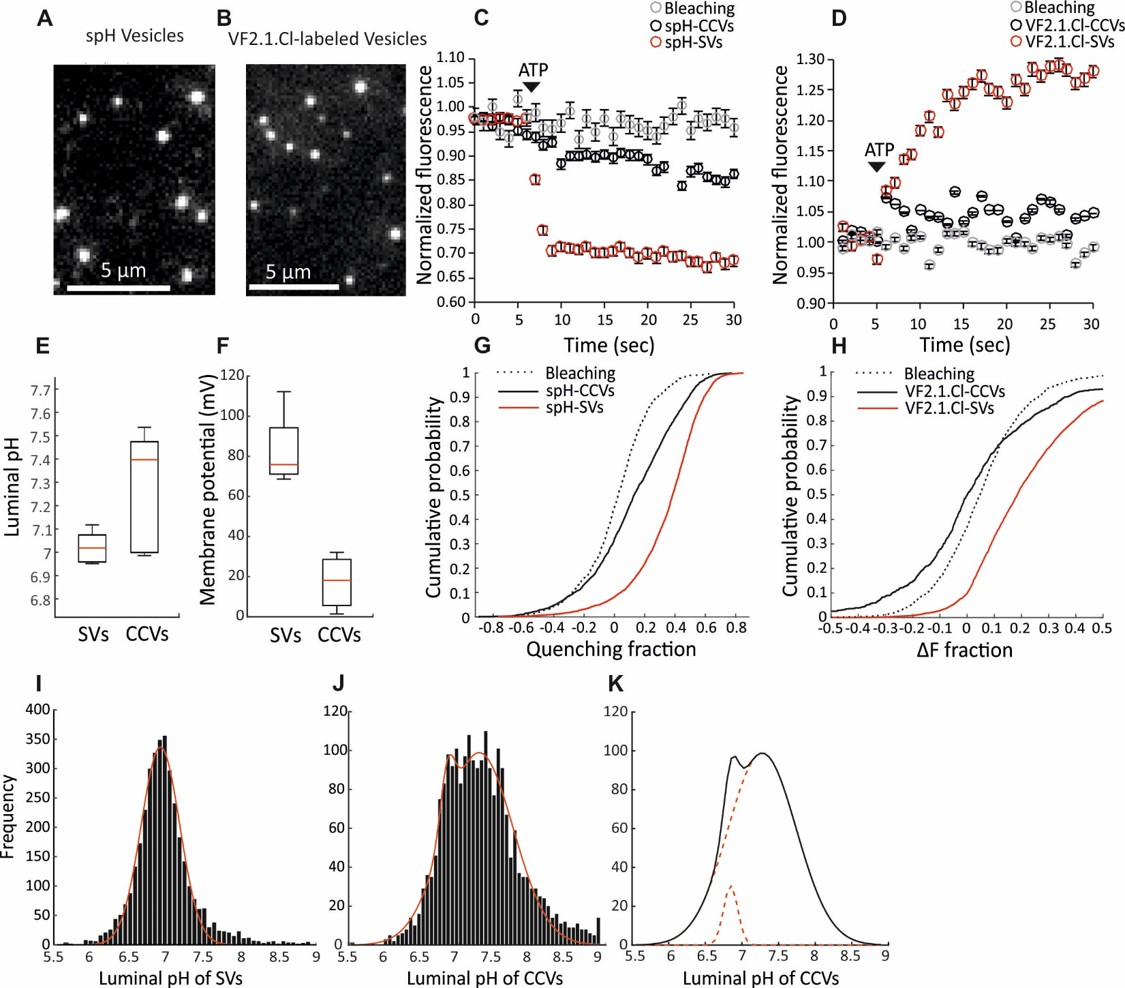
Measurement of the electrochemical gradient in SVs and CCVs.
(A–B) Representative images of single (A) spH-CCVs and (B) VF2.1.Cl-labeled CCVs using TIRF microscopy. (C–D) Averaged fluorescence traces of single (C) spH-SV and spH-CCVs, and (D) VF2.1.Cl-labeled SVs and VF2.1.Cl-labeled CCVs over time in response to ATP. The control traces indicate the fluorescence response of the spH-CCVs or VF2.1.Cl-labeled CCVs over experimental timescale without ATP addition (the same traces were obtained for spH-SVs and VF2.1.Cl-labeled SVs). Error bars indicate SD from more than 1000 vesicles compiled from 4 to 7 experimental replicates. (E) Box plot representation of luminal pH of single SVs and CCVs after addition of 1 mM ATP (box: 1 st and 3rd quartile, line: median, whiskers: the minimum and maximum values). Note that the luminal pH of vesicles equilibrates to 7.4 as shown in Farsi et al. (2016). (F) Box plot representation of membrane potential of single SVs and CCVs after addition of 3 mM ATP. (G–H) Cumulative frequency plots generated from fluorescence change associated with ATP addition in (G) spH-SVs and spH-CCVs, and (H) VF2.1.Cl-labeled SVs and VF2.1.Cl-labeled CCVs. The dotted line indicates the fluorescence response of the probes over experimental timescale without ATP addition. (I–J) Histograms representing the luminal pH of (I) spH-SVs (n = 3,625) and (J) spH-CCVs (n = 2,233) upon addition of 1 mM ATP. Red lines indicate single and two-Gaussian models to SV and CCV populations, respectively. (K) The population of vesicles contributing to the lower pH (likely CCVs with damaged coat and/or very few SVs) in the CCV population consists of about 6% of the total vesicles measured.
Figure 2—figure supplement 1
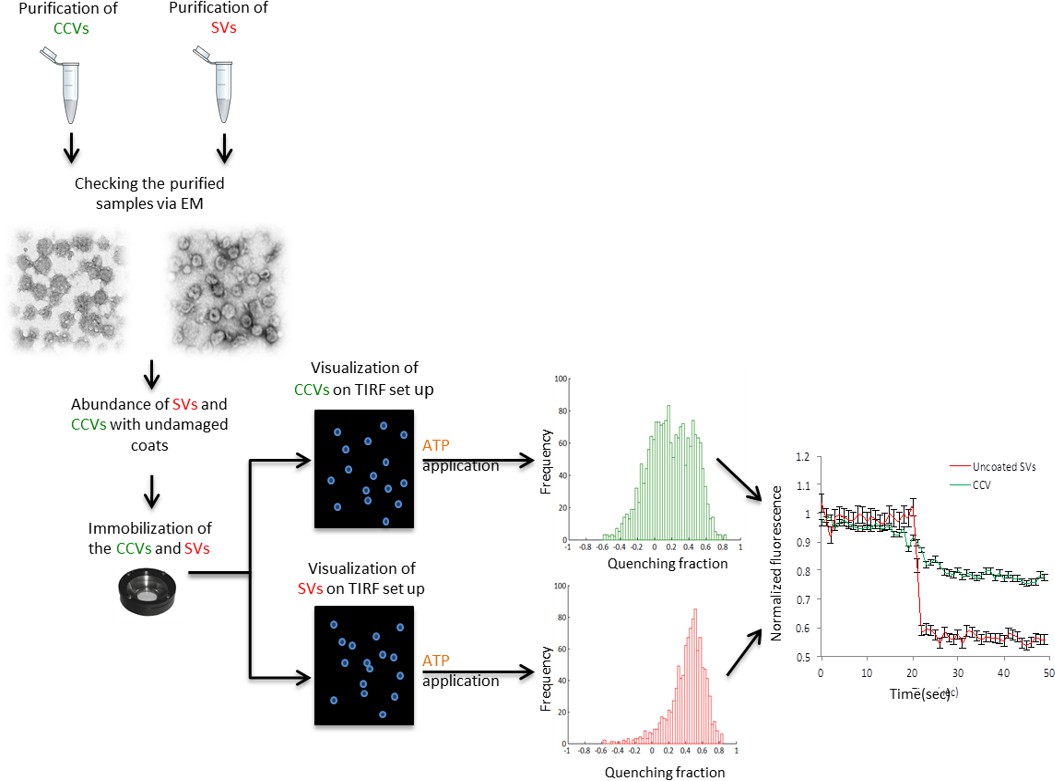
Flow chart of the single vesicle assay for measuring pH and membrane potential of SVs and CCVs.
Isolated SVs and CCVs were separately immobilized on glass coverslips and imaged with a TIRF setup. The fluorescence change of the immobilized vesicles in response to ATP was measured and compared between two samples.
Figure 2—figure supplement 2
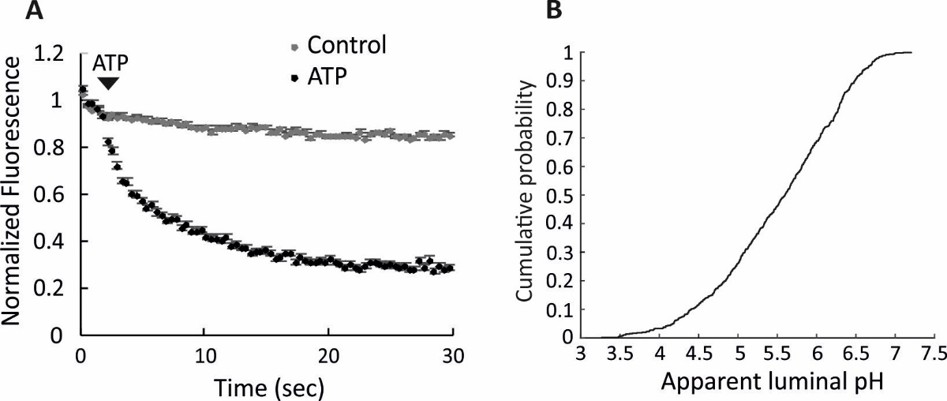
Full acidification of spH-SVs to low luminal pH.
(A) Addition of 3 mM ATP in the presence of 30 mM chloride led to almost 80% quenching of fluorescence in single spH-SVs (black trace). The control trace shows the fluorescence change of spH-SVs in the absence of ATP, indicating that photobleaching was insignificant over experimental timescale. Error bars indicate SEM of more than 500 spH-SVs. (B) Cumulative curve generated from apparent luminal pH of more than 500 spH-SVs at steady state after addition of 3 mM ATP. The average luminal pH of spH-SVs after correction for bleaching was 5.82 ± 0.03 (SEM) indicating full acidification of vesicles in the presence of chloride (Miesenböck et al., 1998).
Figure 2—figure supplement 3
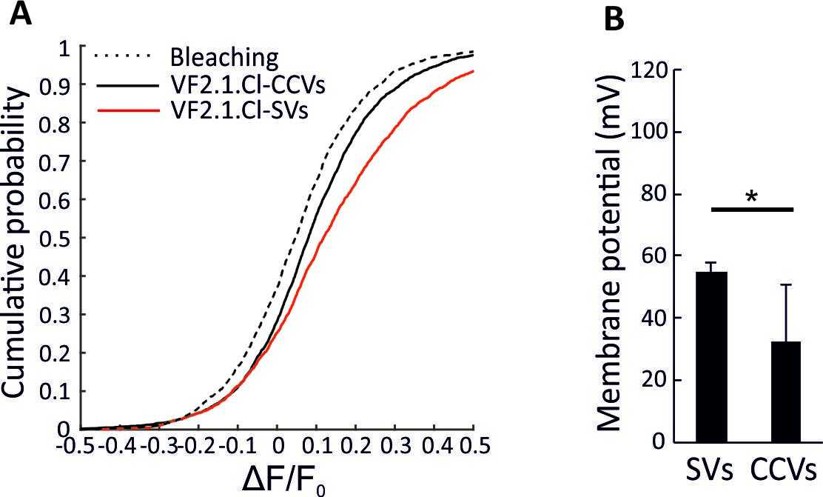
Impairment of acidification in CCVs in the presence of chloride.
(A) Cumulative curve generated from ∆F/F0 in VF2.1.Cl labeled CCVs and SVs associated with addition of 3 mM ATP in the presence of 20 mM TEA.Cl in the bath solution. The control trace shows the fluorescence change of VF2.1.Cl-labeled CCVs over experimental timescale without ATP addition (the same trace was obtained for spH-SVs and VF2.1.Cl-labeled SVs) (B) Averaged membrane potential in single VF2.1.Cl-labeled CCVs and SVs upon addition of 3 mM ATP in the presence of 20 mM TEA.Cl in the bath solution. As expected, smaller membrane potential was formed across the membrane of SVs in the presence of chloride (∆ψ = 55.02 ± 2.63 (SD)) in response to 3 mM ATP. However, the magnitude of ∆ψ was significantly smaller in CCVs (p=0.04), indicating that the impairment of acidification in CCVs shown in Figure 2 is not due to the absence of chloride. Error bars indicate SD of 4 experimental replicates.
Figure 2—figure supplement 4
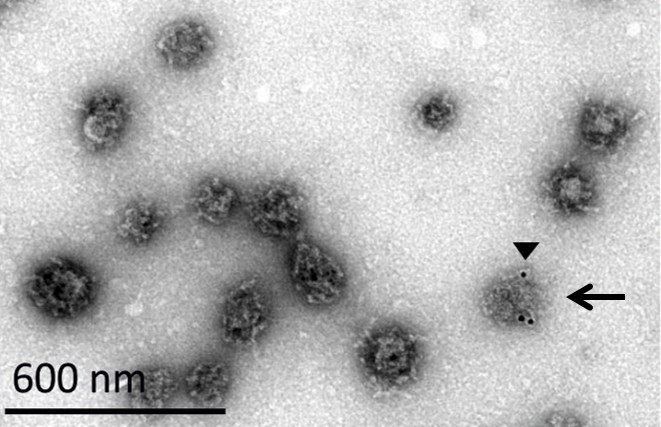
EM image of a CCV with a damaged coat.
A CCV with a damaged coat is marked with a black arrow. We noticed that upon immuno-gold labeling against clathrin heavy chain (black arrowhead), the antibody can recognize better the vesicles whose coat was damaged, possibly due to better availability of the epitope in a partially disassembled vesicles.
Figure 3 with 2 supplements
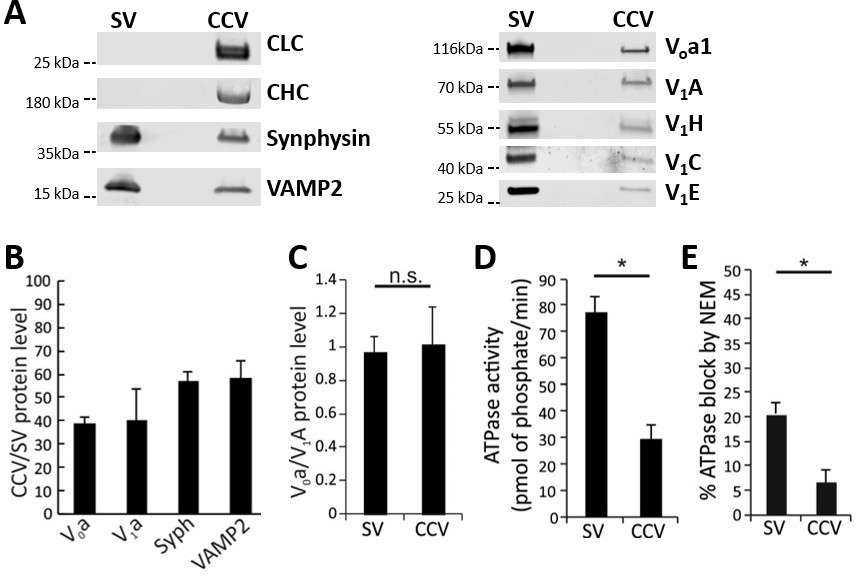
Functional analysis of the vATPase on CCVs.
(A) Immunoblots of isolated SVs and CCVs for the clathrin light (LC) and heavy chains (HC), and SV marker proteins synaptophysin (Syph) and VAMP2 (left panel), as well as various Vo and V1 subunits of vATPase (right panel). (B) The ratio of the Vo and V1 as well as synaptophysin and VAMP2 (as SV markers) detected by immunoblotting in equal protein amount of CCVs and SVs (C) Normalized levels of Vo and V1 in CCV and SV samples, indicating that Vo:V1 ratio is 1:1 in both preparations. (D) ATPase activity measured in 1.3 µg of isolated SVs and CCVs. (E) Blocking percentage of ATPase activity by NEM (vATPase inhibitor) in 1.3 µg of SVs and CCVs. Error bars in (B–E) represent SD of 3–4 experimental replicates (p<0.01 for D and E, and >0.05 for C).
Figure 3—figure supplement 1
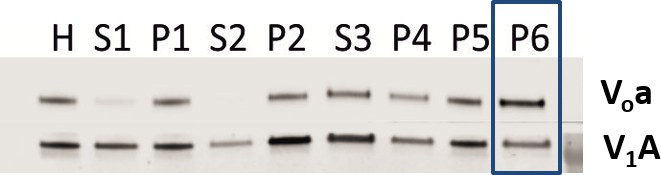
Both Vo and V1 subunits are present on CCVs.
Immunoblot for Voa and V1A subunits indicate presence of subunits during the CCV isolation procedure.
Figure 3—figure supplement 2
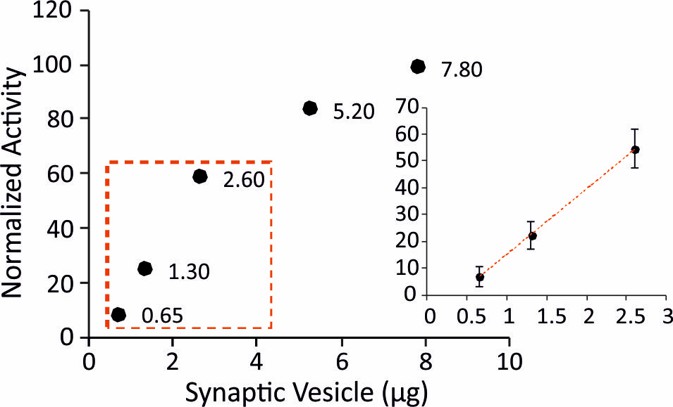
ATPase activity measurements in isolated SVs.
To make sure that the measured ATPase activity is within the standard curve range of the used kit, we tested different amounts of isolated SVs. The measurements of ATPase activity were then performed with 1.3 µg of SVs and CCVs which is in the liner range (inset).
Figure 4 with 2 supplements
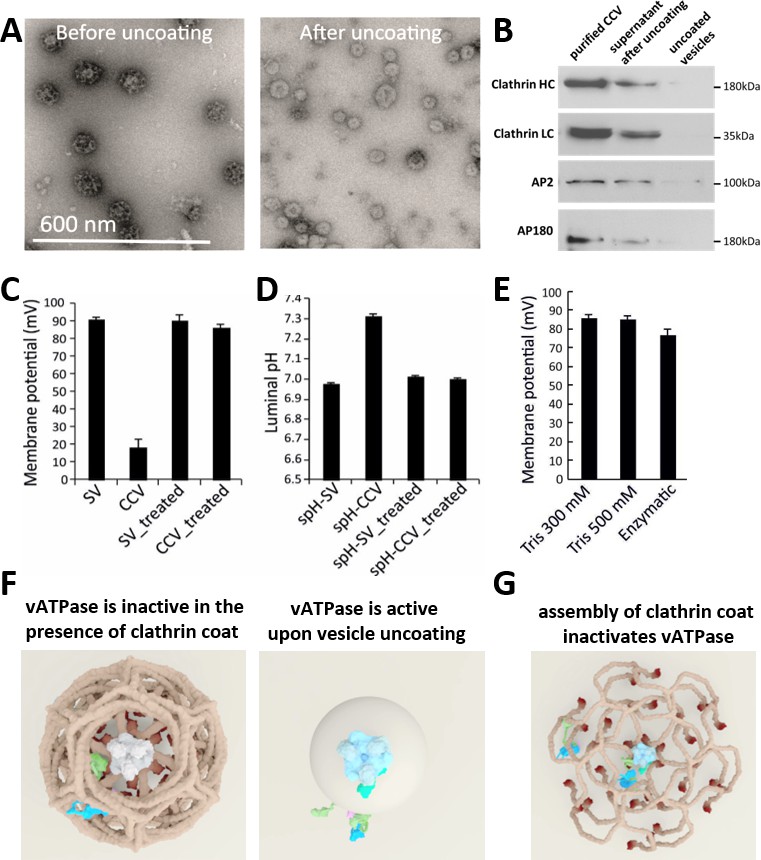
CCV uncoating revealed that the vATPase is blocked by clathrin coat.
(A) Electron micrographs of negatively stained CCVs before and after uncoating with 300 mM Tris-buffer pH 9.0. (B) Western blot of CCVs, uncoated vesicles and supernatant after uncoating shows dissociation of clathrin LC and HC, as well as AP180 and AP2, from the uncoated vesicle (proteins were separated at the 10% gel and detected by chemiluminescence). (C–D) Membrane potential (C) and luminal pH (D) of acidified SVs and CCVs before and after treatment with Tris-buffer (pH 9.0). Error bars represent SD of 3–4 experimental replicates done on over 1000 vesicles each. (E) Membrane potential of acidified CCVs after treatment with 300 mM Tris-buffer (pH 9.0), 500 mM Tris buffer (pH 7.0) and ‘enzymatic’ treatment with 1.7 µg auxilin, 4.8 µg Hsc70 and 1.7 µg Hsp110 proteins. Error bars represent SD of 3 experimental replicates done on over 1000 vesicles each. (F–G) Model of vATPase block by clathin coat: solved structures of vATPase, clathrin tripods and AP2 complex were used to check how vATPase fits within the clathrin lattice. The plasma membrane is depicted in light beige, clathrin triskelia in dark beige/brown; vATPase complex in gray (when inactive), light blue (when active) and dark green (V1H-subunit); AP2 complex in purple/blue/light green. As clathrin triskelia are recruited (through AP2), clathrin ring starts building around the vATPase complex. Insertion of the last triskelion of the clathrin ring would collide with the regulatory V1H-subunit of vATPase (G), thus we hypothesize that the displacement of regulatory V1H-subunit inwards results in the block of the vATPase activity. For more details, see Suppl. Data.
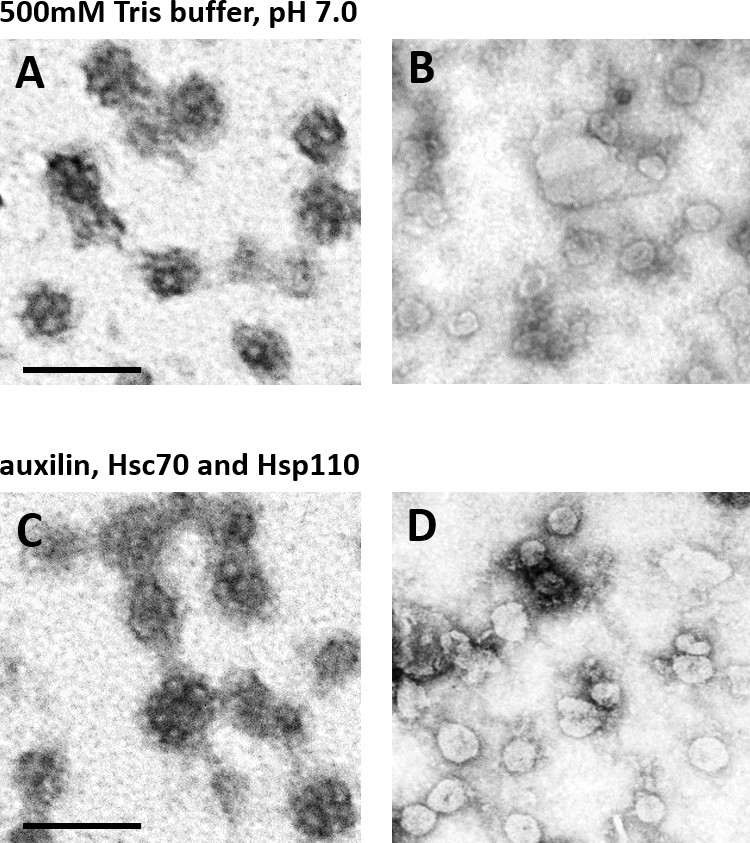
Figure 4—figure supplement 1
CCV uncoating revealed that the vATPase is blocked by clathrin coat.
(A–B) Electron micrographs of negatively stained CCVs before (A) and after (B) uncoating with neutral 500 mM Tris-buffer (pH 7.0). (C–D) Electron micrographs of negatively stained CCVs before (C) and after (D) uncoating with auxilin, Hsc70 and Hsp110. For experimental details, see Methods. Scale bar 100 nm.
Figure 4—figure supplement 2
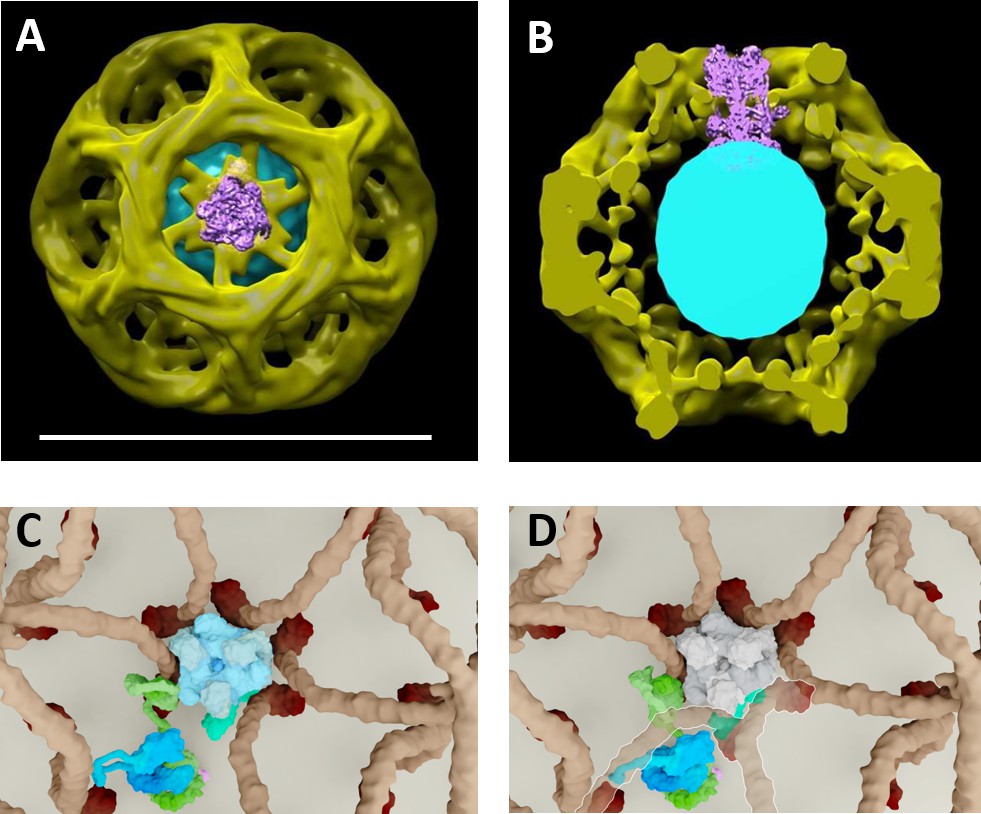
Proposed model of vATPase block by clathin coat.
(A–B) Molecular modelling experiments where the cryo-EM structure of the vATPase complex (from Zhao et al., 2015) was docked into our cryo-EM structure of CCV (A top view, the coat is made slightly transparent; B cross-section through the reconstructed CCV – for details see Figure 2—figure supplement 3). (C–D) Solved structures of vATPase, clathrin tripods and AP2 were used to show how vATPase may fit within the clathrin lattice. The plasma membrane is depicted in light beige, clathrin triskelia in dark beige/brown; vATPase complex in gray (when inactive), light blue (when active) and dark green (V1H-subunit); AP2 complex in purple/dark blue/light green. (C) As clathrin triskelia are recruited (through AP2), clathrin ring starts building around the vATPase complex. (D) Insertion of the last clathrin triskelion of clathrin ring would collide with the regulatory V1H-subunit of vATPase, thus we hypothesize that the displacement of regulatory V1H-subunit inwards, in order to accommodate the vATPase complex into the hexagon of the CCV lattice. For more details, see Supplementary Movies.
Author response image 1
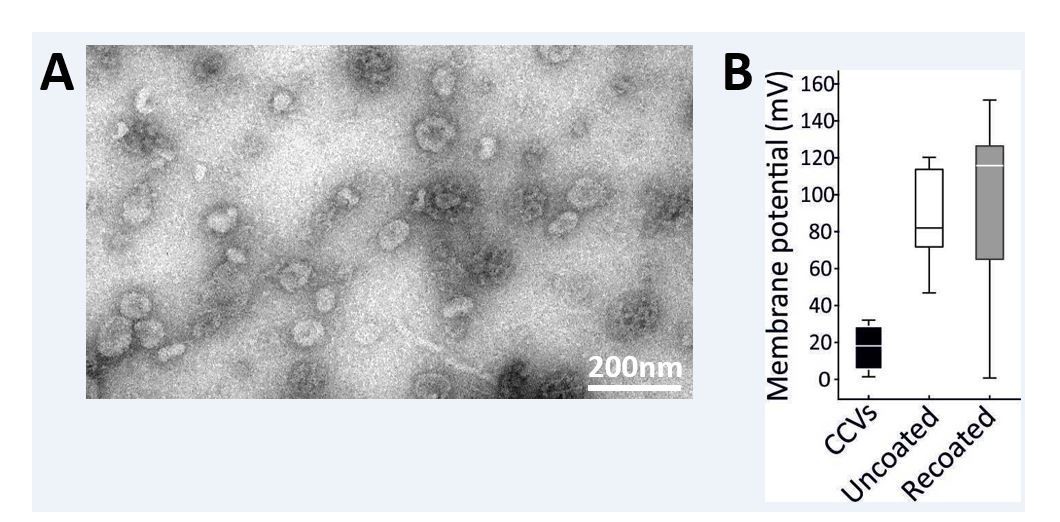
Partial recoating of previously uncoated CCVs was not robust enough to produce a significant difference in acidification assay.
(A) Electron micrographs of negatively stained sample after the vernight “recoating” treatment as detailed in Materials and methods. While coat formation sometimes occurs without the vesicle at its center, several vesicles surrounded by a new coat are clearly seen (indicated by a white arrow). Scale bar 200 nm. (B) Membrane potential of acidified vesicles after the overnight “recoating” treatment Error bars represent SD of 3 experimental replicates.
Author response image 2
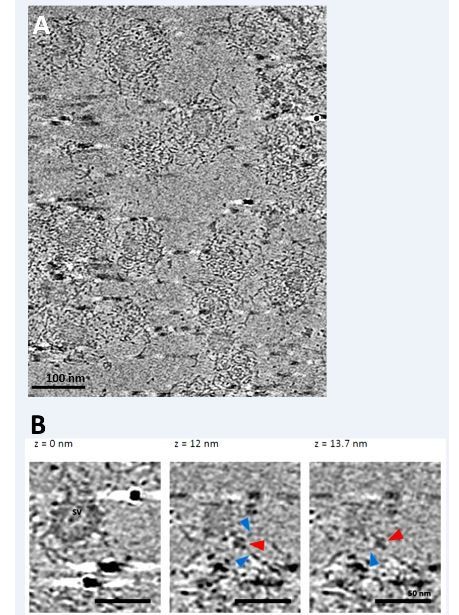
Cryo-electron tomography on partially uncoated CCVs reveals that clathrin coat-vATPase interactions exist.
(A) Electron micrographs of partially uncoated CCVs (in tightly packed CCVs, vATPase could not be detected). (B) Zoomed image of two vesicles at different views, as indicated. Red arrowhead points presumably to vATPase, blue arrowheads to clathrin filaments. See cryo-electron tomography Video for a better view.
Videos
Video 1
Reconstructed clathrin-coated vesicle from 6114 raw cryo-EM images of coated vesicle sized up to 80 nm, with D6 symmetry imposed.
https://doi.org/10.7554/eLife.32569.005
Video 2
Animated 3D model of vATPase block by clathin coat (top view).
Note that all animations show the same process seen from different camera positions. Solved structures of vATPase, AP2 complex and clathrin tripods were used to see how vATPase fits within the clathrin lattice, thus all proteins have their ‘true’ dimensions. The plasma membrane is depicted in light beige, clathrin triskelia in dark beige/brown; vATPase complex in gray (when inactive), light blue/gray/dark green (when active; dark green = V1H-subunit), AP2 complex in purple/blue/light green. The plasma membrane starts as a flat surface on which the clathrin triskelia begin forming the ring formation around the vATPase (in clockwise direction). Only two AP2 complexes are depicted: upon cargo (yellow) binding, the AP2 complex alters its structure and recruits clathrin triskelia that start the formation of a clathrin ring around the vATPase. For the clathin ring to be ‘closed’, the ‘last’ triskelion to be inserted into the ring collides (gets in direct contact) with the vATPase, namely its regulatory V1H-subunit. We hypothesize that the regulatory V1H-subunit needs to be displaced inwards, resulting in the inhibition of the stalk rotation and thus block of the vATPase activity. So, upon insertion of the last triskelion in the clathrin ring, the vATPase becomes inactive (shown by a loss of color). The mechanical work of the clathrin coat proteins results in the membrane being pulled in, and as vesicle formation progresses, more clathrin triskelia are added. After vesicle is endocytosed, the clathrin coat disassembles (i.e. clathrin and adaptor proteins dissociate from the newly-formed vesicle), and the vATPase becomes active again. For more details, see Construction of the animated 3D model in the Supplementary Methods. A detailed (zoomed) view of regulatory V1H-subunit displacement is shown in Video 4.
Video 3
Animated 3D model of vATPase block by clathin coat (side view).
Note that all animations show the same process seen from different camera positions). For details, see legend to Video 2.
Video 4
Animated 3D model of vATPase block by clathin coat (front view).
Note that all animations show the same process seen from different camera positions. Here, detailed view of vATPase at the level of plasma membrane is shown (overview of the endocytic vesicle formation is shown in the Videos 2 and 3). Note that the time duration of the breaks between the vATPase rotation cycles has been shortened to better illustrate the vATPase activity. Upon binding cargo protein, the nearby AP2 complex alters its structure and recruits clathrin triskelia. Clathrin ring starts to be built around the vATPase complex (only terminal domain, linker, ankle and a part of distal segment can be seen in this view): the insertion of the last clathrin triskelion in the ring displaces the V1H-subunit of the vATPase. For more details, see Construction of the animated 3D model in the Supplementary Methods. After the vesicle is formed and endocytosed, the clathrin coat disassembles, and the vATPase subunits instantly resume ‘original positions’, bringing the vATPase in the active state again.
Tables
Table 1
Antibodies used in this study.
https://doi.org/10.7554/eLife.32569.020| Antibody | Characteristics | Producer |
|---|---|---|
| ATP6V1A | NBP1-33021 Polyclonal | Novus-Biologicals |
| ATP6V1H | Ab187706 Polyclonal | Abcam |
| ATP6V1C1 | Ab87163 Polyclonal | Abcam |
| ATP6V1E1 | Ab111733 Polyclonal | Abcam |
| AP-2 | A2730 Monoclonal | Abcam |
| AP-180 | 155002 Polyclonal | Synaptic Systems (SySy) |
| Clathrin-heavy chain (HC) | Ab2731 Monoclonal | Abcam |
| Clathrin-light chain (LC) | Ab9884 Polyclonal | EMD-Millipore |
| EEA1 | PA1-063A Polyclonal | ThermoFischer Scientific |
| Na+/K+ ATPase | Ab7671 Monoclonal | Abcam |
| RPT4 (PMSF) | Ab14715 Monoclonal | Abcam |
| Proton ATPase (116 kDa subunit) | 109003 Polyclonal | Synaptic Systems (SySy) |
| Synaptotagmin-1 | 105 011 Monoclonal | Synaptic Systems (SySy) |
| Synaptophysin-1 | 101 011 Monoclonal | Synaptic Systems (SySy) |
| Synaptobrevin-2/VAMP-2 | 104 211 Monoclonal | Synaptic Systems (SySy) |
| anti-mouse IgG (IR680) | P/N 925–68070 | LI-COR |
| anti-rabbit IgG (IR800) | P/N 926–32211 | LI-COR |
| anti-mouse IgG (H + L) HRP | 62–6520 | ThermoFischer Scientific |
| anti-rabbit IgG (H + L) HRP | 65–6120 | ThermoFischer Scientific |
Additional files
-
Supplementary file 1
Proteins identified from SV and CCV preparations by mass spectrometry.
20 µg protein from SV and CCV preparations were assayed by Q Exactive Mass Spectrometer (Thermo Scientific). MS/MS spectra were searched against an IPI mouse database (IPI, Mouse v3) with the ProteinPilot software (Applied Biosystems, USA). Common proteins from two trials are displayed. The identified vATPase (both Vo and V1) subunits are labelled in brown.
- https://doi.org/10.7554/eLife.32569.021
-
Transparent reporting form
- https://doi.org/10.7554/eLife.32569.022
Download links
A two-part list of links to download the article, or parts of the article, in various formats.
Downloads (link to download the article as PDF)
Open citations (links to open the citations from this article in various online reference manager services)
Cite this article (links to download the citations from this article in formats compatible with various reference manager tools)
Clathrin coat controls synaptic vesicle acidification by blocking vacuolar ATPase activity
eLife 7:e32569.
https://doi.org/10.7554/eLife.32569


