Energy exchanges at contact events guide sensorimotor integration
- Northwestern University, United States
- Rehabilitation Institute of Chicago, United States
- Italian Institute of Technology, Italy
- Ben-Gurion University of the Negev, Israel
Figures
Figure 1
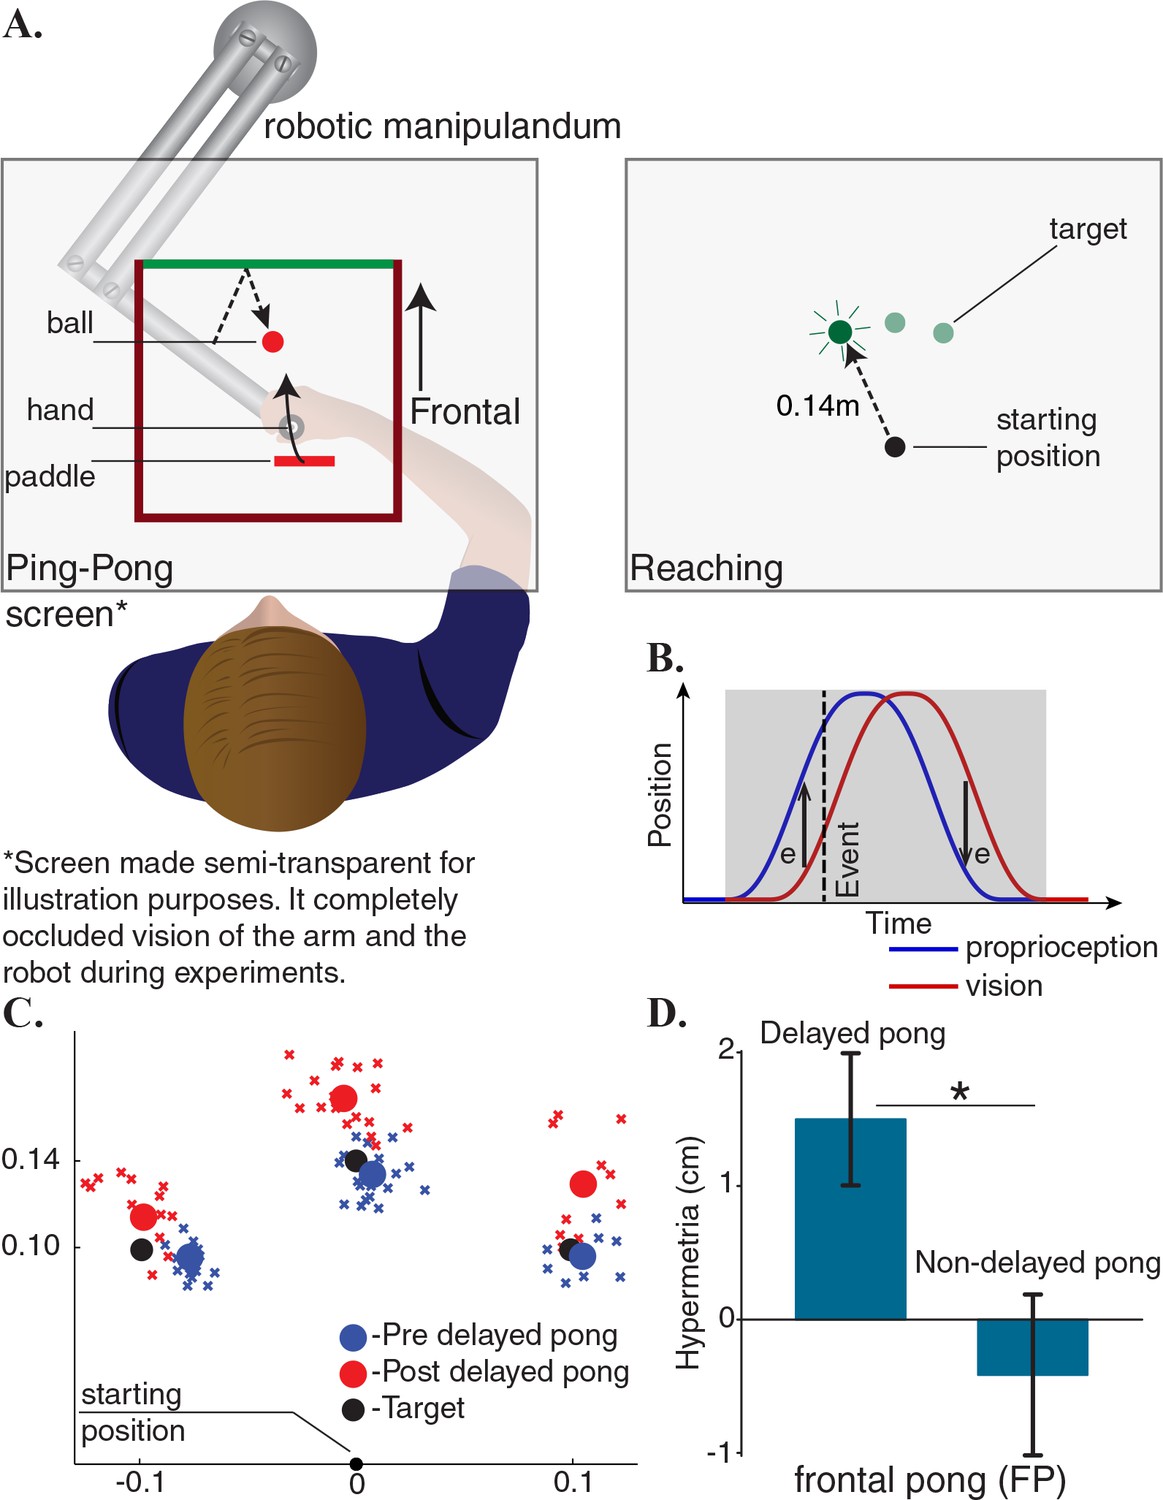
Adaptation to delayed feedback in a ping-pong game influences reaching behavior.
(A) Subjects played a planar pong game in frontal direction using a robotic manipulandum. In addition to continuous visual feedback, auditory and tactile feedbacks were provided simultaneously upon collisions with the ball. After few minutes of familiarization, the game’s response to the player’s movements was delayed and subjects continued playing the game in the delayed environment. Participants also performed reaching movements without any continuous or terminal feedback before and after playing the pong. Objects and labels in black were not visible to the subjects. (B) A cartoon of the changes in the hand position during a reciprocal movement in the pong game and its delayed representation. If sensory integration occurs continuously, then the reaching trajectories should remain unchanged after adaptation because the difference between visual and proprioceptive information integrates to zero. However, if sensory integration occurs only at collisions, this should result in predictable changes in the terminal position of the reaching movements depending on the sensory measurements at collisions. (C) The endpoints of the reaching movements of a typical subject before and after adaptation. (D) All subjects showed hypermetria in the reaching movements after adaption. The hypermetria was absent in a subgroup who additionally did the same experiment without the delay. Error bars represent one standard error of the mean.
Figure 2
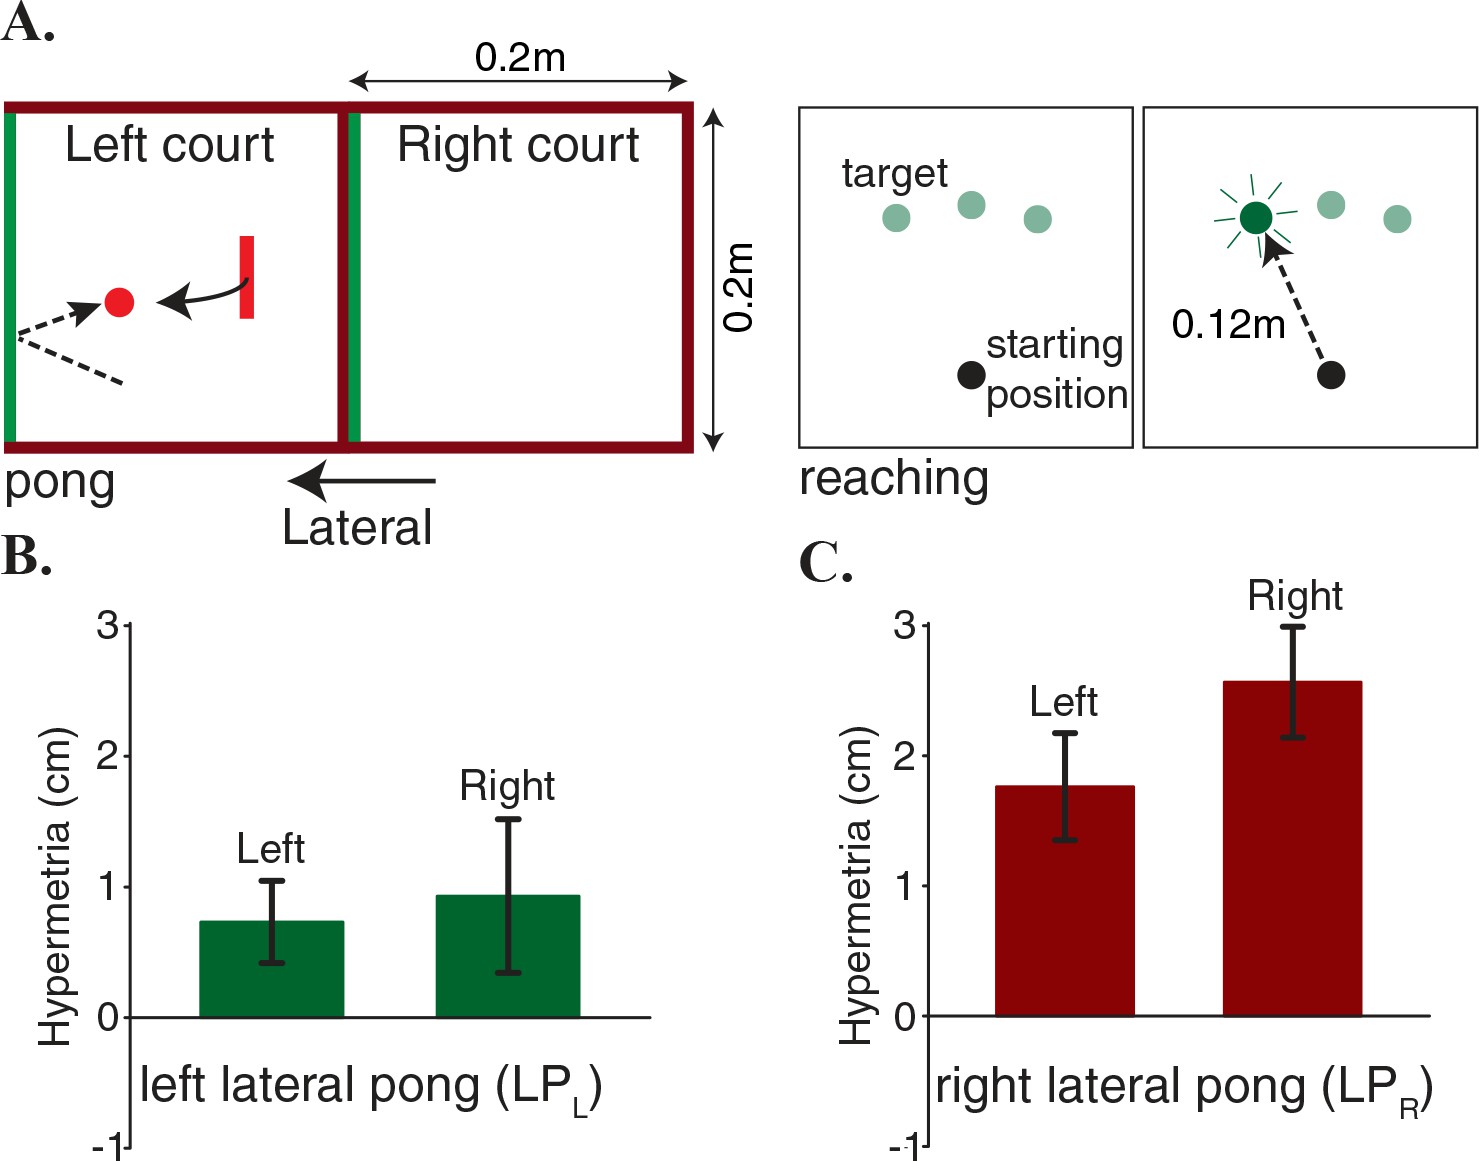
Hypermetria in reaching depends on the dynamics of the pong.
(A) Two separate groups of subjects played a lateral pong with delay. Each group adapted to the delay only in one of the two courts that were placed next to each other. Both groups performed blind reaching movements before and after adaption from starting positions on the two sides of the body midline. Objects and labels in black were not visible to the subjects. (B) Subjects on the left court showed a very small average hypermetria on both sides. (C) Subjects on the right court showed a large average hypermetria on the right side that generalized to a lesser extent to the left side. Error bars represent one standard error of the mean.
Figure 3
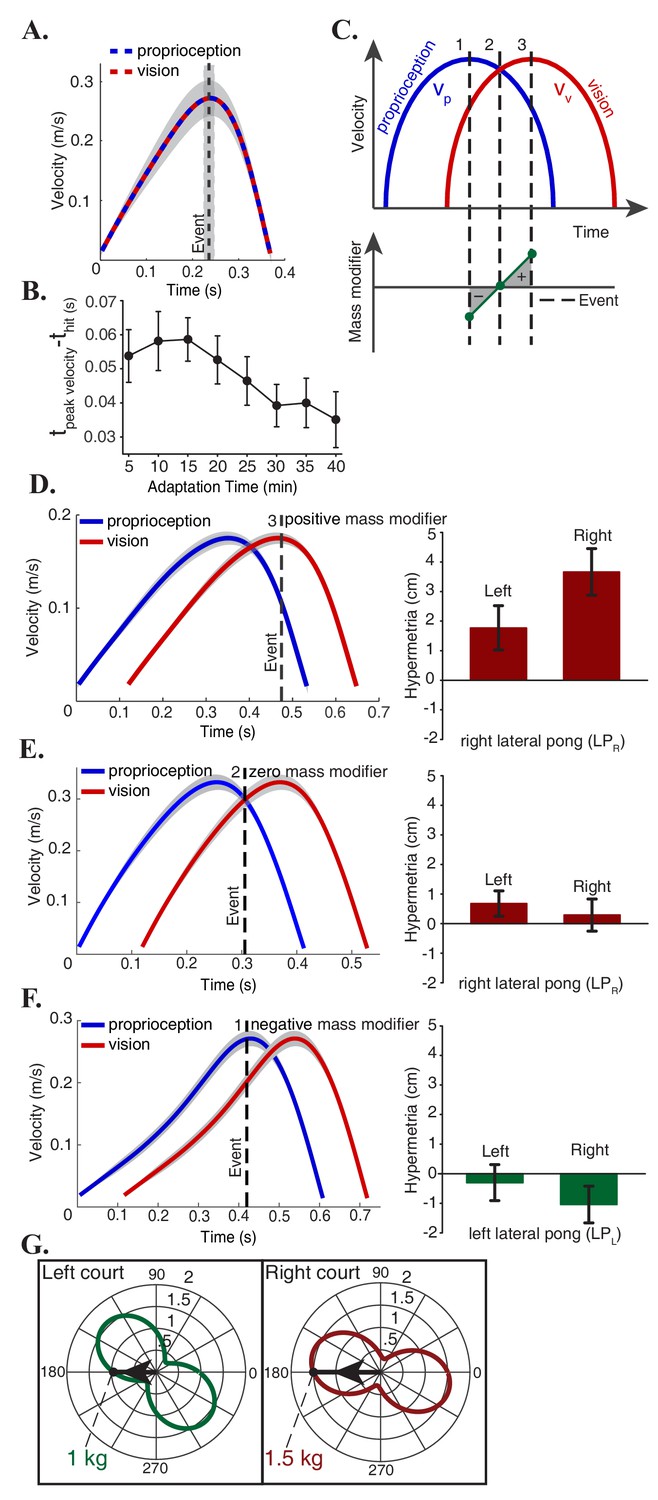
Mass modifier explains individual and group differences.
(A) Subjects optimized the energetic cost of their movements in the non-delayed pong game by hitting the ball at the peak velocity of the paddle. (B) In adaptation trials, there was a continuous effort towards recovering the energy optimal policy by reducing the difference between the time of the peak velocity of the paddle and the time of the impact (C) In the delayed pong, visual and proprioceptive measurements were different at the time of collisions. Hence, sensory integration at events caused a misperception of the paddle’s mass. Mass modifier is the difference between the actual mass and the perceived mass. Depending on the timing of the hits, the mass modifier can have three categorical values: a hit around leads to a negative mass modifier (), a hit at () makes the mass modifier to be zero and for a hit around (), the mass modifier is positive. (D-F) Left panels show the average velocity profile of the hand and the paddle during the last five minutes of adaptation for three individual subjects, one from each possible outcome category. The vertical dashed line represents the average time of the hit in the pong game. Right panels show the adaptation effects on the reaching movements. Error bars represent one standard error of the mean. These results are consistent with the hypothesis that mass estimation occurs at discrete events. (G) Effective mass of the manipulandum in each direction. Each plot is centered on the average position of the hits for the corresponding group. Subjects in the LPR group played with a heavier paddle than the LPL group. In addition, the mass modifier is proportional to the mass of the paddle itself. Gray areas represent 95% confidence intervals.
Figure 4
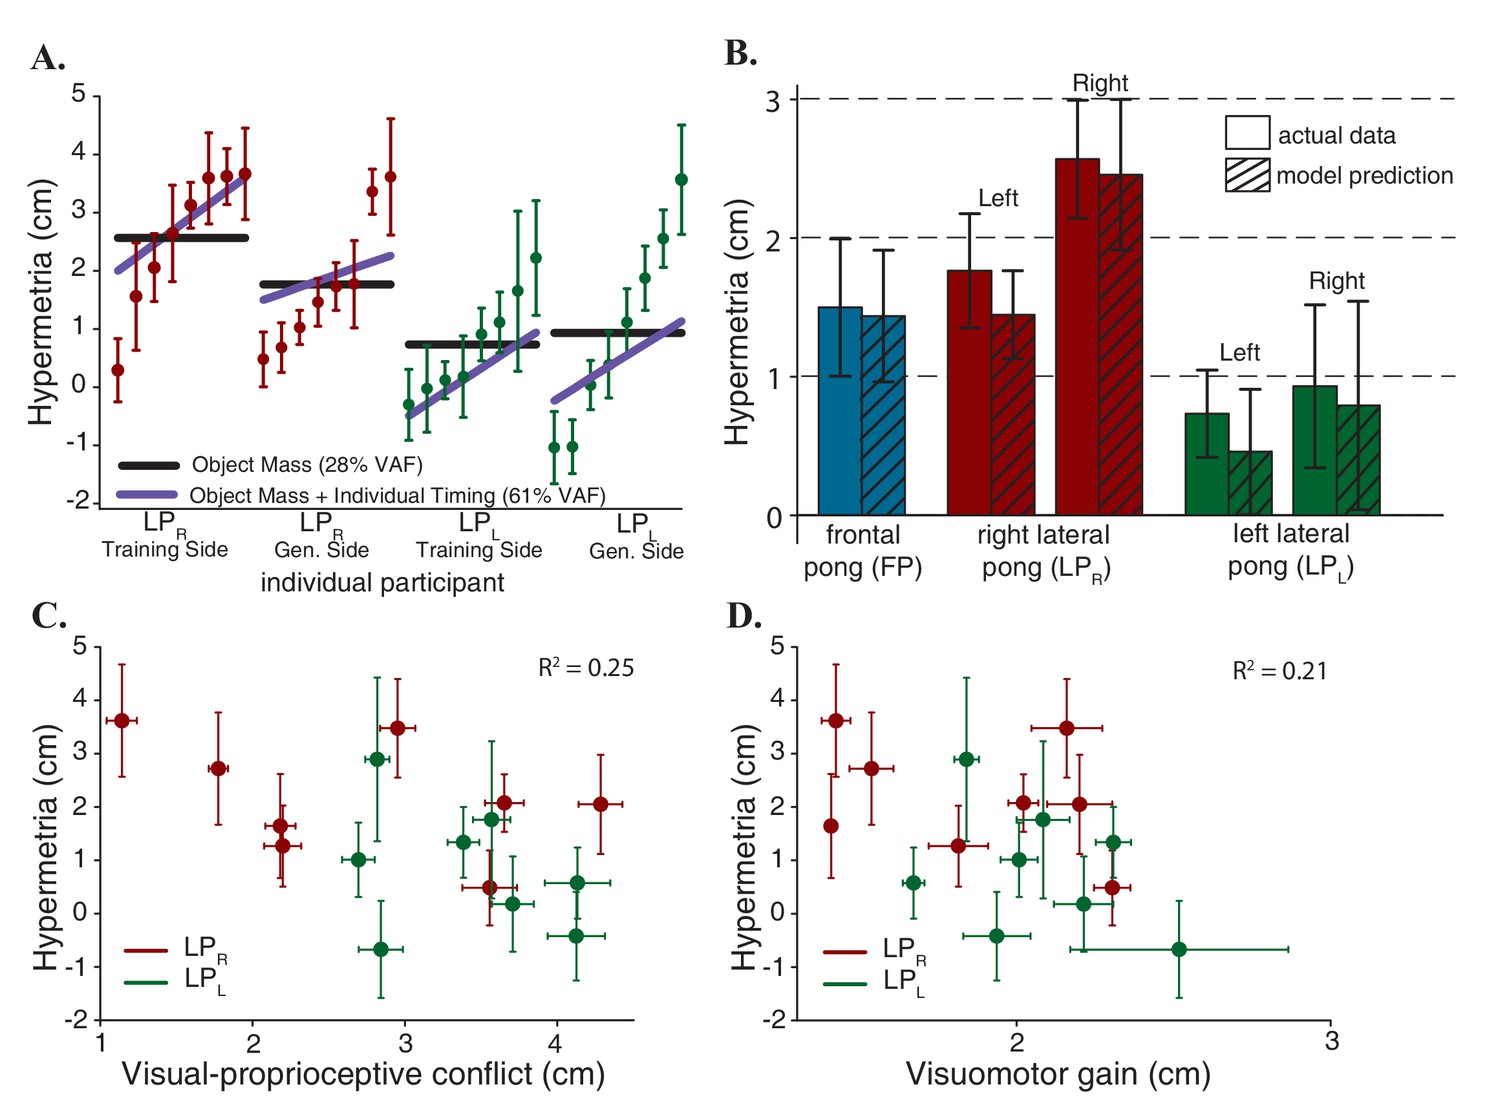
Model predictions.
(A) Contribution of each component of the model. The scatter plots show the average hypermetria for all the subjects in lateral pong groups on both sides that are sorted based on the magnitude of the hypermetria. Error bars represent 95% confidence interval. Solid black lines represent predictions based solely on the changes in the object mass. Solid purple lines represent predictions based on the changes in the object mass and the individual timing behavior. (B) Model Predictions for all subjects in all three experimental groups. (C) Hypermetria in the reaching movements as a function of average mismatch between sensory measurements at the time of the hits. The absence of correlation indicates that the hypermetria is not caused by proprioceptive recalibration. Error bars represent 95% confidence interval. (D) Hypermetria in the reaching movements as a function of average visuomotor gain experienced during the pong game. The absence of correlation indicates that the hypermetria is not due to adaptation to a scaling perturbation. Error bars represent 95% confidence interval.
Additional files
-
Transparent reporting form
- https://doi.org/10.7554/eLife.32587.006
Download links
A two-part list of links to download the article, or parts of the article, in various formats.
Downloads (link to download the article as PDF)
Open citations (links to open the citations from this article in various online reference manager services)
Cite this article (links to download the citations from this article in formats compatible with various reference manager tools)
Energy exchanges at contact events guide sensorimotor integration
eLife 7:e32587.
https://doi.org/10.7554/eLife.32587


