Simultaneous two-photon imaging and two-photon optogenetics of cortical circuits in three dimensions
- Columbia University, United States
Figures
Figure 1 with 4 supplements
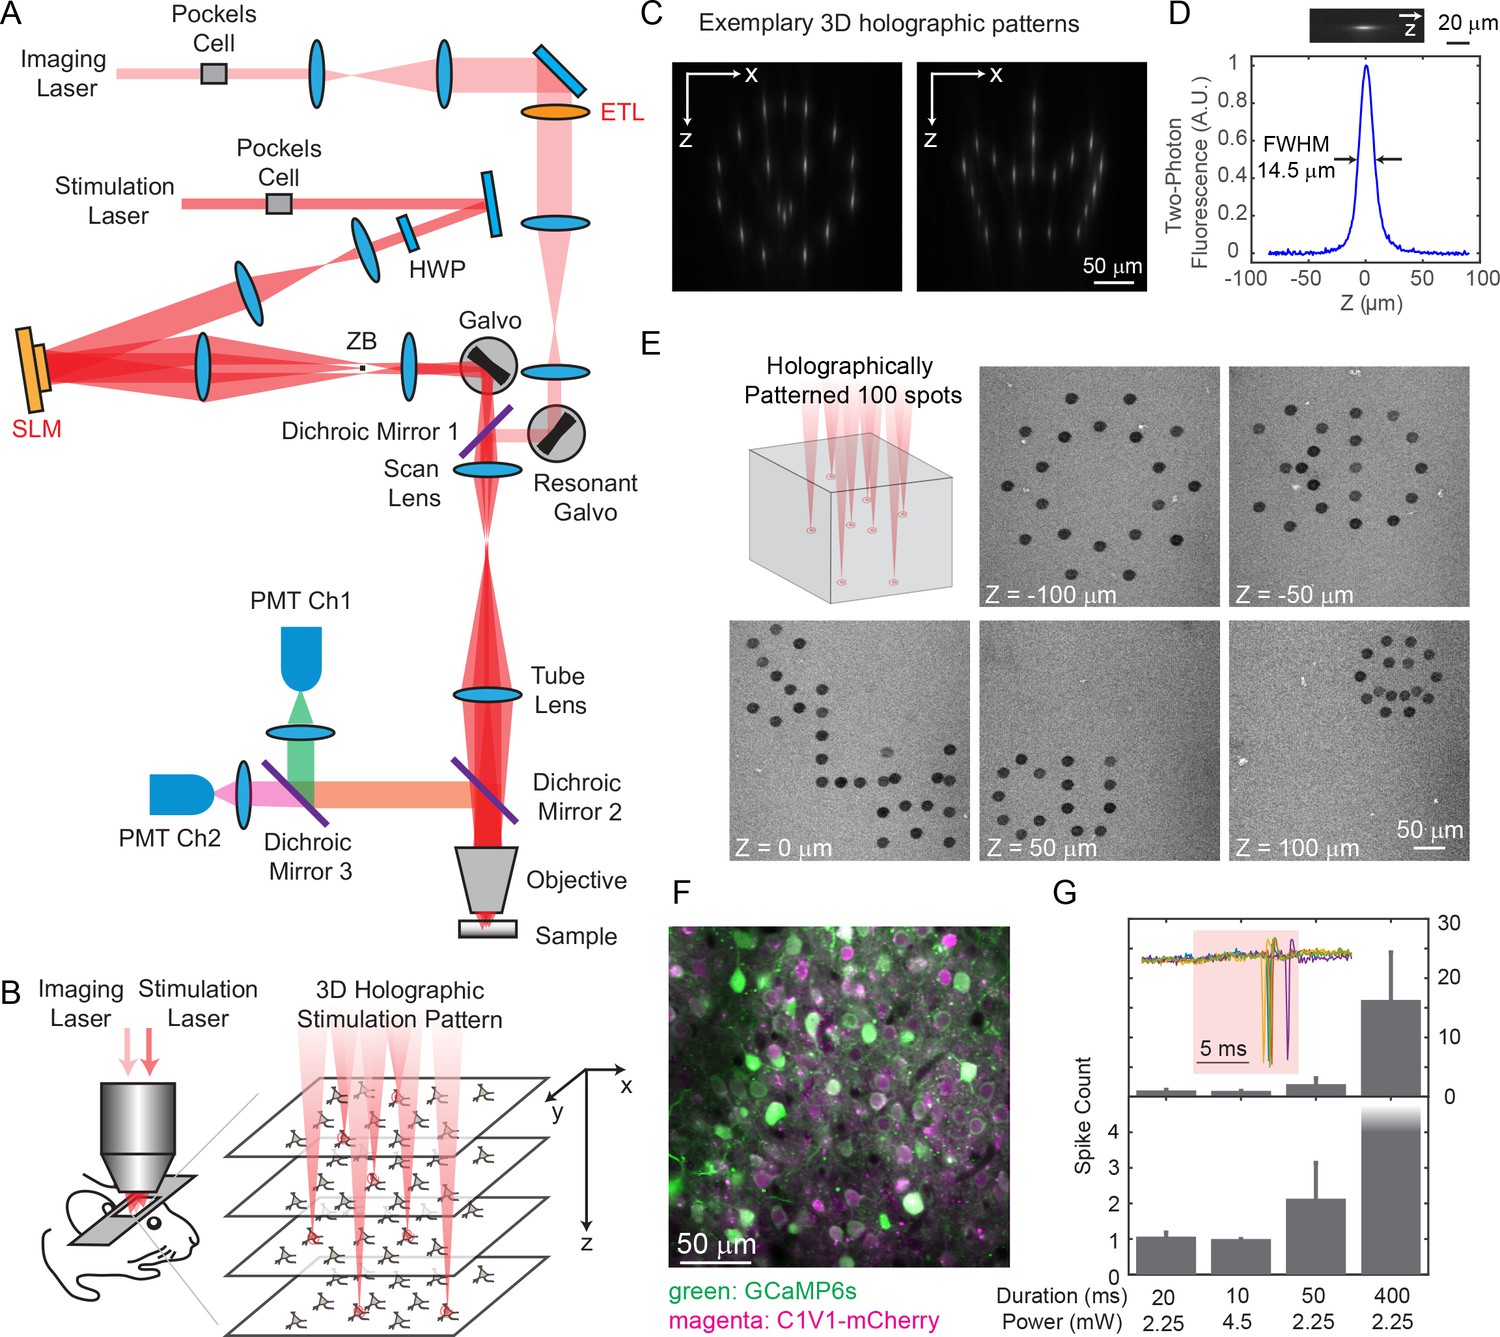
Two-photon imaging and photostimulation microscope.
(A) Dual two-photon excitation microscope setup. HWP, half-wave plate; ZB, zeroth-order beam block; SLM, spatial light modulator; ETL, electrically tunable lens; PMT, photomultiplier tube. (B) Schematics for simultaneous volumetric calcium imaging and 3D holographic patterned photostimulation in mouse cortex. (C) Exemplary 3D holographic patterns projected into Alexa 568 fluorescence liquid with its xz cross section captured by a camera. (D) Measured point spread function (PSF) in the axial (z) direction for two-photon excitation (photostimulation path). The full-width-at-half-maximum (FWHM) is 14.5 μm, corresponding to an NA ~ 0.35. (E) 100 spots holographic pattern spirally scanned by a post-SLM galvanometric mirror bleaching an autofluorescence plastic slide across five different planes. (F) A typical field of view showing neurons co-expressing GCaMP6s (green) and C1V1-mCherry (magenta). (G) Spike counts of target pyramidal cells in layer 2/3 of mouse V1 evoked by photostimulation with different spiral duration and average laser power (3 cells in each condition; mice anesthetized; 1 MHz repetition rate for photostimulation laser). The inset shows the cell-attached recording of a 10 ms spiral stimulation over five trials in a neuron. The red shaded area indicates photostimulation period. Error bars are standard error of the mean over cells.
Figure 1—figure supplement 1
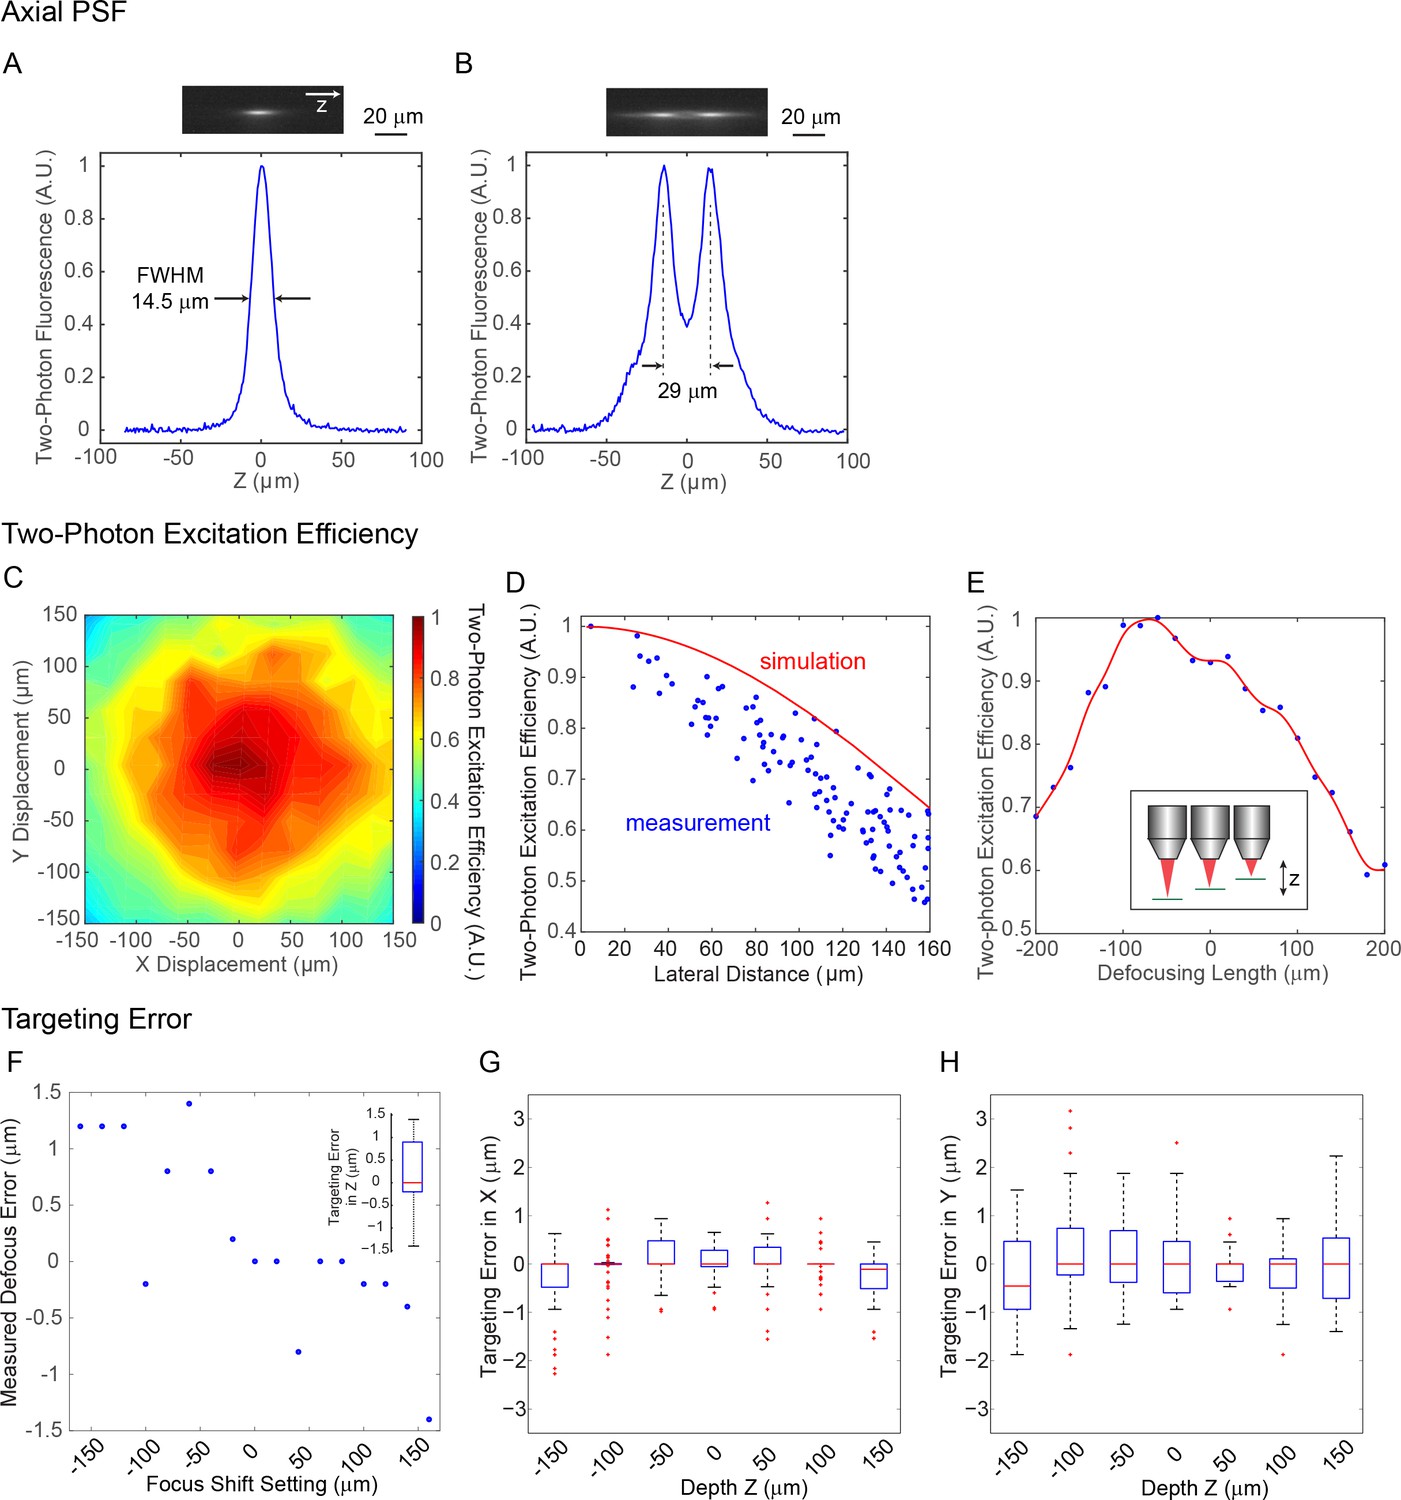
System characterization of the spatial light modulator (SLM) in the 3D microscope.
(A) Measured point spread function (PSF) in the axial (z) direction for two-photon excitation. The FWHM is 14.5 μm, corresponding to an NA ~ 0.35. (B) Measured axial profile of a two-photon holographic imaging where two spots was separated in 29 μm in z. (C) Measured SLM two-photon excitation efficiency versus lateral deflection (x, y) in the imaging plane. (D) Simulated SLM two-photon excitation efficiency versus lateral deflection in the imaging plane (red curve), with measured data (blue dot) from (C). (E) Measured SLM two-photon excitation efficiency versus defocusing length. The measured value (blue dot) is spline-fitted (red curve). (F) Measured SLM axial targeting error versus axial focus shift. Inset, boxplot of axial targeting error. Overall, the axial targeting error (absolute value) is 0.59 ± 0.54 μm across the axial range of 300 μm. (G–H) Measured SLM lateral (x, y) targeting error versus axial focus shift. Overall, the lateral targeting error (absolute value) is 0.82 ± 0.65 μm across the 3D field of view (FOV) of 240 × 240×300 μm3. In the boxplot, the central mark indicates the median, and the bottom and top edges of the box indicate the 25th and 75th percentiles, respectively. The whiskers extend to the most extreme data points (99.3% coverage if the data are normal distributed) not considered outliers, and the outliers are plotted individually using the '+' symbol.
Figure 1—figure supplement 2
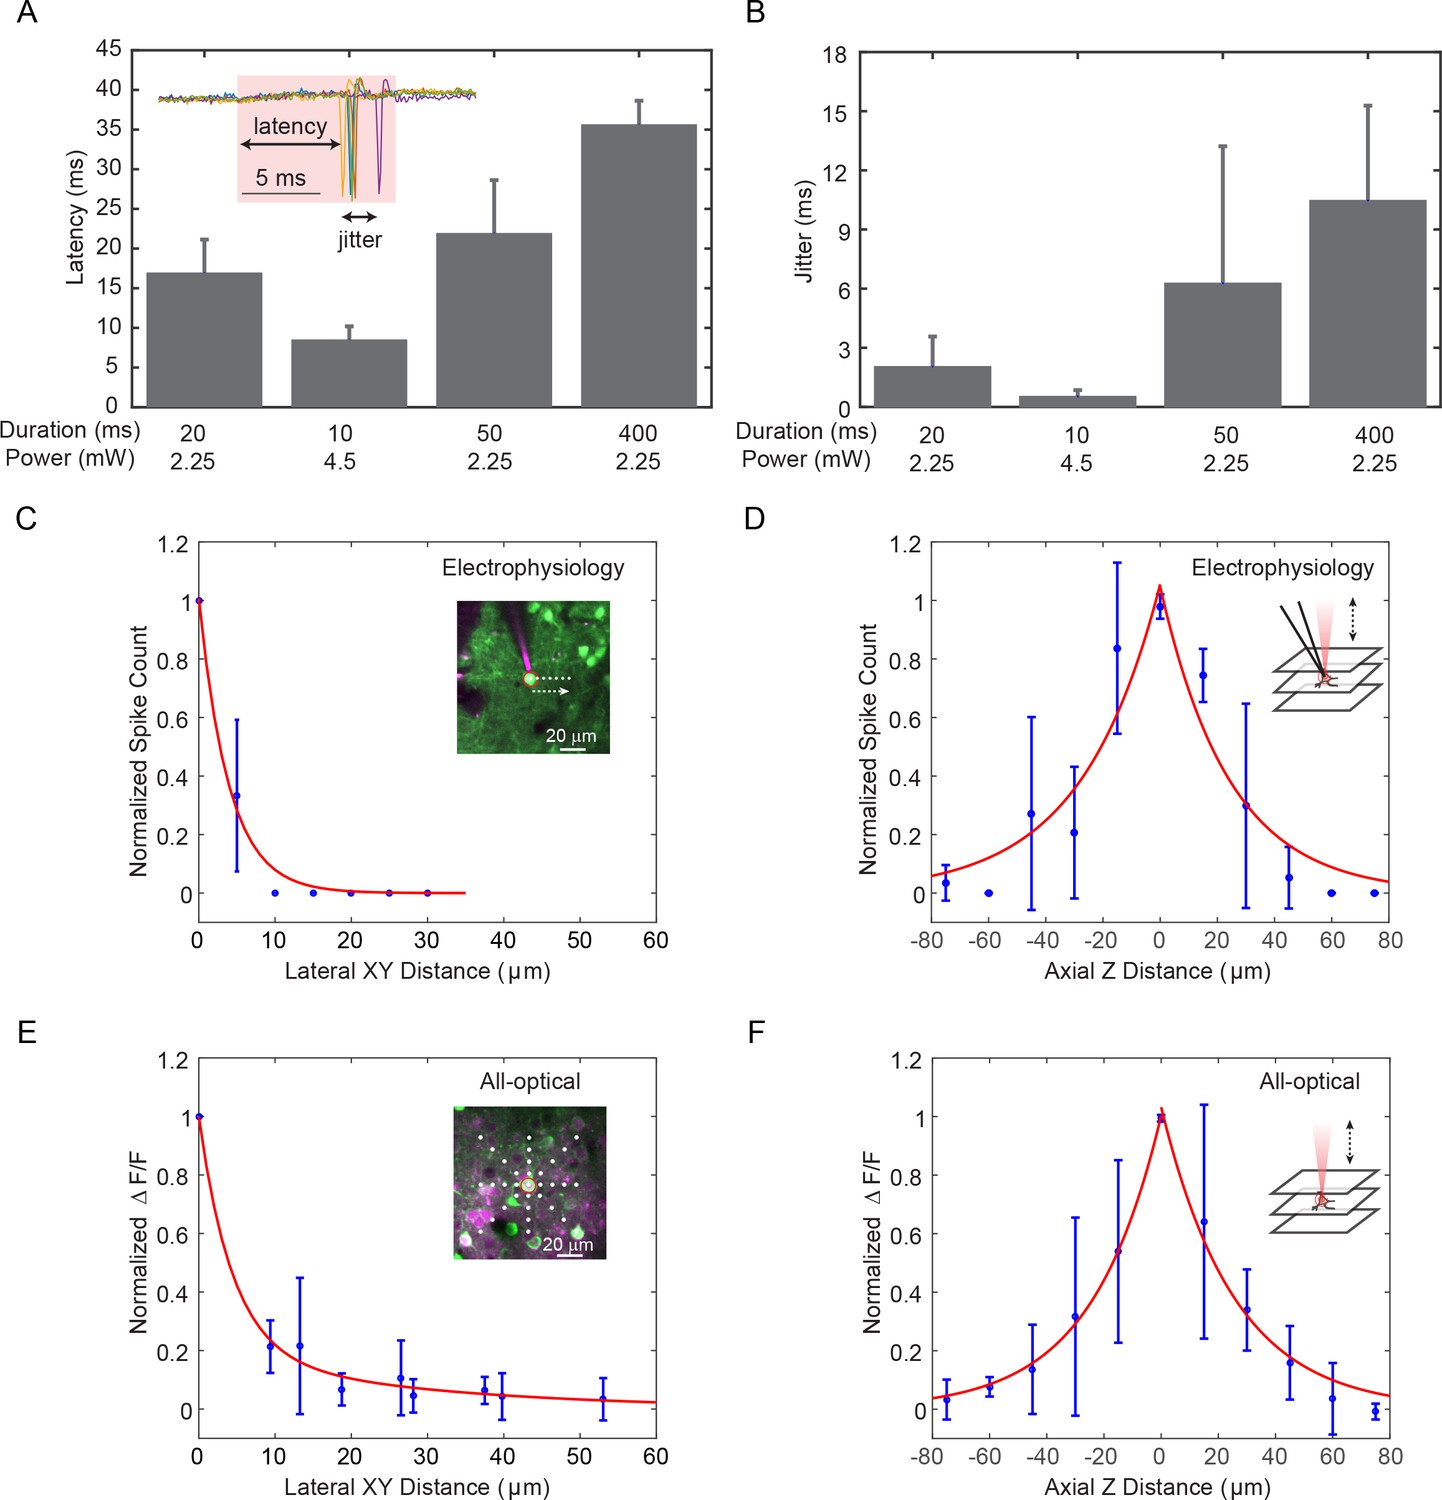
Characterization and spatial resolution of photostimulation.
(A–B) Latency (A) and jitter (B) of target pyramidal cells in layer 2/3 of mouse V1 evoked by photostimulation with different spiral duration and average laser power (3 cells in each condition; mice anesthetized; 1 MHz repetition rate for photostimulation laser). The inset shows the cell-attached recording of a 10 ms spiral stimulation over five trials in a neuron. The red shaded area indicates the photostimulation period. (C–D) Normalized spike count versus the (C) lateral and (D) axial displacement between the centroids of the photostimulation spiral pattern and the cell body, measured by in vivo cell-attached electrophysiology (4 cells over two mice in vivo, layer 2/3 of V1; 2.25 mW ~ 6 mW stimulation power, 20 ms stimulation duration; the mice were transfected with C1V1-EYFP). Inset in (C), photostimulation was performed at different locations with respect to the targeted neuron in the center field of view. The white dots indicate the spiral centroids. Green and magenta indicates cells with C1V1-EYPF and pipette filled with Alexa 594. Inset in (D), photostimulation was performed at different depths with respect to the targeted neuron. (E–F) Normalized ΔF/F versus the (E) lateral and (F) axial displacement between the centroids of the photostimulation spiral pattern and the cell body, measured by in vivo calcium imaging [5 cells over two mice for (E) and 4 cells over two mice for (F), in vivo, layer 2/3 of V1; 3 mW ~ 4.5 mW stimulation power, 154 ms stimulation duration; the mice were transfected with GCaMP6s and C1V1-mCherry]. Inset in (E), photostimulation was performed at different locations with respect to the target neuron in the center field of view. The white dots indicate the spiral centroids. Green and magenta indicates GCaMP6s and C1V1-mCherry. Inset in (F), photostimulation was performed at different depths with respect to the target neuron. Error bars are standard error of the mean over cells for A, C-F, and standard deviation over cells for B.
Figure 1—figure supplement 3
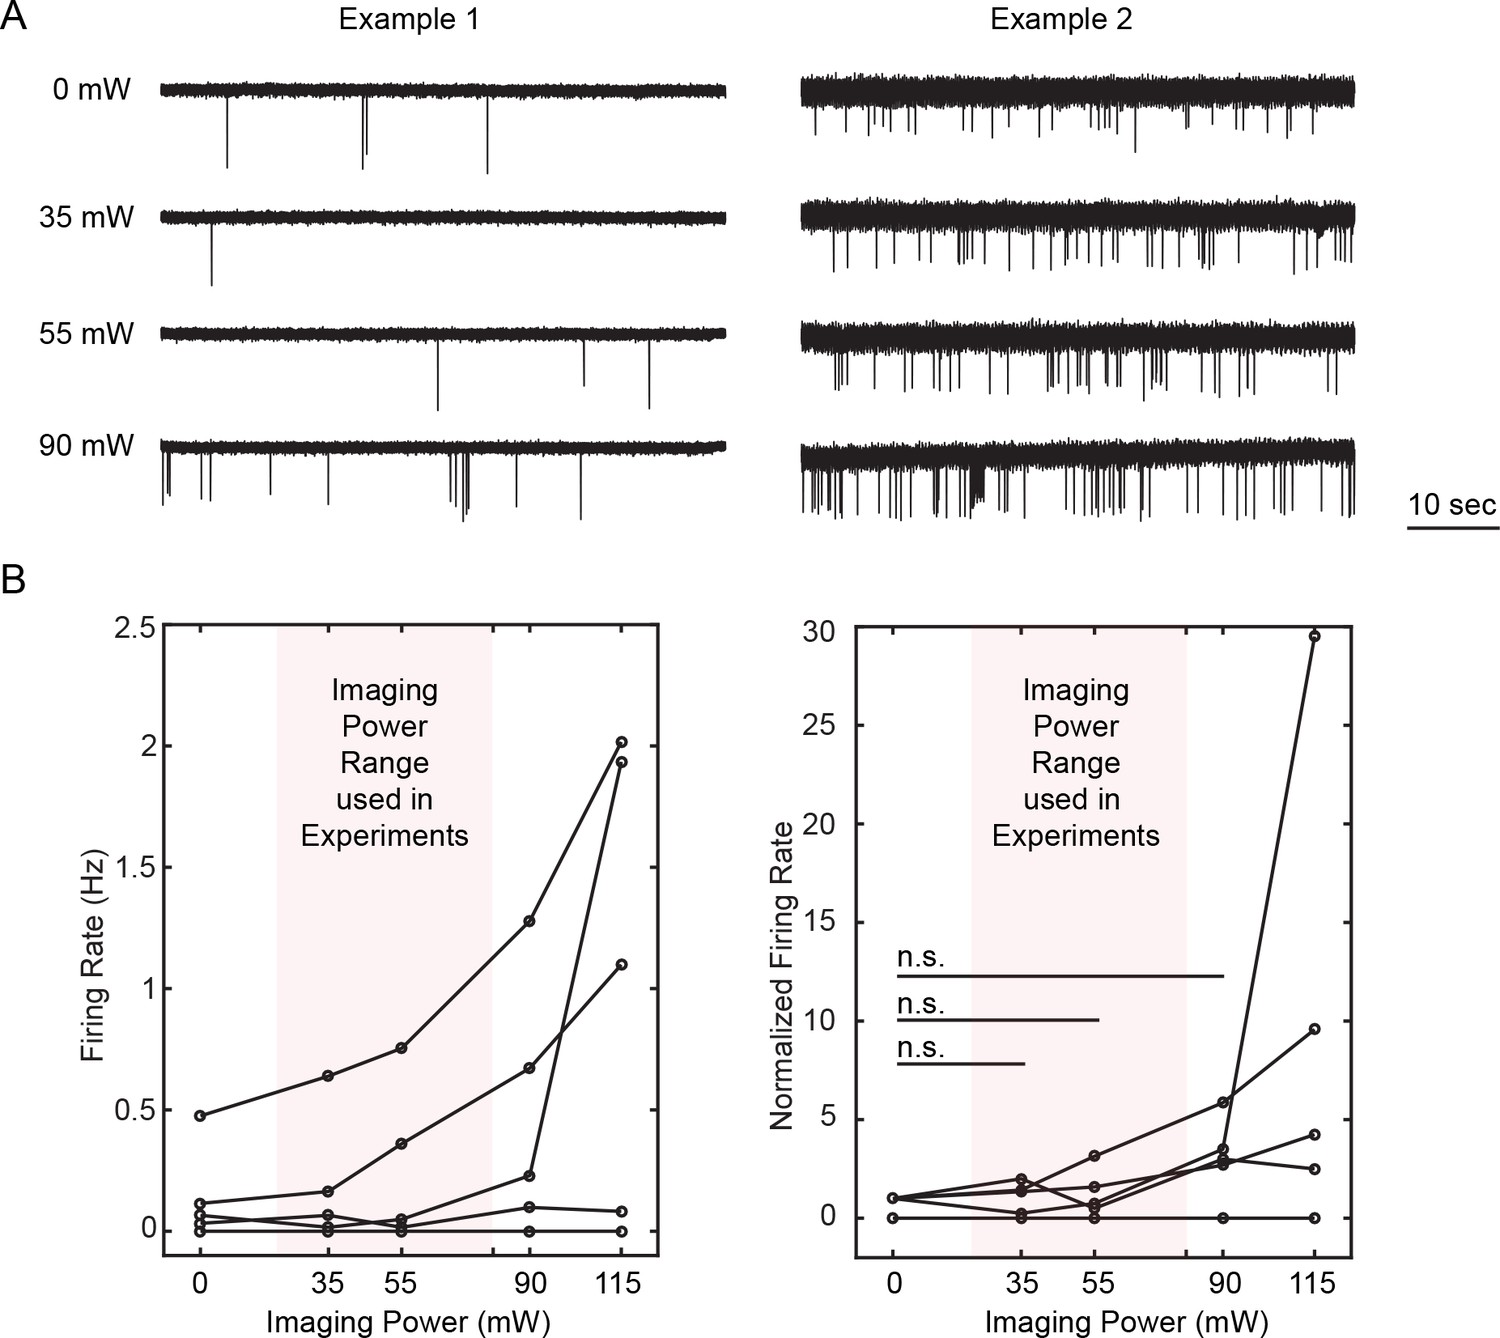
Cross talk from imaging into photostimulation.
Activities of neurons in layer 2/3 of mice V1 were recorded by cell-attached electrophysiology while the whole field was being scanned by the imaging laser (940 nm) at an FOV of 240 × 240 μm2 at 23.3 fps for different powers. The recorded cells were confirmed to be photoactivable by spiral scan of the photostimulation laser (2.25 ~ 4.5 mW) both before and after the whole field scanning of the imaging laser. (A) Examples of the cell-attached recorded signal of two different neurons at different imaging power conditions. (B) Firing rate (left) and normalized firing rate to the 0 mW condition (right) of the recorded neurons at different imaging power. [6 cells over four mice in vivo; the mice were transfected with C1V1-EYFP; One-way ANOVA test show no significant difference between condition of 0 mW and 35 ~ 90 mW. Paired-sample t-test between conditions of (0 mW, 35 mW), (0 mW, 55 mW), (0 mW, 90 mW) shows a p value of 0.50, 0.44, and 0.055 respectively]. Note in the all-optical experiments, the typical imaging power was below 50 mW, though it could be up to 80 mW for layers deeper than ~ 250 μm. Furthermore, the scanning of the imaging laser cycles through different imaging planes (typically separated by ~ 50 μm each), leading to a 3 ~ 4 fold reduction of power depositing to the same plane. This measurement shows that the effect of the imaging laser into cell activation in our all-optical experiment is almost negligible.
Figure 1—figure supplement 4
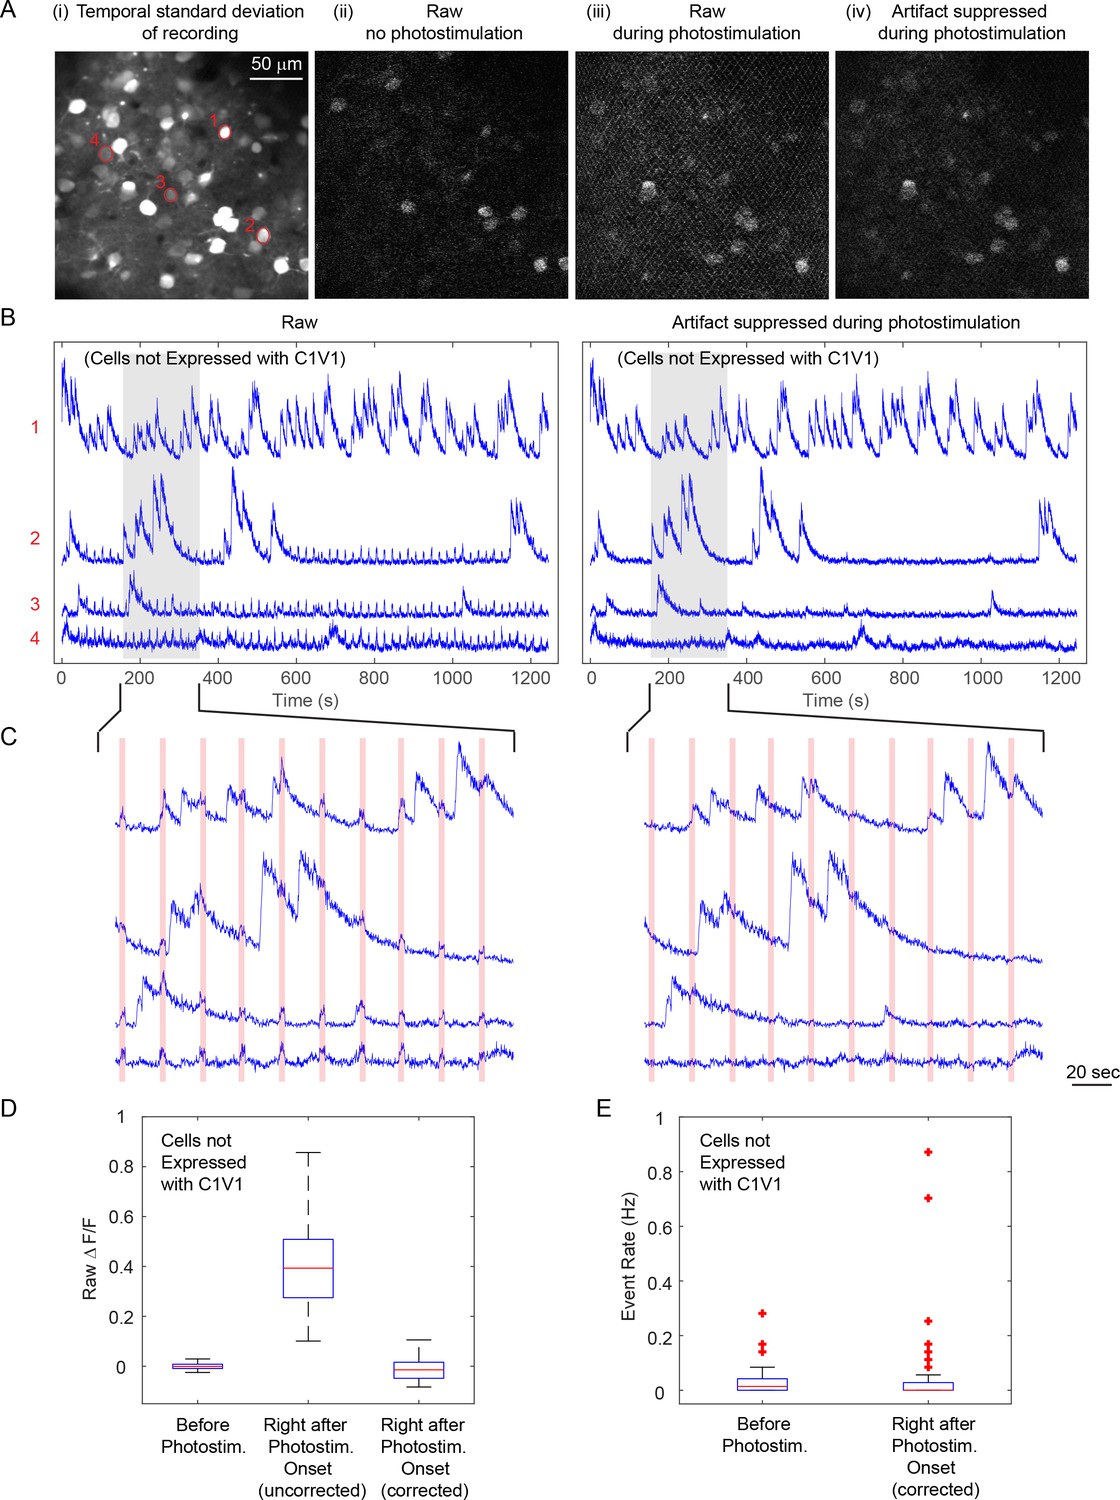
Cross talk from photostimulation into imaging.
This example represents one of the worst cross talk situation: the bright GCaMP6s signal, the relatively strong photostimulation power (60 mW) and its long duration (2.8 s) render a strong photostimulation artifact on the sample. (A) Simultaneous calcium imaging and photostimulation in an awake mouse V1, layer 2/3. Panel i, temporal standard deviation of the recorded movie. Panel ii, a raw image frame with no photostimulation. Panel iii, a raw imaging frame during photostimulation. The mesh pattern comes from the stimulation artifact. Panel iv, the same image frame from panel iii but with artifact suppression by data pre-processing. (B) Representative fluorescence traces of four cells [marked in (A), with different signal-to-noise ratio; cells were not expressed with C1V1] from the raw recording and that after artifact suppression. (C) Zoomed-in view of the shaded area in (B), with the red shaded areas indicating the photostimulation periods. (D) Boxplot summarizing the statistics of raw ΔF/F signal of cells at three conditions: (1) right before photostimulation laser turned on, right after photostimulation laser turned on (2) without and (3) with photostimulation artifact suppression procedure. Only GCaMP6s but not C1V1 were expressed in these analyzed cells (a total number of 115). (E) Boxplot summarizing the statistics of the extracted activity event rate for condition (1) and (3). The central mark indicates the median, and the bottom and top edges of the box indicate the 25th and 75th percentiles, respectively. The whiskers extend to the most extreme data points (99.3% coverage if the data are normal distributed) not considered outliers, and the outliers are plotted individually using the '+' symbol.
Figure 2 with 1 supplement
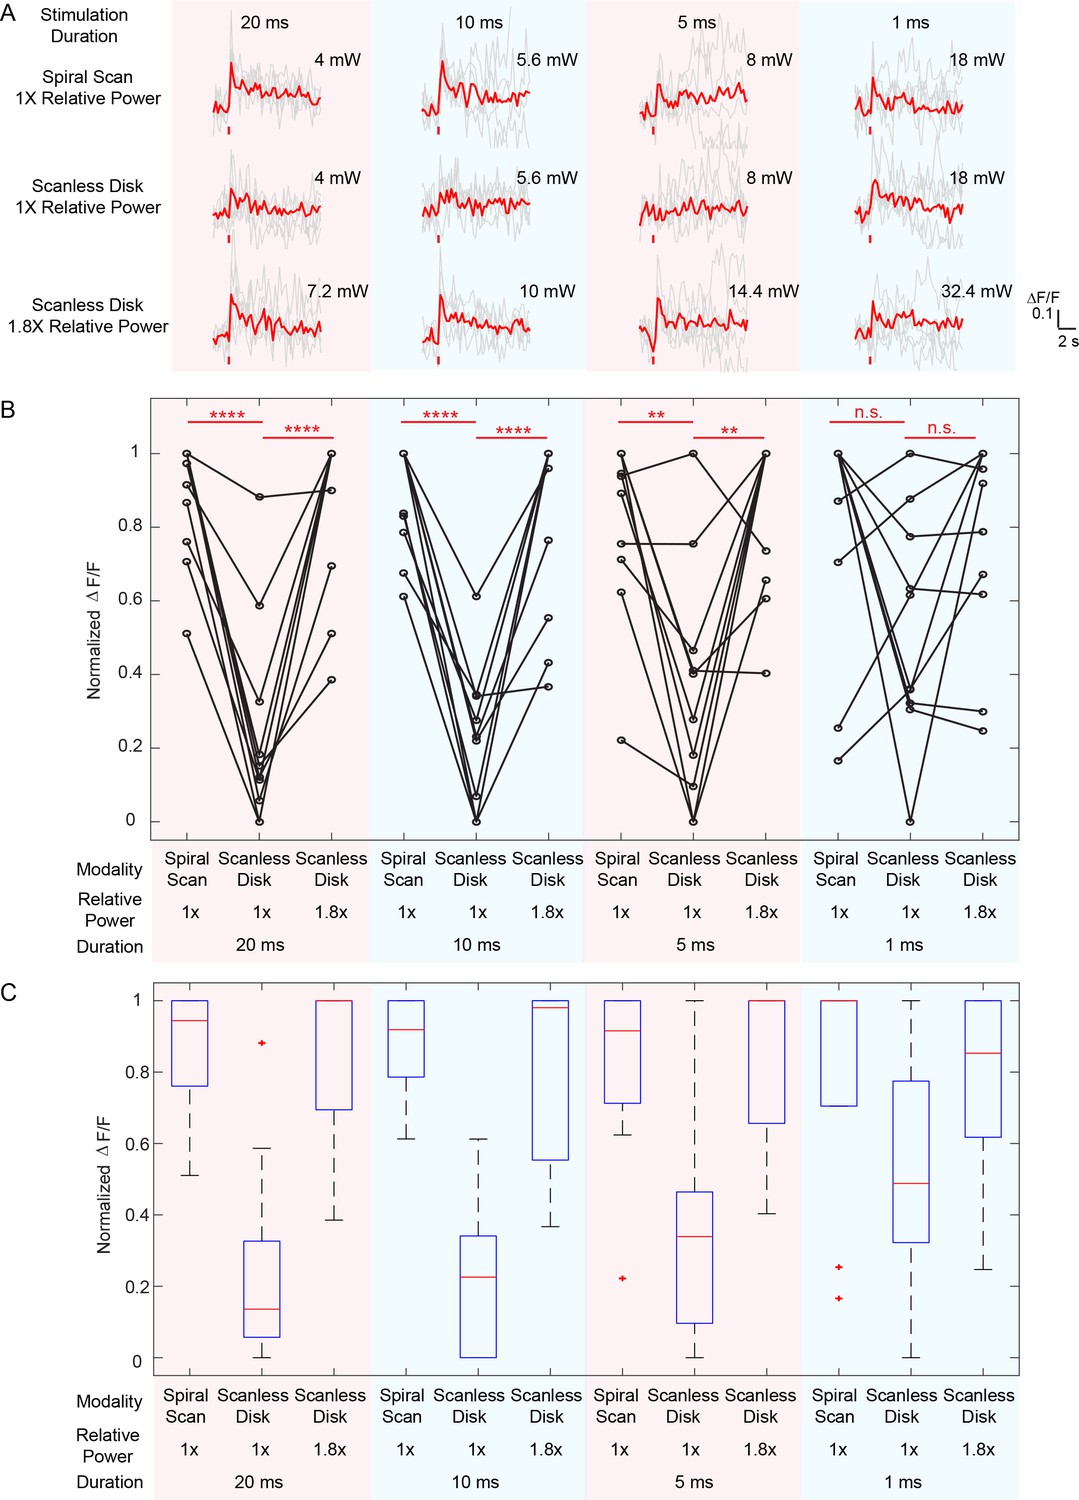
Comparison between spiral scan and scanless holographic approaches for photostimulation.
In the scanning approach, the laser spot is spirally scanned over the cell body; in the scanless approach, a disk pattern (~12 μm in diameter) is generated by the SLM, covering the entire cell body at once. (A) Photostimulation triggered calcium response of a targeted neuron in vivo at mouse layer 2/3 of V1, for different stimulation modalities. For each modality, the multiplication of stimulation duration and the power squared was kept constant over four different stimulation durations. The average response traces are plotted over those from the individual trials. (B) ΔF/F response of neurons on different photostimulation conditions [10 cells over two mice in vivo (photostimulated one at a time), layer 2/3 of V1, over a depth of 100 ~ 270 μm from pial surface; one-way ANOVA test show significant different response between spiral scan and scanless approach at the same power for stimulation duration of 20 ms, 10 ms and 5 ms. At 1 ms, the p value is 0.17]. For each neuron and each stimulation duration, the power used in the scanless disk modality is 1 and 1.8 times relative to that in the spiral scan. For each neuron and each modality, the multiplication of the stimulation duration and the power squared was kept constant over four different stimulation durations. The power used in the spiral scan with 20 ms duration varies from 2.2 mW to 5 mW for different cells. (C) Boxplot summarizing the statistics in (B). The central mark indicates the median, and the bottom and top edges of the box indicate the 25th and 75th percentiles, respectively. The whiskers extend to the most extreme data points (99.3% coverage if the data are normal distributed) not considered outliers, and the outliers are plotted individually using the '+' symbol. In this experiment, the mice are transfected with GCaMP6f and C1V1-mCherry. Repetition rate of the photostimulation laser is 1 MHz. The spiral scan consists of 50 rotations with progressively shrinking radius, and the scanning speed is adjusted to make different stimulation durations.
Figure 2—figure supplement 1
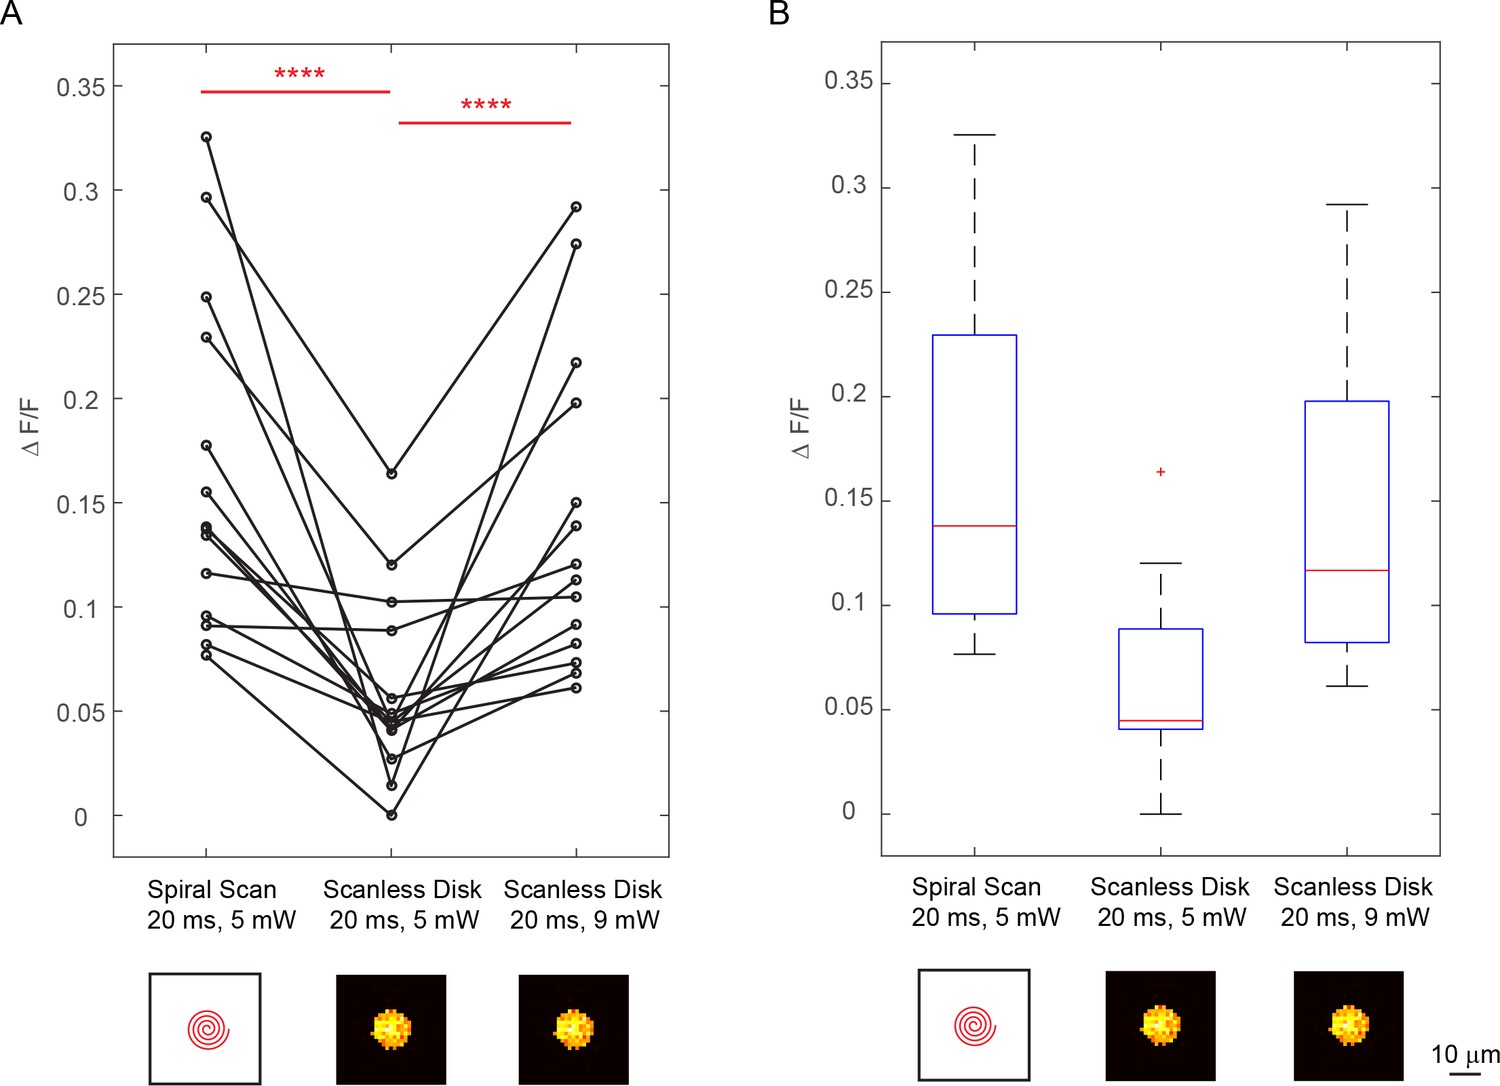
Comparison between spiral scan and scanless holographic approaches for photostimulation.
In the scanning approach, the laser spot is spirally scanned over the cell body; in the scanless approach, a disk pattern (~12 μm in diameter) is generated by the SLM, covering the entire cell body at once. (A) ΔF/F response of neurons towards three different photostimulation conditions: (1) spiral scan at 5 mW, (2) scanless disk at 5 mW and (3) scanless disk at 9 mW, all with 20 ms stimulation duration [14 cells over five mice in vivo (photostimulated one at a time), layer 2/3 of V1, over a depth of 120 ~ 270 μm from pial surface; one-way ANOVA test show significant difference between condition (1 , 2) and condition (2 , 3)]. The disk pattern in the bottom panel shows the squared calculated holographic pattern projected to the cell body. (B) Boxplot summarizing the statistics in (A). The central mark indicates the median, and the bottom and top edges of the box indicate the 25th and 75th percentiles, respectively. The whiskers extend to the most extreme data points (99.3% coverage if the data are normal distributed) not considered outliers, and the outliers are plotted individually using the '+' symbol. In this experiment, the mice are transfected with GCaMP6f and C1V1-mCherry. The repetition rate of the photostimulation laser is set to 1 MHz. The spiral scan consists of 50 rotations with progressively shrinking radius.
Figure 3 with 1 supplement
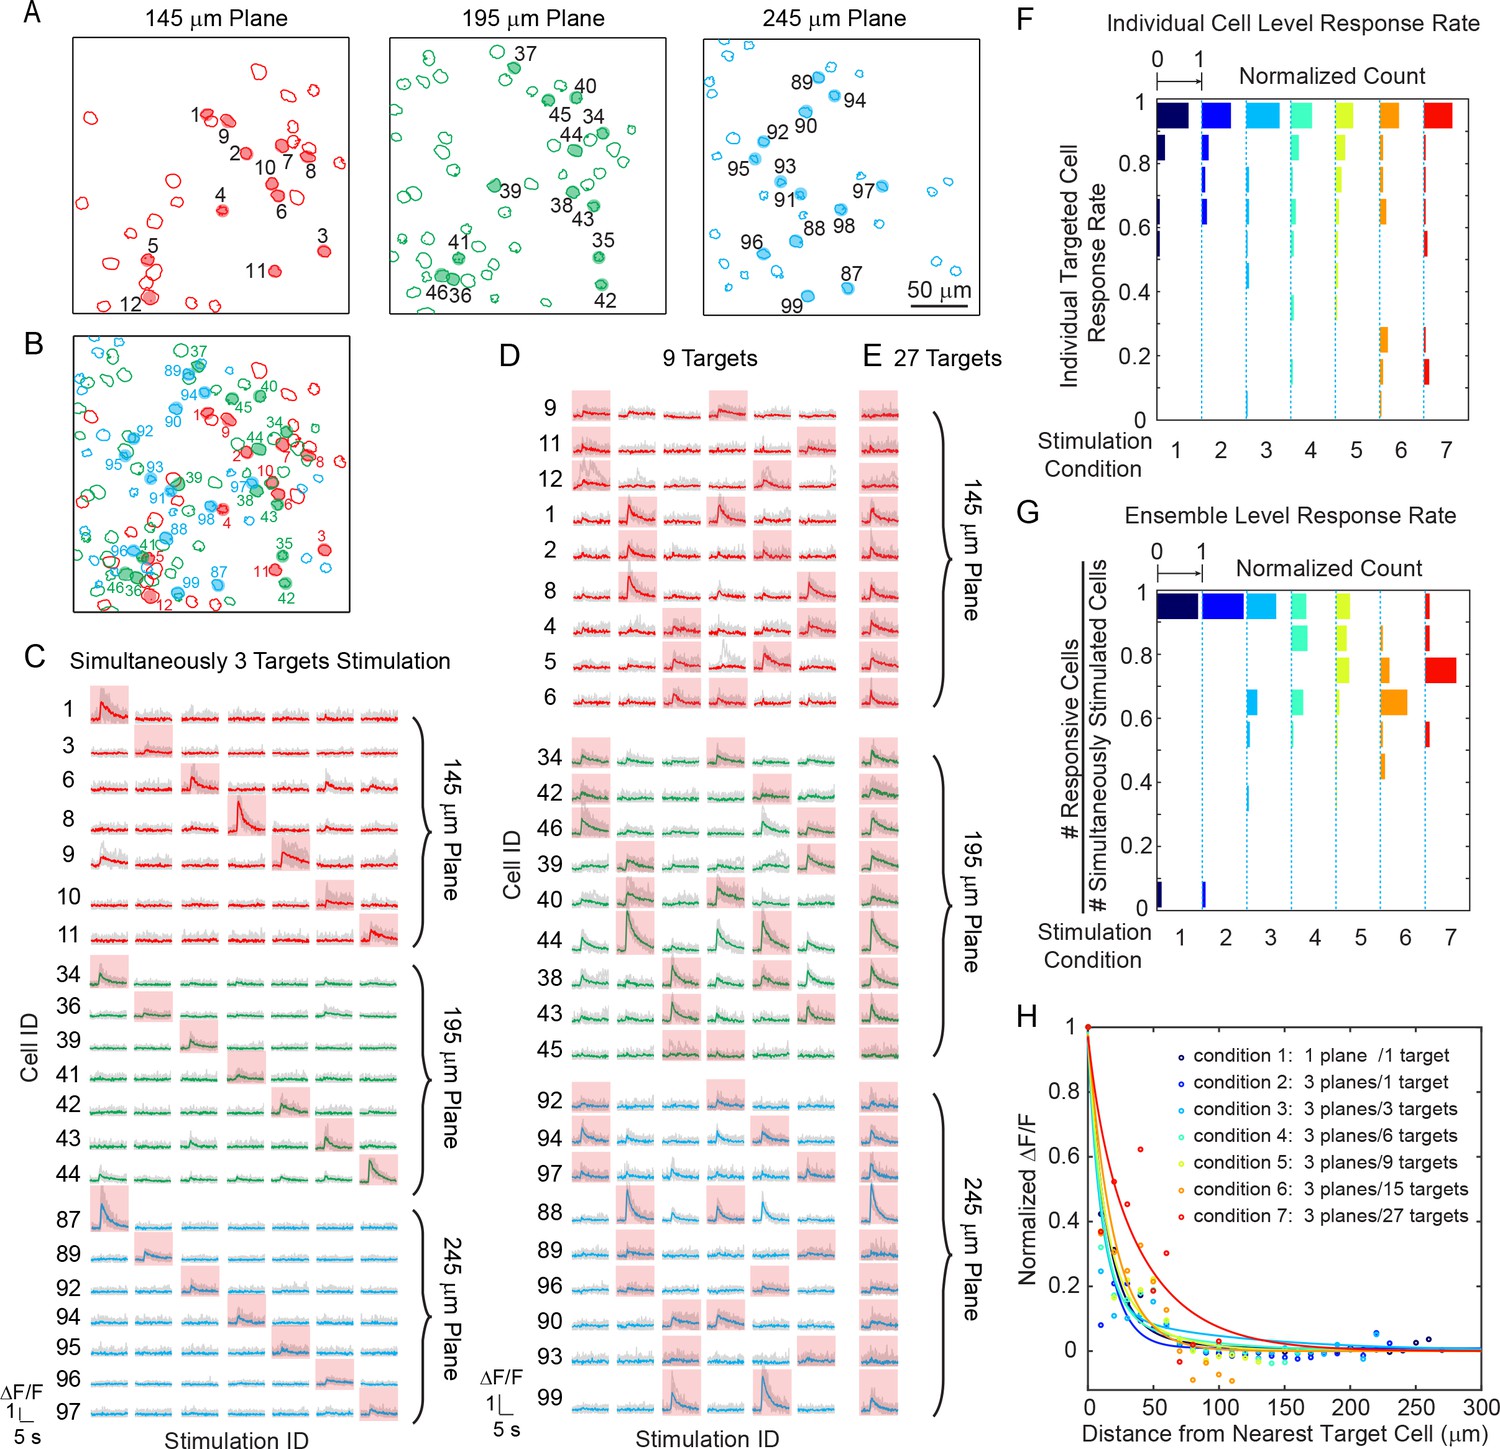
Simultaneous holographic photostimulation of pyramidal cells in vivo.
(A) Contour maps showing the spatial location of the cells in three individual planes in mouse V1 (145 μm, 195 μm, and 245 μm from pial surface). Cells with shaded color are the targeted cells. (B) 2D overlap projection of the three planes in (A). (C)-(E) Representative photostimulation triggered calcium response of the targeted cells (indicated with red shaded background) and non-targeted cells, for different stimulation patterns. A total number of (C) 3, (D) 9, and (E) 27 cells across three planes were simultaneously photostimulated. The average response traces are plotted over those from the individual trials. (F) Histogram of individual targeted cell response rate (averaged across trials) in different stimulation conditions. The stimulation conditions are listed in (H). (G) Histogram of the percentage of responsive cells in a targeted ensemble across all trials in different stimulation conditions. (H) Response of the non-targeted cells to the photostimulation versus distance to their nearest targeted cell. ΔF/F is normalized to the averaged response of the targeted cells. The total number of photostimulation patterns for condition 1 ~ 7 in (F~H) is 34, 26, 12, 8, 6, 2, 1 respectively; and the total trial for each condition is 8 ~ 11. The mice were transfected with GCaMP6s and C1V1-mCherry. The photostimulation power is 4 ~ 5 mW/cell, and duration was 870 ms, 962 ms, and 480 ms for conditions 1, 2, and 3 ~ 7 respectively.
Figure 3—figure supplement 1
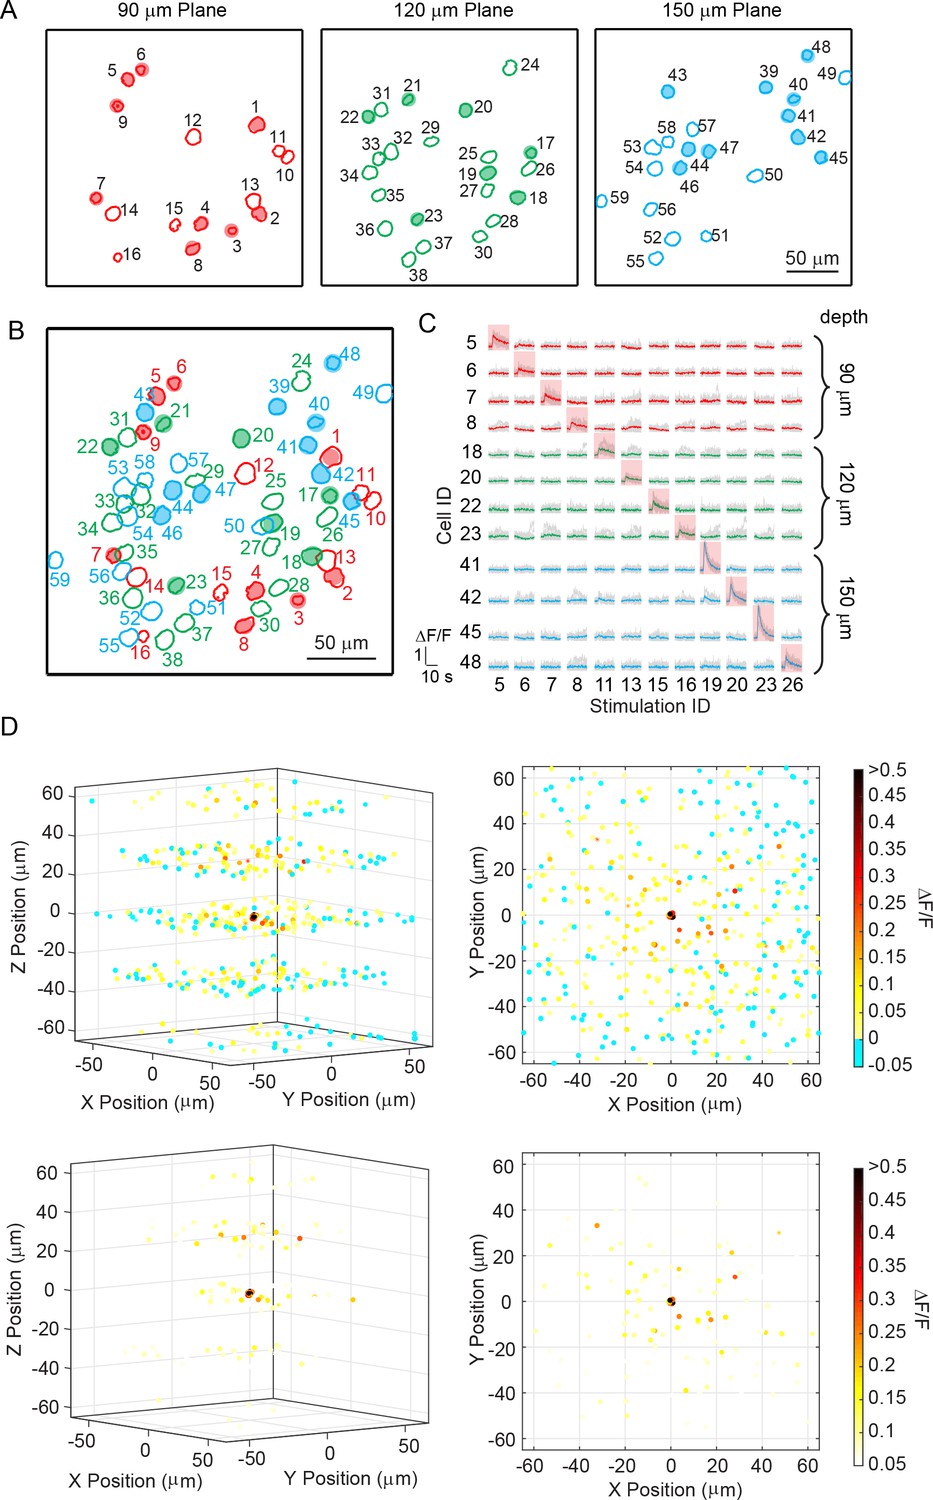
Sequential photostimulation of individual pyramidal cells in layer 2/3 from mouse V1 in vivo.
(A) Contour maps showing the spatial location of the cells in three individual planes in mouse V1 (90 μm, 120 μm, and 150 μm from pial surface). Cells with shaded color are the targeted cells. (B) 2D overlap projection of the three planes in (A). (C) Representative photostimulation triggered calcium response of the targeted cells (indicated with red shaded background) and non-targeted cells, for photostimulation on different single cells. The average response traces are plotted over those from the individual trials. (D) Neuronal calcium response during photostimulation on different single cells (26 in total; plotted average response over eight trials for each). The spatial locations of the cells are relative to the targeted cells, which are set at the (0, 0, 0). The spatial locations of different set of conditions are randomly dithered by < 1 μm in x, y, z such that the target cells do not appear to completely overlap at (0, 0, 0). The ΔF/F response is color coded. The top and bottom panel uses two different color scales. The top panel illustrates all the cells, and the bottom panel highlights the cells showing relatively large response. The left panel shows 3D perspective; the right panel shows the projection in xy plane. The mouse was transfected with GCaMP6s and C1V1-mCherry. The photostimulation power is ~ 4 mW for each cell, and duration was 962 ms.
Figure 4 with 1 supplement
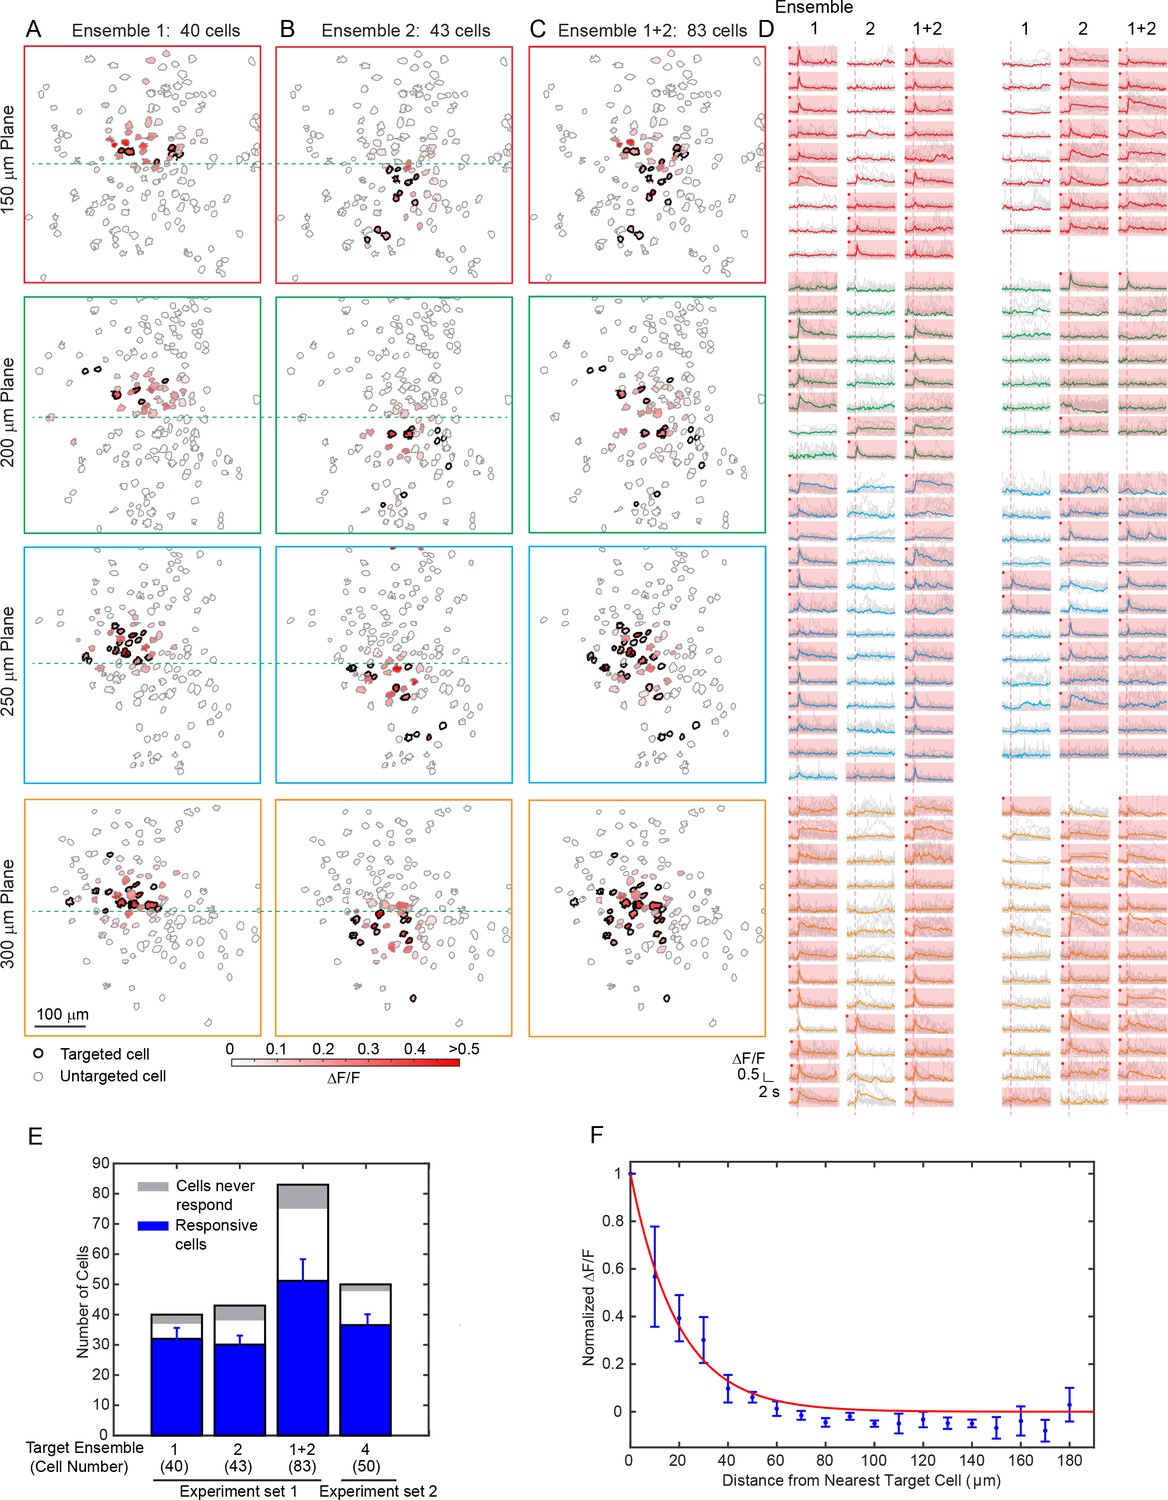
Large scale photostimulation of pyramidal cells in layer 2/3 of V1 in awake mice.
(A~C) Simultaneous photostimulation of 40 cells, 43 cells and 83 cells across four planes in mouse V1 (150 μm, 200 μm, 250 μm and 300 μm from pial surface, with an imaged FOV of 480 × 480 µm2 in each plane.). The contour maps show the spatial location of the cells in individual planes. Cells with black contour are the simultaneously targeted cells. The red shaded color shows the evoked ΔF/F in average. (D) Photostimulation triggered calcium response of the targeted cells (indicated with red shaded background) and non-targeted cells, corresponding to conditions shown in (A~C). The average response traces are plotted over those from a total of 11 individual trials. Those with a red dot indicate cells showing clear evoked calcium transient through manual inspection. (E) Number of target cells, number of total responsive cells across all trials, and cells that did not show any response in any photostimulation pattern, for four different photostimulation conditions. Condition 1 ~ 3 correspond to those in (A~C). Error bars are standard deviation over trials. (F) Response of the non-targeted cells to the photostimulation versus distance to their nearest targeted cell (for conditions shown in E). ΔF/F is normalized to the averaged response of the targeted cells. Error bars are standard error of the mean over different photostimulation conditions in (E). The mice were transfected with GCaMP6f and C1V1-mCherry. The photostimulation power was 3.6 ~ 4.8 mW/cell, and the duration was 94 ms (composing of 5 continuously repeated spiral scans).
Figure 4—figure supplement 1
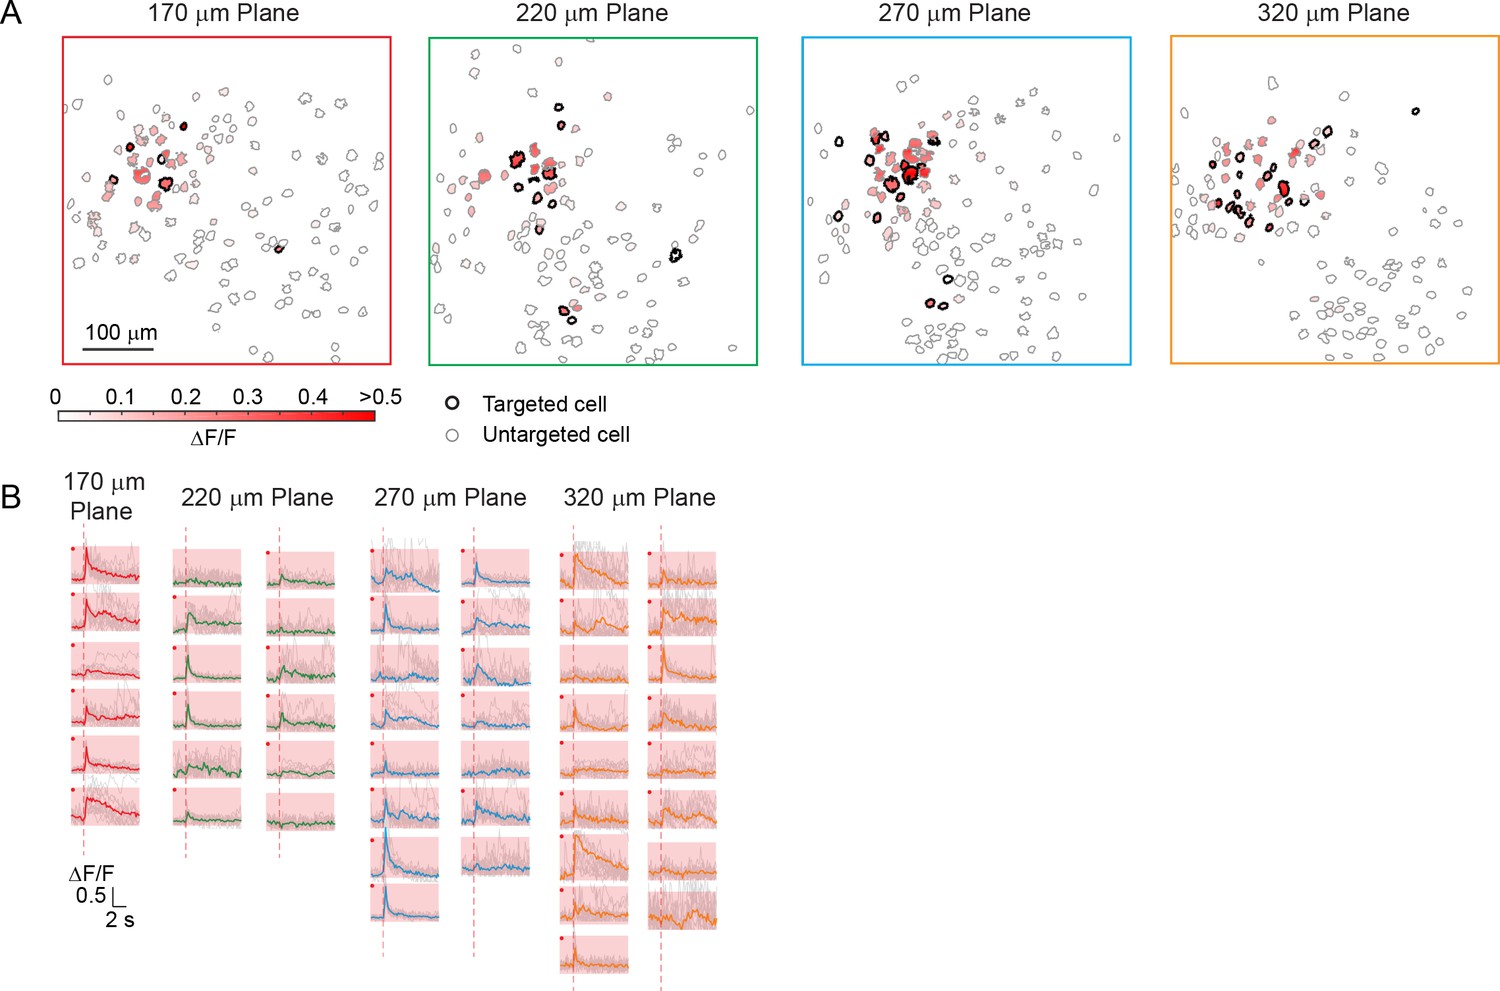
Simultaneous photostimulation of 50 pyramidal cells in layer 2/3 of V1 in awake mice.
(A) Contour maps showing the spatial location of the cells across four individual planes in mouse V1 (170 μm, 220 μm, 270 μm and 320 μm from pial surface). Cells with black contour are the simultaneously targeted cells. The red shaded color shows the evoked ΔF/F in average. (B) Photostimulation triggered calcium response of the targeted cells. The average response traces are plotted over those from a total of 11 individual trials. Those with a red dot indicate cells showing clear evoked calcium transient through manual inspection. The mouse was transfected with GCaMP6f and C1V1-mCherry. The photostimulation duration was 94 ms (composing of 5 continuously repeated spiral scans).
Figure 5
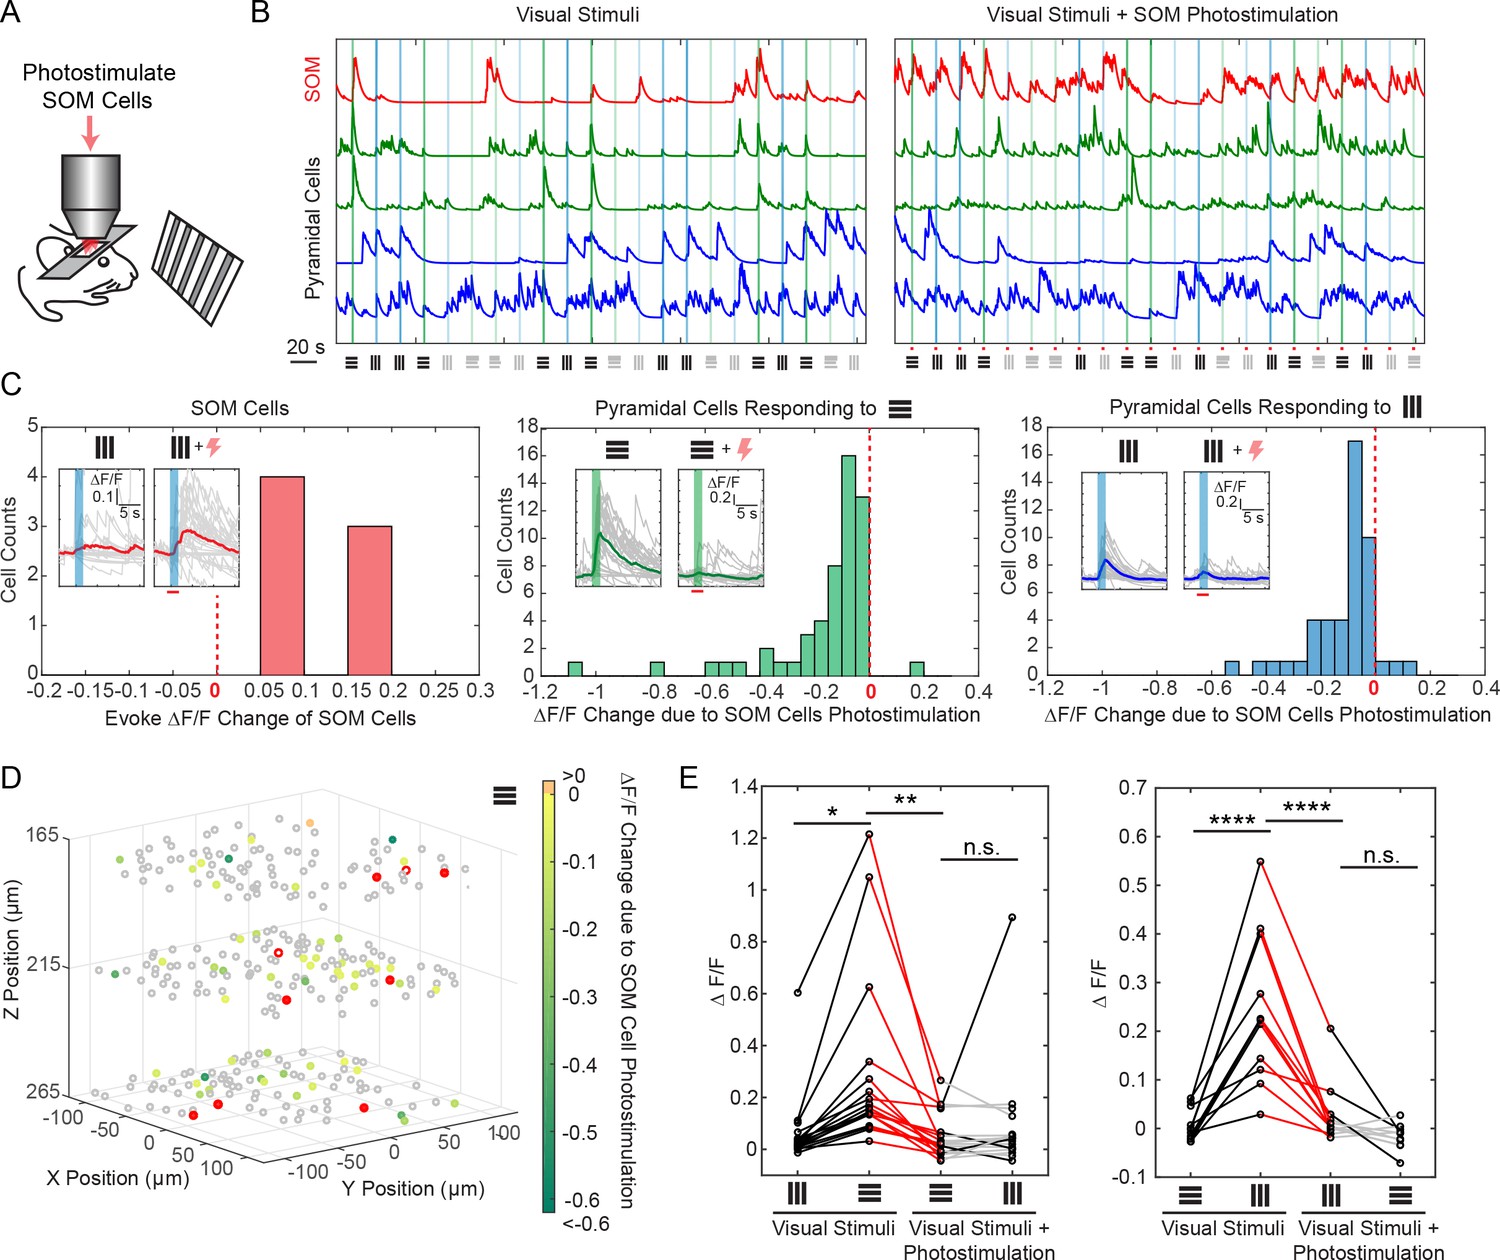
Selective photostimulation of SOM interneurons suppresses visual response of pyramidal cells in awake mice.
(A) Experiment paradigm where the SOM cells were photostimulated when the mouse received drifting grating visual stimulation. (B) Normalized calcium traces (ΔF/F) of representative targeted SOM cells and pyramidal cells that are responding to visual stimuli, without (left panel) and with (right panel) SOM cell photostimulation. The normalization factor of the ΔF/F trace for each cell stays the same across the two conditions. The shaded regions indicate the visual stimuli period. The symbols at the bottom of the graph indicate the orientations and contrast of the drifting grating (black, 100% contrast; gray, 10% contrast). (C) Histogram of the visual stimuli evoked ΔF/F change for different cell populations that show significant activity change (p<0.05, two-sample t-test over ~ 30 trials) due to SOM cell photostimulation (M = 9, simultaneously photostimulated). Left panel, targeted SOM cells (7 out of 9 show significant responses to photostimulation). Middle and right panels, pyramidal cells responding to horizontal or vertical drifting-gratings respectively. The inset compares the activity of a representative cell without and with targeted SOM cell photostimulation; the shaded regions indicate the visual stimuli period; the red bar indicates the photostimulation period. (D) Spatial map of all recorded cells. Pyramidal cells responding to horizontal drifting-gratings and showing significant visual stimuli evoked ΔF/F change due to SOM cell photostimulation (p<0.05, two-sample t-test over ~30 trials) [cell population in the middle panel of C] are color coded according to their ΔF/F change. The targeted SOM cells are outlined in red, and those responding are shaded in red. (E) Comparison of the orientation selectivity in normal situation and with SOM cells photostimulation, for a cell population that normally have strong orientation selectivity but responsive to SOM cells photostimulation. During SOM cell photostimulation, their selectivity is largely abolished (one-way ANOVA test). For individual cells, black and red lines indicate a significant difference in the visual stimuli evoked ΔF/F between the two conditions that the lines connect with (~30 trials, p<0.05, two-sample t-test), whereas gray lines indicate no significant difference. The SOM-cre mice were transfected with GCaMP6s and Cre-dependent C1V1-mCherry. The duration of visual stimuli was 2 s. The photostimulation power was ~ 6 mW/cell, and the duration was 2.8 s (composing of 175 continuously repeated spiral scans).
Tables
Table 1
Expression of Zernike polynomials and Zernike coefficients in Equation (1).
https://doi.org/10.7554/eLife.32671.015| Defocus | |
|---|---|
| Zernike polynomials | |
| Zernike coefficients | |
| First-order spherical aberration | |
| Zernike polynomials | |
| Zernike coefficients | |
| Second-order spherical aberration | |
| Zernike polynomials | |
| Zernike coefficients | |
-
n, refractive index of media between the objective and sample; k, the wavenumber; z, the axial shift of the focus plane in the sample; u, v, coordinates on the SLM phase mask; nsinα, the NA of the objective.
Additional files
-
Transparent reporting form
- https://doi.org/10.7554/eLife.32671.016
Download links
A two-part list of links to download the article, or parts of the article, in various formats.
Downloads (link to download the article as PDF)
Open citations (links to open the citations from this article in various online reference manager services)
Cite this article (links to download the citations from this article in formats compatible with various reference manager tools)
Simultaneous two-photon imaging and two-photon optogenetics of cortical circuits in three dimensions
eLife 7:e32671.
https://doi.org/10.7554/eLife.32671


