TANGO1 builds a machine for collagen export by recruiting and spatially organizing COPII, tethers and membranes
- The Barcelona Institute of Science and Technology, Spain
- Universitat Pompeu Fabra, Spain
- Institució Catalana de Recerca i Estudis Avançats, Spain
Figures
Figure 1 with 1 supplement
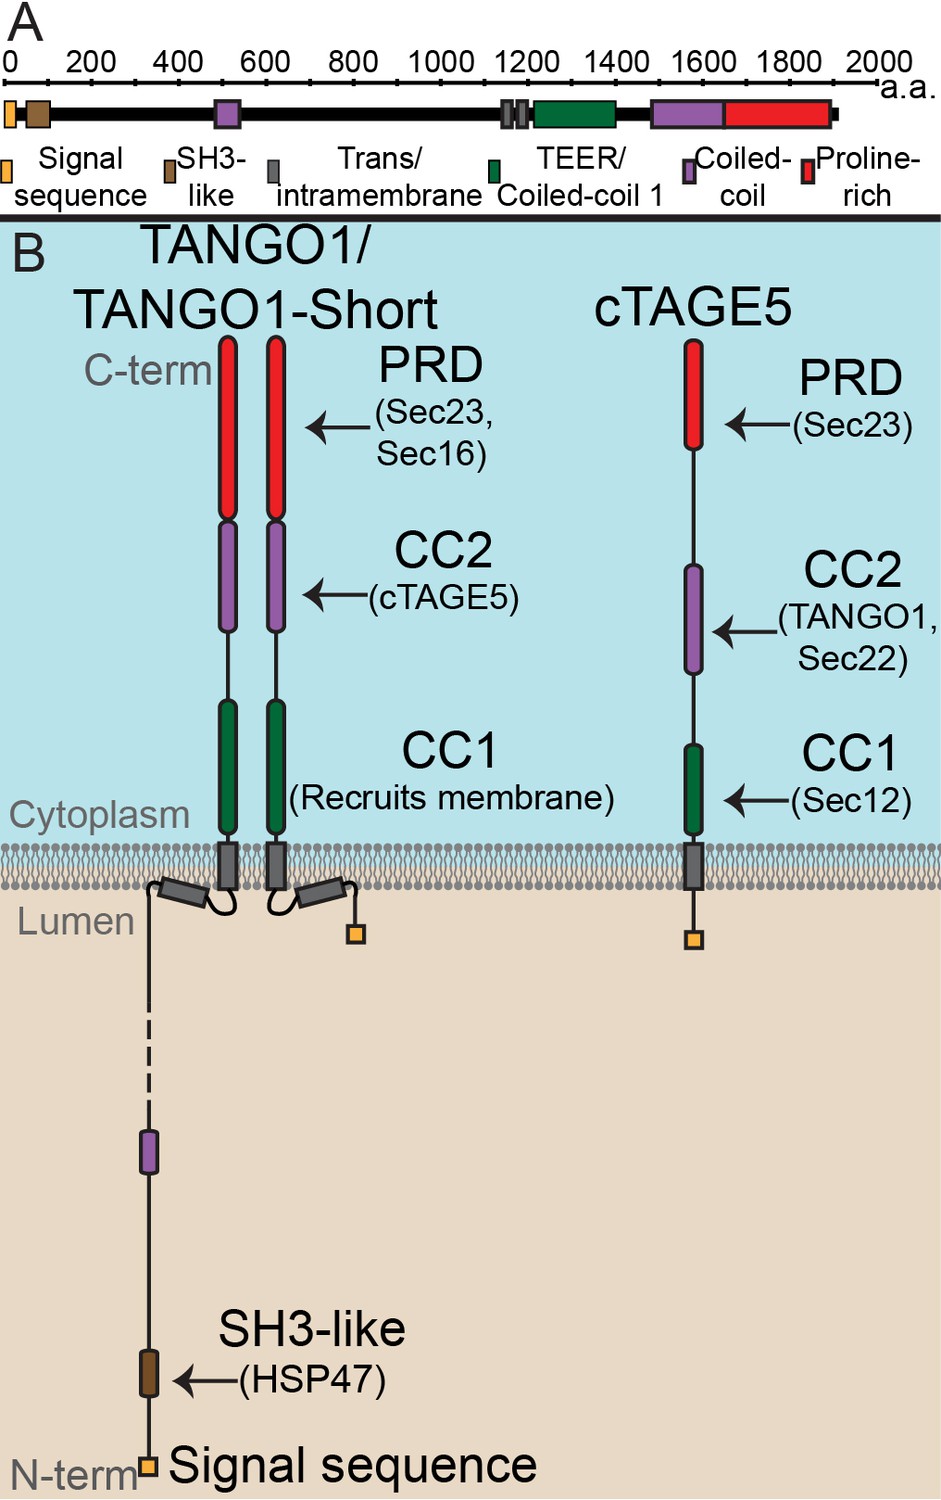
The domain architecture and topology of TANGO1 and cTAGE5.
(A) A schematic depiction of full length TANGO1, showing the extent of each domain in amino acids. (B) Three TANGO1-family proteins (TANGO1, TANGO1-short and cTAGE5) that form a stable complex at the ERES (Maeda et al., 2016). TANGO1 is a type one single-pass transmembrane protein of 1907 amino acids, localised to ER exit sites. TANGO1 has an N-terminal lumenal SH3-like domain that interacts with collagen (Saito et al., 2009) via the chaperone, HSP47 (Ishikawa et al., 2016). There is a transmembrane helix and, in close proximity, a membrane insertion helix. On the cytoplasmic side of the ER membrane, TANGO1 has two coiled-coil (CC) domains (CC1 and CC2). CC1 is used by TANGO1 to recruit ERGIC membranes for producing a collagen carrier (Santos et al., 2015). CC2 binds to a similar coiled-coil domain in cTAGE5 (18). The proline-rich domain (PRD) binds ER exit site machinery Sec23 (Saito et al., 2009; Ma and Goldberg, 2016) and Sec16 (Maeda et al., 2017). Alternative splicing of TANGO1 results in a short isoform, TANGO1-short (Wilson et al., 2011), lacking the lumenal domain. The closely related protein cTAGE5 has a similar cytoplasmic domain organisation with two coiled-coil domains (CC1 and CC2) and a proline-rich domain (PRD). Via its CC1 it recruits Sec12 (Saito et al., 2014). cTAGE5 and TANGO1/TANGO1-short interact through their respective CC2 domains. In addition, the cTAGE5 CC2 also interacts with the retrograde v-SNARE Sec22 (Fan et al., 2017). Like the TANGO1/TANGO1-short PRDs, the cTAGE5 PRD also interacts with Sec23 (Ma and Goldberg, 2016; Saito et al., 2011; Wang et al., 2016).
Figure 1—figure supplement 1
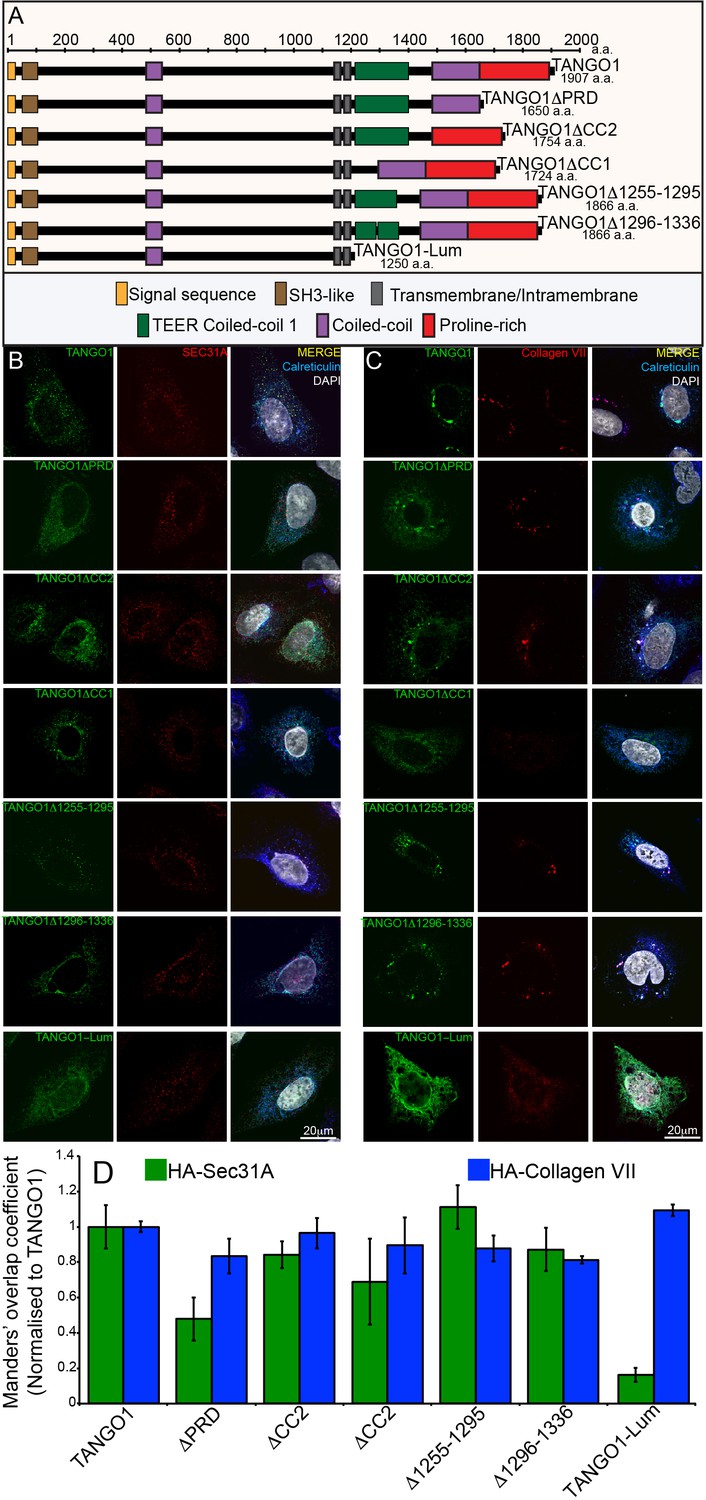
Constructs used in this study.
(A) A schematic representation of all the HA-epitope tagged constructs used in this study with different domains deleted from full length TANGO1. (B) Each construct was expressed in 2H5 cells. Cells were fixed, permeabilised and co-stained for HA, Sec31A and calreticulin or (C) HA, collagen VII and calreticulin. (D) A bar graph showing Manders’ overlap coefficients of HA to Sec31A (green) or HA to collagen (blue).
Figure 2 with 4 supplements
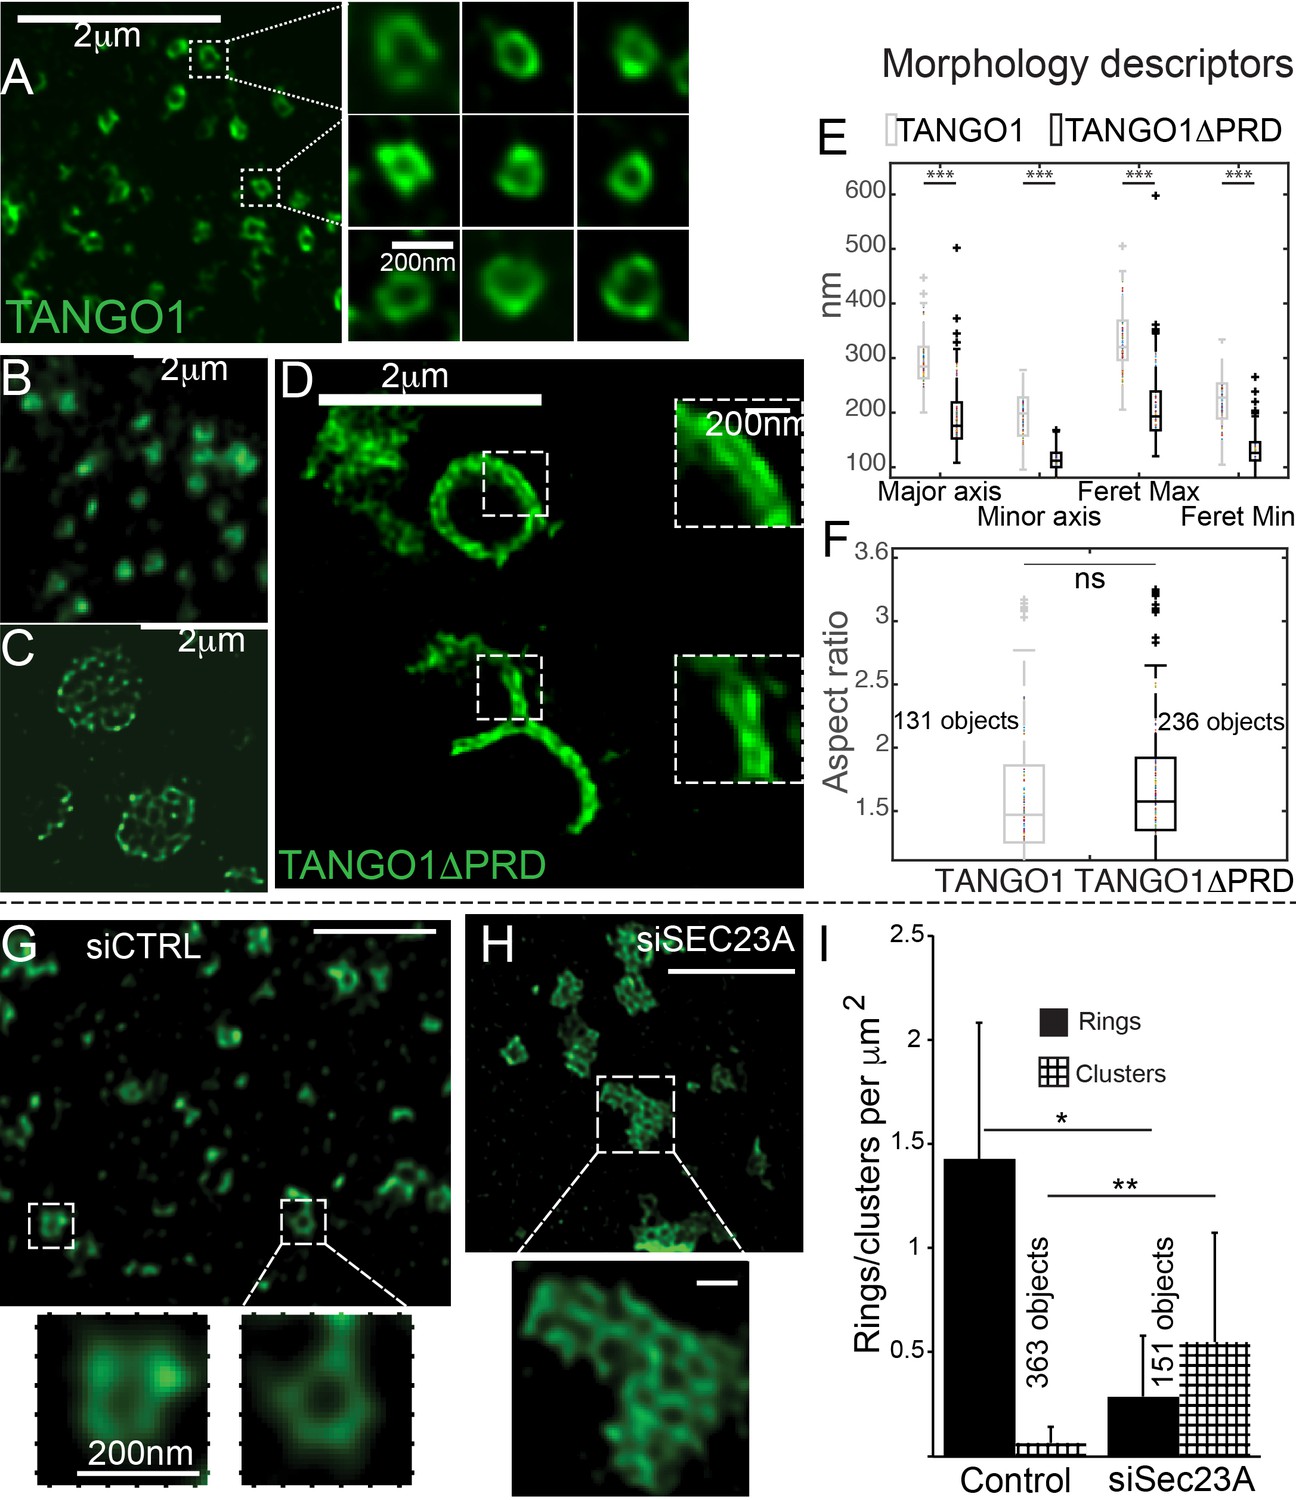
The role of COPII in assembly of TANGO1 into rings.
In TANGO1 knockout cells, various constructs of TANGO1 were expressed and visualized by STED microscopy. (A) Full-length TANGO1 forms rings. (B) TANGO1ΔPRD forms small distinct rings, (C) rings fused into a planar tessellation or (D) rings fused in long linear rows. (E) Quantification of size, shown as a scatter plot and box plot of measured morphological descriptors: major axis and minor axis, diameter of a fitted ellipse, maximum and minimum Feret’s diameters. Quantification of shape, shown as a scatter and box plot (F) of the aspect ratio between the major and minor axes. 131 and 236 rings respectively were analysed for the two constructs. STED images of TANGO1 in siCTRL (G) or siSEC23A (H) treated RDEB/FB/C7. (I) Rings (solid bar) or clusters (checkered bar) in 22 siCTRL cells and 14 siSEC23A cells were manually counted and plotted, normalised to the area of collagen accumulations. (E) ***p<0.006; ns not significant. (I) **p<0.01, *p<0.05 (Student’s t test). Scale bars (A–D, G, H) 2 μm, insets 200 nm.
Figure 2—figure supplement 1
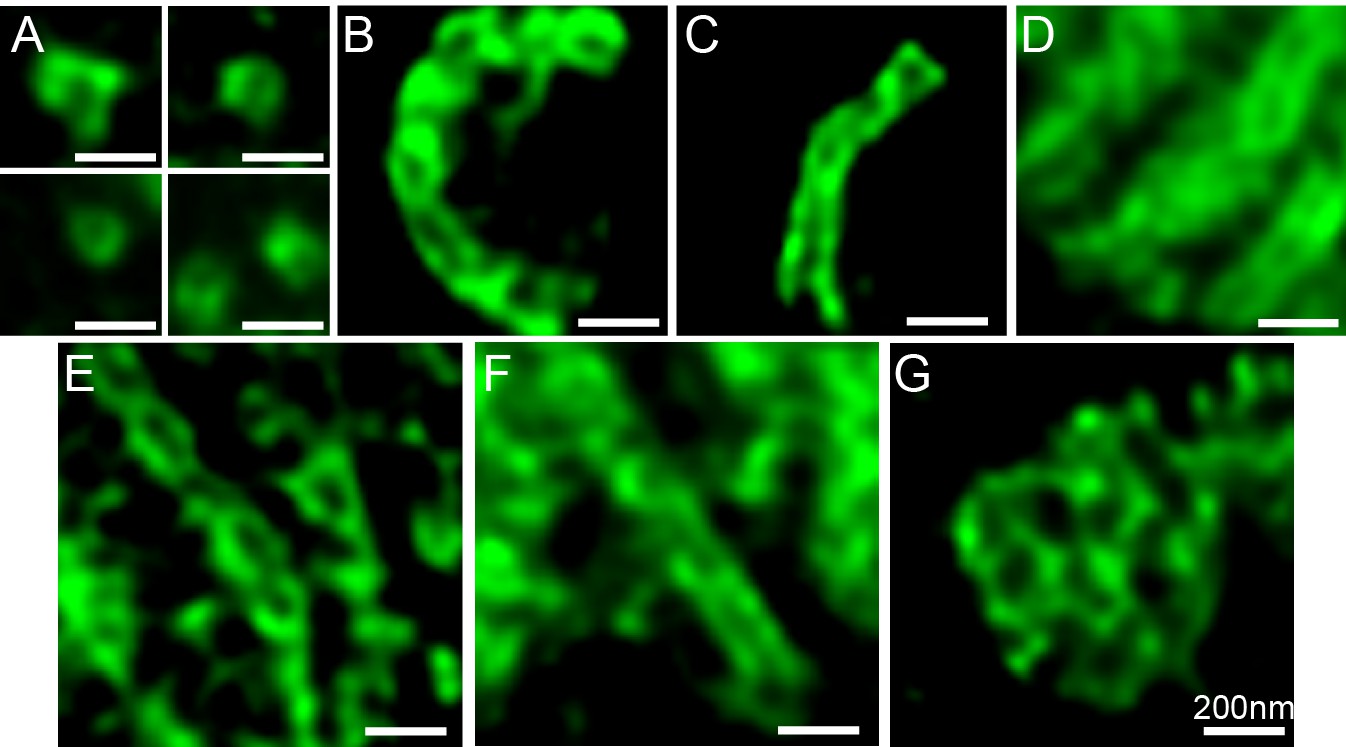
Structures formed by TANGO1ΔPRD.
Various structures observed on visualisation of TANGO1ΔPRD by STED microscopy. Scale bars 200 nm.
Figure 2—figure supplement 2

Image analysis workflow.
Illustration of image analysis pipeline. The original STED stack is first deconvolved using Huygens deconvolution software, followed by a Z-projection of subsets of stack slices. Compared to the whole-stack Z-projection, those generated from subsets could differentiate easier objects at different Z-depths. With a few manually placed strokes of pixel labels, the pixel classification workflow in ilastik was able to segment objects from background. Each object is further classified into one of the three classes: ring aggregates, rings, or dots (incomplete rings). This was achieved by the object classification workflow in ilastik, using a set of morphology features.
Figure 2—figure supplement 3

SEC23A is required for collagen secretion.
(A) The percentage of siCTRL or siSec23A-treated RDEB/FB/C7 with intracellular accumulations of collagen. Densitometric analysis of a blot of Sec23 to quantify the efficiency of knockdown (B, C), # non-specific band. siCTRL or siSEC23A-treated RDEB/FB/C7 lysates and medium were probed for collagen and ß-tubulin as a loading control (D), densitometric analysis (E) of the bands of collagen. (A) ***p<0.001 (Student’s t test); (E) *p<0.05 (Mann Whitney test).
Figure 2—figure supplement 4
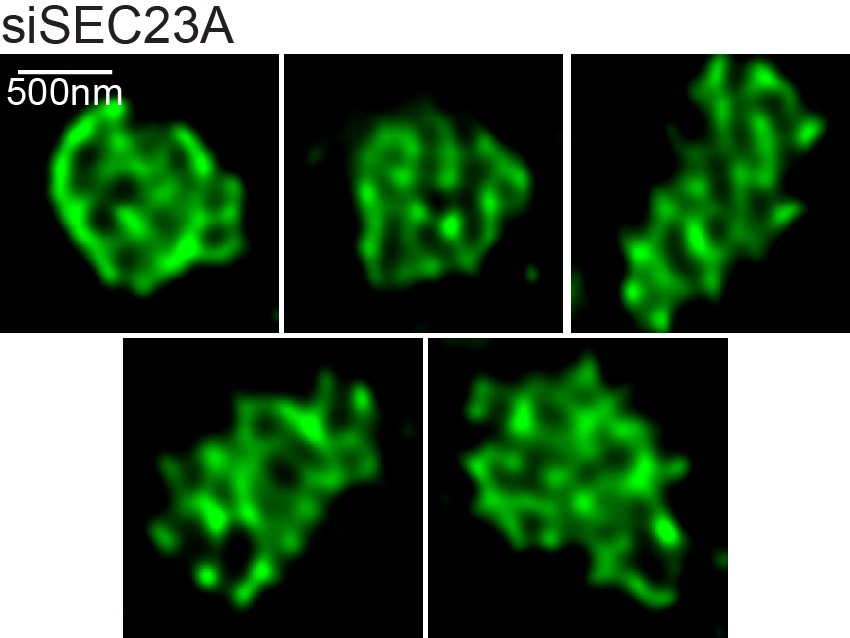
Structures formed by TANGO1 after depletion of SEC23A.
Further images of the various structures observed on visualisation of TANGO1 by STED microscopy in RDBE/FB/C7 cells with Sec23A depleted. Scale bars 500 nm.
Figure 3 with 2 supplements
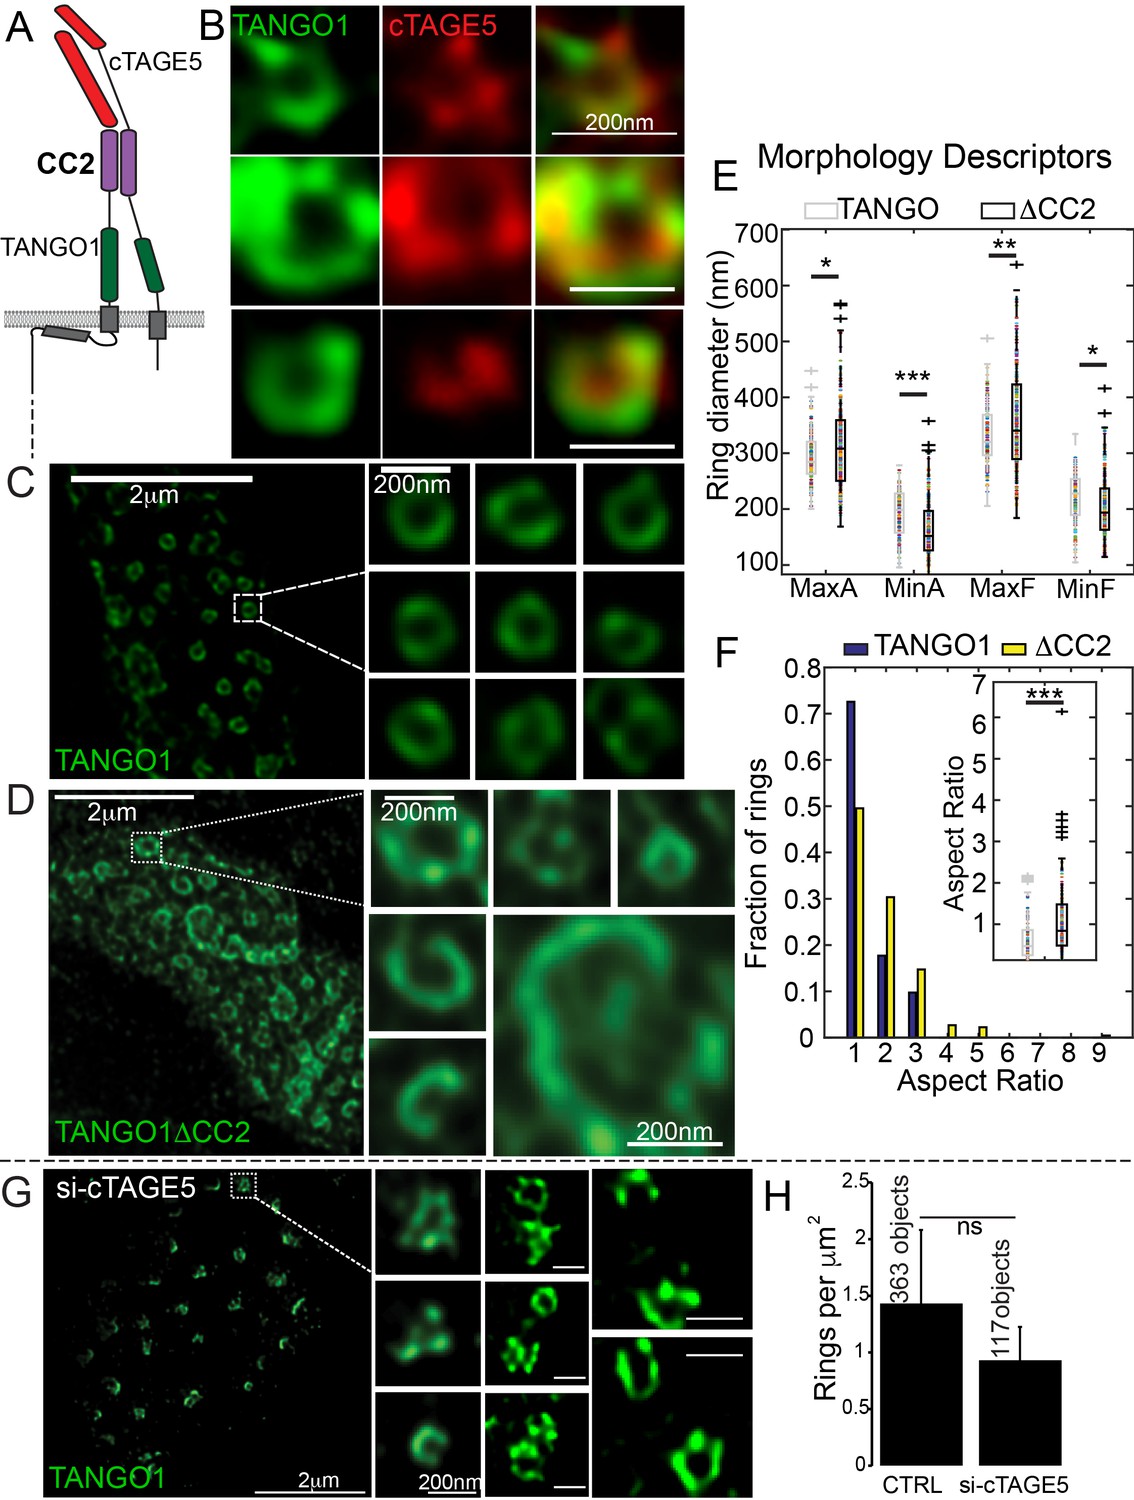
Lateral interactions in TANGO1 ring assembly mediated by cTAGE5.
(A) Schematic of the interaction of TANGO1 and cTAGE5. (B) STED images of TANGO1 and cTAGE5 in RDEB/FB/C7. 70 rings were manually counted from 12 cells and scored for cTAGE5 signal localisation within the ring. 21 rings showed peripherally located cTAGE5 while 49 had cTAGE5 within the ring formed by TANGO1. Rings of TANGO1 (C) and TANGO1ΔCC2 (D) in 2H5 cells. (E) scatter and box plots of measured morphological size descriptors: major and minor axes diameters of fitted ellipse (MaxA, MinA), and Feret’s diameter (MaxF, MinF). (F) Binning rings of TANGO1 (blue bars) and TANGO1ΔCC2 (yellow bars) by aspect ratio (major to minor axes of the fitted ellipse). Inset, quantification of shape, shown as scatter-plot and box plot of the aspect ratio. The number of rings analysed for the independent experiments are 131 and 228, respectively. (G) STED image of TANGO1 in si-cTAGE5 in RDEB/FB/C7. (H) Quantification of number of rings observed in control cells (22 cells) or si-cTAGE5 cells (13 cells) normalised to the area of collagen accumulations. Scale bars (B) 200 nm; (C, D) 2 μm, insets 200 nm (G) 1 μm; insets 200 nm, *p<0.05; **p<0.01; ***p<0.001, ns not significant.
Figure 3—figure supplement 1
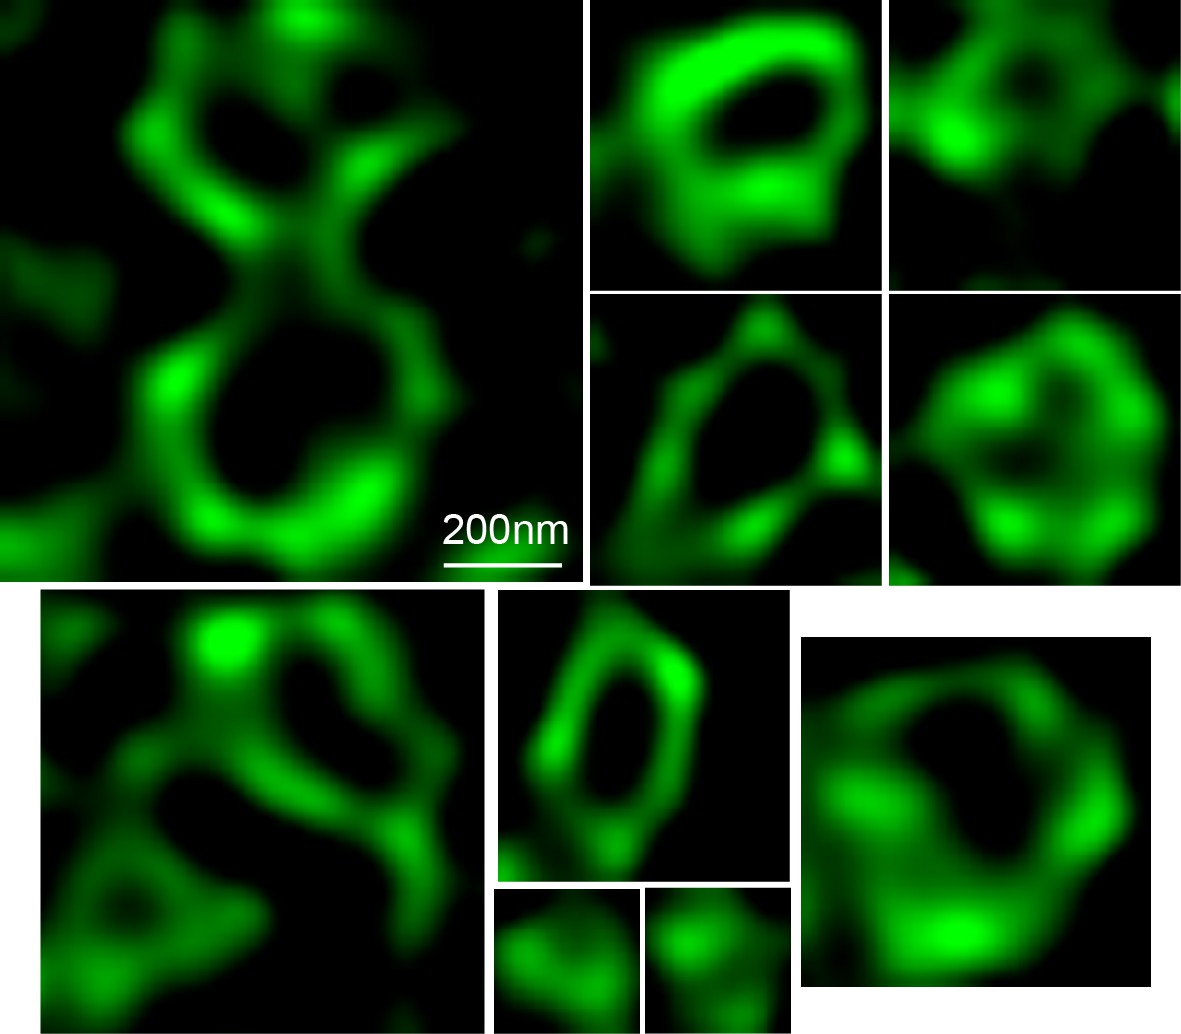
Structures formed by TANGO1ΔCC2.
STED images of structures formed by TANGO1ΔCC2. Scale bars 200 nm.
Figure 3—figure supplement 2
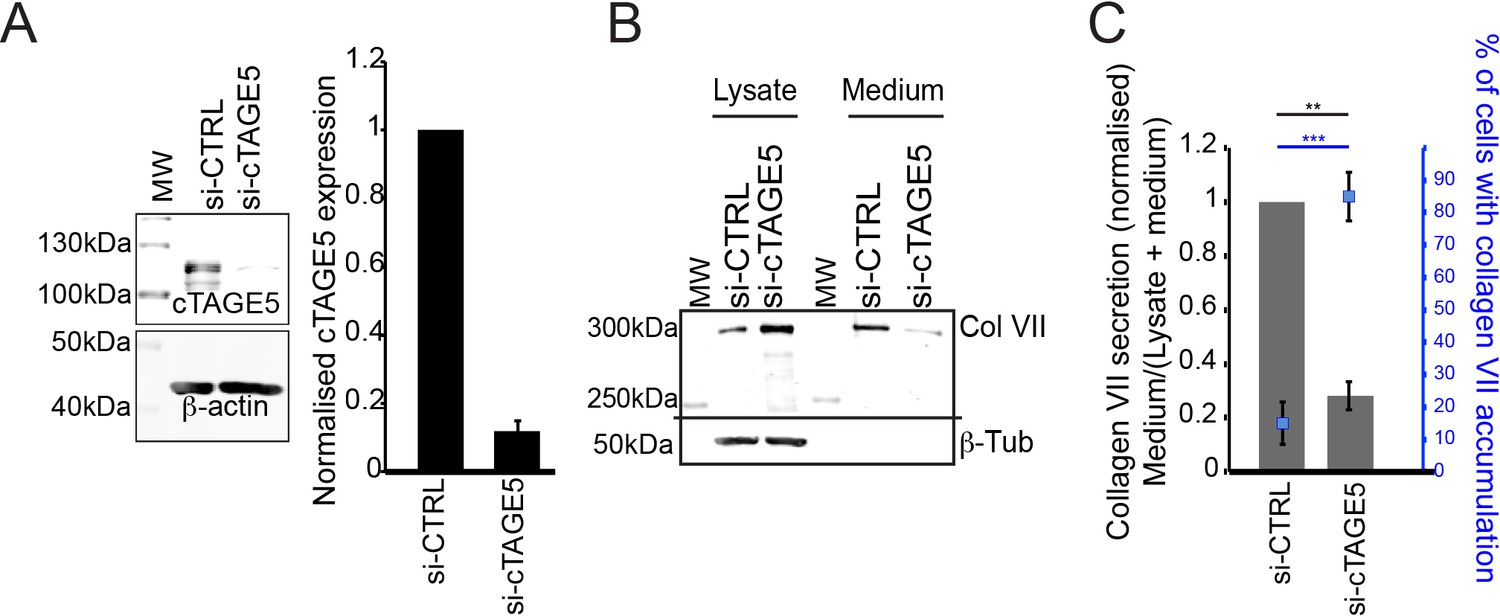
cTAGE5 is required for collagen secretion.
(A) Densitometric analysis of bands of cTAGE5 normalised to control. (B) Collagen VII from lysates or media of siRNA (si-CTRL or si-cTAGE5) treated RDEB/FB/C7 fibroblasts. β-tubulin is a loading and lysis control. MW – Molecular weight marker. (C) Densitometric analysis of collagen VII normalised to control and plotted as a bar graph. In blue, percentage of cells with intracellular accumulations of collagen VII after siRNA treatment. ***p<0.001, **p<0.01 (Student’s t test).
Figure 4 with 1 supplement

Lateral interactions in TANGO1 ring assembly mediated by TANGO1 self-association.
(A, B) Co-immunoprecipitation of TANGO1-FLAG with the indicated constructs in HEK293T cells. Lysates and immunoprecipitated samples were probed for HA, FLAG and cTAGE5. 2H5 cells co-transfected with collagen VII and (C) TANGO1ΔCC1 (16 cells imaged), (D) TANGO1Δ1255–1295 (15 cells imaged) or (E) TANGO1Δ1296–1336 (16 cells imaged), were imaged by STED microscopy. (F) Schematic of interactions between TANGO1, TANGO1-short and cTAGE5. Scale bars (C–E) 2 μm; insets 200 nm.
Figure 4—figure supplement 1
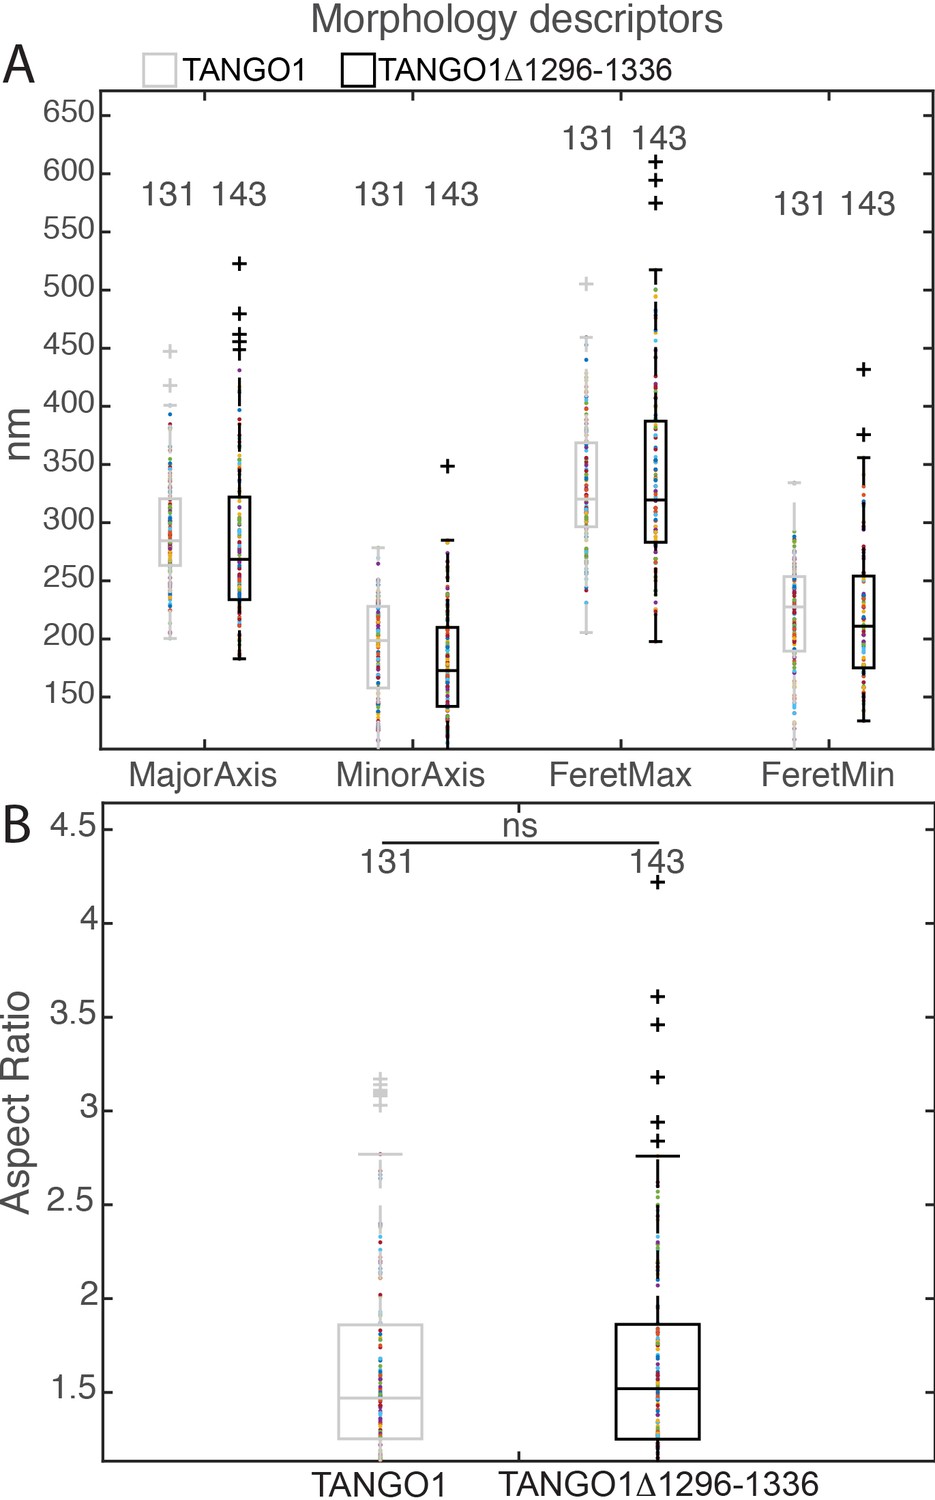
Morphological quantification of structures formed by TANGO1Δ1296–1336.
(A) Quantification of size of TANGO1 and TANGO1Δ1296–1336, shown as a scatter plot and box plot of measured morphological descriptors: major axis and minor axis of a fitted ellipse, maximum and minimum Feret’s diameters. (B) Quantification of shape, shown as a scatter and box plot of the aspect ratio between the major and minor axes. 131 and 143 rings respectively were analysed for the two constructs. ns not significant.
Figure 5
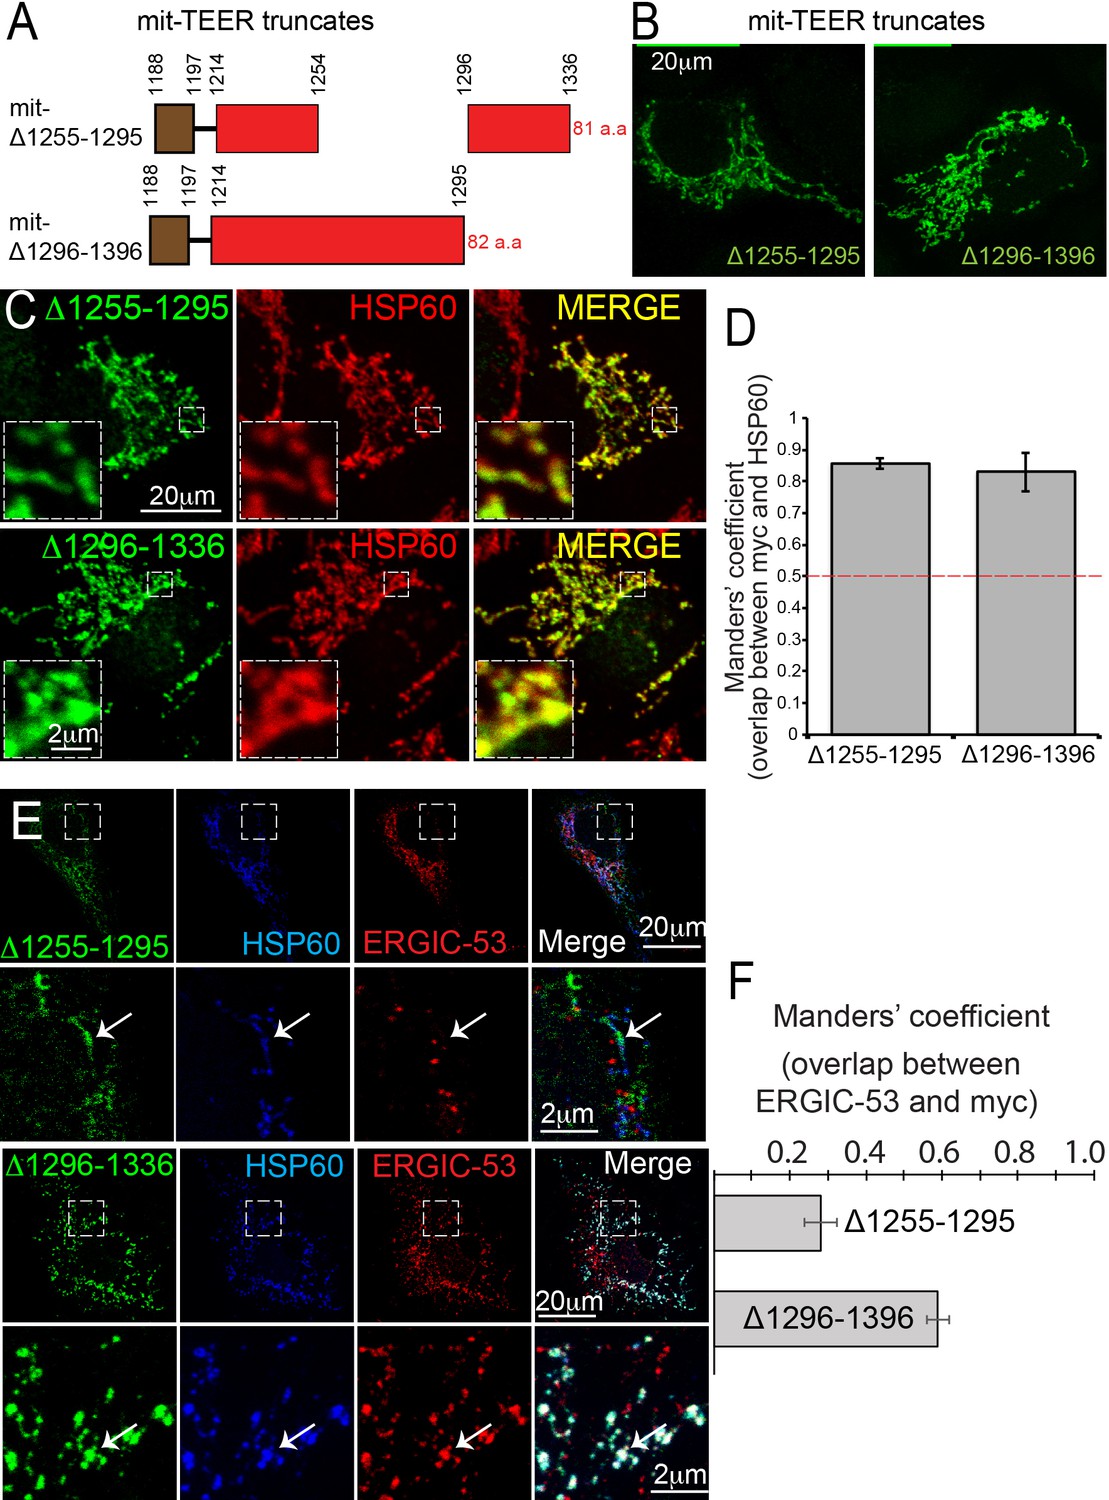
TANGO1 amino acids 1255–1295 are the minimal TEER.
(A) A schematic depiction of myc-epitope tagged mitochondrially-targeted (mit-TEER) truncates. (B) mit-TEER truncates were expressed in 2H5 cells, fixed and stained with anti-myc-antibody and visualised with confocal microscopy. (C) mit-TEER truncates were expressed in 2H5 cells, which were fixed and stained using anti-myc antibody (green) and, as a mitochondrial marker, anti-HSP60 antibody (red). (D) Overlap of the signal from myc and HSP60 was quantified and plotted as the Manders’ overlap coefficient for the two constructs (mit-Δ1255–1295 and mit-Δ1296–1336 respectively). (E) 2H5 cells were transfected with mit-Δ1255–1295 or mit-Δ1296–1336, fixed, and stained with anti-myc, anti-HSP60 and anti-ERGIC-53 antibodies. Arrows indicate myc staining with or without colocalised ERGIC-53 staining. (F) The extent of overlap of ERGIC-53 and myc was quantified and plotted as the Manders’ overlap coefficient for mit-Δ1255–1295 and mit-Δ1296–1336, respectively. Scale bars: (B, C, E and F) 20 μm; inset 2 μm.
Figure 6 with 2 supplements
The NRZ tether links TANGO1 to ERGIC membranes.
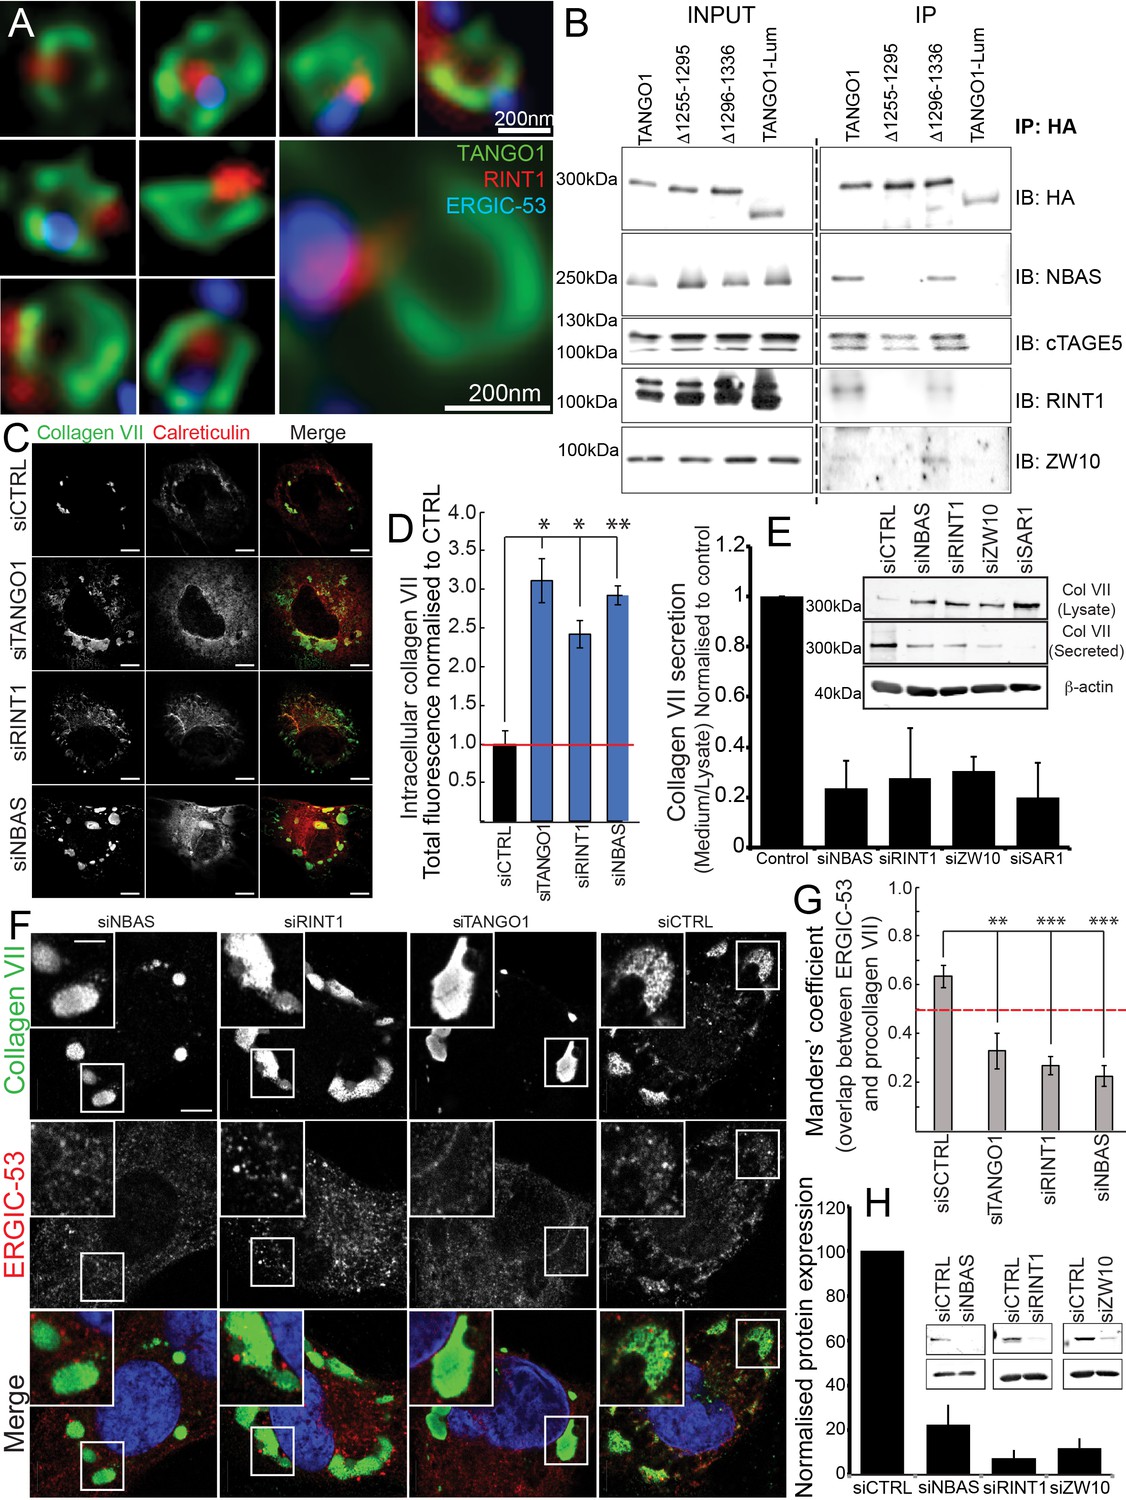
(A) Rings of TANGO1 (green) in RDEB/FB/C7 cells with RINT1 (red) and ERGIC-53 (blue). Deconvolved z-stacks of ten cells were used to quantify the location of the tether protein RINT1 relative to a ring of TANGO1. 90 rings of TANGO1 were manually scored, three adjacent slices in the image stack were used to identify signal from RINT1 in the vicinity of the ring of TANGO1. 23 rings showed RINT1 within the ring, 19 rings showed RINT1 on the circumference (at the edge) of the ring, 39 had RINT1 outside the ring, nine rings showed no detectable RINT1. (B) TANGO1, TANGO1Δ1255–1295, TANGO1Δ1296–1336 and TANGO1-Lum were expressed in HEK293T cells and immunoprecipitated. Samples were probed for NBAS, RINT1, cTAGE5 and ZW10. TANGO1 and TANGO1Δ1296–1336 immunoprecipitated all four proteins, but TANGO1Δ1255–1295 did not immunoprecipitate tether proteins. TANGO1-Lum did not pull down any of the four proteins. (C) RDEB/FB/C7 were transfected with siRNA (siCTRL, siNBAS, siRINT1 and siTANGO1) and immunostained for intracellular collagen VII (red) and calreticulin (green). (D) Quantification of fluorescence associated with intracellular collagen VII in (C). (E) Collagen VII secreted by RDEB/FB/C7 was looked at as the ratio of collagen in the medium to the lysate, quantified, and plotted as the average of values from at least three independent experiments. β-actin is a loading control. (F) siRINT1-, siNBAS- and siTANGO1-treated RDEB/FB/C7 were stained for collagen VII and ERGIC-53. (G) A plot of Manders’ overlap coefficient for ERGIC-53 and collagen VII from (F) used to quantify ERGIC-53 localisation to collagen accumulations. (H) Representative blots showing the efficiency of knockdown of NBAS, RINT1 and ZW10, quantified and plotted as the average ±s.d. from at least three independent experiments. ***p<0.001; **p<0.01. Scale bars (A) 200 nm, (C, F) 10 μm, (C) inset) 5 μm.
Figure 6—figure supplement 1
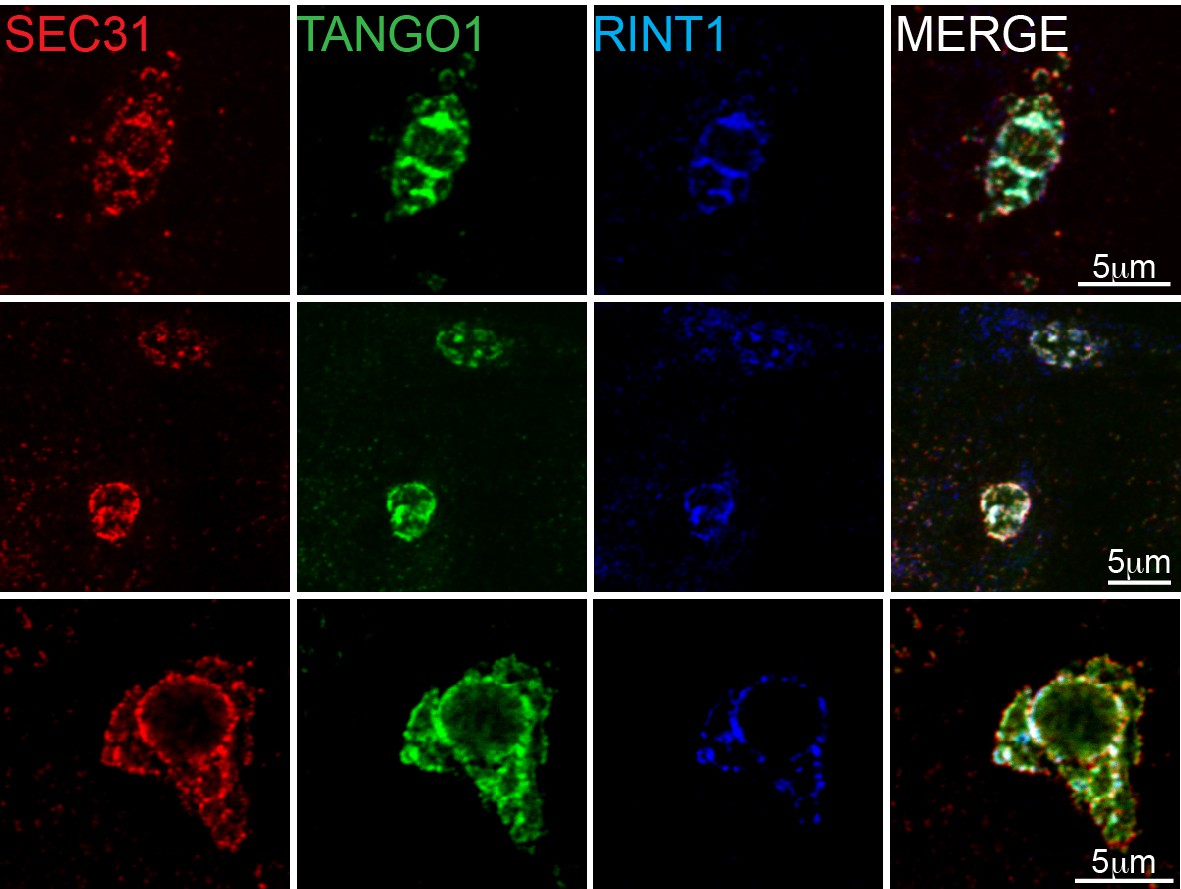
RINT1 is recruited to exit sites at collagen accumulations.
Collagen accumulations in RDEB/FB/C7 cells were visualised for Sec31 (red), TANGO1 (green) and RINT1 (blue). Colocalisation at these patches was measured by the Manders’ overlap coefficient of 0.691 ± 0.124 (s.d.) of RINT1 with TANGO1. Scale bars 5 μm.
Figure 6—figure supplement 2

RINT1 localises to one or two puncta in a TANGO1 ring.
RDEB/FB/C7 cells were visualised for TANGO1 (green) and RINT1 (red) Fourteen examples are shown here. Scale bar 200 nm.
Figure 7 with 1 supplement
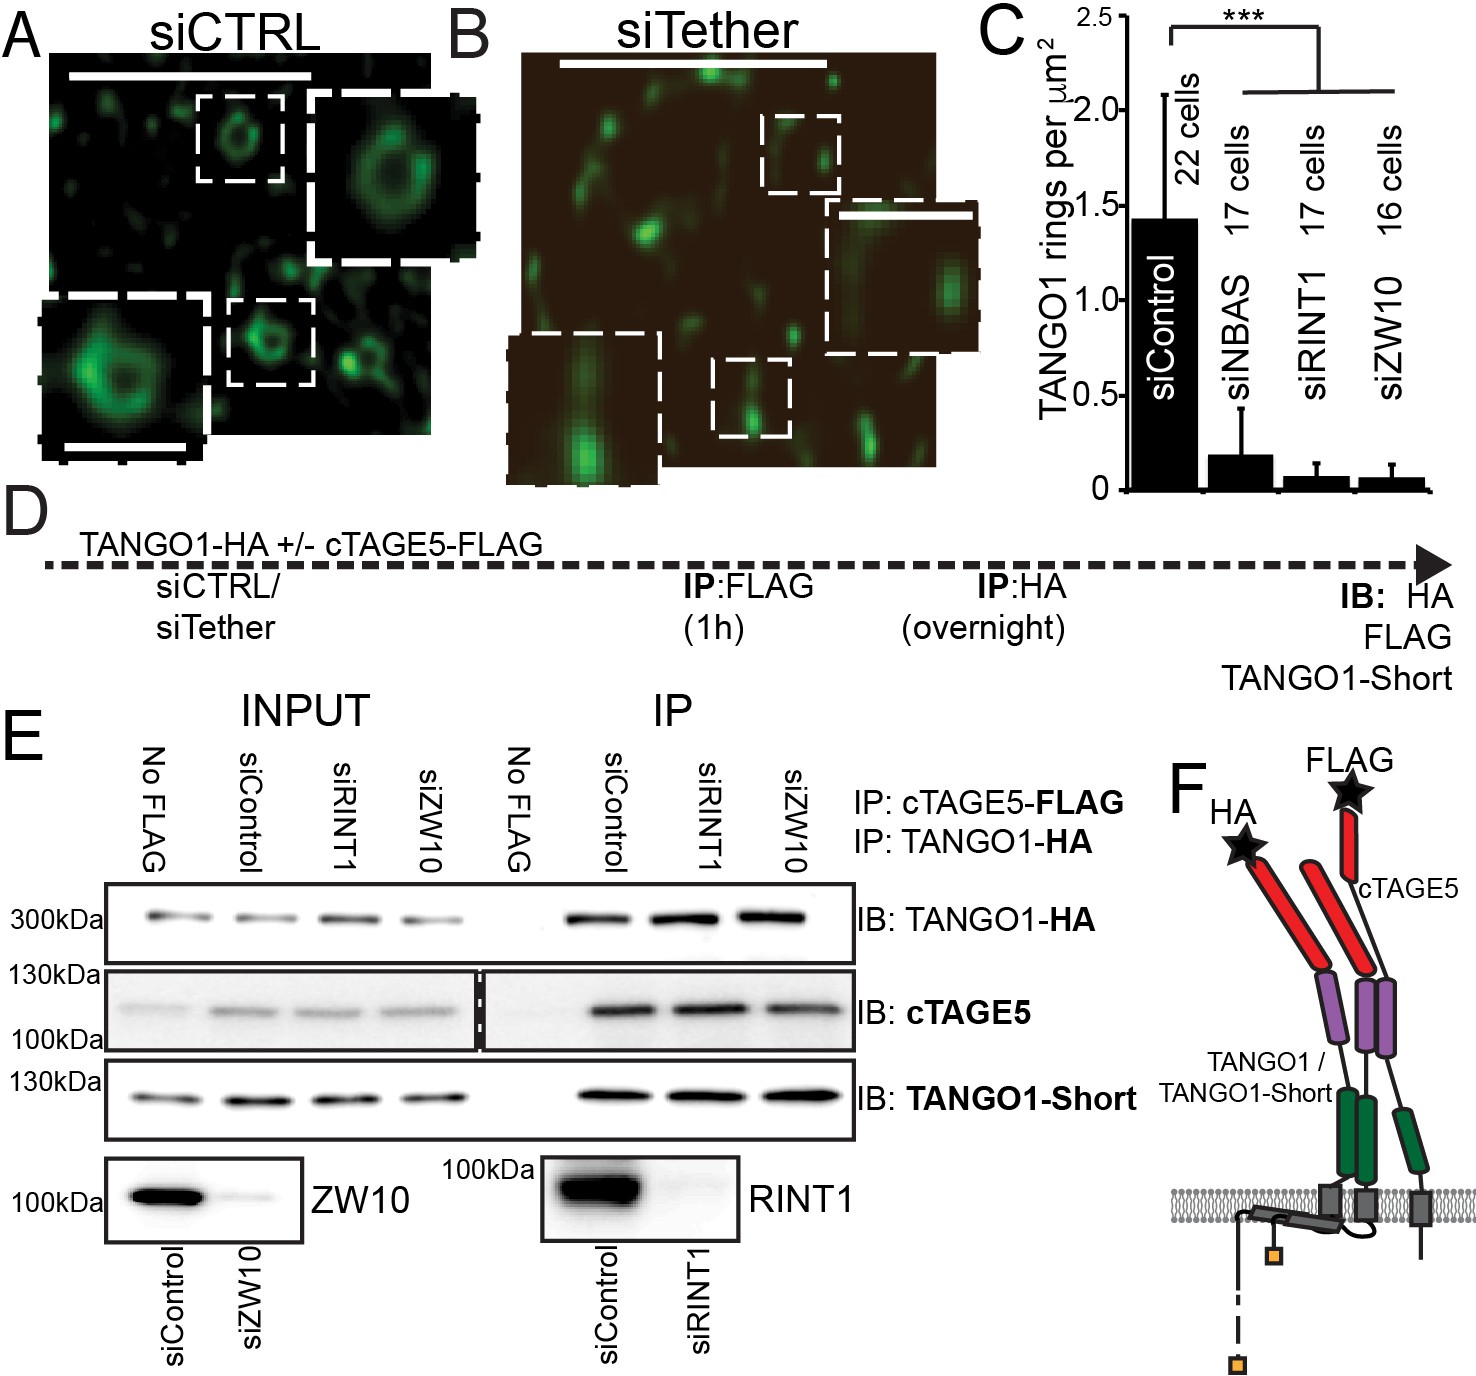
The NRZ tether is required for TANGO1 ring assembly siCTRL (A), siRINT1 (B), siNBAS, and siZW10 treated RDEB/FB/C7 were imaged by STED microscopy.
TANGO1 rings in control cells (A). Representative image of a cell treated with siRINT1, showing almost no detectable assemblies of TANGO1 (B). The number of rings in each condition were manually counted and plotted (C) normalised to the area of collagen accumulations. The number of cells used in the quantification for each condition is indicated. (D) Schematic of experiment. Cells transfected with siRNA control, RINT1 or ZW10, lysed and subjected to sequential immunoprecipitations, (E). Eluates were probed for TANGO1-HA, cTAGE5, TANGO1-short. Cells with only TANGO1-HA (no cTAGE5-FLAG) were used as a negative control. Knockdown of RINT1 and ZW10 were confirmed by western blotting. (F) Schematic of a complex of TANGO1, TANGO1-short and cTAGE5 indicating positions of antibody epitopes used in the co-immunoprecipitations. Scale bars, (A, B) 1 μm, inset 400 nm. (C) ***p<0.001 (Student’s t test).
Figure 7—figure supplement 1
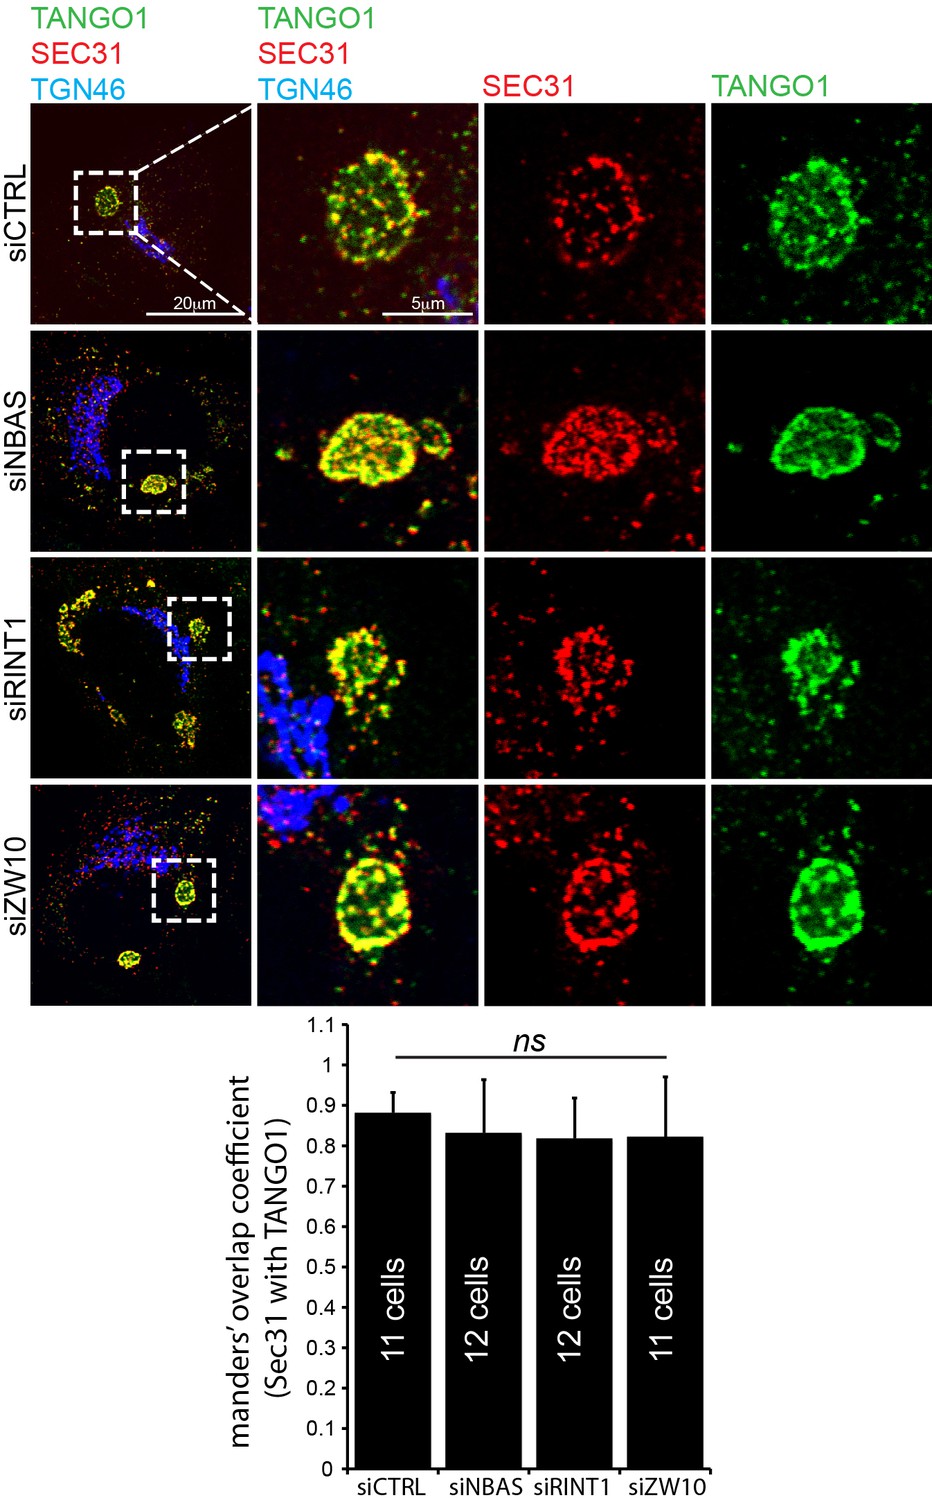
ERES still form at collagen after depletion of tether proteins.
After depleting cells of NBAS, RINT1 or ZW10, cells are visualised by confocal microscopy for Sec31 (red), TANGO1 (green) and TGN46 (blue). Under these experimental conditions, exit sites still form and show a clear association between Sec31 and TANGO1. Scale bars 20 μm, insets 5 μm.
Figure 8
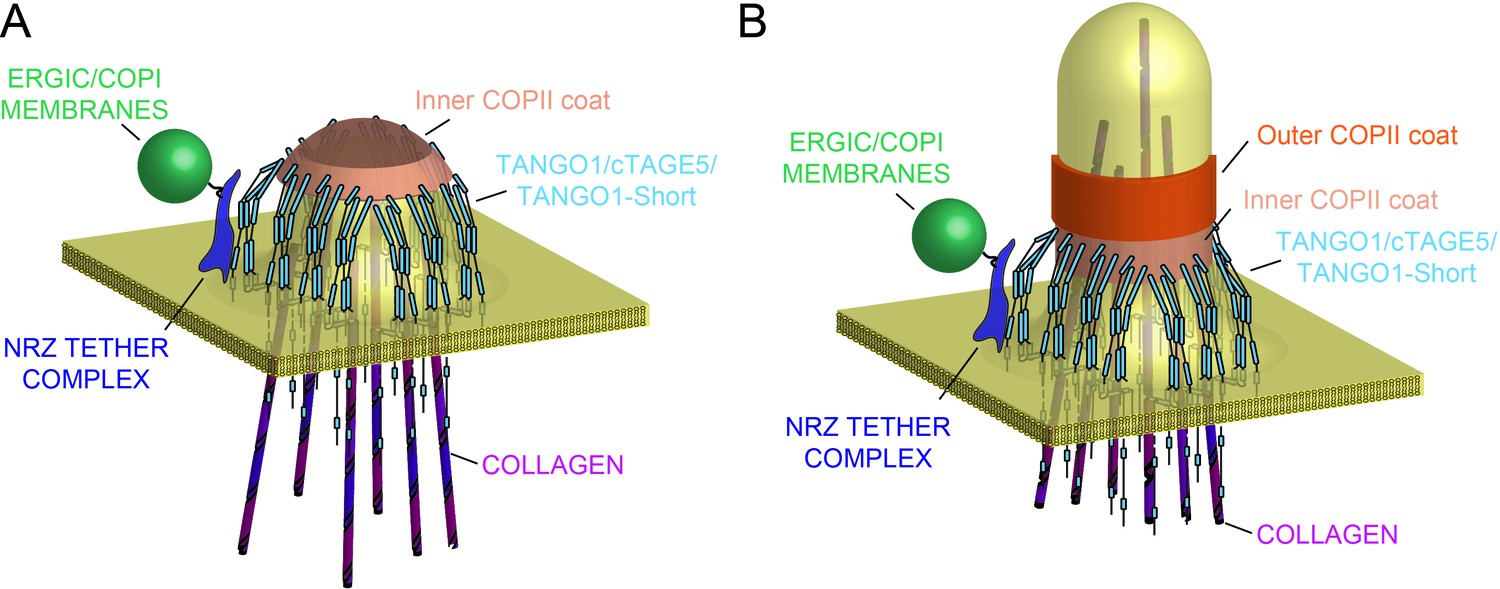
Model of TANGO1 ring assembly at an ERES.
(A) TANGO1-family proteins (cyan) assembly into a ring at an ERES is mediated by interactions 1. with COPII (orange) 2. with triple helical collagen (purple), 3. amongst the TANGO1 family proteins 4. with the NRZ tether (dark blue) which links TANGO1 to ERGIC membranes. TANGO1 delays the binding of the outer COPII coat to allow a mega carrier to form. (B) The cytoplasmic bud grows to a size that encapsulates collagen trimers. In this form, we suggest that the neck of this tubule is covered in the inner COPII coat bound to TANGO1, which prevents premature recruitment of outer COPII coat, thereby controlling the timing of membrane fission.
Tables
Table 1
Quantification of the size and shape of rings formed by TANGO1 and its mutant forms.
https://doi.org/10.7554/eLife.32723.009| Major axis (nm) | Minor axis (nm) | Feret’s major axis (nm) | Feret’s minor axis (nm) | Objects counted | Cells imaged | |
|---|---|---|---|---|---|---|
| TANGO1 | 293 ± 47 | 191 ± 43 | 330 ± 53 | 221 ± 46 | 131 | 44 |
| TANGO1ΔPRD | 192 ± 55 | 115 ± 19 | 210 ± 59 | 130 ± 29 | 236 | 40 |
| TANGO1ΔCC2 | 313 ± 77 | 164 ± 50 | 358 ± 90 | 203 ± 56 | 228 | 51 |
Additional files
-
Transparent reporting form
- https://doi.org/10.7554/eLife.32723.022
Download links
A two-part list of links to download the article, or parts of the article, in various formats.
Downloads (link to download the article as PDF)
Open citations (links to open the citations from this article in various online reference manager services)
Cite this article (links to download the citations from this article in formats compatible with various reference manager tools)
TANGO1 builds a machine for collagen export by recruiting and spatially organizing COPII, tethers and membranes
eLife 7:e32723.
https://doi.org/10.7554/eLife.32723


