MELK expression correlates with tumor mitotic activity but is not required for cancer growth
- Cold Spring Harbor Laboratory, United States
- Google, Inc., United States
Figures
Figure 1 with 1 supplement
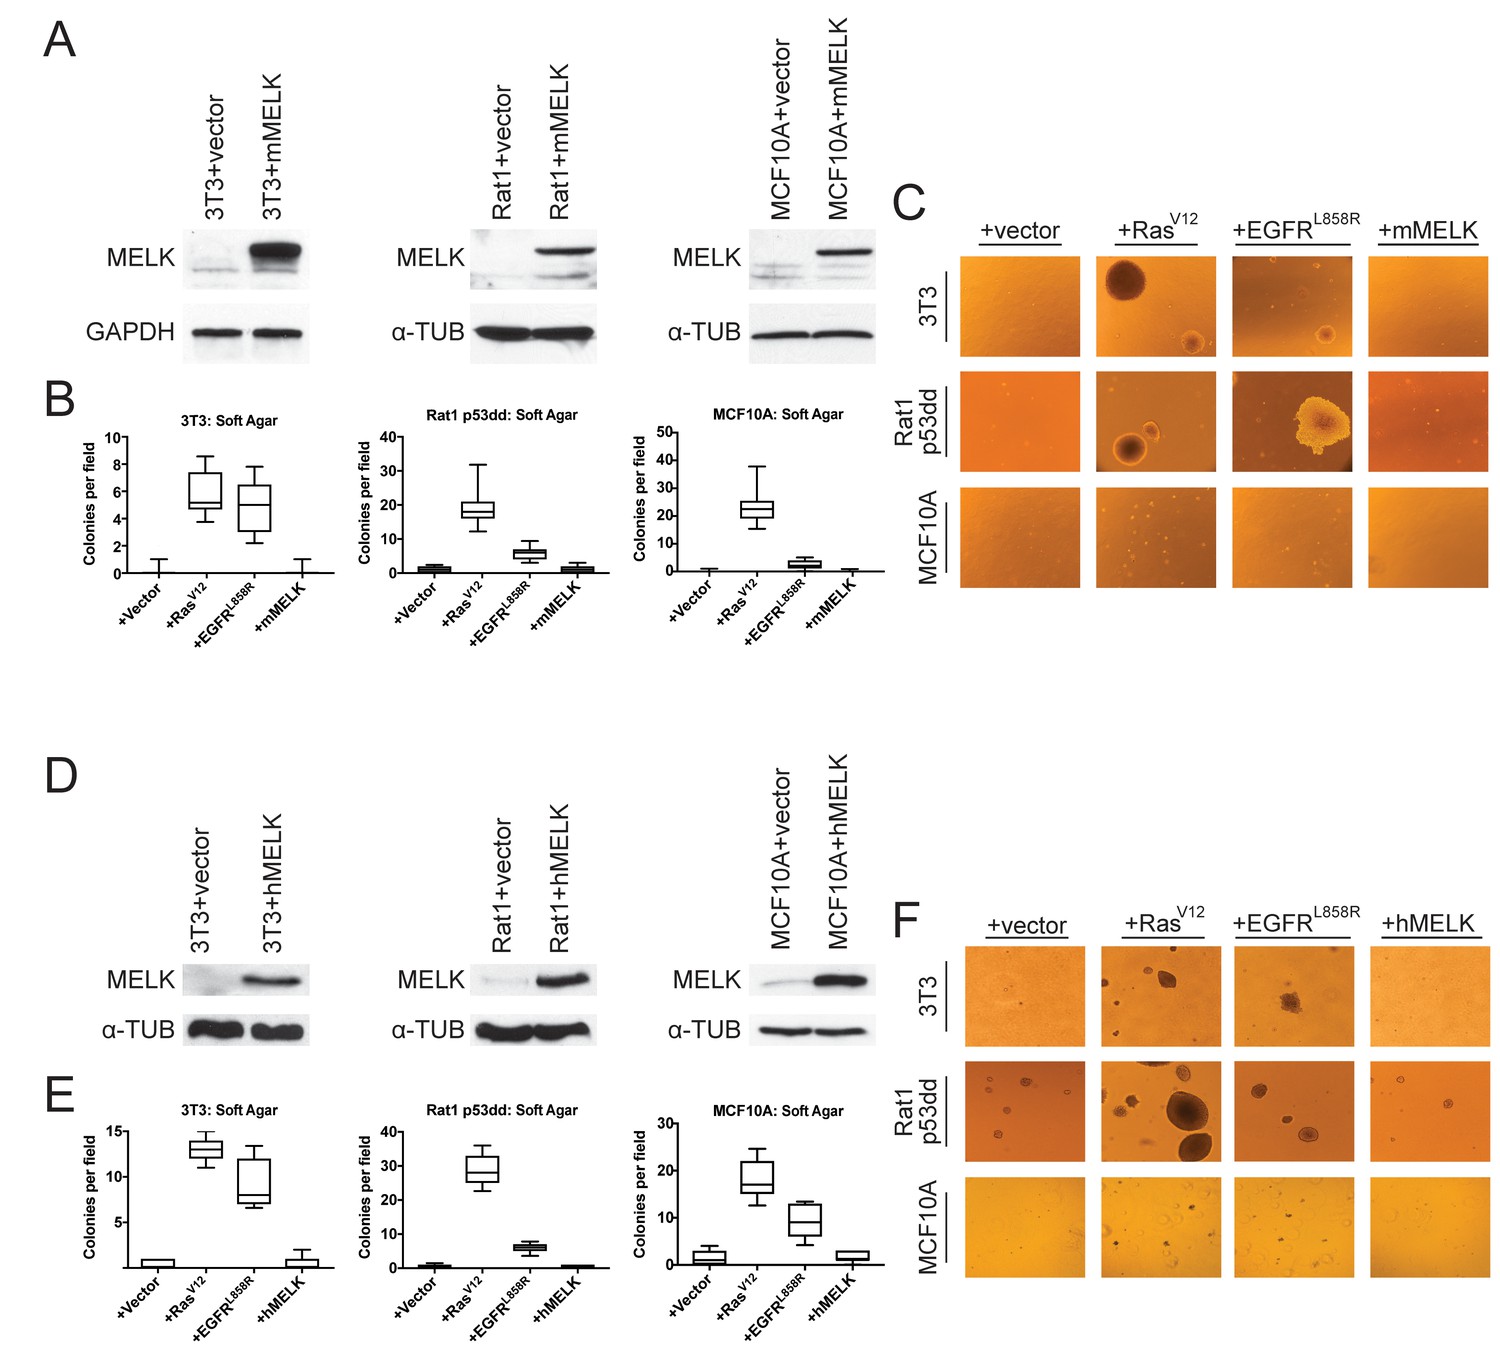
MELK over-expression fails to confer anchorage-independent growth.
(A) Western blot analysis of mouse MELK over-expression in 3T3, Rat1-p53dd, and MCF10a cell lines. (B) Quantification of colony formation of control and mouse MELK over-expressing cell lines in soft agar. For each assay, colonies were counted in at least 15 fields under a 10x objective. Boxes represent the 25th, 50th, and 75th percentiles of colonies per field, while the whiskers represent the 10th and 90th percentiles. (C) Representative images of the indicated cell lines grown in soft agar. (D) Western blot analysis of human MELK over-expression in 3T3, Rat1-p53dd, and MCF10a cell lines. (E) Quantification of colony formation of control and human MELK over-expressing cell lines in soft agar. For each assay, colonies were counted in at least 15 fields under a 10x objective. Boxes represent the 25th, 50th, and 75th percentiles of colonies per field, while the whiskers represent the 10th and 90th percentiles. (F) Representative images of the indicated cell lines grown in soft agar.
Figure 1—figure supplement 1

Ectopically-expressed MELK exhibits a phospho-shift in mitosis.
(A) Western blot analysis of 3T3 cells transduced with mouse MELK or with an empty vector. The cells were grown asynchronously or arrested in mitosis with 300 ng/ml nocodazole for 18 hr. (B) Western blot analysis of 3T3 and Rat1-p53dd cells transduced with human MELK or with an empty vector, and the human breast cancer cell line MDA-MB-231. The cells were grown asynchronously or arrested in mitosis with 100 ng/ml nocodazole for 18 hr.
Figure 2 with 2 supplements
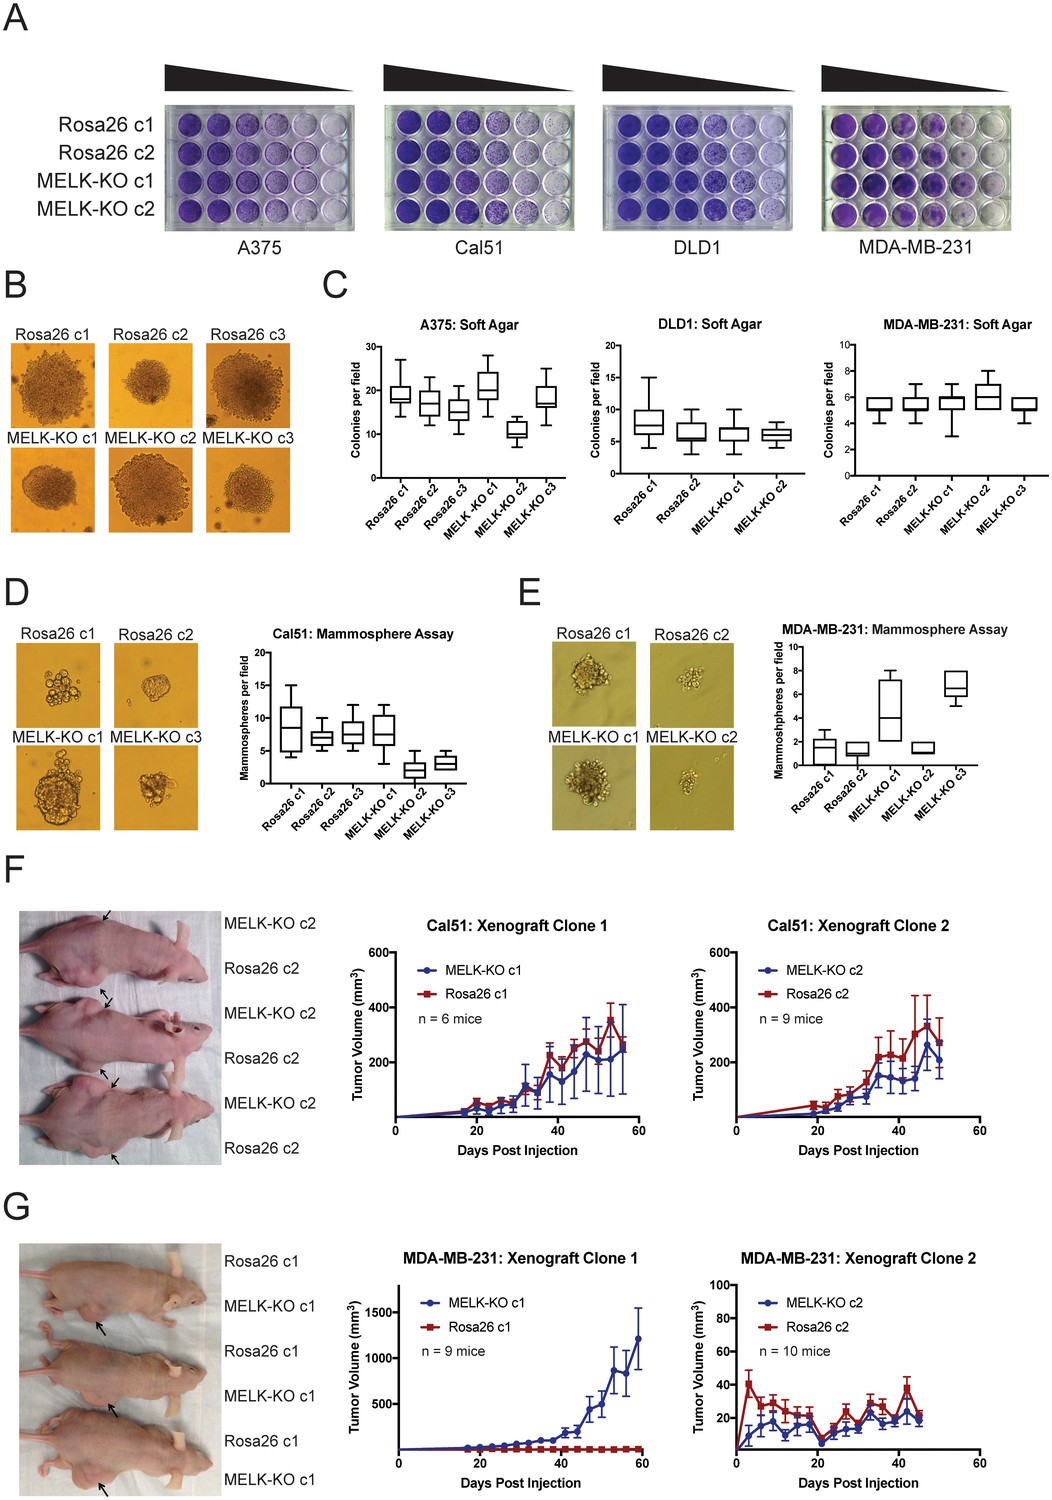
MELK is dispensable for growth in vitro and in vivo.
(A) Crystal violet staining of serial dilution plates of control and MELK knockout clones from A375 (melanoma), Cal51 (breast cancer), DLD1 (colorectal cancer), and MDA-MB-231 (breast cancer) cell lines. (B) Representative images of colonies of A375 control and MELK knockout clones grown in soft agar. (C) Quantification of colony formation in A375, DLD1, and MDA-MB-231 MELK-KO and control clones. For each assay, colonies were counted in at least 15 fields under a 10x objective. Boxes represent the 25th, 50th, and 75th percentiles of colonies per field, while the whiskers represent the 10th and 90th percentiles. (D–E) Representative images and quantification of mammosphere growth in Cal51 or MDA-MB-231 MELK-KO and control clones. For each assay, mammospheres were counted in at least six fields under a 10x objective. Boxes represent the 25th, 50th, and 75th percentiles of colonies per field, while the whiskers represent the 10th and 90th percentiles. (F–G) Representative images and quantification of xenograft growth in nude mice. Cal51 and MDA-MB-231 MELK-KO and control clones were injected subcutaneously into nude mice, and then tumor growth was measured every 3 days. Arrows indicate the location of the tumor. Error bars in the volume measurements indicate the standard error.
Figure 2—figure supplement 1
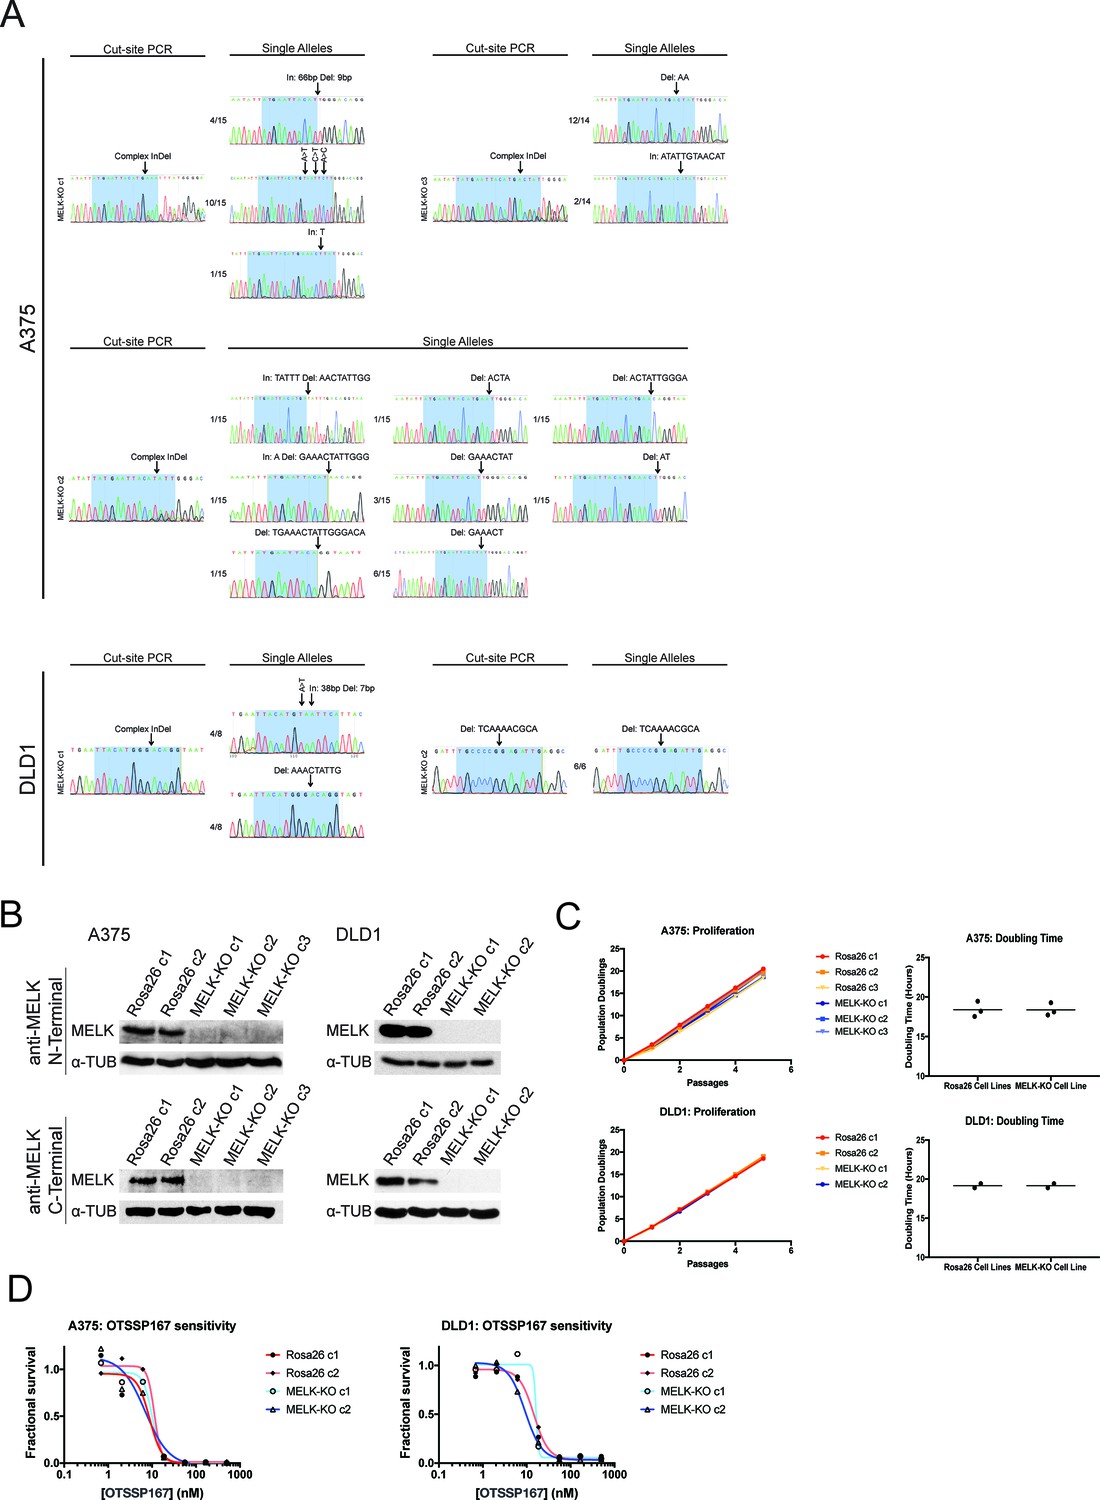
Generation and characterization of MELK-KO clones in A375 and DLD1.
(A) Sanger sequencing of either the PCR-amplified cut-site or single alleles isolated by TOPO cloning from MELK knockout clones in the A375 (melanoma) and DLD1 (colorectal cancer) cell lines. Highlighted regions indicate bases recognized by the gRNA. Of note, in A375 MELK-KO c2 we recovered seven different indel mutations in the MELK gene. We believe that at the time of single-cell sorting, one allele in this cell had acquired a small deletion that did not fully abolish gRNA recognition. Then, during clonal expansion, this allele underwent additional mutagenesis to generate the multiple large indels that we recovered. Additionally, in A375 MELK-KO c1, we identified one allele that had three different single-nucleotide substitutions that generated three independent missense mutations (E15V, T16I, I17L). These mutations occur in a highly-conserved region of the protein, and Ile17 is predicted to form a part of MELK’s ATP-binding domain, likely explaining why this allele is non-functional. (B) Western blot analysis of A375 and DLD1 MELK-KO clones using an antibody that recognizes an epitope in the MELK N-terminus (Abcam; Cat. No. ab108529) or an antibody that recognizes an epitope in the MELK C-terminus (Cell Signal; Cat. No. 2274S). (C) Proliferation and doubling time analysis of A375 and DLD1 Rosa26 and MELK-KO clones. (D) Dose-response curves of the putative MELK inhibitor OTS167 in A375 and DLD1 Rosa26 and MELK-KO clones.
Figure 2—figure supplement 2
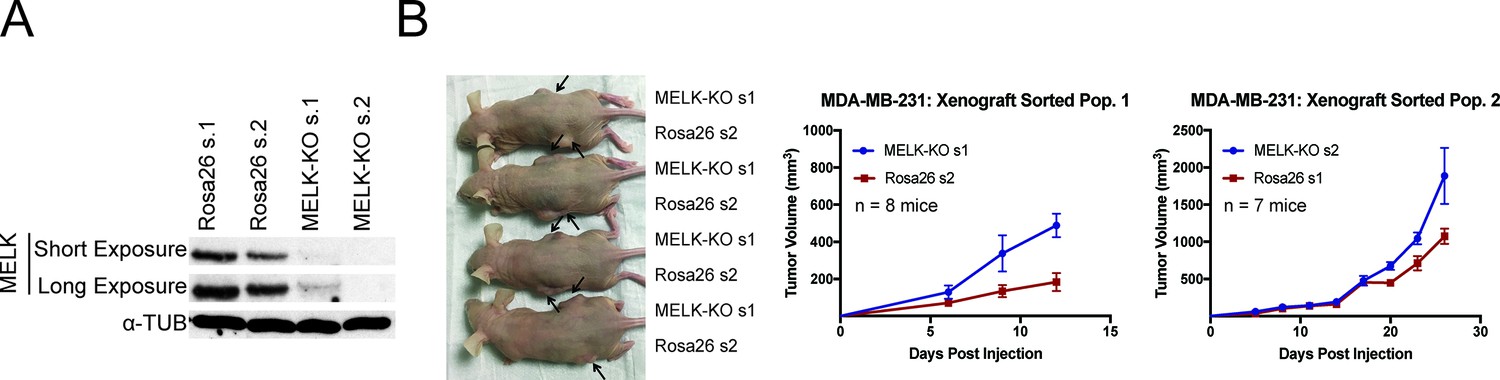
MELK is dispensable for tumor formation in heterogeneous MDA-MB-231 populations.
(A) Western blot analysis of MDA-MB-231 cells transduced with guides targeting Rosa26 or MELK. (B) Representative images and quantification of xenograft growth in nude mice. MDA-MB-231 control and MELK-mutant populations were injected subcutaneously into nude mice, and then tumor growth was measured every 3 days. Mice injected with MDA-MB-231 sorted population one had to be euthanized 15 days post injection due to health issues. Arrows indicate the location of the tumor. Error bars in the volume measurements indicate the standard error.
Figure 3 with 1 supplement
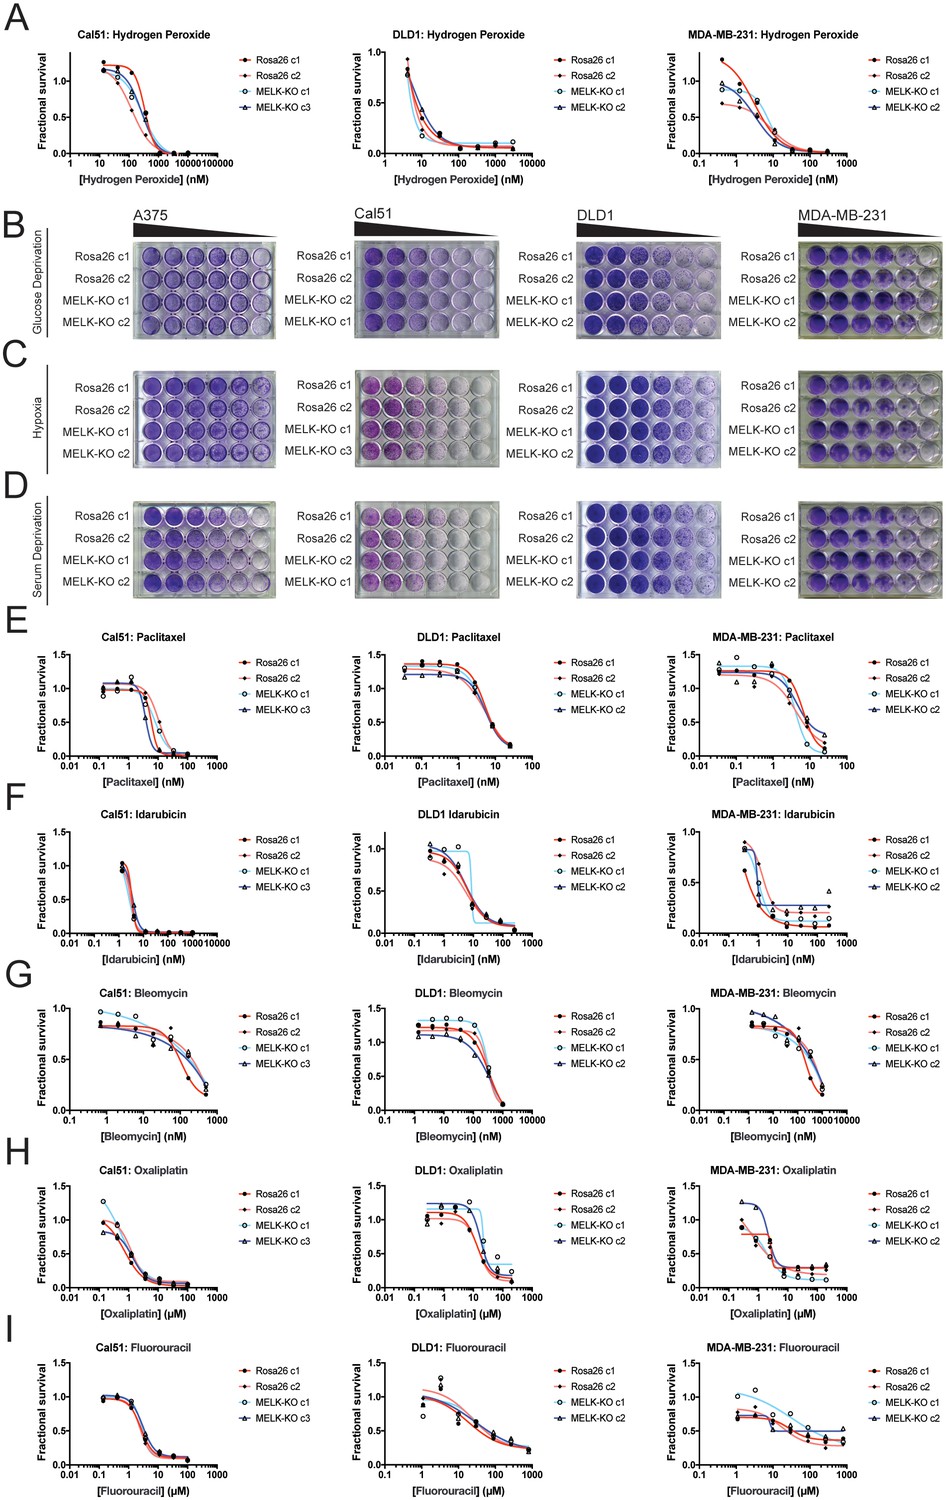
MELK is not required for growth under stress.
(A) Dose-response curves of Cal51, DLD1, and MDA-MB-231 Rosa26 and MELK-KO clones grown in the presence of H2O2. (B–D) Crystal violet staining of A375, Cal51, DLD1, and MDA-MB-231 Rosa26 and MELK-KO clones grown as serial dilutions under the indicated stressful culture condition. (E–I) Dose-response curves of Cal51, DLD1, and MDA-MB-231 Rosa26 and MELK-KO clones grown in the presence of the indicated chemotherapy drug.
Figure 3—figure supplement 1
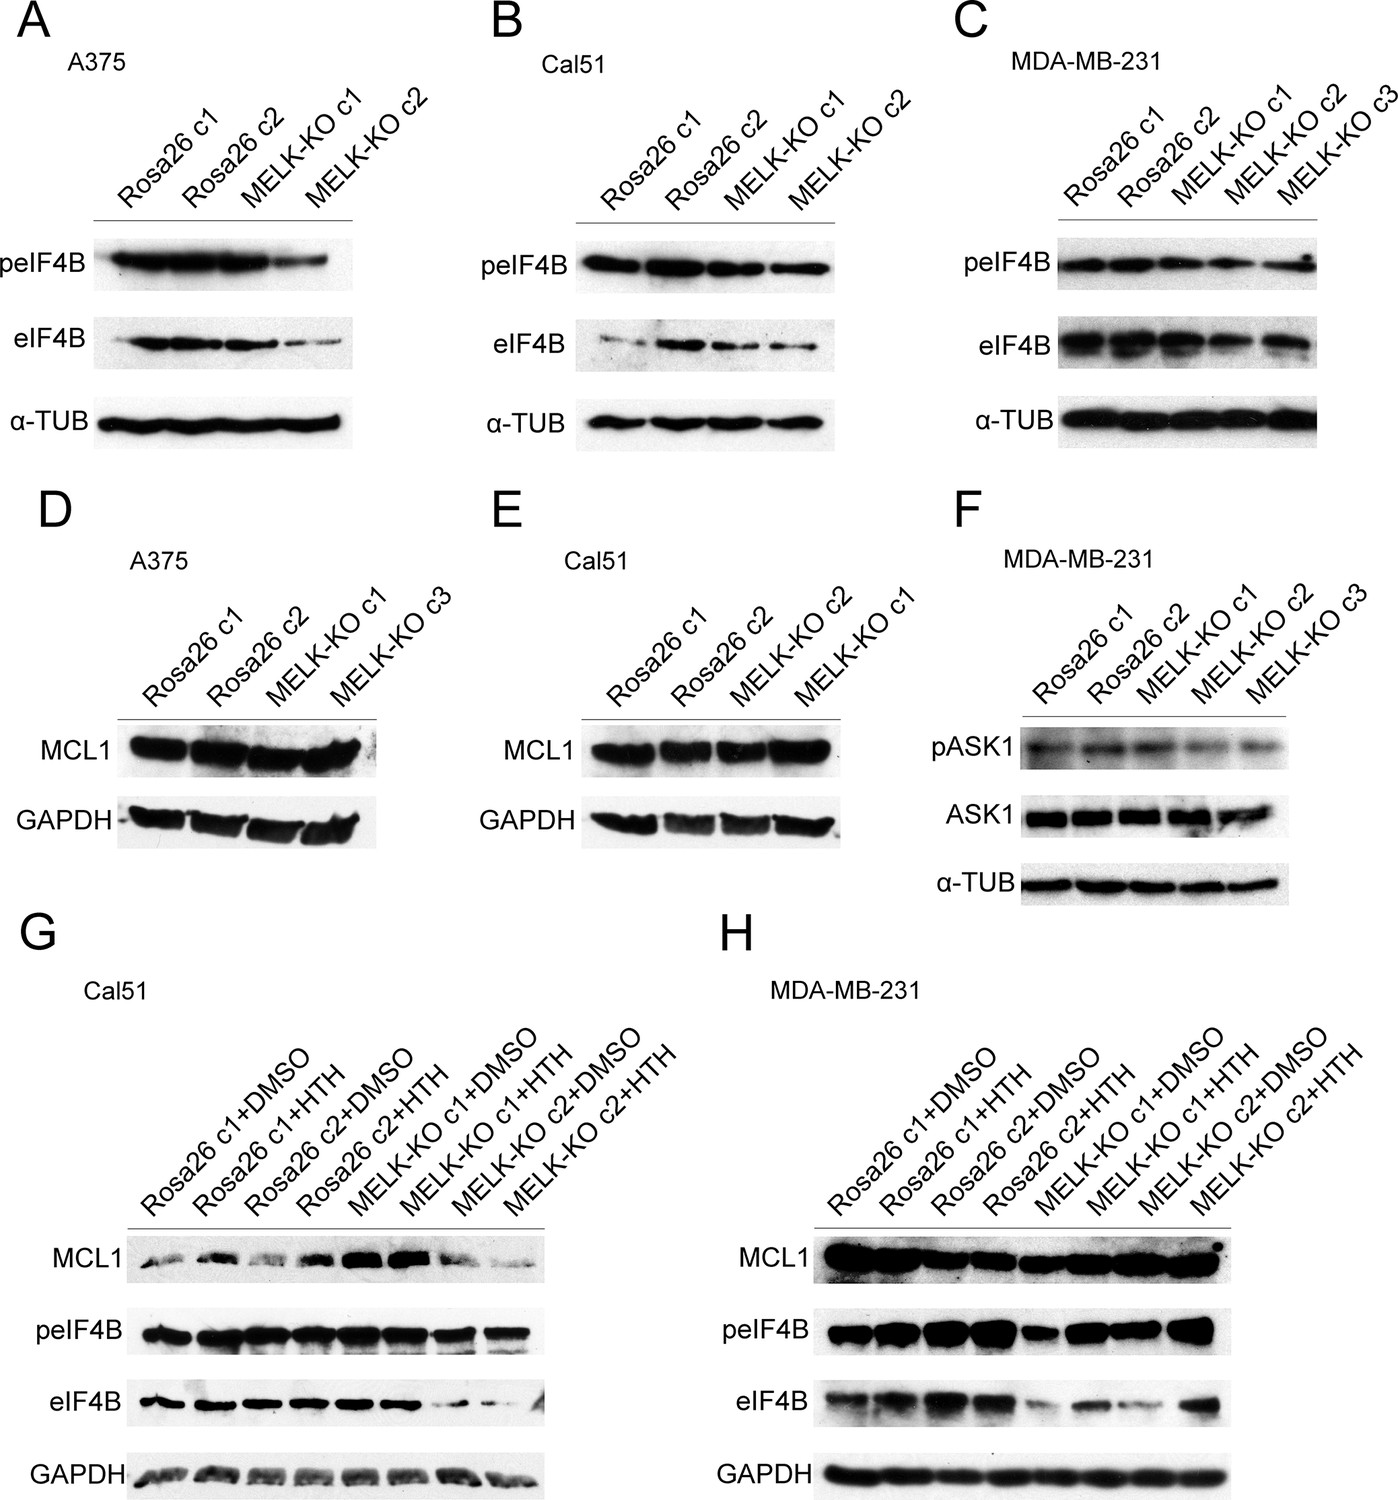
MELK is not required for the phosphorylation or expression of previously-reported targets.
(A–C) Western blot analysis of A375, Cal51, or MDA-MB-231 with antibodies against phospho-EIF4B and total EIF4B. (D–E) Western blot analysis of A375 or Cal51 with antibodies against MCL1. (F) Western blot analysis of MDA-MB-231 with antibodies against phospho-ASK1 and total ASK1. (G–H) Western blot analysis of Cal51 or MDA-MD-231 treated with 1 µM of HTH-01–091 with antibodies against MCL1, phospho-EIF4B and total EIF4B.
Figure 4
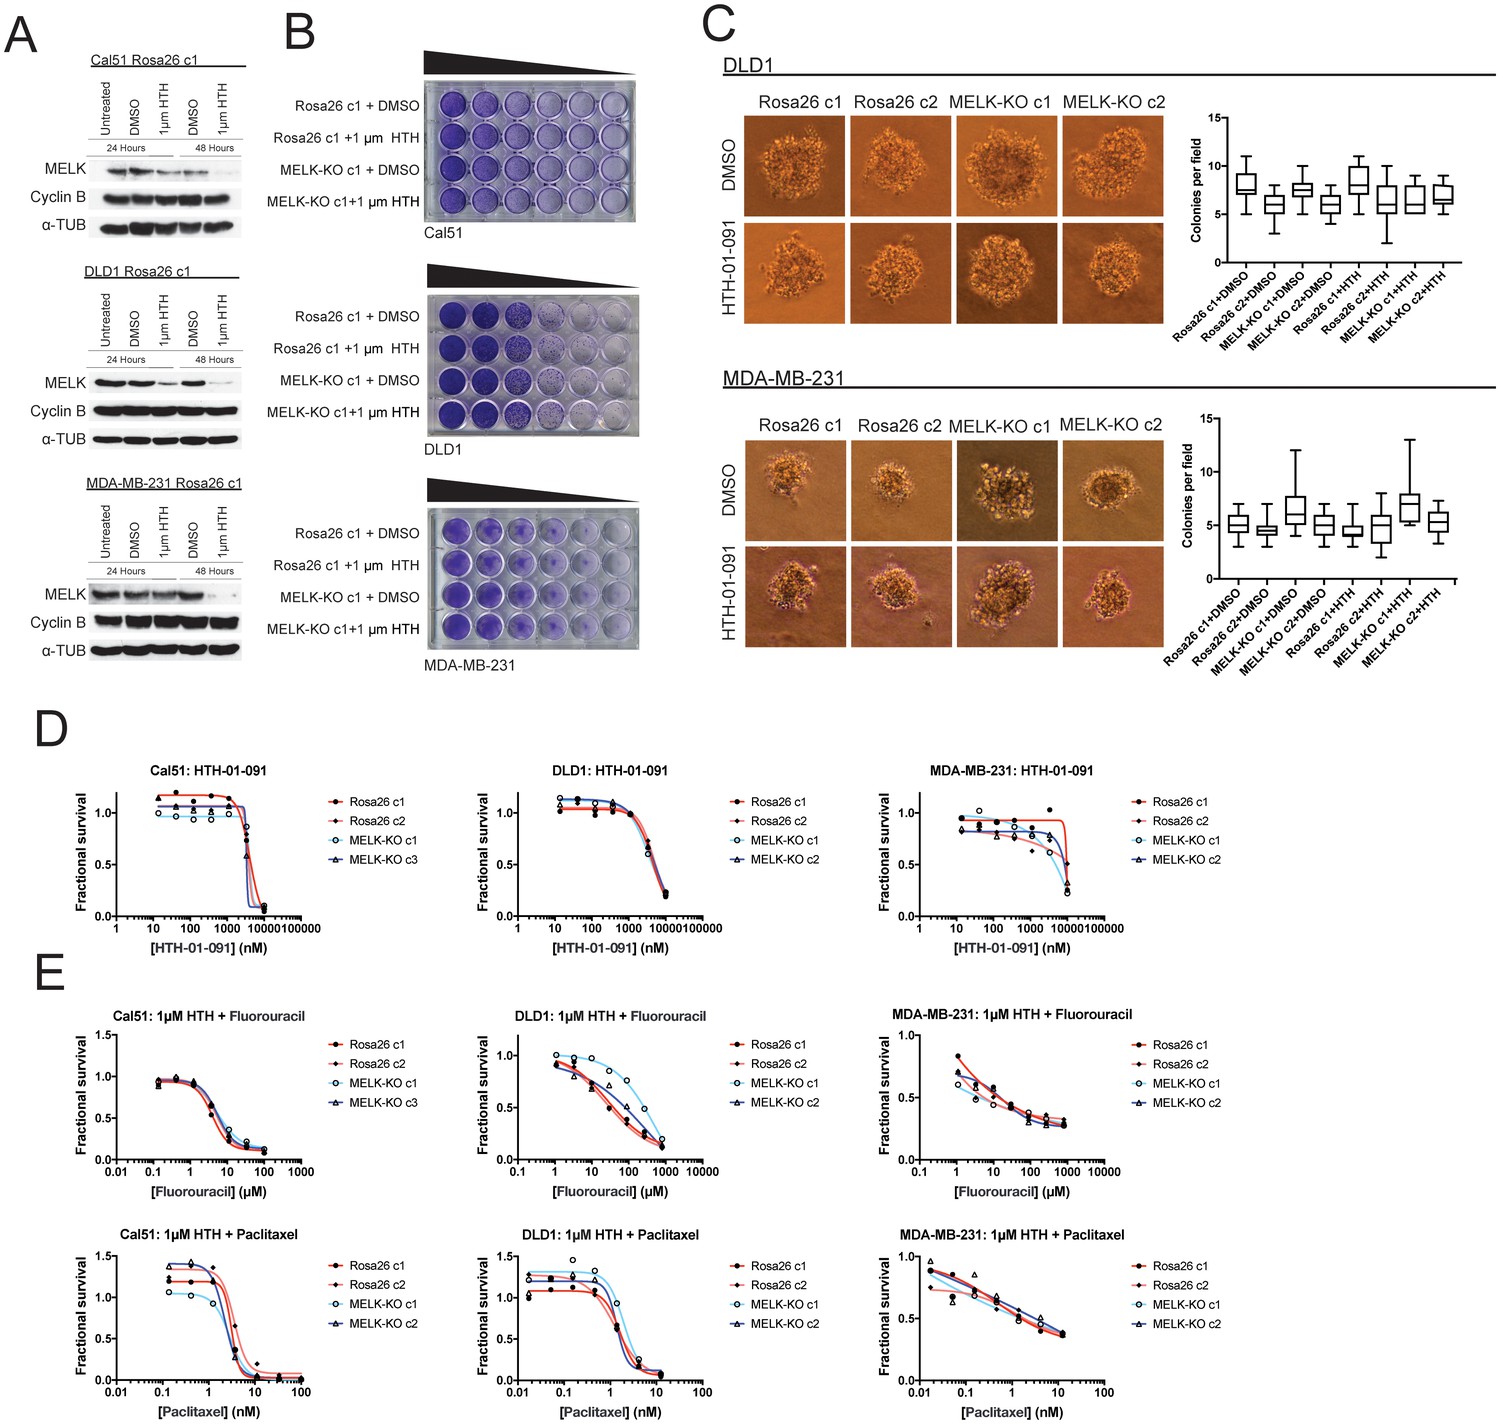
Acute inhibition of MELK fails to block growth.
(A) Western blot analysis of MELK expression levels during treatment with 1 µM HTH-01–091 in the Cal51, DLD1, and MDA-MB-231 Rosa26 clonal cell lines. (B) Crystal violet staining of Cal51, DLD1, and MDA-MB-231 Rosa26 and MELK-KO cell lines grown as serial dilutions in the presence of DMSO or 1 µM HTH-01–091. (C) Quantification and representative images of colony formation of DLD1 and MDA-MB-231 Rosa26 and MELK-KO clones in soft agar in the presence of DMSO or 1 µM HTH-01–091. (D) Dose-response curves of Cal51, DLD1, and MDA-MB-231 Rosa26 and MELK-KO clones grown in the presence of HTH-01–091. (E) Dose-response curves of Cal51, DLD1, and MDA-MB-231 Rosa26 and MELK-KO clones grown in the presence of 1 µm HTH-01–091 and the indicated chemotherapy drug.
Figure 5
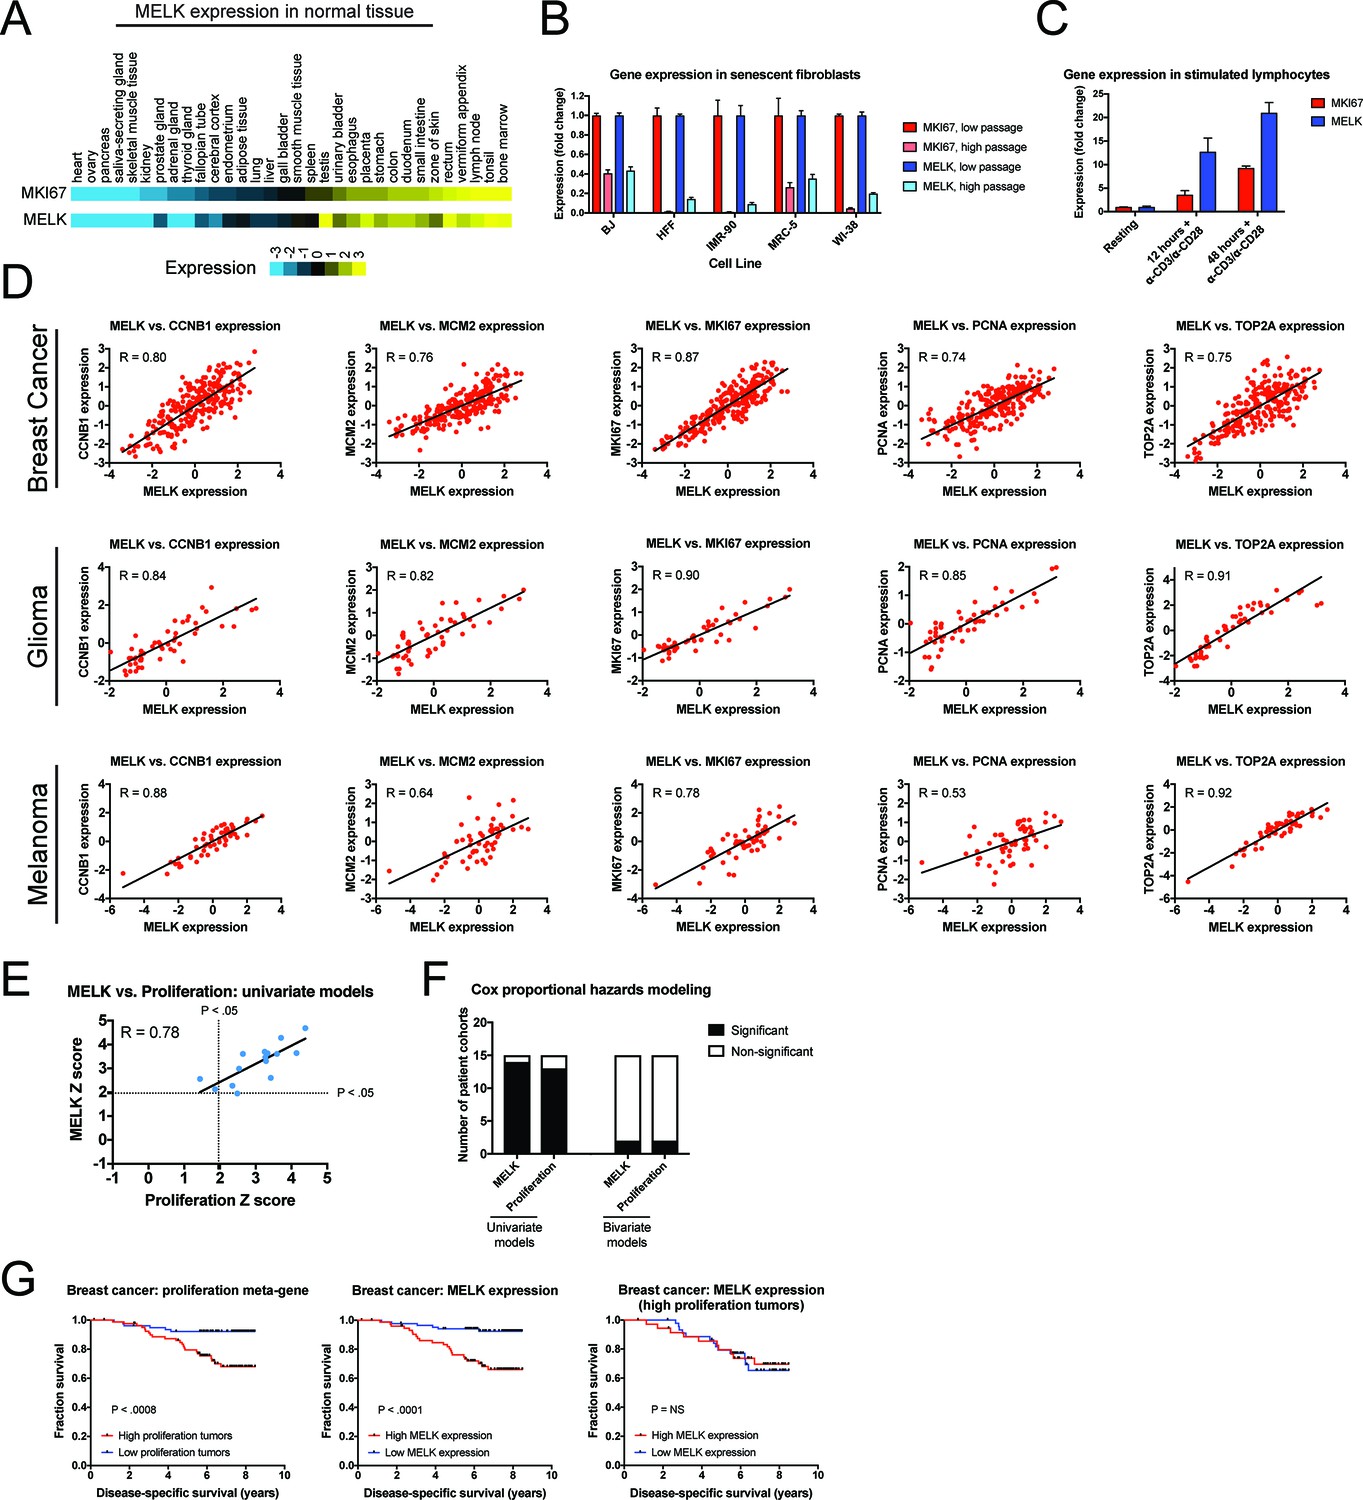
MELK expression correlates with proliferation markers in vitro, in normal tissue, and in cancer.
(A) A heatmap of the expression of either MKI67 or MELK in normal tissue sorted according to MKI67 expression (Uhlén et al., 2015). (B) The expression level of either MKI67 or MELK is displayed in five different primary human fibroblast lines at either low passage (proliferating) or high passage (senescence) (Marthandan et al., 2015). (C) The expression level of either MKI67 or MELK is displayed in CD4 + lymphocytes resting or after stimulation with α-CD3/α-CD28 beads (Abbas et al., 2005). (D) The expression level of MELK is plotted against the expression of five common proliferation markers in cohorts of patients with breast cancer, glioma, or melanoma (Sabatier et al., 2011; Turcan et al., 2012; Jönsson et al., 2010). Black lines represent linear regressions plotted against the data. (E) Univariate Cox proportional hazards models were calculated for the 15 breast cancer cohorts listed in Supplementary file 3. For each cohort, the expression of either MELK or the average expression of CCNB1, MCM2, MKI67, PCNA, and TOP2A in each tumor was regressed against patient outcome. Dotted lines represent Z scores of 1.96, corresponding to a p-value of 0.05. The black line represents a linear regressions plotted against the data. (F) Bar graphs depict the number of cohorts in which MELK and a proliferation meta-gene are significantly associated with poor outcome in either univariate or bivariate models. The full results are presented in Supplementary file 3 and Supplementary file 4. (G) Kaplan-Meier curves displaying disease-specific survival in one breast cancer cohort (Pawitan et al., 2005). Patients were split into two populations based on the average expression of either MELK or the five-gene proliferation meta-gene.
Tables
Key resources table
| Reagent type (species) or resource | Designation | Source or reference | Identifiers | Additional information |
|---|---|---|---|---|
| Cell line (human) | A375 | ATCC | RRID:CVCL_0132 | |
| Cell line (human) | Cal51 | Dr. David Solomon and Dr. Todd Waldman | RRID:CVCL_1110 | |
| Cell line (human) | DLD1 | ATCC | RRID:CVCL_0248 | |
| Cell line (human) | MDA-MB-231 | ATCC | RRID:CVCL_0062 | |
| Cell line (rat) | Rat1 | CSHL Cell Line Repository | RRID:CVCL_0512 | |
| Cell line (human) | MCF10A | Dr. Camila Dos Santos | RRID:CVCL_0598 | |
| Cell line (mouse) | 3T3 | CSHL Cell Line Repository | RRID:CVCL_0594 | |
| Cell line (human) | All MELK-knockout and Rosa26 control clonal cell lines (A375, Cal51, DLD1, MDA-MB-231) | This paper and Lin et al., (eLife 2017) | These cell lines were derived in this paper. Available from Dr. Jason Sheltzer. | |
| Transfected construct | LRG 2.1 vector | Dr. Christopher Vakoc and Dr. Junwei Shi | ||
| Transfected construct (human and mouse) | MELK over expression plasmid | Vectorbuilder, Cyagen Corporation | ||
| Antibody | Anti-MELK N terminal Antibody | Abcam | ab108529 | 1:3000 in 5% Milk TBST |
| Antibody | Anti-MELK C terminal Antibody | Cell Signal | 2274S | 1:10000 in 10% BSA TBST |
| Antibody | Anti-ASK1 | Abcam | ab45178 | 1:1000 in 5% Milk TBST |
| Antibody | Anti-eIF4B | Cell Signal | 3592 | 1:2000 in 5% Milk TBST |
| Antibody | Anti-cyclin B | Abcam | ab32053 | 1:10000 in 5% Milk TBST |
| Antibody | Anti-Phospho-ASK1 | Cell Signal | 3765 | 1:1000 in 5% BSA TBST |
| Antibody | Anti-Phospho-eIF4B | Cell Signal | 5399 | 1:1000 in 5% BSA TBST |
| Antibody | Anti-MCL1 | Cell Signal | 5453 | 1:2000 in 5% Milk TBST |
| Antibody | Anti-Alpha-Tubulin | Sigma-Aldrich | T6199 | 1:20000 in 5% Milk TBST |
| Antibody | Anti-GAPDH | Santa Cruz Biotechnology | sc-365062 | 1:20000 in 5% Milk TBST |
| Antibody | Anti-Rabbit | Abcam | ab6721 | 1:50000 to 1:20000 in 5% Milk TBST |
| Antibody | Anti-Mouse | Bio-Rad | 1706516 | 1:50000 in 5% Milk TBST |
| Chemical compound,drug | HTH-01–091 | Dr. Nathanael Gray DOI: 10.7554 | ||
| Chemical compound,drug | OTSSP167 | MedChem Express | HY-15512A | |
| Software, algorithm | Survival Analysis | This paper | https://github.com/joan-smith/survival-analysis-scripts |
Additional files
-
Supplementary file 1
MELK gRNA sequences.
Cancer cells lines used in this study and the guide RNAs that they express are displayed.
- https://doi.org/10.7554/eLife.32838.011
-
Supplementary file 2
PCR primers to amplify MELK gRNA cut sites.
The sequences of all PCR primers used in this study are displayed.
- https://doi.org/10.7554/eLife.32838.012
-
Supplementary file 3
Univariate Cox proportional hazards models of breast cancer outcome and the expression of a proliferation meta-gene or of MELK.
Cox proportional hazards survival analysis was performed on 15 breast cancer microarray datasets correlating the length of patient survival with either MELK expression or with a proliferation meta-gene comprising MKI67, PCNA, CCNB1, MCM2, and TOP2A.
- https://doi.org/10.7554/eLife.32838.013
-
Supplementary file 4
Bivariate Cox proportional hazards models of breast cancer outcome and the expression of a proliferation meta-gene and of MELK.
Cox proportional hazards survival analysis was performed on 15 breast cancer microarray datasets correlating the length of patient survival with both MELK expression and with a proliferation meta-gene comprising MKI67, PCNA, CCNB1, MCM2, and TOP2A.
- https://doi.org/10.7554/eLife.32838.014
-
Transparent reporting form
- https://doi.org/10.7554/eLife.32838.015
Download links
A two-part list of links to download the article, or parts of the article, in various formats.
Downloads (link to download the article as PDF)
Open citations (links to open the citations from this article in various online reference manager services)
Cite this article (links to download the citations from this article in formats compatible with various reference manager tools)
MELK expression correlates with tumor mitotic activity but is not required for cancer growth
eLife 7:e32838.
https://doi.org/10.7554/eLife.32838


