Diversification of heart progenitor cells by EGF signaling and differential modulation of ETS protein activity
- Friedrich-Alexander University of Erlangen-Nürnberg, Germany
Figures
Figure 1 with 4 supplements
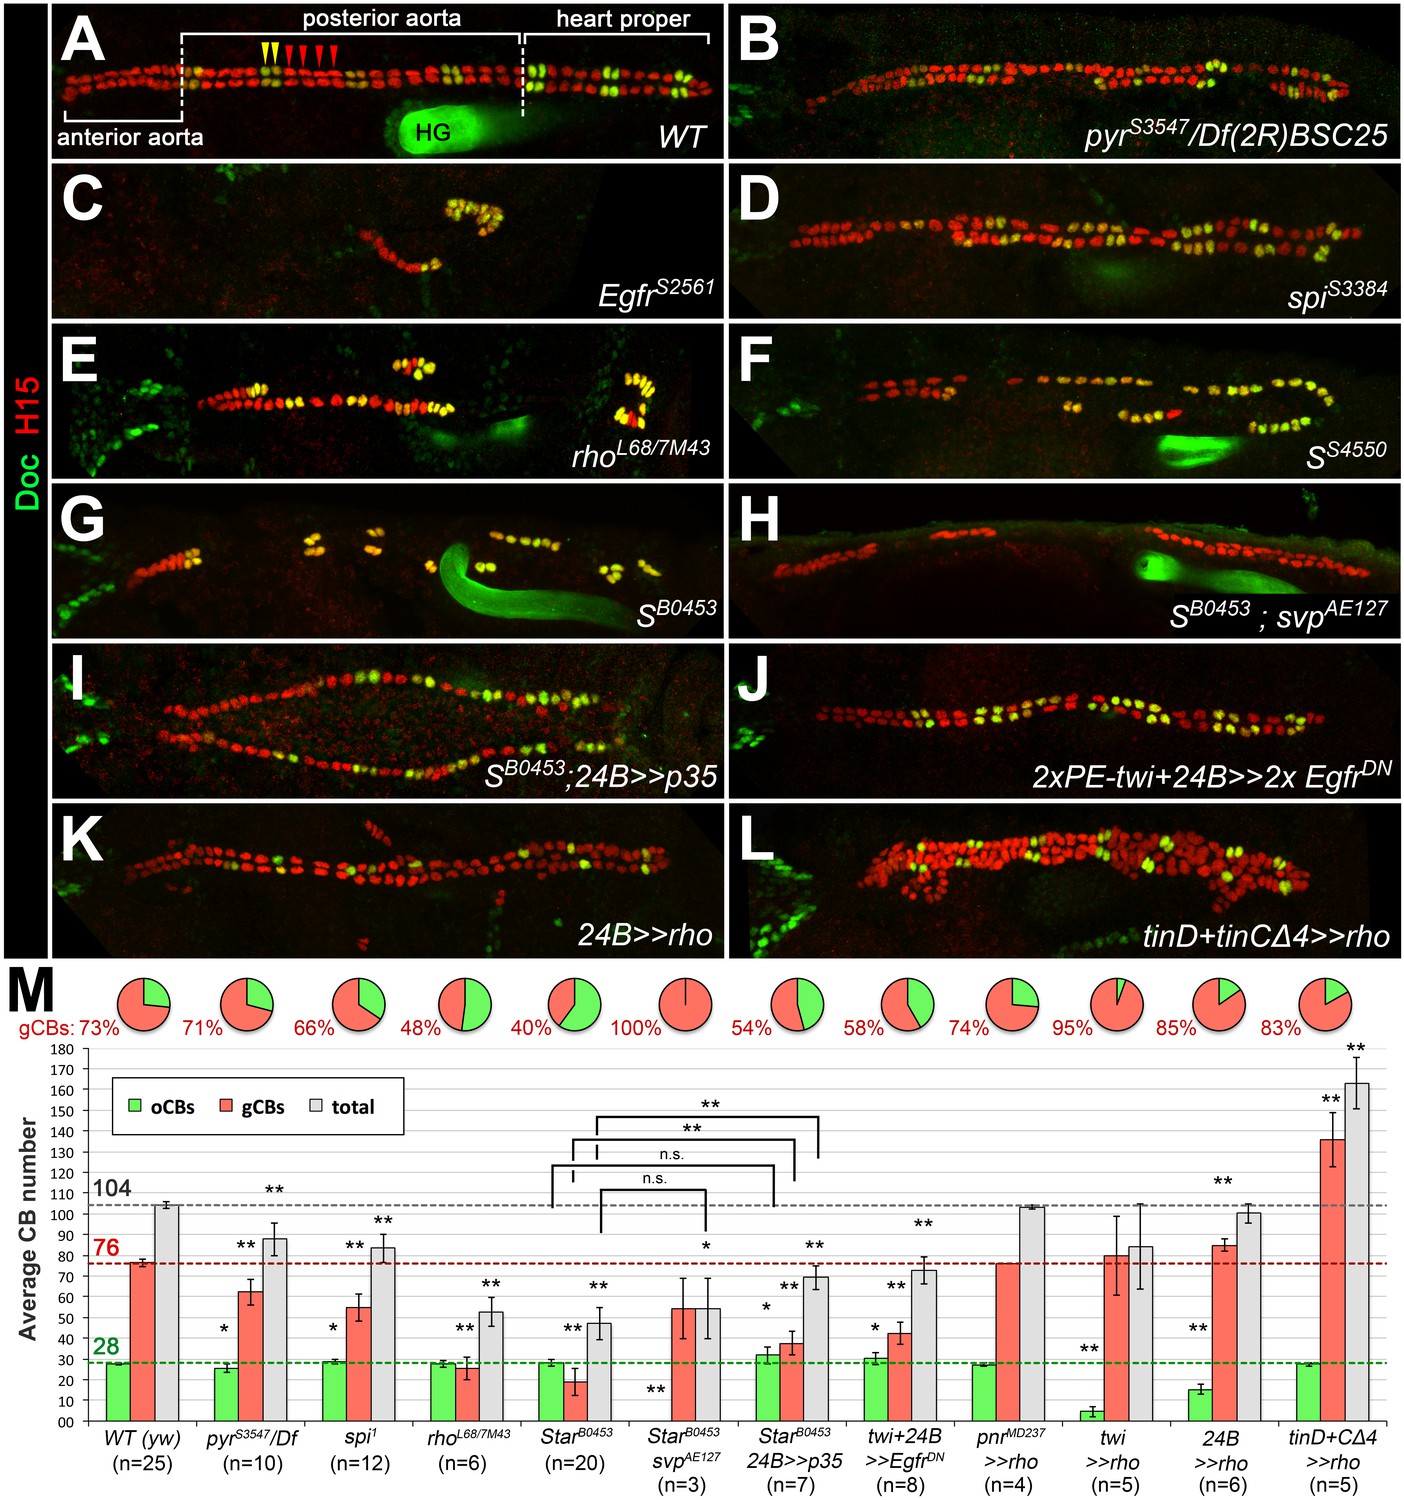
Genetic manipulation of EGF but not FGF signaling leads to cardioblast subtype-specific heart defects.
Immunostaining for the cardioblast marker H15 (red) and the ostial cardioblast marker Dorsocross (anti-Doc2+3, green). (HG: hindgut with artificial staining in the lumen). All figures depict dorsal views of stage 16 embryos with anterior to the left unless noted otherwise. (A) Wild type (WT) CB pattern with regular alternation of gCBs (red) and oCBs (yellow) in the posterior aorta and the heart proper. The anterior aorta consists entirely of Doc- CBs. (B) Mutant with reduced FGF activity (pyrS3547 over a deficiency, Df(2R)BSC25, that removes pyr and ths) showing a reduction of both CB types. (C) Homozygous EgfrS2561 mutant with a severe loss of CBs. Almost all remaining CBs are Doc+. Predominant reduction of gCBs is also observed in the EGF pathway-impairing spitz group mutants spiS3384 (D), rho7M43/rhoL68 (E), SS4550 (F) and SB0453 (G, showing an extreme case in which all retained CBs except for those of the anterior aorta are Doc+). (H) In S B0453 svpAE127 double mutants, total CB numbers are similar to that of S single mutants, even though all CBs are Doc-negative. (I) If the apoptosis inhibitor p35 is artificially expressed in the mesoderm of S mutants a mild increase in the number of CBs can be observed. Compared to the wild type, more Doc+ CBs are present. (J) Pan-mesodermal overexpression of dominant-negative Egfr results in a phenotype similar to spitz group mutants. Expression of rho in the entire mesoderm via how24B-GAL4 (K) or at later time in dorsal mesoderm cells via tinD +tinCΔ4-GAL4 (L) generates supernumerary gCBs. By contrast, oCB specification is either reduced (K) or unaffected (L) in these backgrounds. (M) Quantification of Doc+ oCBs (green), Doc- gCBs (red) and total cardioblasts (grey). The column bar chart depicts average numbers with standard deviation error bars. Asterisks indicate significant differences compared to the y w control (WT) assessed by Student's t-test (two-tailed, type 3; *=p < 0.05, **=p < 0.001; n.s. = not significant). Brackets indicate comparisons between other genotypes. Pie charts display the corresponding average fraction of oCBs and gCBs.
-
Figure 1—source data 1
Quantification of Doc+oCBs, Doc- gCBs and total cardioblasts.
- https://doi.org/10.7554/eLife.32847.008
Figure 1—figure supplement 1
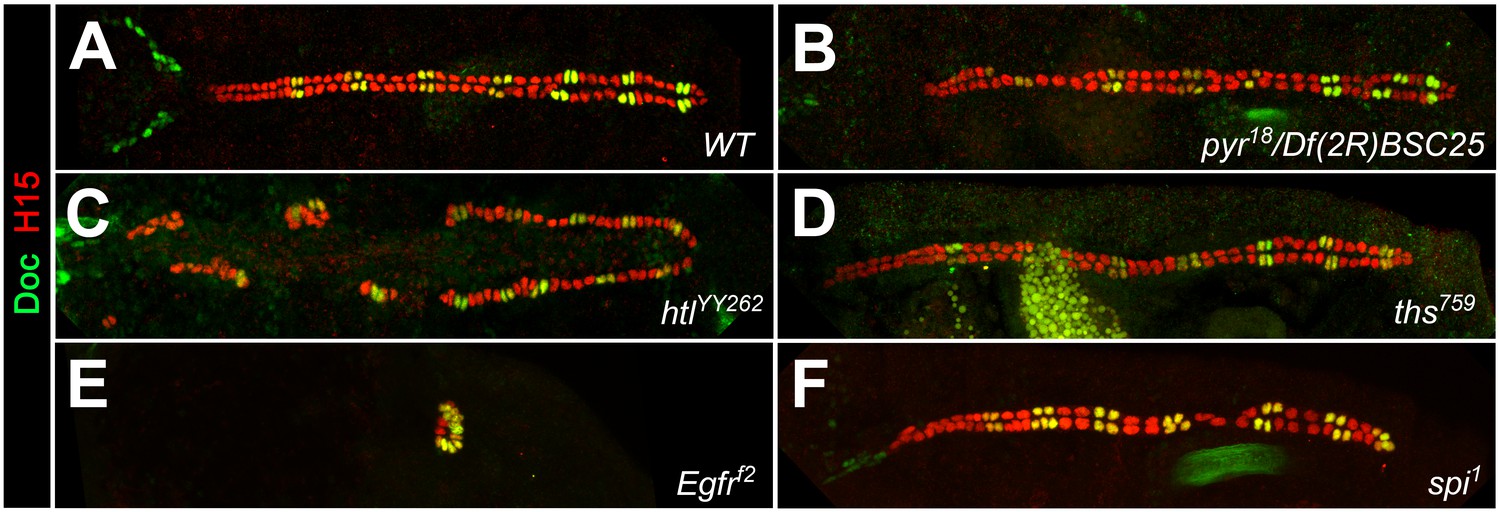
Cardiac patterning phenotypes in additional alleles of FGF and EGF pathway mutants.
Embryos stained for H15 and Doc as in Figure 1. (A) Wild type with normal CB pattern. Reduced FGF/Htl signaling in pyr18/Df(2R)BSC25 (pyr-/- ths+/-) embryos (B) or homozygous mutants with the hypomorphic allele htlYY262 (C) leads to a random loss of gCBs and oCBs. (D) Neither significant changes in CB number nor patterning defects were observed in homozygous ths759 mutants. The mutants Egfrf2 (E) and spi1 (F) show essentially the same phenotypes as the corresponding alleles of the same genes shown in Figure 1.
Figure 1—figure supplement 2
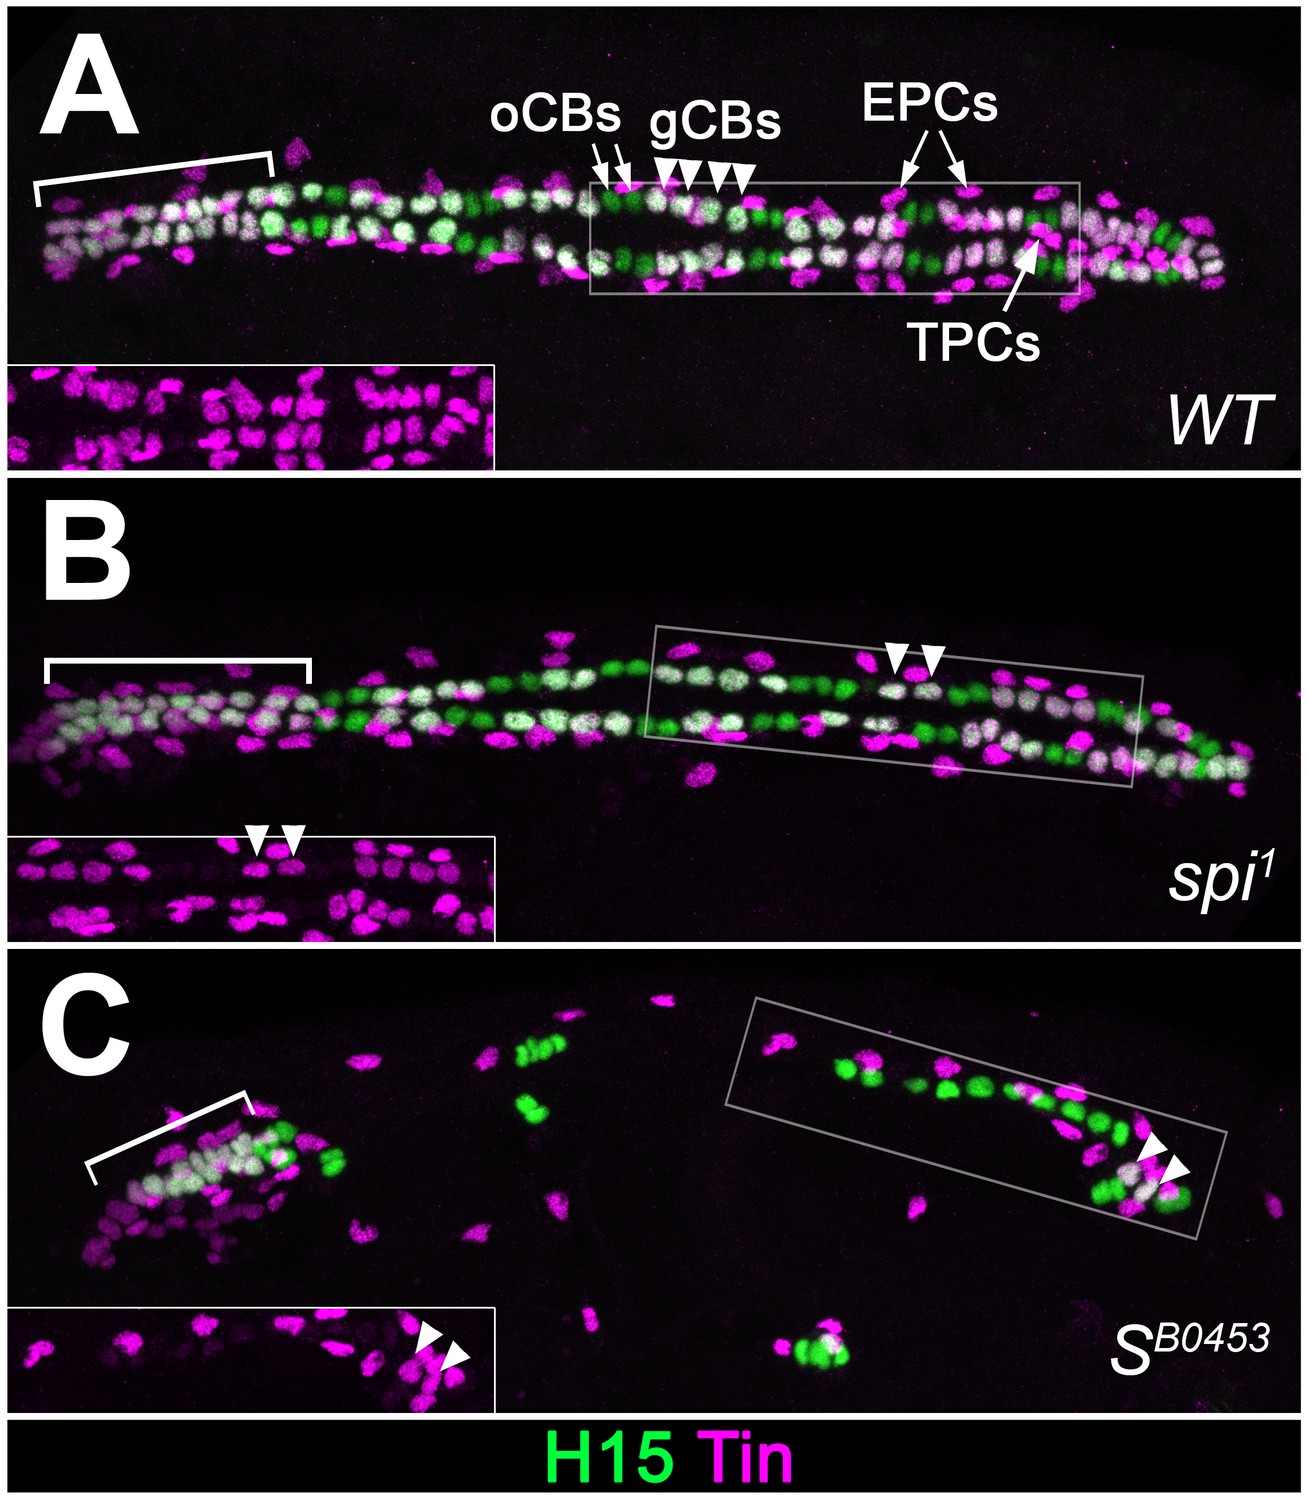
Extended analysis of cardiac patterning confirming the loss of Tin+cardiac cells in EGF pathway mutants.
Expression of Tin and H15 detected by immunostaining in stage 16 embryos. (A) In the wild type, each abdominal hemisegment contains four Tin+H15+ gCBs (white, arrowheads) and several Tin+H15- PCs. In the anterior aorta (bracket) all CBs express Tin. (B) Homozygous spi1 mutant with reduced number of gCBs. (C) Homozygous SB0453 mutant in which only one pair of Tin+ gCBs has developed in abdominal segments. CBs of the anterior aorta (bracket) are less affected. TPCs, located ventrally to the CBs in the wild type, are also reduced in spi and S mutants. Correlating with the presence of Doc+ CBs, Tin- CBs are present at near wild type numbers in spi and S mutants.
Figure 1—figure supplement 3

Lbe+ and Lbe- subtypes of generic cardioblasts are equally affected in EGF signaling mutants.
Analysis of stage 13 wild type (A–A'') and rho mutant (B–B'') embryos stained against GFP (green) to visualize Lbe-GFP (expressed from a large transgene, tagged in its genomic context), Mef2 (marks nuclei of CBs and other muscles; blue) and Doc3+2 (strong red signal in oCBs indicated by arrowheads, weak signal in gCBs). Anterior is to the left. Hemisegments are marked by brackets (i.e. oCB pairs are formed at the border of adjacent hemisegments). (A) In the wild type, Lbe-GFP is detected in the anterior CBs of each hemisegment, in the two sibling gCBs (green asterisks) and, more faintly, in the adjacent oCB (temporary Lbe expression these oCBs was also reported previously by Lo and Frasch (2003). The posterior gCB pair is negative for Lbe-GFP (blue asterisks). (B) In rhoL68 mutants, many gCBs are missing. In some hemisegments this affects Lbe-GFP-positive gCBs, in others Lbe-GFP-negative gCBs. Doc+ oCBs are present. Sporadically, additional cells with high levels of Doc were found. (C) Schematic representation of the normal CB pattern alternating between Lbe+ and Lbe- cells. (D) Quantitative comparison of the CB composition of wild type (upper bar) and rho mutant (lower bar) embryos. 24 hemisegments (A2–A7) were analyzed per genotype. In the wild type, all 24 hemisegments contained both gCB pairs. By contrast, hemisegments of rhoL68 mutants frequently lacked one pair of either Lbe+ or Lbe- gCBs (with similar frequency), and sometimes both pairs (2 out of 24). In this analysis a total of 61 high Doc+ cells (equaling 15.25 per half-embryo) were detected as compared to 56 (average of 14 per half-embryo) in the control.
Figure 1—figure supplement 4
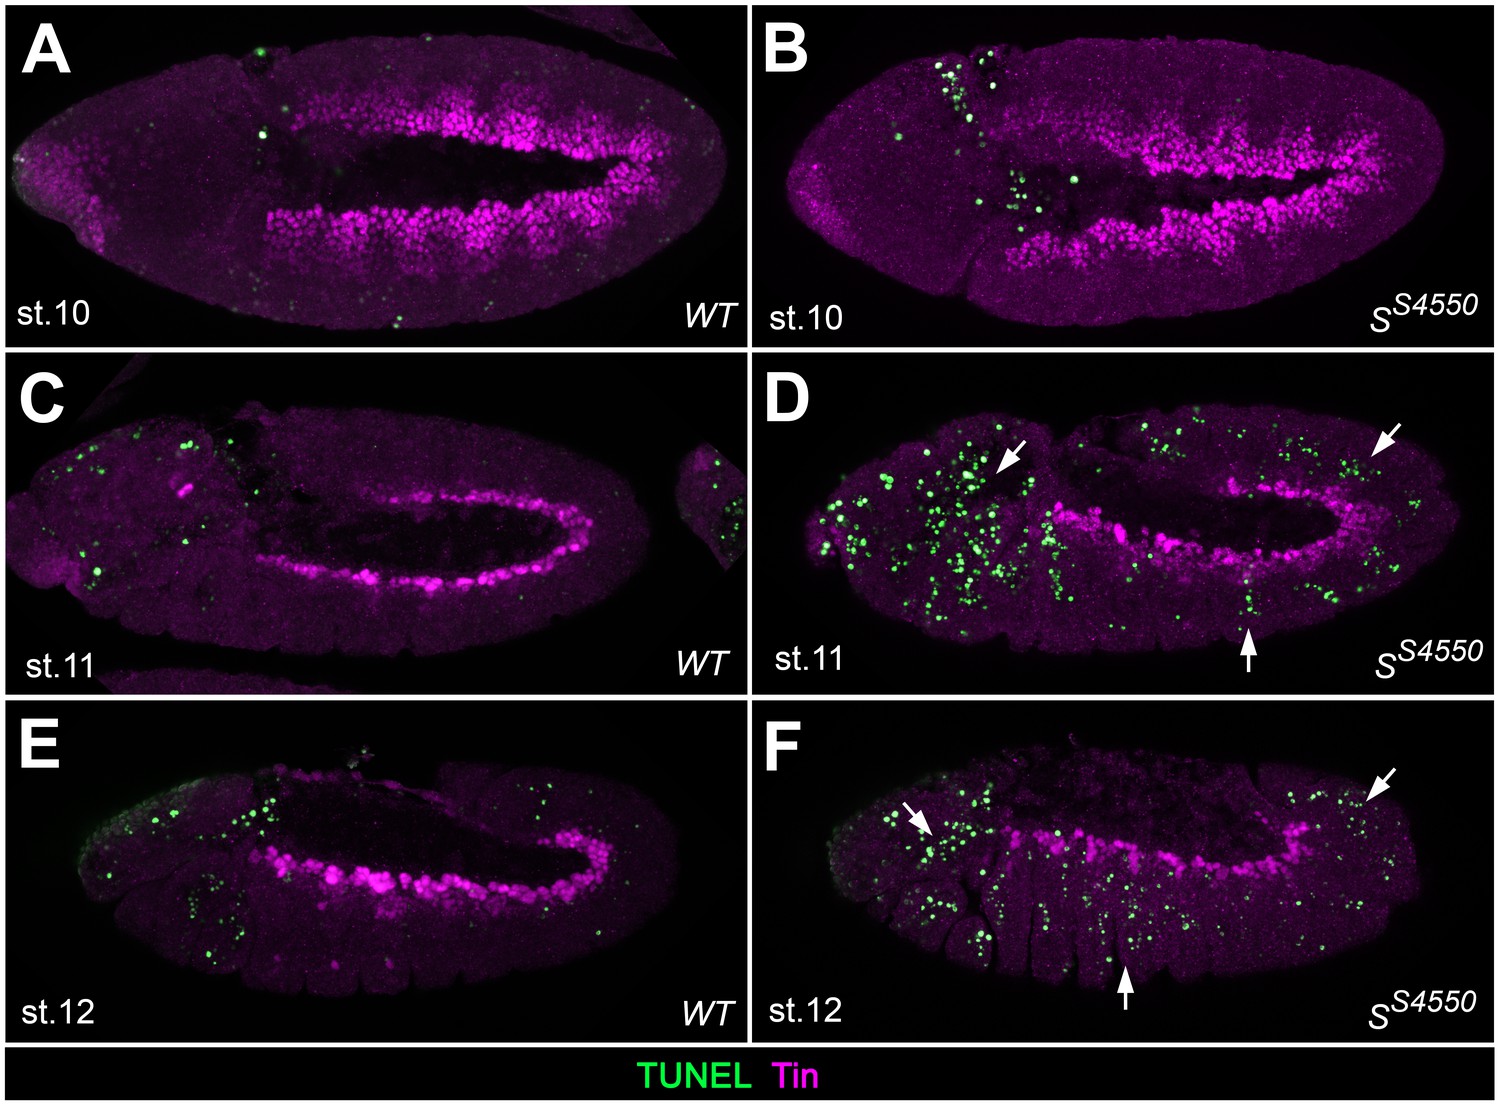
Analysis of apoptosis in Star mutants.
TUNEL assay co-stained for Tin to detect apoptotic cells in the cardiogenic mesoderm of wild type embryos (A,C,E) and in amorphic S mutants (B,D,F) at the indicated stages. TUNEL signals are not found within in the Tin+cardiogenic mesoderm of stage 10, 11 and 12 embryos in both wild-type and mutant embryos, although such signals could readily detected in more ventral and lateral regions as well as in the head (arrows). Note the higher abundance of TUNEL staining in Tin-negative tissues in the mutants. This suggests that EGF signaling does not serve as a mere survival cue in the cardiogenic mesoderm but has a major function in specifying cardiac fates.
Figure 2
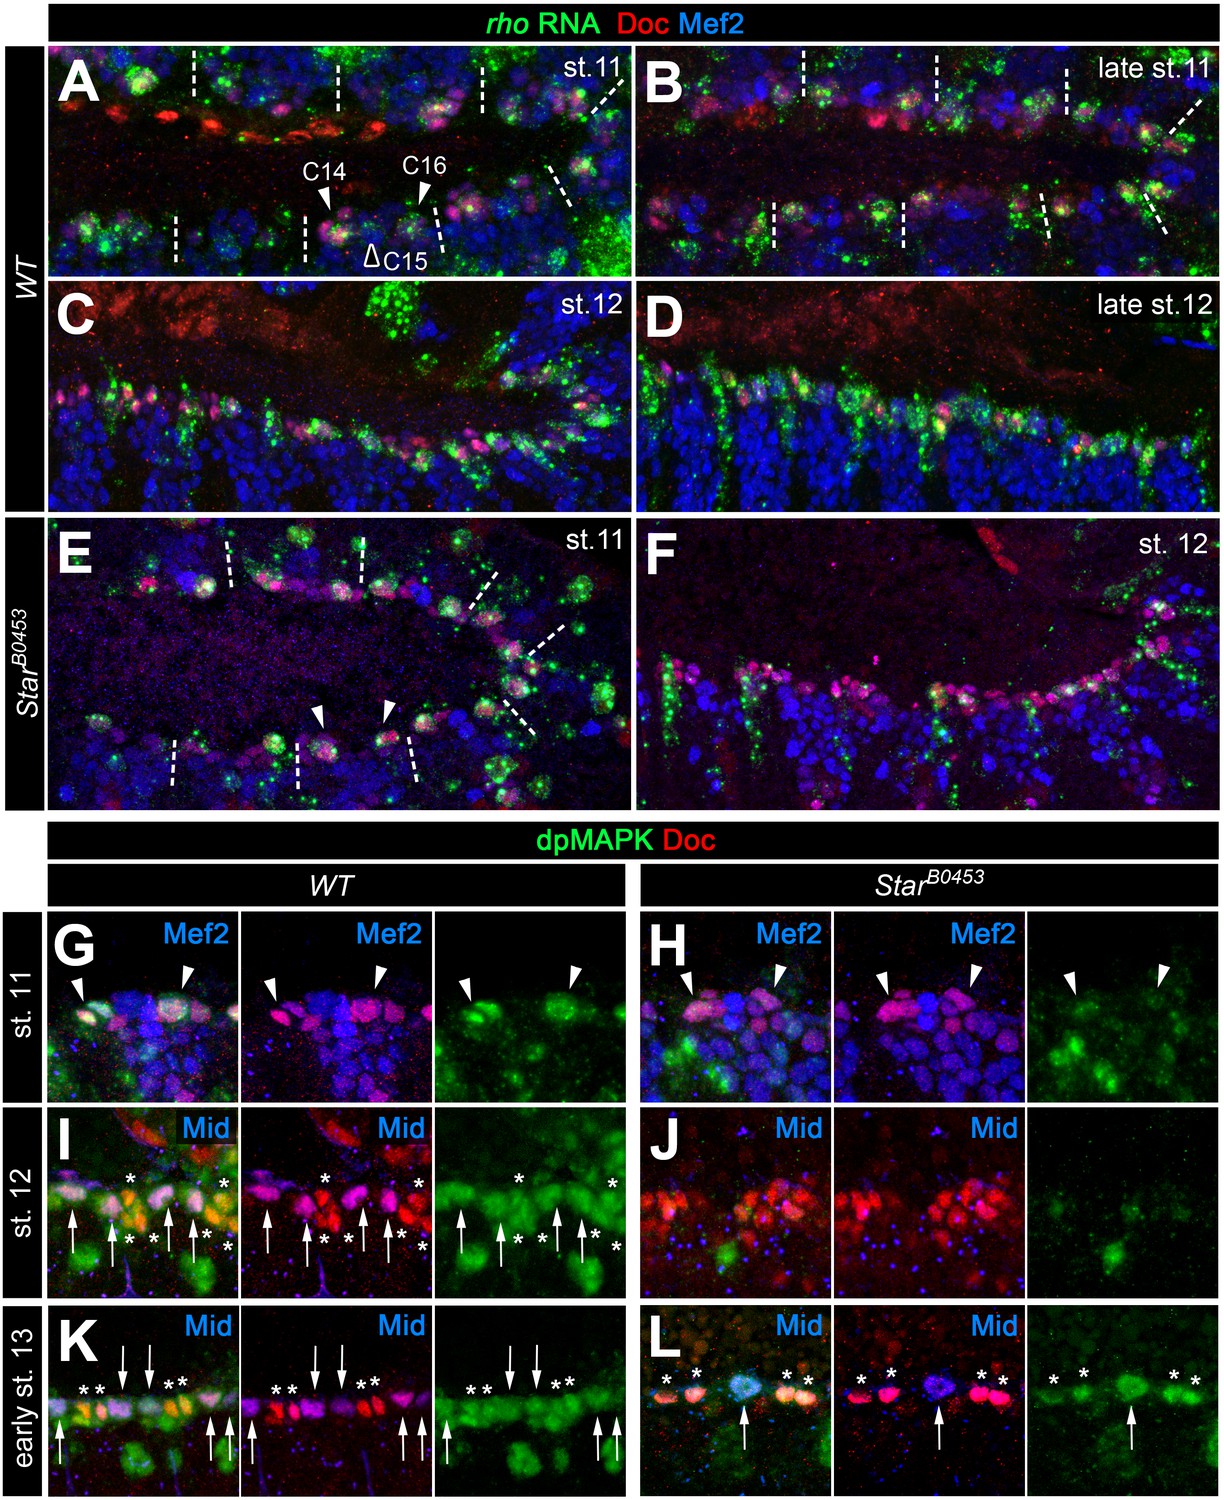
Expression of rho and MAPK activity in cardiac cells.
(A–F) Detection of rho mRNA (green), Mef2 (blue) and Doc (red). (A) At stage 11, rho is detectable in clusters C14/C16 of the cardiac mesoderm (arrowheads) and is fading from the central Doc-negative region containing EPC and somatic muscle progenitors (empty arrowhead). Dashes separate units derived from adjacent mesoderm segments. (B) At late stage 11, rho is expressed at high levels in at least one cardiac progenitor per cluster close to the dorsal mesoderm segment borders. (C, D) As cardioblasts align near the dorsal mesoderm margin during stage 12, rho continues to be expressed in most CBs. (E,F) Detection of rho RNA in SB0453 mutants showing normal rho expression in cardiogenic clusters at stage 11 (E, compare to A) and reduced cardiac expression at stage 12 (F, compare to C). (G–L) Detection of activated MAPK in the cardiogenic region of wild type (G,I,K) and SB0453 mutant (H,J,L) embryos in immunostainings against diphospho-MAPK (dpMAPK, green), Doc (red) and either Mef2 or Mid (blue) as indicated in each panel. (G) dpMAPK is detectable in the Doc+ cardiogenic clusters (arrowheads) of a stage 11 wild-type embryo. (H) This dpMAPK activity is severely reduced in Star mutants. (I) At stage 12, dpMAPK activity is observed in the Mid-expressing gCB progenitors (arrows) and in the Mid-negative oCBs and their sibling PCs (asterisks). (J) By contrast, both Mid and dpMAPK are severely reduced in stage 12 Star mutants. (K) Early stage 13 embryo after germ band retraction but prior to completion of the final mitotic division of the Mid+ gCB progenitors. dpMAPK is still active in all cardiac cells (oCBs and gCBs labeled as in I). (L) In contrast to earlier stages, dpMAPK staining is prominently observed in both oCBs (asterisks) and the few formed Mid+Doc- gCB progenitors (arrow) of Star mutants at the onset of stage 13.
Figure 3 with 1 supplement

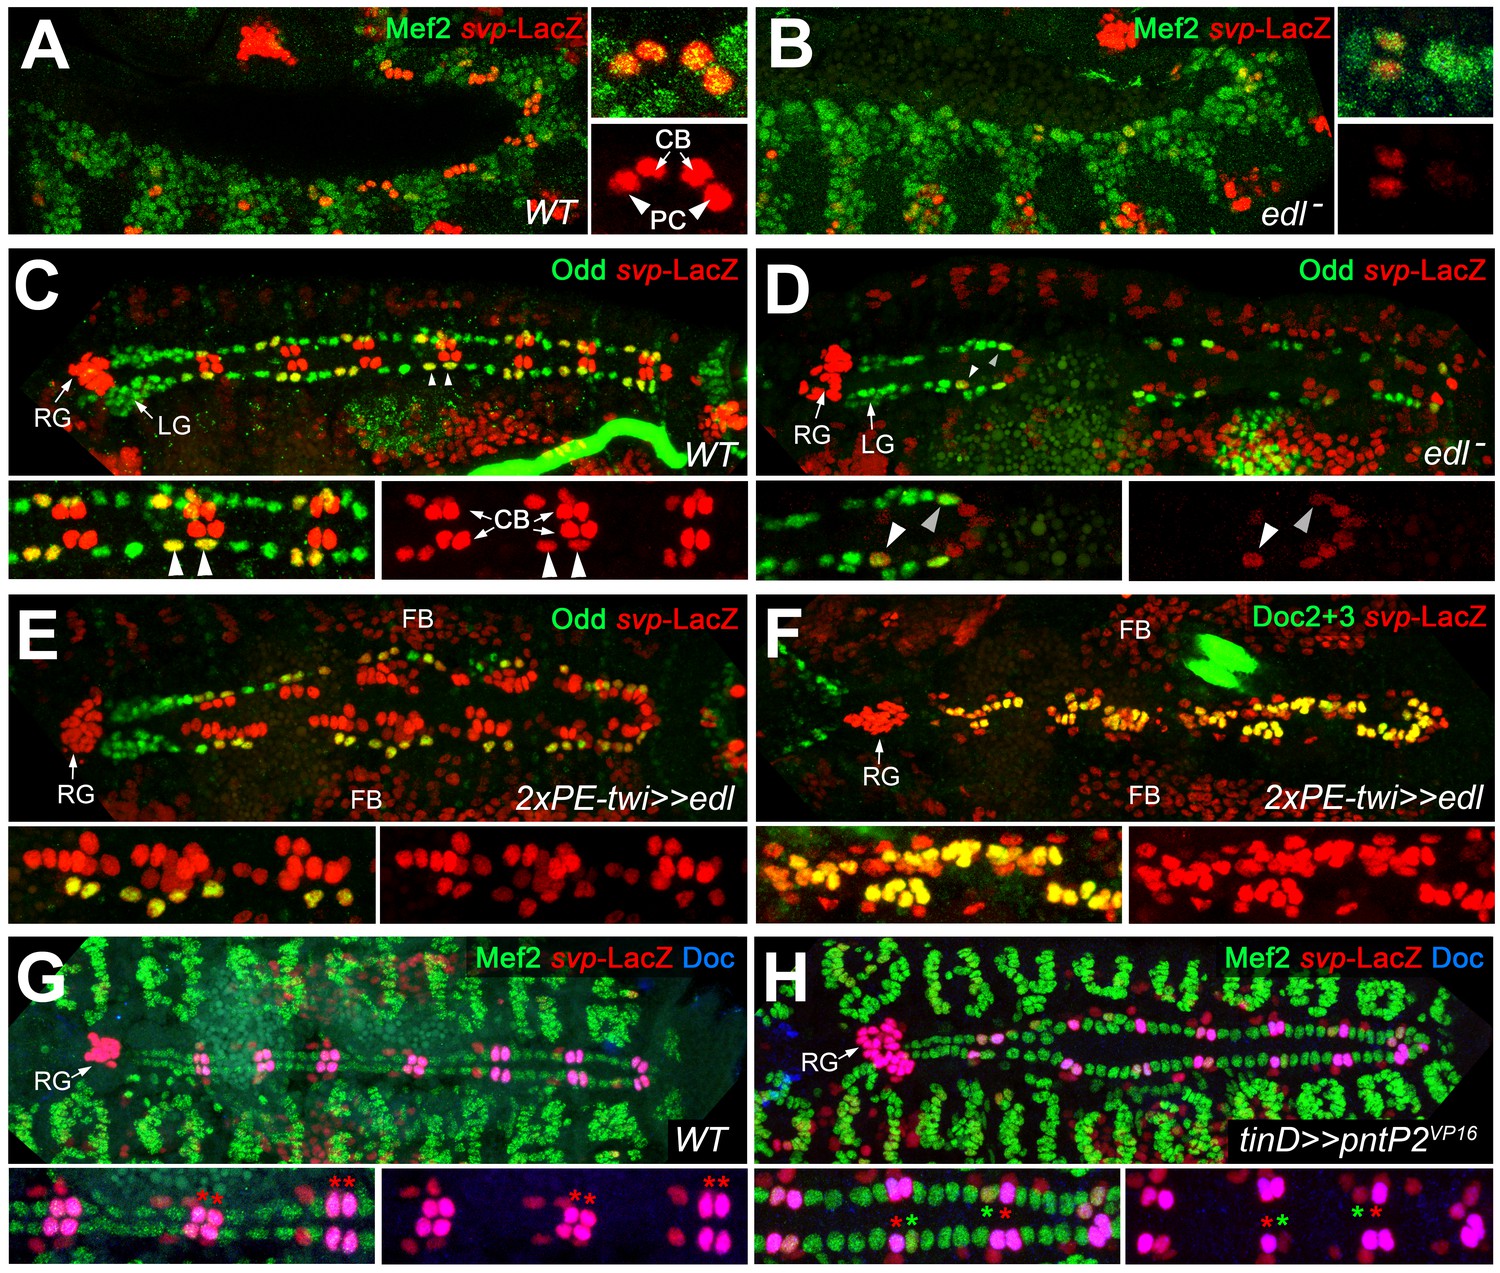
EGF signaling promotes the formation of Odd+PCs.
(A–D) Odd/Eve staining to analyze pericardial cells (PCs). (A) In the wild type, each hemisegment contains four OPCs, two EPCs and one Eve+ somatic muscle DA1 (*). (B) Amorphic rho7M43/L68 mutant with a loss of about half of all OPCs and all DA1 muscles. (C) Pan-mesodermal overexpression of the dominant-negative Egfr results in a phenotype similar to rho mutants. (D) Overexpression of rho in the dorsal mesoderm generates supernumerary OPCs. The number of EPCs is not affected by altered levels of EGF signaling. (E) Quantification of OPCs (green) and EPCs (red). Only abdominal PCs (located posterior to the lymph gland, LG) were included into the analysis. Significant differences compared to the y w control (WT) are designated as in Figure 1. Colored dashed lines mark the average numbers of OPCs and EPCs counted in the wild type. (F,G) Doc2+3/β-galactosidase (LacZ) staining in wild type (F) and Star mutant embryos (G) carrying a heterozygous copy of svpAE127-lacZ and showing presence of normal numbers of oCBs (Doc+/LacZ+) and their OPC siblings (Doc-/LacZ+). Bottom panels show a higher magnification and β-galactosidase single channel view of the upper panel. RG: ring gland, FB: fat body.
-
Figure 3—source data 1
Quantification of OPCs and EPCs.
- https://doi.org/10.7554/eLife.32847.012
Figure 3—figure supplement 1
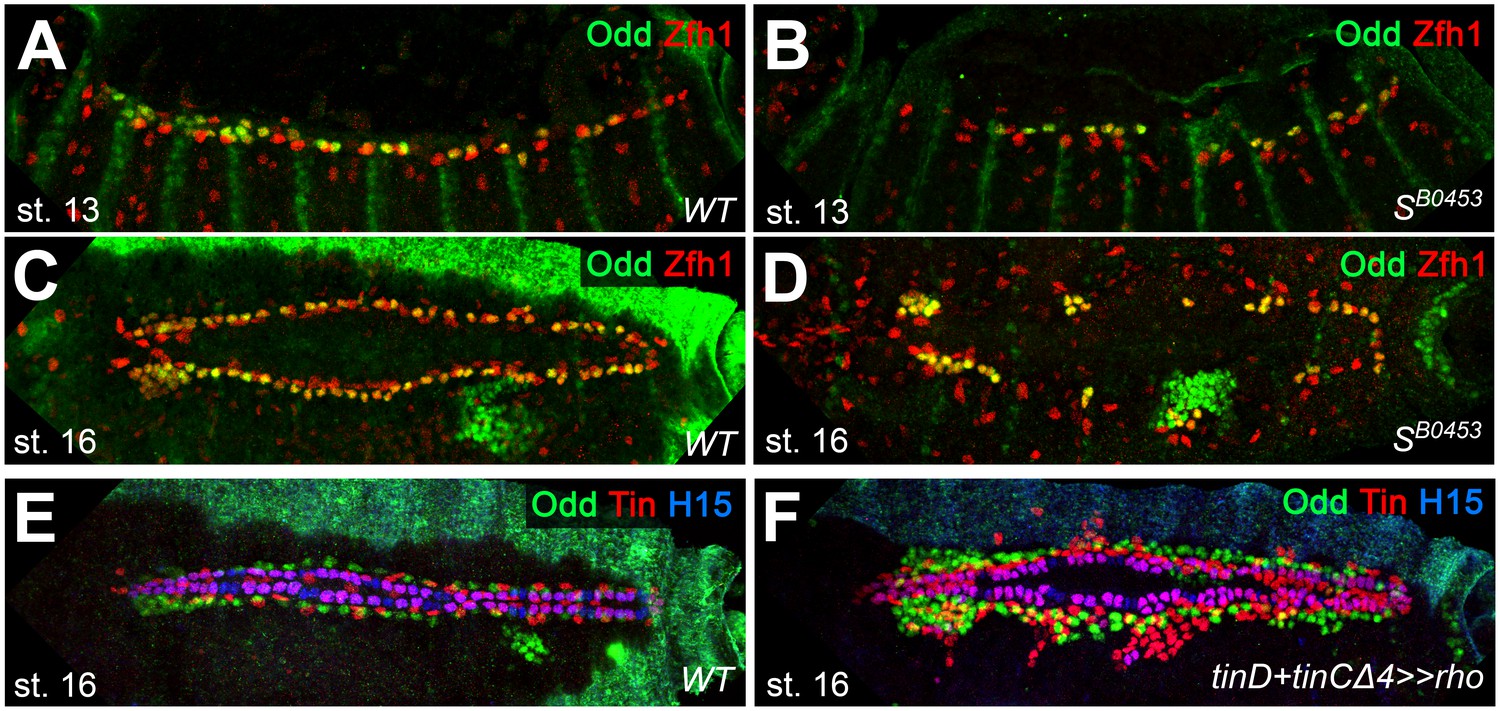
Extended analysis of pericardial markers in EGF loss- and gain-of-function backgrounds.
(A–D) Stainings against Zfh1 (red; labels all PCs) and Odd (green; Odd+/Zfh1+ OPCs appear yellow) in embryos at the indicated developmental stages. In comparison to the wild type (A,C), SB0453 mutants (B,D) have fewer Zfh1-positive nuclei, including those of the OPCs. (E,F) stainings against Odd (green), Tin (red) and H15 (blue). (E) Arrangement of CBs, OPCs and Tin-positive pericardial cells (EPCs are located laterally and TPCs ventrally to the H15+ CBs) in a wild-type control. (F) Hyperactivating the EGFR pathway by overexpressing rho in the dorsal mesoderm with tinD +tinCΔ4-GAL4 causes supernumerary gCBs (magenta), OPCs and TPCs.
Figure 4 with 2 supplements
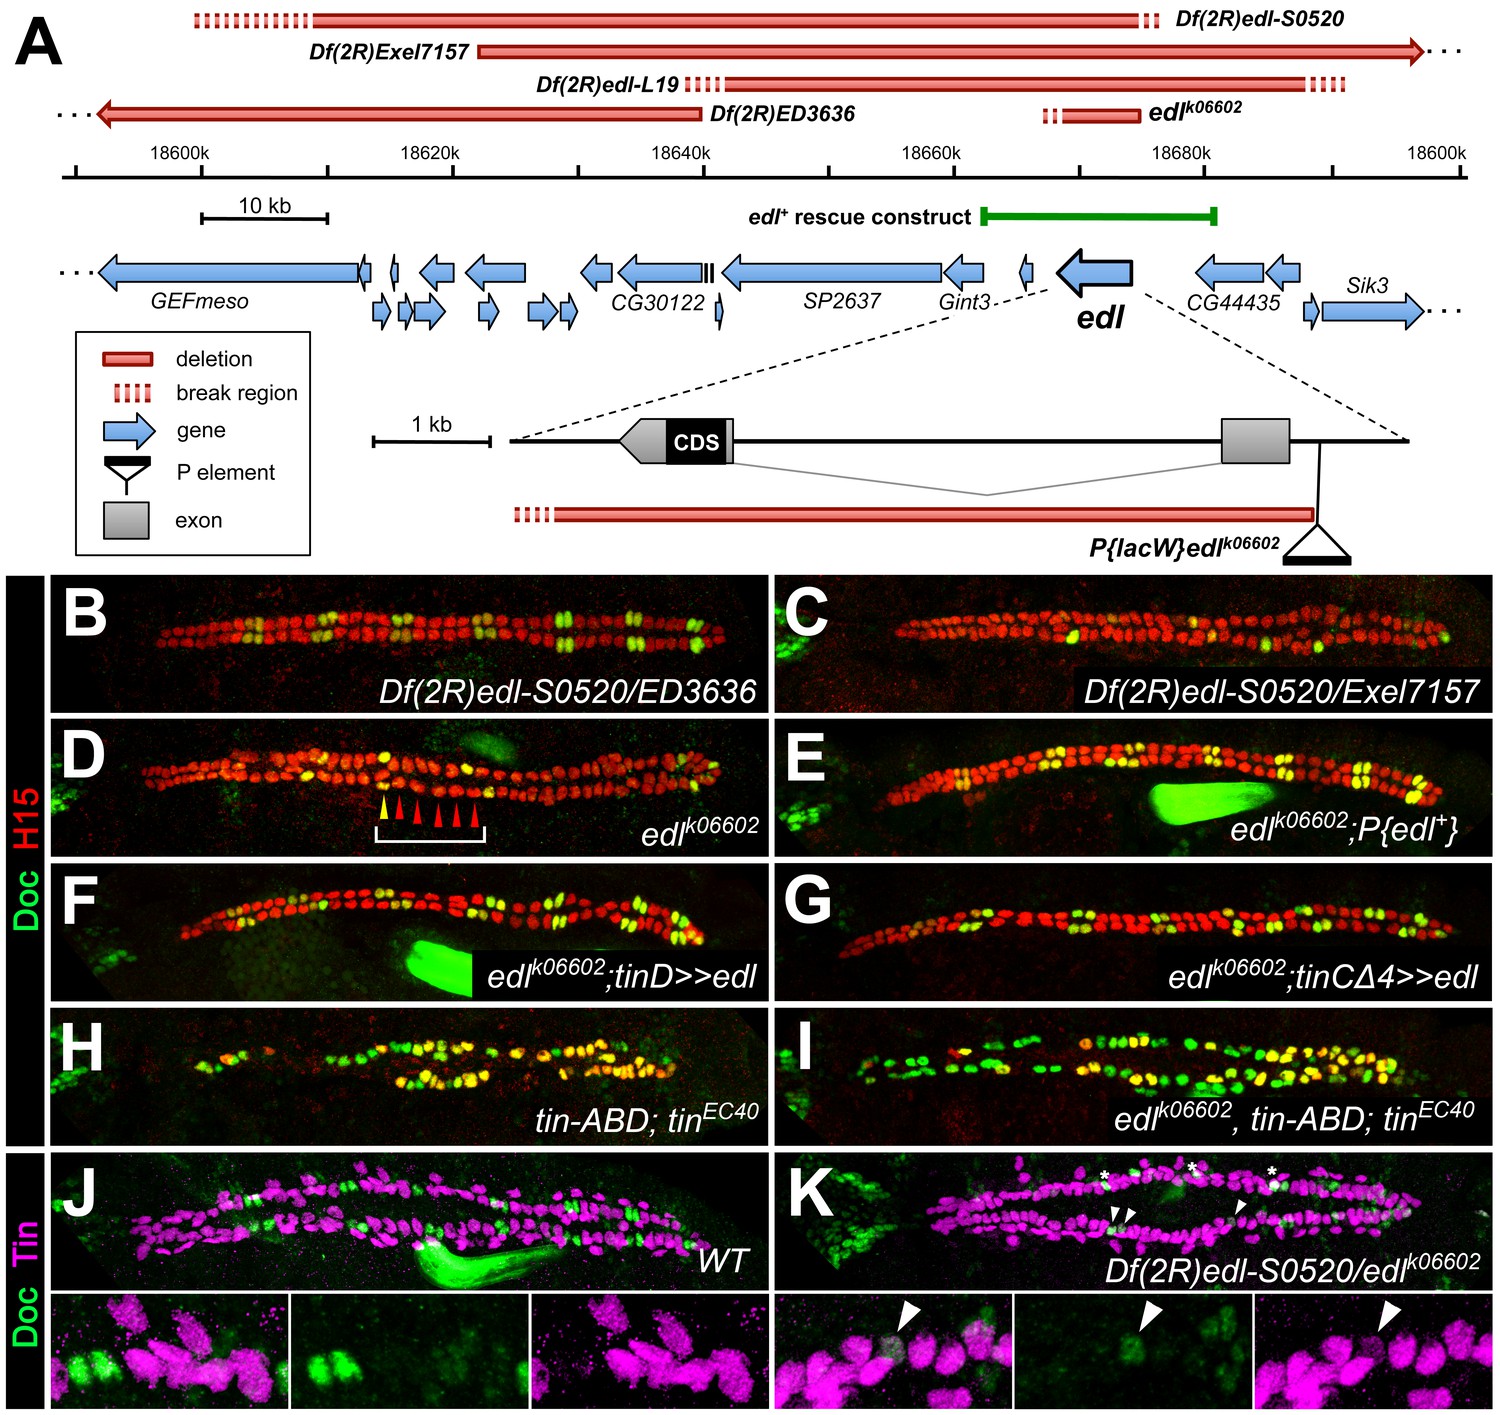
Edl is a decisive factor of ostial cardioblast specification.
(A) Map of the edl locus with the used alleles and deficiencies. (B–I) Doc2+3/H15 stainings as in Figure 1. (B) Embryo with transheterozygous combination of Df(2R)edl-S0520 (edl deleted) and Df(2R)ED3636 (edl present) showing a regular ‘2 + 4’ CB pattern of oCBs and gCBs. By contrast, amorphic edl mutants Df(2R)edl-S0520/Exel7157 (C) and edlk06602 (D) have only few oCBs. Note the occurrence of ‘1 + 5’ CB patterns (bracket). (E) The regular CB pattern is restored by a genomic edl+ transgene. A nearly normal CB pattern is observed in edl mutants upon expression of UAS-edl in the dorsal mesoderm via tinD-GAL4 (F) or only in CBs or their progenitors via tinCΔ4-GAL4 (G). In cardioblast-specific tin mutants (carrying a rescue construct for early tin function) all CBs present become Doc+, irrespective of whether edl is functional (H) or not (I). Observation of some H15- Doc+ CBs in (H) and (I) suggest that robust H15 expression requires normal tin function. (J) Mutually exclusive expression of Doc and Tin proteins in the wild type at late stage 15. (K) In edl mutants, Doc and Tin are co-expressed in some CBs (arrowheads). These oCBs display either low level expression of both Tin and Doc (as exemplified in the magnification) or low levels of Tin concurrent with close to normal levels of Doc. Asterisks denote positions of artificial signal overlap due to co-projection of oCBs and TPCs.
Figure 4—figure supplement 1
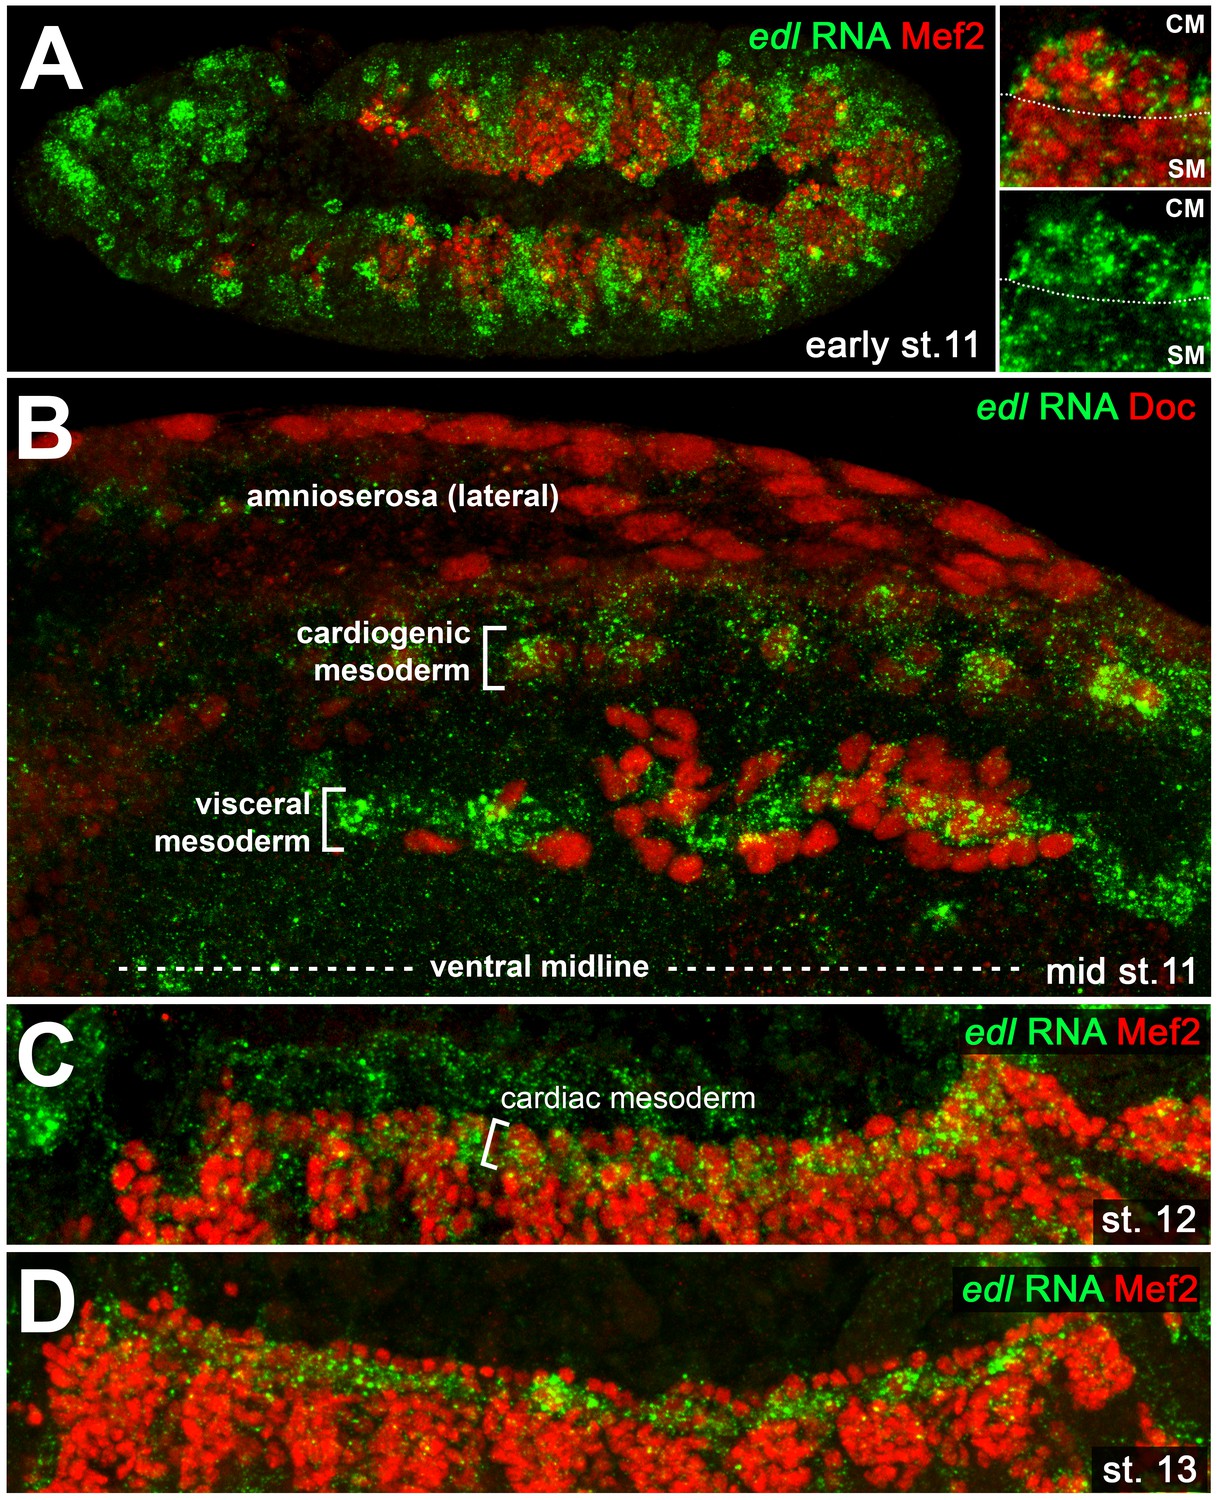
Cardiac edl expression.
Detection of edl RNA in wild type embryos co-stained against Mef2 (A,C,D; lateral views) or Doc (B; dorsal view). (A) Early stage 11 embryo showing strong edl expression in numerous ectodermal and mesodermal tissues including the Mef2-positive areas of the early cardiogenic mesoderm (CM) and parts of the somatic mesoderm (SM). (B) Stage 11 embryo in which edl RNA is strongly expressed in Doc+ cardiogenic clusters. High expression is also seen in the band of trunk visceral mesoderm founders, but not in adjacent migrating longitudinal visceral muscle founders (also Doc+). (C) Cardiac edl expression persists during germ band retraction. (D) Thereafter, it fades in the cardioblasts but continues to be expressed in the pericardial region.
Figure 4—figure supplement 2

Dynamic expression of edl in the cardiogenic mesoderm as detected by an intron-specific probe.
To get a better spatio-temporal resolution of edl expression, we used an intron-specific riboprobe (edlintron) to detect nuclear edl RNA in triple stainings with anti-Doc3+2 and anti-Mef2 in stage 10 to early 12 wild type embryos (A–D) or with anti-Doc3+2 and anti-β-galactosidase in late stage 11 embryos carrying a heterozygous copy of svpAE127-lacZ (E, E'). Shown are mesodermal Z projections (5–7 µm) of about two consecutive abdominal mesoderm segments (borders indicated by dashes). Filled arrowheads (magenta for presumed ostial progenitors with high Doc expression) point to nuclei positive for nuclear edl transcripts. Empty arrowheads (e) mark ectodermal edl expression spots artificially projected to the vicinity of Mef2+ nuclei. (A) In mid-stage 10 embryos, only very few nuclei, including the large Doc-negative ones in the center (*, corresponding to Eve+ nuclei) of the presumptive cardiogenic mesoderm (cm) are positive for edl expression. vm: portion of the invaginating visceral mesoderm. (B, C) Numerous Doc+/Mef2+ nuclei in the definitive cardiogenic mesoderm (adjacent to the more strongly Mef2-expressing Doc- cells) transcribe edl during stage 11. tp: edl expression in tracheal pits. (D, E) edl expression is prominently observed in the presumptive ostial progenitors (strongly Doc + nuclei near mesodermal segment boundaries, co-stained for svp-LacZ in E) at the transition from stage 11 to stage 12.
Figure 5 with 2 supplements
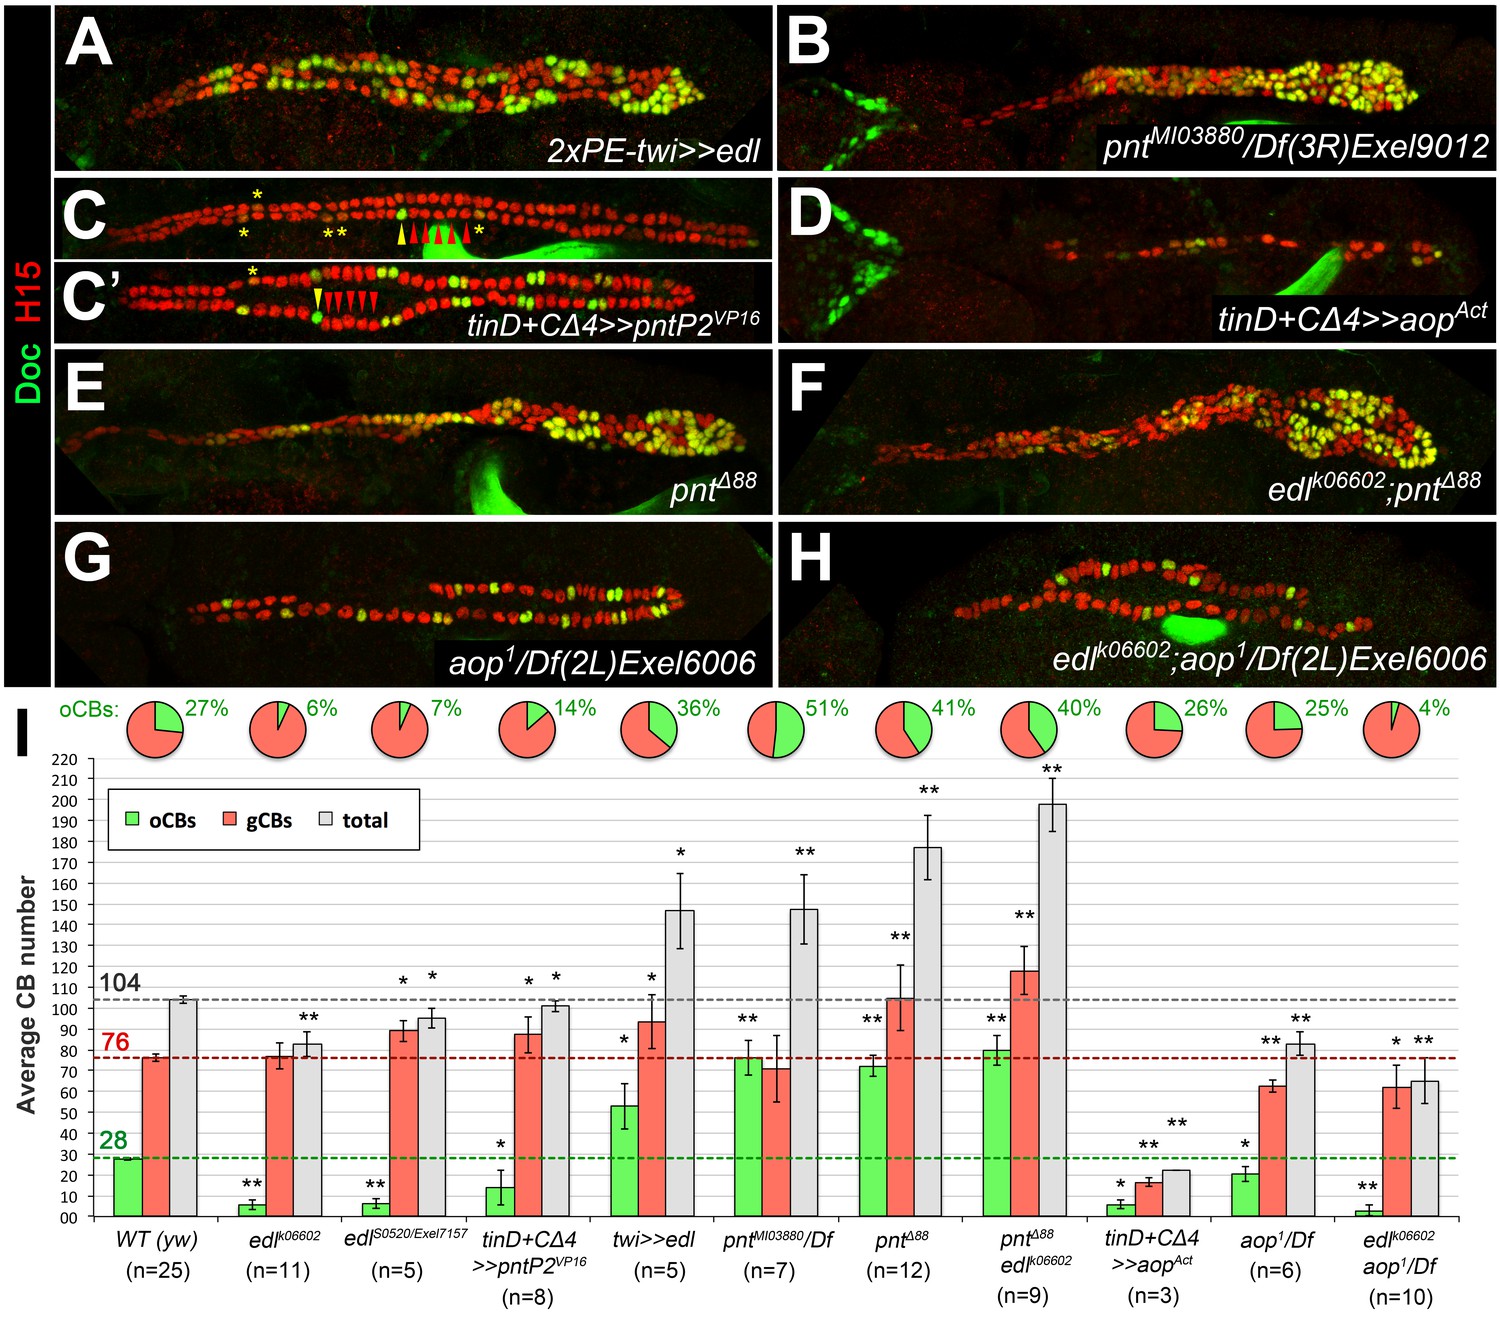
Edl promotes oCB fate via inhibition of PntP2.
(A–H) CB pattern in embryos with modified activity of edl and/or genes encoding the ETS proteins Pnt and Yan revealed by H15/Doc2+3 stainings. (A) Pan-mesodermal edl overexpression via twist-GAL4 leads to extra CBs with a disproportionately high increase in oCB numbers. This phenotype is reminiscent to that of the pnt mutants pntMI03880 (a PntP2-specific mutant; here in trans with a pnt-deleting deficiency, (B) and pntΔ88 (without any functional Pnt isoform, (E). (C,C') Conversely, an edl mutant-like phenotype (loss/conversion of oCBs, exemplified by arrowheads for one hemisegment, and CBs with low Doc levels marked by asterisks) is generated by overexpression of a constitutively active PntP2 variant in the dorsal/cardiogenic mesoderm. C and C' depict strong and weak phenotypes, respectively. (D) Overexpression of the constitutively active repressor Yan/Aop leads to a loss of both gCBs and oCBs. (E,F) The CB phenotypes of pnt and edl pnt double mutants are very similar suggesting that edl acts mainly by blocking Pnt activity during CB specification. (G) Hemizygous aop mutant showing a moderate reduction of both CB types. (H) edl aop double mutant combining aop-like and edl-like defects. (I) Quantification of cardioblasts in various genotypes affecting Edl, Pnt or Yan/Aop activities (annotated as in Figure 1M).
-
Figure 5—source data 1
Quantification of cardioblasts in various genotypes affecting Edl, Pnt or Yan/Aop activities.
- https://doi.org/10.7554/eLife.32847.020
Figure 5—figure supplement 1
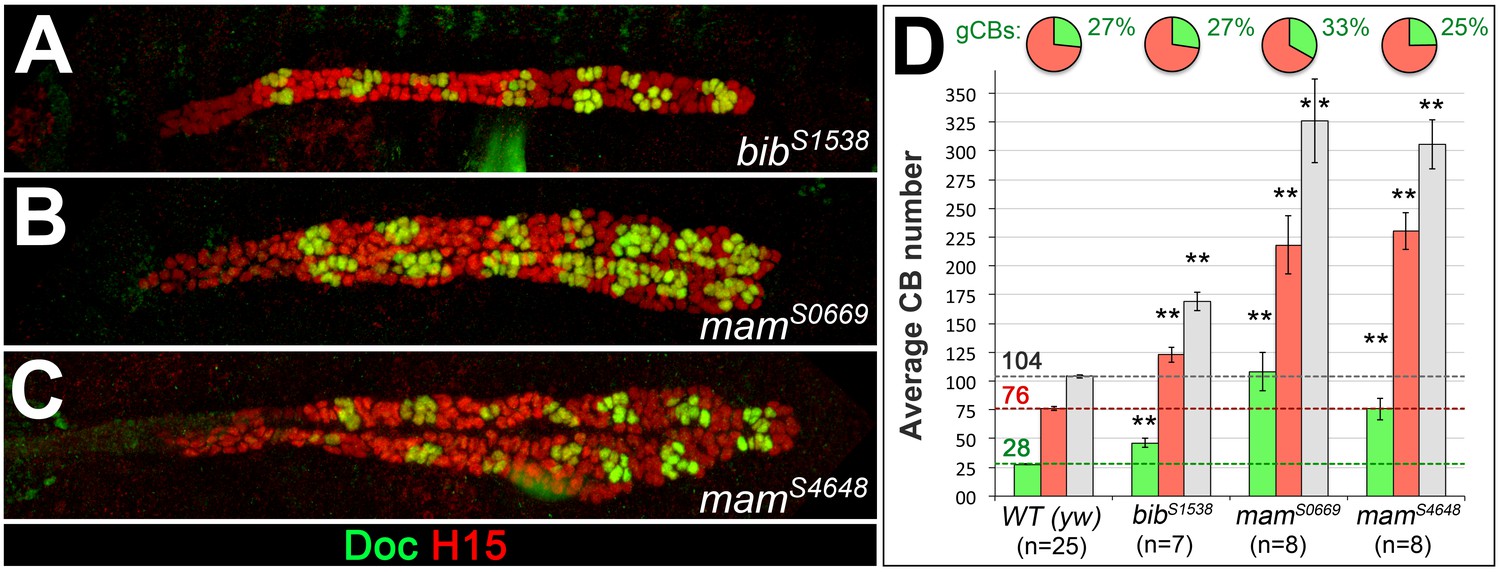
The numbers of both generic and ostial cardioblasts increase upon mutation of genes involved in Notch signaling.
Stage 16 embryos of Notch signaling-related mutants obtained by our EMS screen stained for H15 and Doc as in Figure 1. Mutants of big brain (bib, A) and mastermind (mam, B and C) show an increase in both ostial and generic CBs. In these mutants, the relative fraction of oCBs is close to the wild type (bibS1538 and mamS4648) or increased (mamS0669). None of the mutants features the extreme overrepresentation of oCBs observed in pnt mutants (Figure 5B,E,I) and the segmental pattern is usually still clearly recognizable.
-
Figure 5—figure supplement 1—source data 1
Quantification of cardioblasts in Notch signaling-related genotypes.
- https://doi.org/10.7554/eLife.32847.018
Figure 5—figure supplement 2
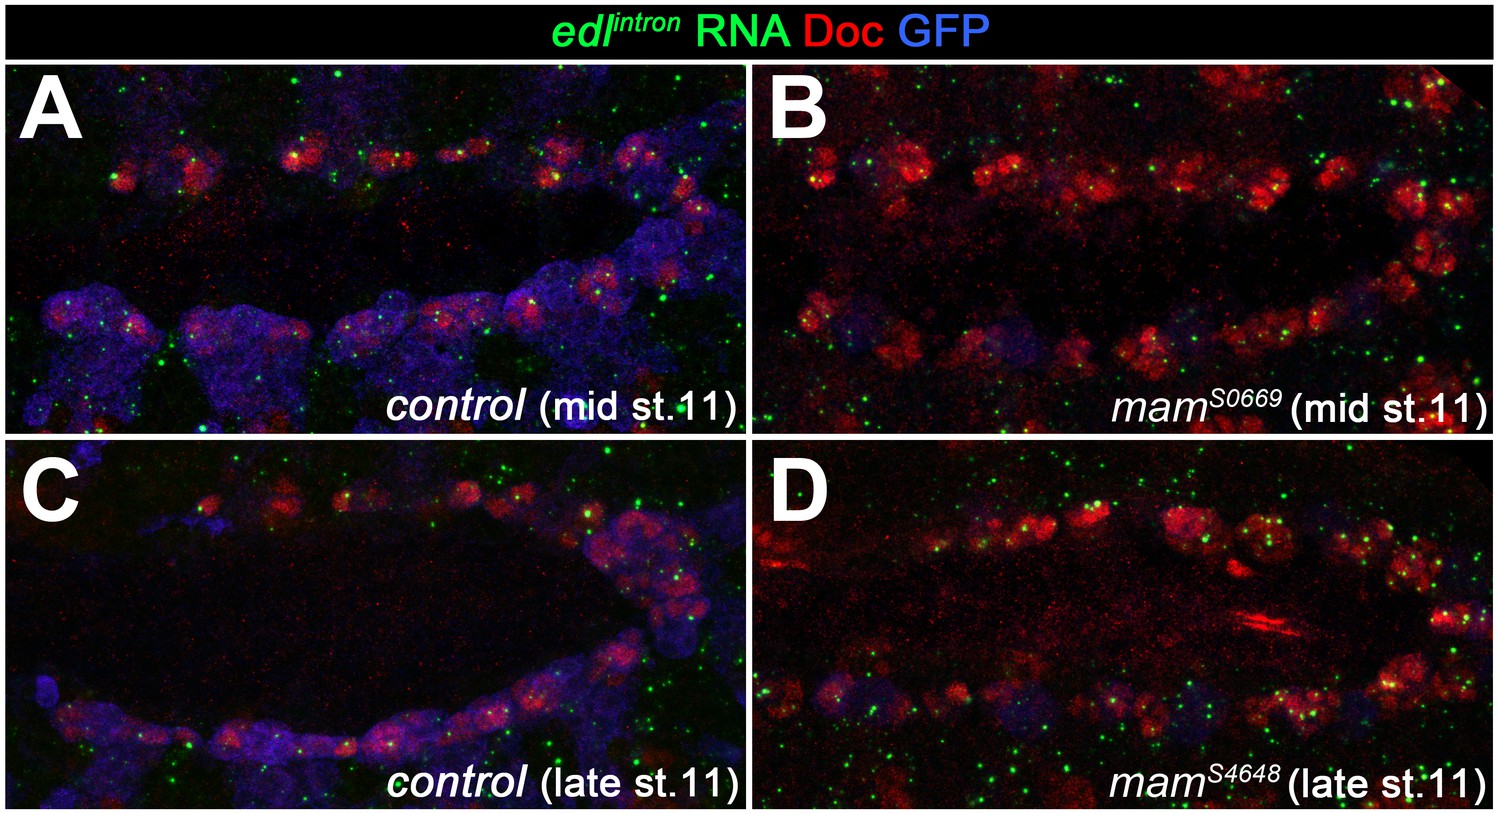
Expression of edl in the cardiogenic mesoderm is still observed in Notch signaling-related mutants.
In order to test for the possibility that edl is upregulated by Notch in oCB progenitors as has been reported for other cell types, edl expression was analyzed in Notch-related mutants. Shown are mid- and late-stage 11 embryos stained for nuclear edl RNA expression (intron-specific probe) and co-stained with anti-Doc3+2(to label the cardiogenic mesoderm) and anti-GFP (to discriminate CyO, twi >>EGFP balancer-carrying control embryos from their mutant siblings; low levels of GFP are derived from the tinC*-GFP reporter present on the mutant chromosome). In comparison to the balancer-carrying controls (A, C), no reduction of edl RNA signal was observed in mam mutants (B, D). An apparent increase in the number of signals likely reflects the presence of extra progenitors.
Figure 6 with 1 supplement
Edl is required for svp expression.
(A) In stage 12 control embryos (lateral view) carrying one copy of svpAE127-lacZ, β-galactosidase is detected in oCBs (arrows) and their sibling OPCs (arrowheads) within the Mef2-labeled mesoderm. (B) Cardiac svp-LacZ expression is strongly reduced in edl mutants (Df(2R)edl-S0520/Exel7157;svpAE127-lacZ/+). (C–E) Odd/svp-LacZ staining in stage 16 embryos. (C) In the control, each hemisegment contains two oCB-related svp-LacZ+ OPCs and two svp-LacZ- OPCs. The total number of OPCs decreases if edl is absent (Df(2R)edl-S0520/edl-L19;svpAE127-lacZ/+) (D) or overexpressed (E), but different OPC subpopulations account for these losses: svp-LacZ+ OPCs (arrowheads) are reduced in edl mutants, svp-LacZ- OPCs in edl overexpressing embryos. (E,F) Pan-mesodermal overexpression of edl leads to a drastic increase in the number of svp-LacZ+/Doc+ cardioblasts (Odd-). Compare F to the control in Figure 3F. (G,H) Mef2/Doc2+3/β-galactosidase staining in svp-lacZ/+ controls (G) and embryos overexpressing constitutively active pntP2VP16 in the dorsal mesoderm (H). Overexpression of pntP2VP16 via tinD-GAL4 leads to significantly reduced svp and Doc expression (examples labeled with green asterisks; average number of Svp+ CBs: 20.6 ± 3.0, p=0,00069**; accompanied by an increased number of Svp- CBs: 83.4 ± 2.6, p=0.00015**; n = 7) as compared to normal oCBs (red asterisks). LG: lymph gland, RG: ring gland, FB: fat body.
Figure 6—figure supplement 1
Epistatic relationship between edl and svp.
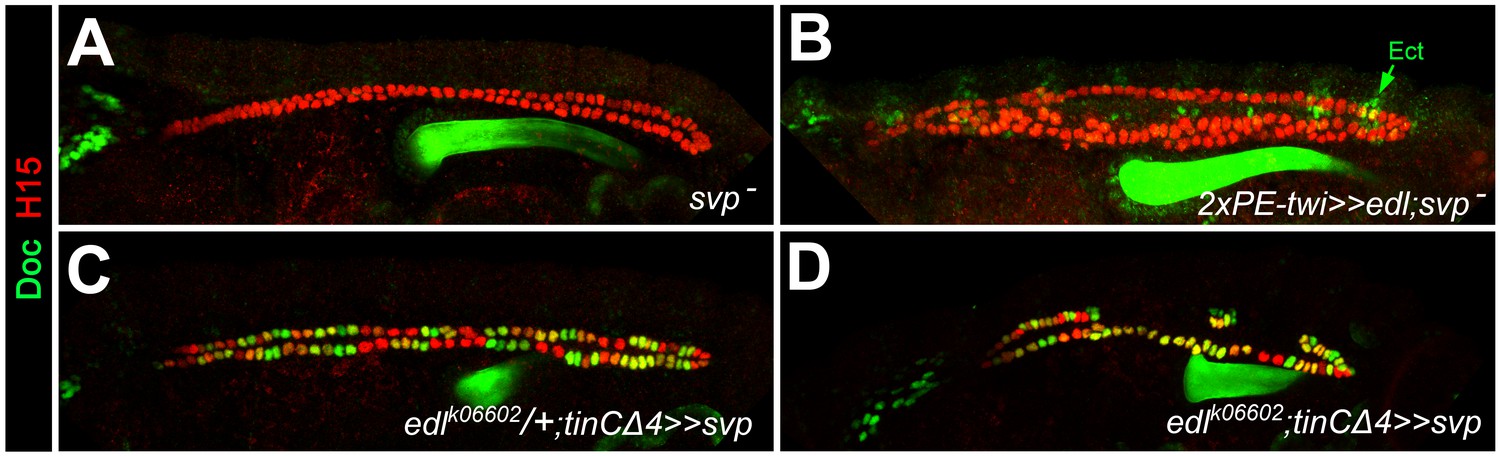
Embryos stained for H15 and Doc as the wild-type control in Figure 1A. (A) Loss of Doc expression in homozygous svpAE127 mutants. (B) All CBs remain Doc-negative upon pan-mesodermal edl overexpression in the svpAE127 mutant background. (C) Overexpression of svp in CBs leads to ectopic Doc expression. Sporadic reduction in H15 expression (green CBs) may result from repression of tin, since similar H15 reductions were observed in CB-specific tin-mutants (Figure 4H). (D) In the absence of edl, forced expression of svp with the same driver also expands the population of Doc+ CBs. This suggests that svp is epistatic to edl during of CB patterning.
Figure 7 with 2 supplements
PntP1 and Mid are specifically expressed in early gCB progenitors to antagonize oCB fate.
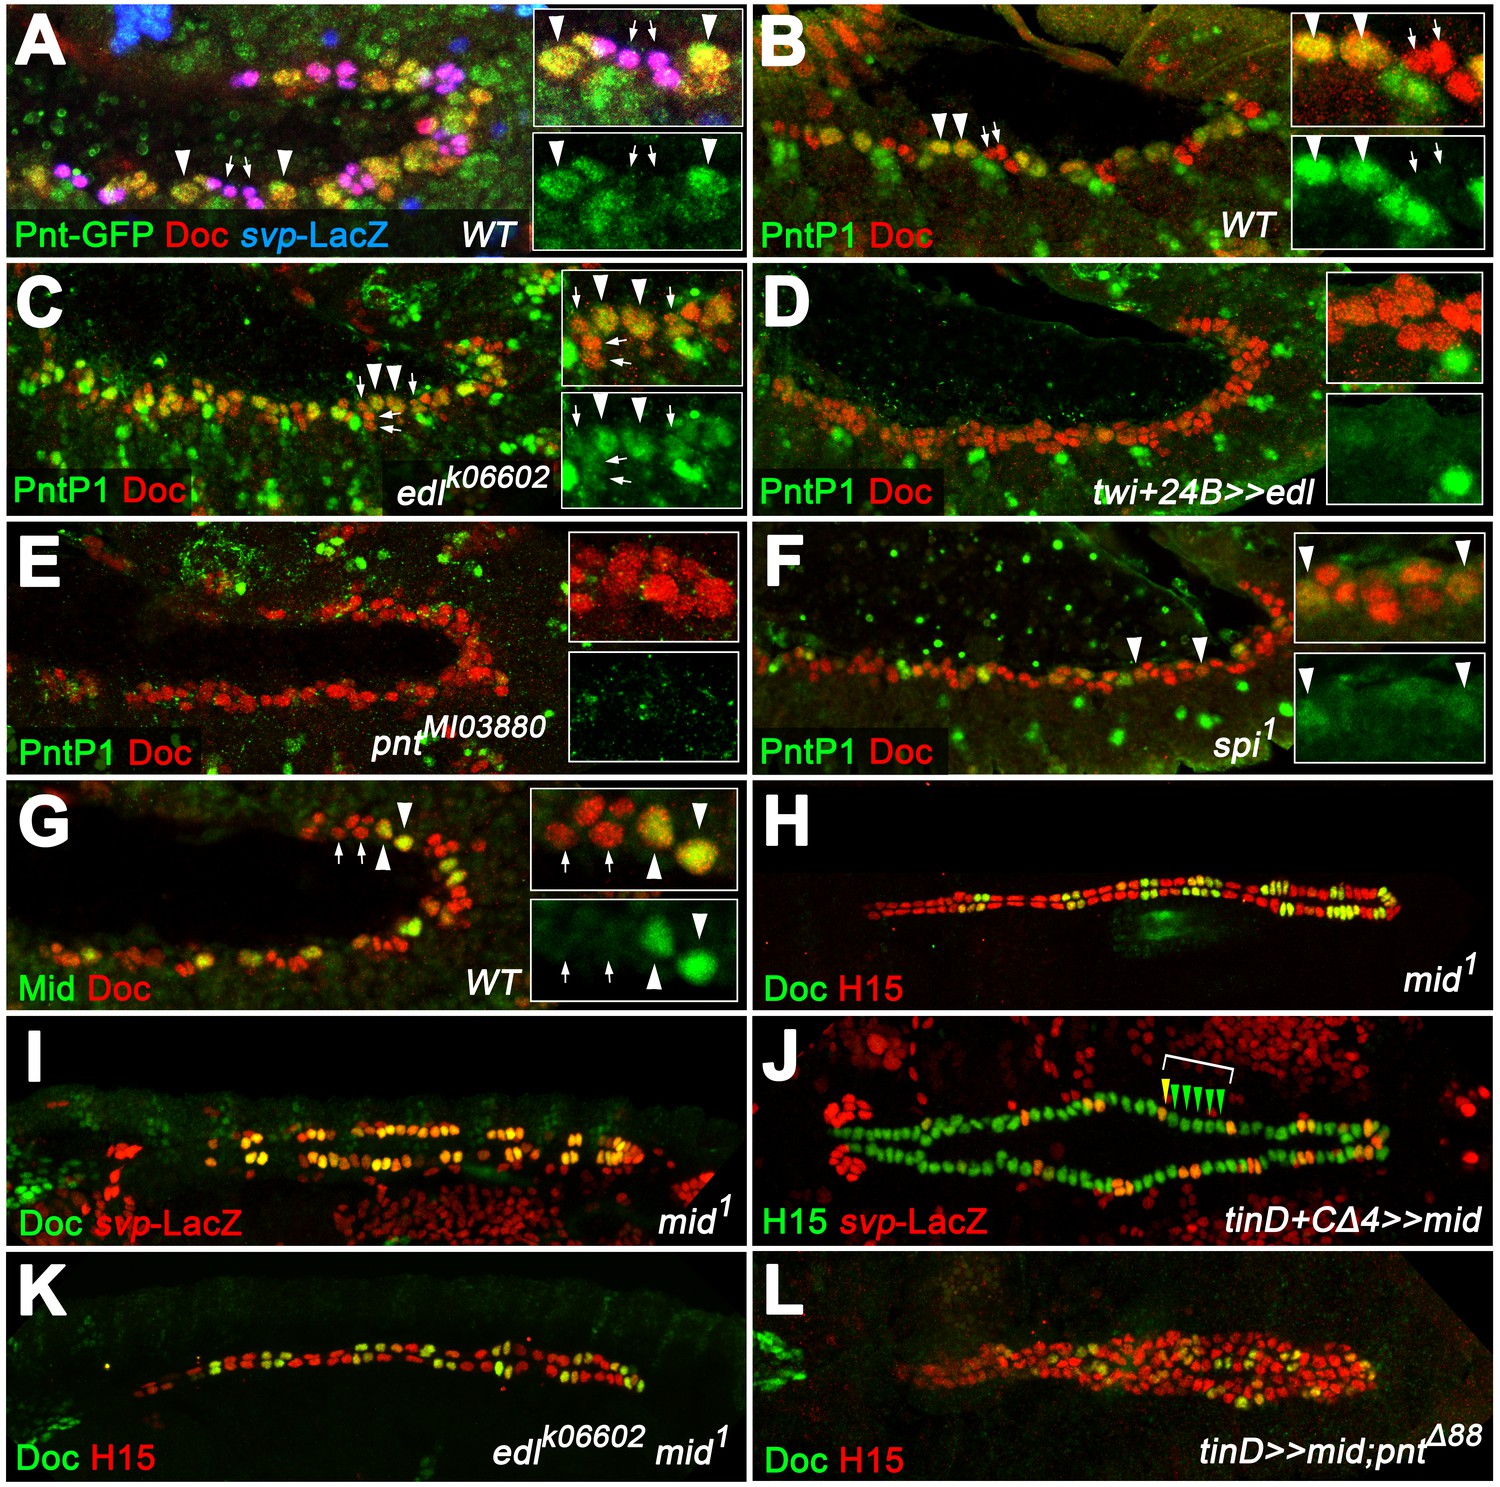
(A) Detection of Doc3+2, β-galactosidase and GFP-tagged Pnt (all isoforms) in a pnt-GFP/+; svpAE127-lacZ/+ embryo at the beginning of stage 12 (lateral view). Highest levels are observed in gCB progenitors (large svp-LacZ-negative nuclei with low levels of Doc, arrowheads) and low levels in oCBs and their siblings (small svp-LacZ+ nuclei with higher Doc levels, arrows). (B) At the onset of germ band retraction, PntP1 becomes expressed in gCB progenitors (arrowheads) of wild type embryos. Cardiac cells are labeled via anti-Doc3+2 staining. PntP1 is not detected in oCBs and their siblings (arrows). (C) In edl- mutants cardiac PntP1 expression is generally increased and detected ectopically in some small nuclei that correspond to prospective oCBs and their siblings (arrows). (D) Pan-mesodermal overexpression of edl leads to a strong decrease of cardiac PntP1 expression while other mesodermal tissues are less affected. (E) The same effect is seen in pntP2 mutants. (F) In spi mutants PntP1 levels are reduced as well, although not as severely as upon loss of pntP2 function. (G) Like PntP1, Mid protein is found in gCB progenitors (arrowheads), but not in prospective oCBs (arrows) at the beginning of germ band retraction. (H,I) The cardiac phenotype of mid mutants is characterized by variable expansion of Doc, which largely correlates with ectopic svp expression in CBs (I, normal pattern shown in Figure 3F). (J) Overexpression of mid represses svp expression in H15-labeled cardioblasts (arrowheads indicate a hemisegment with five lacZ-negative nuclei). (K) Combining homozygous mid and edl mutations results in the restoration of oCBs in comparison to edl single mutants (Figure 4D), suggesting that edl normally antagonizes mid function. An additional edl function regarding the total CB number is not rescued by abrogation of mid. (L) Overexpression of mid in the dorsal mesoderm via tinD-GAL4 in a pnt null background converts many of the extra oCBs into gCBs (cf. Figure 5E).
Figure 7—figure supplement 1
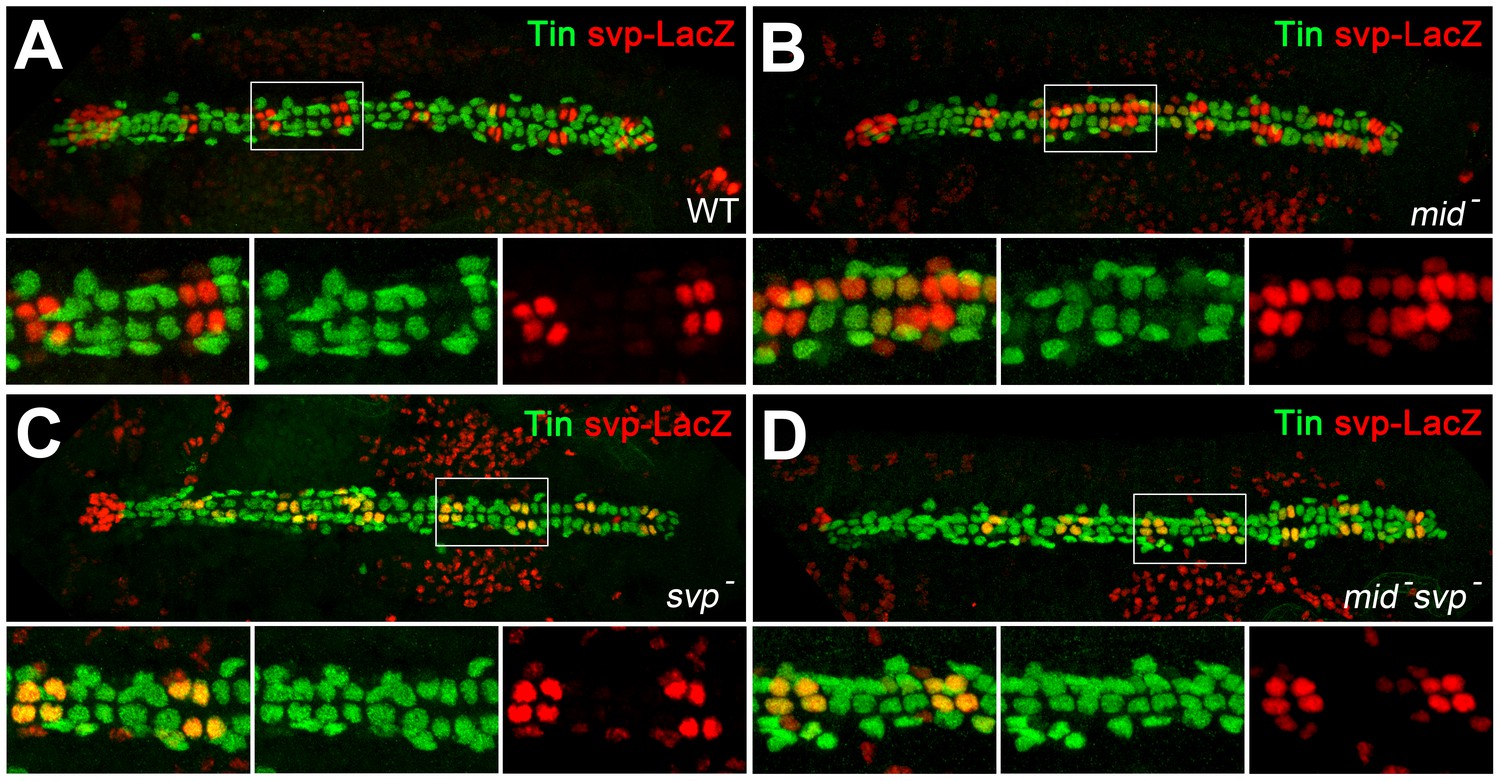
Expression of tin in gCBs is indirectly stabilized by mid via svp repression.
Stage 16 embryos stained against Tin (green) and nuclear β-galactosidase/LacZ (from svpAE127-lacZ, red). (A) Wild type with alternating pattern of two LacZ+ oCBs and four Tin+ gCBs per hemisegment. Tin+ PCs and faintly LacZ+ PCs flank the heart tube. (B) In mid mutants (here mid1/S0021) svp-lacZ expression is expanded into several gCBs, many of which do not contain Tin anymore. (C) In homozygous svpAE127 mutants, Tin expression is expanded into all LacZ+ oCBs. (D) This effect is also observed in mid1 svpAE127 double mutants, and there is no apparent loss of Tin in gCBs, demonstrating that mid is not required to directly promote tin expression in gCBs in absence of Svp. Notably, the expansion of svp-lacZ typical for mid mutants is attenuated in these double mutants, suggesting a necessity of functional Svp for its own ectopic expression.
Figure 7—figure supplement 2
Additional data supporting mid function in gCBs.
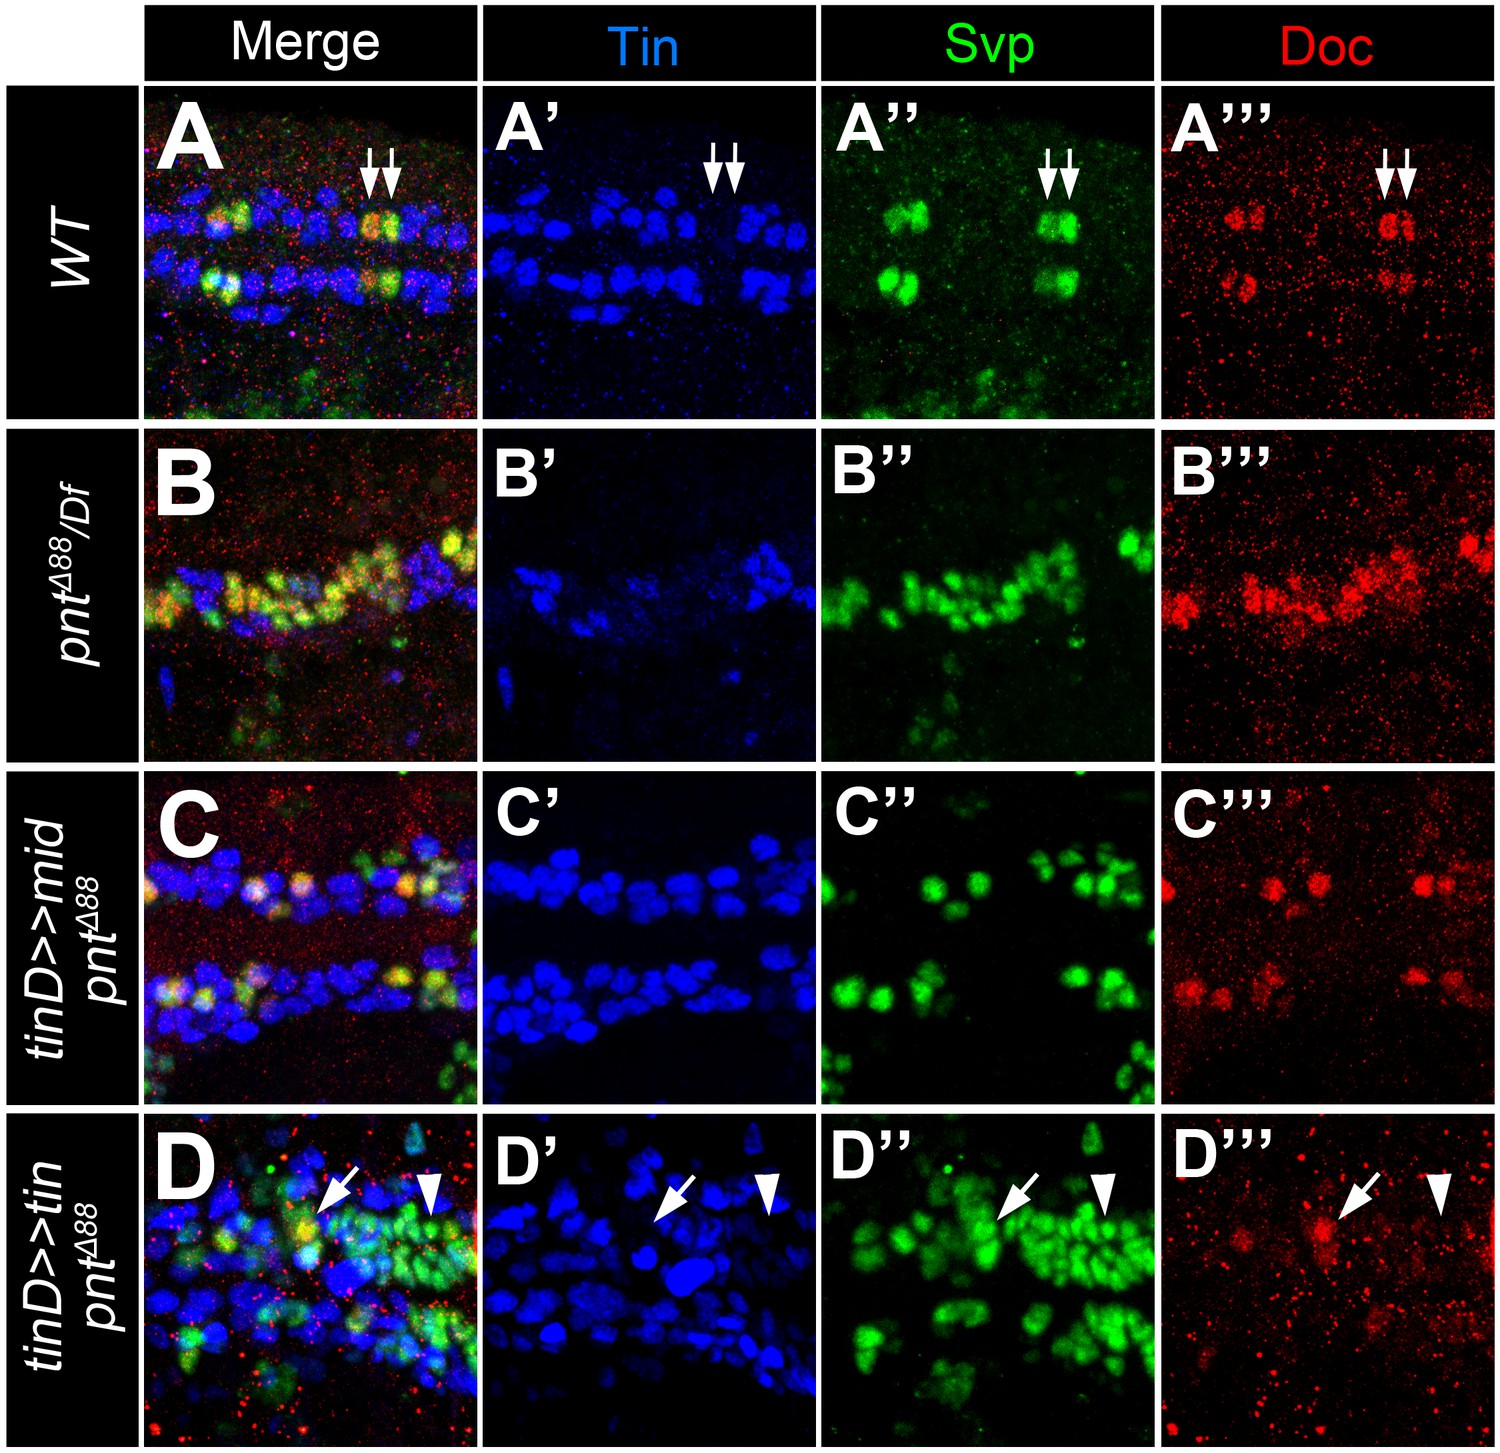
Stainings with antibodies against Svp (green), Doc2+3 (red) and Tin (blue). Shown are representative regions of the developing heart in stage 15–16 embryos (merged and single channels as indicated). (A) Control embryo showing co-expression of Svp and Doc in the Tin-negative oCBs (arrows). (B) In amorphic pnt mutants (this example: pntΔ88/Df(3R)Exel9012) expression of Svp expands simultaneously with Doc. (C) Overexpressing mid in a pnt null background in the dorsal mesoderm via tinD-GAL4 largely reverts the expansion of both Doc and Svp. (D) By contrast, overexpressing tin with the same driver in pnt mutants has a repressive effect on Doc but not Svp expression (arrowheads).
Figure 8
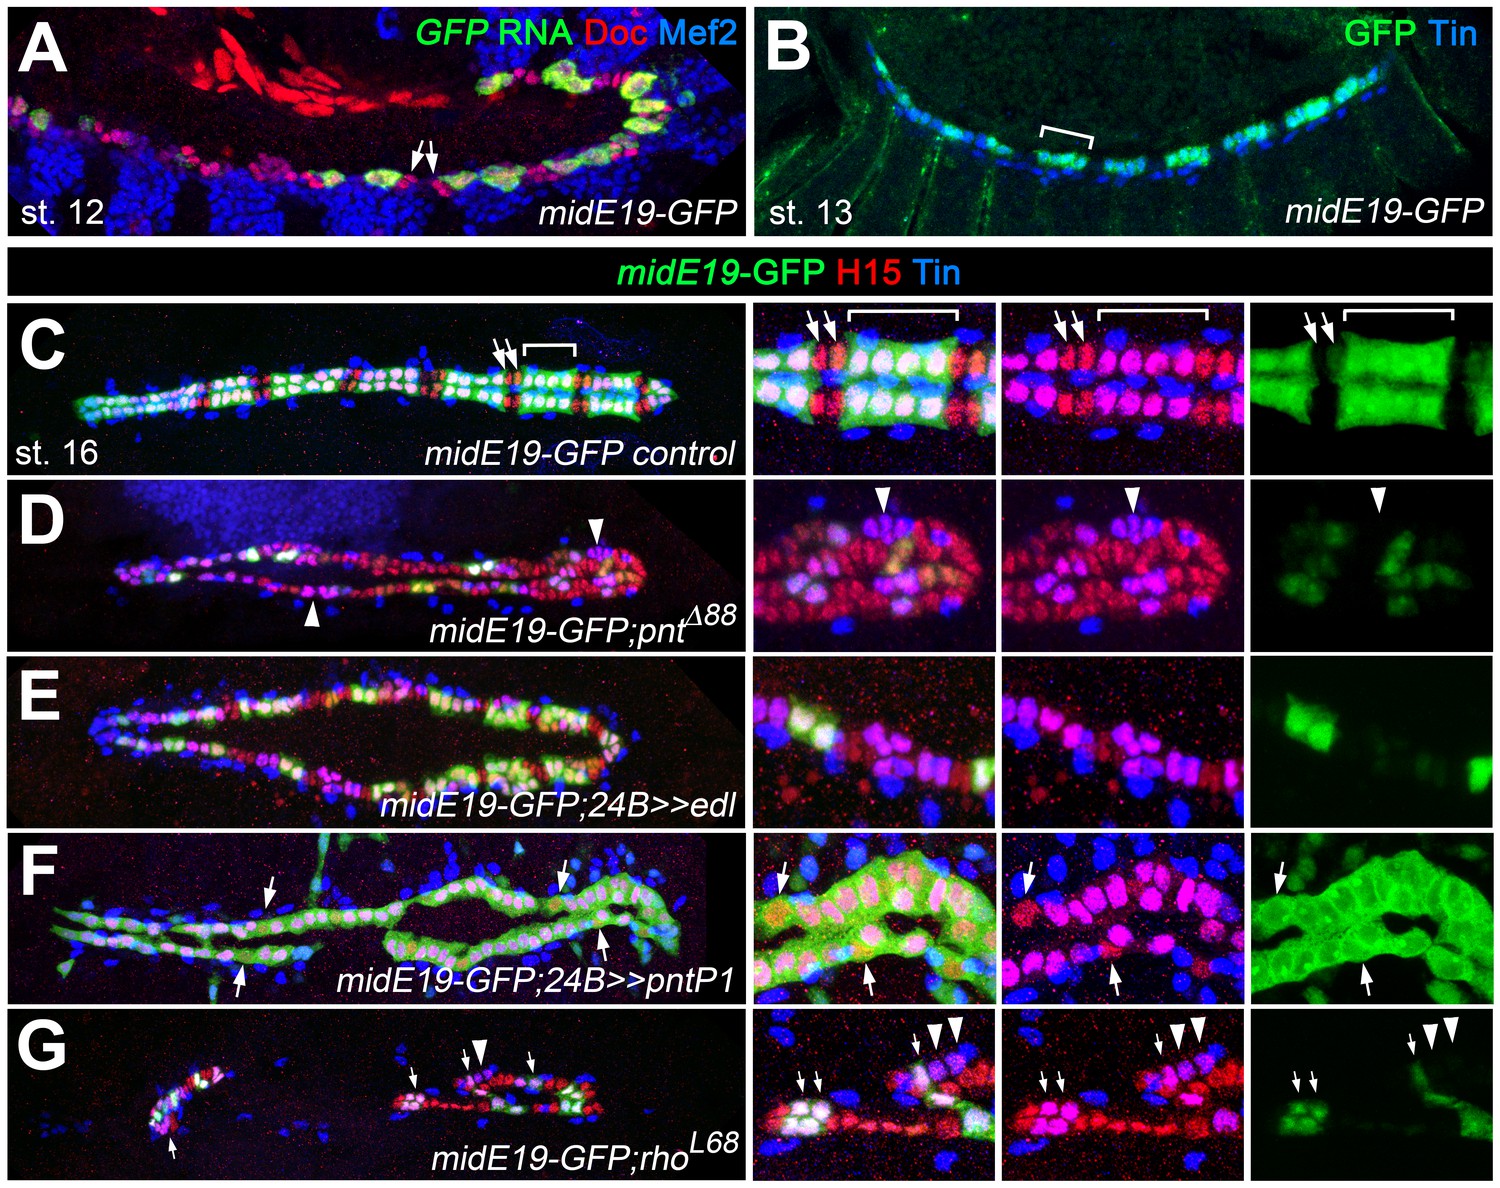
Characterization of a Pnt-responsive mid enhancer.
(A–C) Expression analysis of the midE19-GFP reporter in the wild type background showing segmental expression in gCB progenitors at stage 12 (A: co-expression of GFP RNA, Mef2 and low levels of Doc) and later in the Tin+/H15+ gCBs (bracket; B: stage 14 stained for GFP protein and Tin; C: stage 16 stained for GFP, Tin and H15 proteins). No or very little reporter expression is detectable in oCBs and their presumed precursors (arrows). (D) Despite an overall increase in CB number, midE19-GFP expression is severely reduced in amorphic pnt mutants. Most of the Tin+/H15+ gCBs (purple nuclei, arrowheads) lack GFP expression. (E) Mesodermal overexpression of edl via how24B-GAL4 also leads to a loss of midE19-GFP in many gCBs. (F) Overexpression of pntP1 via how24B-GAL4 leads to nearly continuous midE19-GFP expression in CBs. In some instances, the reporter is activated even in Tin- CBs (arrows). (G) Loss of rho function, which is expected to cause reduced PntP2 activity, leads to a complete loss of GFP in some of the retained gCBs (arrowheads) and a level reduction in others (arrows). In comparison to pnt mutants (D), a higher fraction of gCBs retains substantial GFP expression indicating additional, rho-independent inputs upstream of Pnt.
Figure 9

Additional experimental support for the regulation of mid by the ETS factor Pnt.
Expression of GFP RNA (A, stage 13) and protein (C, stage 16) driven by the minimal cardiac mid enhancer, mid180, is less robust than midE19-GFP but shows essentially the same expression pattern. The minimal enhancer contains a single ETS binding motif flanked by two Tin-binding sites (indicated in the scheme below). (B,D) Mutating the ETS-binding site leads to near-complete abolishment of mid180-GFP expression. (E–J) Analysis of mid mRNA expression in cardiac cells doubly stained with anti-Doc3+2 antibody. In the wild type, mid mRNA is first detected in gCB progenitors at early stage 12 (E); its expression begins to expand during germ band retraction (G) until it reaches continuous expression in all CBs at stage 13 (I). By contrast, amorphic pnt mutants show reduced cardiac mid expression during germ band retraction (F,H). Regular uniform mid expression is observed only after germ band retraction (J).
Figure 10 with 1 supplement
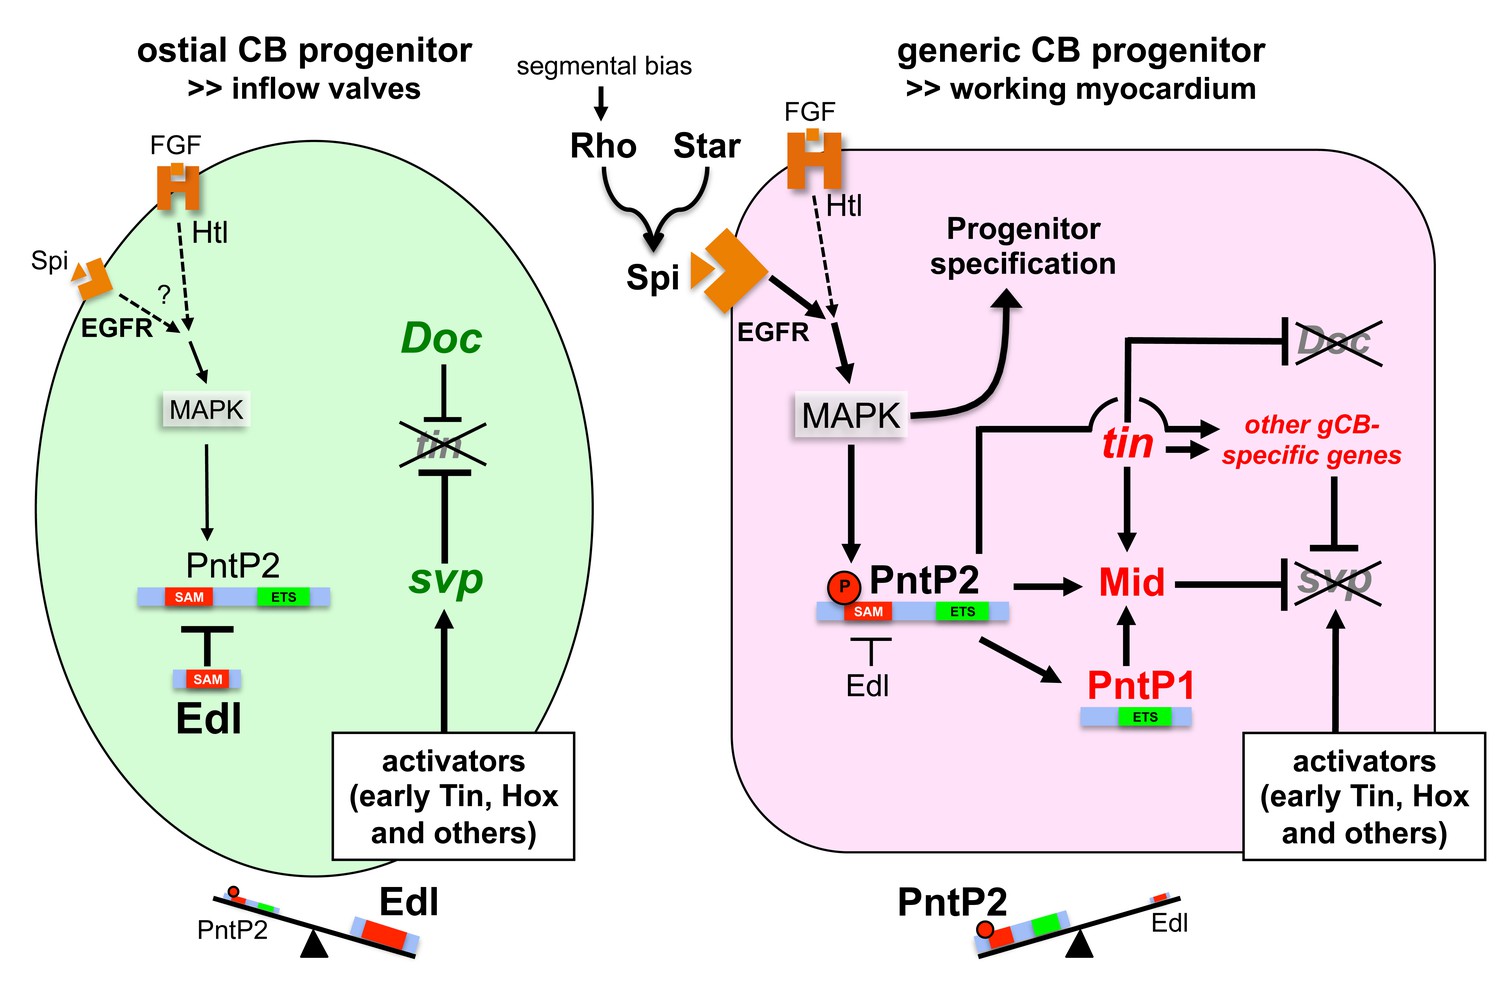
Model of regulatory interactions in generic and ostial CB progenitors.
Genes activated in a subtype-specific manner in gCB or oCB progenitors are colored in red and green, respectively. Larger font sizes and thicker lines indicate higher levels. Dashed lines indicate presumed regulations. In principle, MAPK can be activated in cardiac progenitors by EGF/EGFR and FGF/Htl signals. Generic cardioblast development depends on EGF-activated MAPK signaling which provides pnt-independent and pnt-dependent functions. The suppression of svp and subsequent regulation of tin and Doc is a pnt-dependent function that is in part mediated by activation of mid in presumptive gCBs. This step is likely to be supported by the gCB-specific expression of constitutive active PntP1. The gCB-specific cascade may require a higher level of MAPK activity to overcome the blockage of PntP2 by Edl. Alternatively or in addition, Edl levels might be differentially regulated in gCBs and oCBs by yet unknown mechanisms. In oCB progenitors, Edl keeps activated PntP2 below a critical threshold leading to absence or delayed onset of expression of oCB fate antagonists such as mid. This in turn permits svp activation by Hox genes and Tin derived from early stages. Presumed transcriptional activators of svp acting downstream of segmental Hh signals in oCB progenitors are not mandatory in this model, although it does not categorically exclude such contributions. Some details and additional interactions have been omitted for clarity. For a more complex version of the model see the corresponding figure supplement.
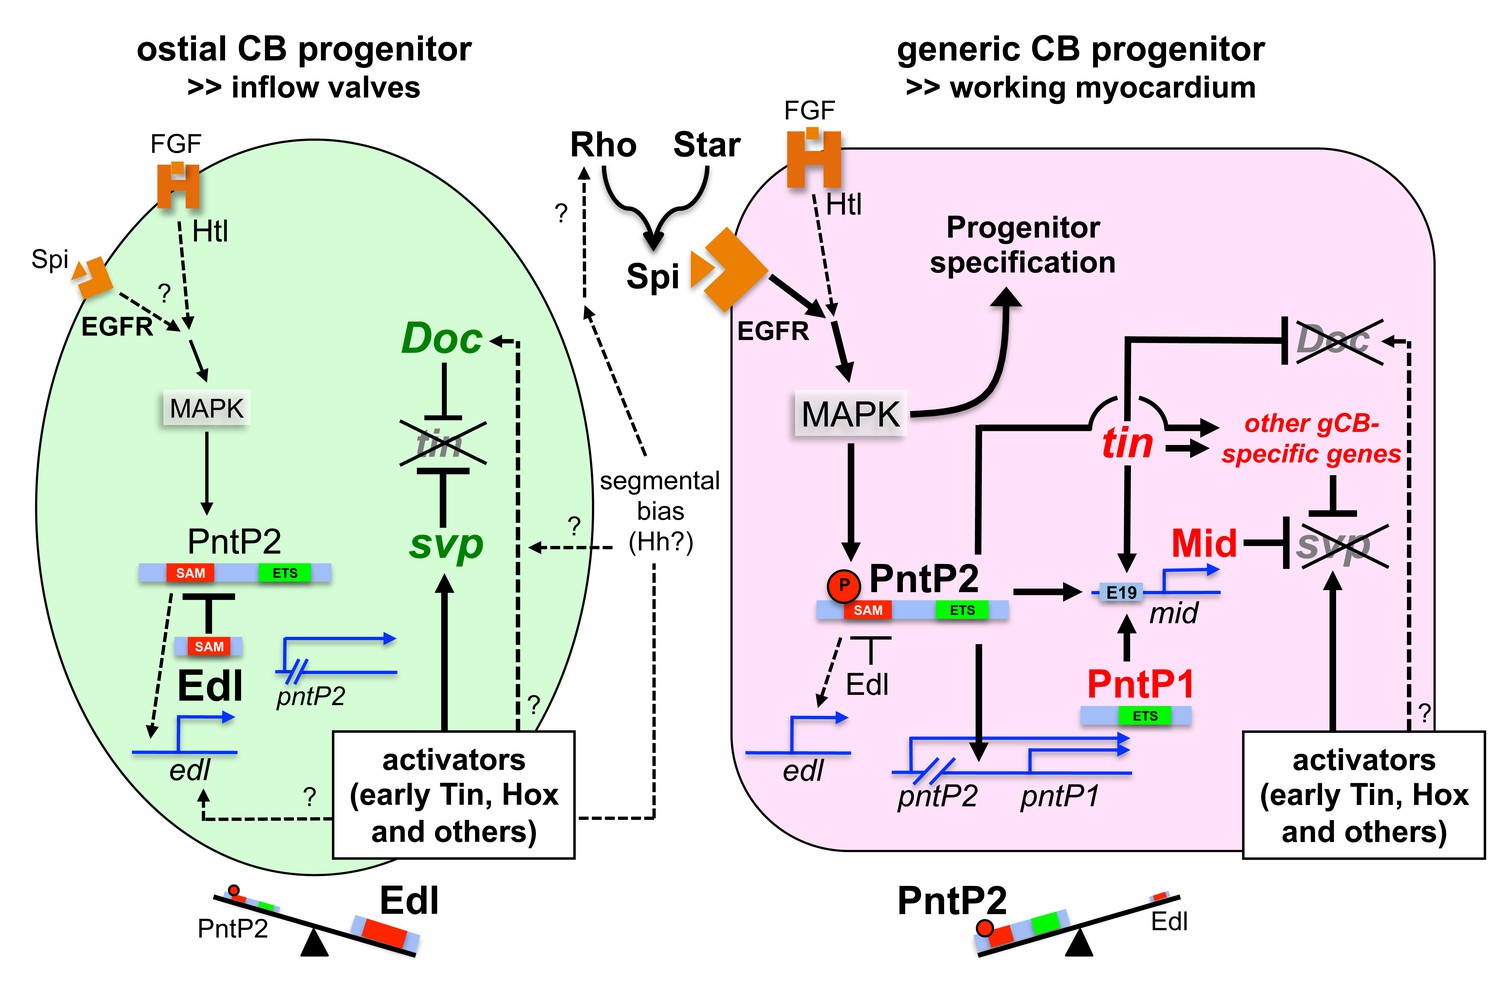
Figure 10—figure supplement 1
Extended model of regulatory interactions in generic and ostial CB progenitors.
In addition to the model shown in the main figure, this model includes direct regulation of mid by Pnt via the midE19 enhancer and possible regulation of edl by Pnt (deducted from analogy to other systems and similarities in the pattern of edl expression and dpMAPK activity) or other activators (e.g. early cardiogenic factors and unknown segmental inputs). Furthermore, possible inputs from segmentation genes (Hh) as proposed in the literature and elucidated in the discussion have been added.
Tables
Key resources table
| Reagent type (species) or resource | Designation | Source or reference | Identifiers | Additional information |
|---|---|---|---|---|
| Genetic reagent (Drosophila melanogaster) | S-18a-13b-16b.1 | PMID: 24935095 | starter stock used for EMS mutagenesis; genotype: y[*] w[*]; P{RedH-Pelican.org-1-HN18-dsRed, w[+mC]}18a, P{pGD130.tinC*-GFP, y[+]}13b, P{RedH-Pelican.HLH54Fb- dsRed, w[+mC]}16b | |
| Genetic reagent (D. melanogaster) | S-18a-13b-16c.1 | PMID: 24935095 | starter stock used for EMS mutagenesis; genotype: y[*] w[*]; P{RedH-Pelican.org-1-HN18-dsRed, w[+mC]}18a, P{pGD130.tinC*-GFP, y[+]}13b, P{RedH-Pelican.HLH54Fb- dsRed, w[+mC]}16 c | |
| Genetic reagent (D. melanogaster) | aop[1] | Bloomington Drosophila Stock Center | BDSC:3101 | |
| Genetic reagent (D. melanogaster) | bib[S1538] | this paper | mutation in S-18a-13b-16c.1 background | |
| Genetic reagent (D. melanogaster) | Df(2R)edl-S0520 | this paper | mutation in S-18a-13b-16b.1 background | |
| Genetic reagent (D. melanogaster) | edl[k06602] | Bloomington Drosophila Stock Center | BDSC:10633; FBal0057093 | |
| Genetic reagent (D. melanogaster) | Df(2R)edl-L19 | Y. Hiromi, PMID: 12874129 | FBab0037748 | |
| Genetic reagent (D. melanogaster) | P{edl.AF1}BS12; P{edl[+]} | this paper | derived from injection with pCaSpeR4-X18C12-edl_rescue; line # BS12 carries P{edl.AF1} on chromosome 3 | |
| Genetic reagent (D. melanogaster) | Egfr[f2] | Bloomington Drosophila Stock Center | BDSC:2768 | |
| Genetic reagent (D. melanogaster) | Egfr[S0167] | this paper | mutation in S-18a-13b-16b.1 background | |
| Genetic reagent (D. melanogaster) | Egfr[S2145] | this paper | mutation in S-18a-13b-16c.1 background | |
| Genetic reagent (D. melanogaster) | Egfr[S2307] | this paper | mutation in S-18a-13b-16c.1 background | |
| Genetic reagent (D. melanogaster) | Egfr[S2561] | this paper | mutation in S-18a-13b-16c.1 background | |
| Genetic reagent (D. melanogaster) | htl[YY262] | PMID: 8957001 | ||
| Genetic reagent (D. melanogaster) | mam[S0669] | this paper | mutation in S-18a-13b-16b.1 background | |
| Genetic reagent (D. melanogaster) | mam[S4648] | this paper | mutation in S-18a-13b-16c.1 background | |
| Genetic reagent (D. melanogaster) | mid[1] | Bloomington Drosophila Stock Center | BDSC:3086 | |
| Genetic reagent (D. melanogaster) | mid[S0021] | this paper | mutation in S-18a-13b-16b.1 background | |
| Genetic reagent (D. melanogaster) | midE19-GFP | M. Frasch; PMID: 23326246 | ||
| Genetic reagent (D. melanogaster) | mid180-GFP | this paper | insertion in attP2 | |
| Genetic reagent (D. melanogaster) | mid180-mETS-GFP | this paper | insertion in attP2 | |
| Genetic reagent (D. melanogaster) | pnt[MI03880] | Bloomington Drosophila Stock Center | BDSC:37615 | |
| Genetic reagent (D. melanogaster) | pnt[Δ88] | Bloomington Drosophila Stock Center | BDSC:861 | |
| Genetic reagent (D. melanogaster) | pyr[18] | PMID: 19515694 | ||
| Genetic reagent (D. melanogaster) | pyr[S3547] | PMID: 22609944 | ||
| Genetic reagent (D. melanogaster) | rho[7M43] | Bloomington Drosophila Stock Center | BDSC:1471 | |
| Genetic reagent (D. melanogaster) | rho[L68] | Bloomington Drosophila Stock Center | BDSC:9095 | |
| Genetic reagent (D. melanogaster) | S[S4550] | this paper | mutation in S-18a-13b-16c.1 background | |
| Genetic reagent (D. melanogaster) | S[B0453] | F. Schnorrer; PMID: 18327265 | ||
| Genetic reagent (D. melanogaster) | spi[S3384] | this paper | mutation in S-18a-13b-16c.1 background | |
| Genetic reagent (D. melanogaster) | spi[1] | Bloomington Drosophila Stock Center | BDSC:1859; FBal0016005 | |
| Genetic reagent (D. melanogaster) | svp[AE127]-lacZ | Y. Hiromi, PMID: 11404079 | ||
| Genetic reagent (D. melanogaster) | ths[759] | PMID: 19515694 | ||
| Genetic reagent (D. melanogaster) | ‘tin-ABD;tin[EC40]’ | PMID: 16987868 | ||
| Genetic reagent (D. melanogaster) | UAS-aop.ACT-IIa | Bloomington Drosophila Stock Center | BDSC:5789 | |
| Genetic reagent (D. melanogaster) | UAS-edl-X | Y. Hiromi, PMID: 12874129 | ||
| Genetic reagent (D. melanogaster) | ‘UAS-Egfr[DN].B-29-77-1; UAS-EgfrDN.B-29-8-1’; 2x EGFR[DN] | Bloomington Drosophila Stock Center | BDSC:5364 | |
| Genetic reagent (D. melanogaster) | UAS-mid-B2 | PMID: 15922573 | ||
| Genetic reagent (D. melanogaster) | UAS-pntP1-3 | Bloomington Drosophila Stock Center | BDSC:869 | |
| Genetic reagent (D. melanogaster) | UAS-pntP2[VP16]−2 | C. Klämbt; PMID: 11051548 | ||
| Genetic reagent (D. melanogaster) | UAS-p35 | Bloomington Drosophila Stock Center | BDSC:5073 | |
| Genetic reagent (D. melanogaster) | UAS-rho[EP3704] | Bloomington Drosophila Stock Center | BDSC:17276 | |
| Genetic reagent (D. melanogaster) | UAS-rho(ve.dC) | Bloomington Drosophila Stock Center | BDSC:8858 | |
| Genetic reagent (D. melanogaster) | UAS-svp | M. Hoch | ||
| Genetic reagent (D. melanogaster) | how[24B]-GAL4; 24B | Bloomington Drosophila Stock Center | BDSC:1767 | |
| Genetic reagent (D. melanogaster) | tinCΔ4-GAL4 | M. Frasch; PMID: 11404079 | ||
| Genetic reagent (D. melanogaster) | tinD-GAL4 | J. Weiss; PMID: 16221729 | ||
| Genetic reagent (D. melanogaster) | 2xPE-twi-GAL4 | Bloomington Drosophila Stock Center | BDSC:2517 | |
| Genetic reagent (D. melanogaster) | Df(2L)Exel6006 | Bloomington Drosophila Stock Center | BDSC:8000 | |
| Genetic reagent (D. melanogaster) | Df(2R)BSC25 | Bloomington Drosophila Stock Center | BDSC:6865 | |
| Genetic reagent (D. melanogaster) | Df(2R)Exel7157 | Bloomington Drosophila Stock Center | BDSC:7894 | |
| Genetic reagent (D. melanogaster) | Df(3R)Exel9012 | Bloomington Drosophila Stock Center | BDSC:7990 | |
| Genetic reagent (D. melanogaster) | lbe-GFP | Bloomington Drosophila Stock Center | BDSC:55822 | |
| Genetic reagent (D. melanogaster) | pnt-GFP | Bloomington Drosophila Stock Center | BDSC:42680 | |
| Recombinant DNA reagent | pCaSpeR4-X18C12- edl_rescue (plasmid) | Y. Hiromi, P MID: 12874129 | P transformation plasmid for generation of P{edl.AF1} | |
| Antibody | anti-Doc2+3 (guinea pig polyclonal) | PMID: 12783790 | (1:2000, TSA) | |
| Antibody | anti-Doc3+2 (guinea pig polyclonal) | PMID: 12783790 | (1:1000) | |
| Antibody | anti-H15 (rabbit polyclonal) | J. Skeath; PMID: 19013145 | (1:2000) | |
| Antibody | anti-H15 (guinea pig polyclonal) | J. Skeath; PMID: 19013145 | (1:2000) | |
| Antibody | anti-Mid (rabbit polyclonal) | J. Skeath; PMID: 19013145 | (1:250, TSA or 1:1000) | |
| Antibody | anti-PntP1 (rabbit polyclonal) | J. Skeath; PMID: 12756183 | (1:250) | |
| Antibody | anti-Mef2 (rabbit polyclonal) | H.T. Nguyen | (1:1500) | |
| Antibody | anti-Odd (rat polyclonal) | PMID: 9683745 | (1:600, TSA) | |
| Antibody | anti-Eve (rabbit polyclonal) | PMID: 2884106 | (1:3000) | |
| Antibody | anti-Tin (rabbit polyclonal) | PMID: 9362473 | (1:750) | |
| Antibody | anti-Zfh1 (rabbit polyclonal) | R. Lehmann; PMID: 9435286 | (1:2000) | |
| Antibody | anti-dpMAPK (mouse monoclonal) | Sigma | (1:500, TSA) | |
| Antibody | anti-Seven-up 5B11 (mouse monoclonal) | Developmental Studies Hybridoma Bank | (1:20, TSA) | |
| Antibody | anti-Wg 4D4 (mouse monoclonal) | Developmental Studies Hybridoma Bank | (1:30, TSA) | |
| Antibody | anti-β-galactosidase 40- 1a (mouse monoclonal) | Developmental Studies Hybridoma Bank | (1:50, TSA or 1:20) | |
| Antibody | anti-β-galactosidase (rabbit polyclonal) | Cappel | (1:1500) | |
| Antibody | anti-GFP (rabbit polyclonal) | Molecular Probes | Molecular Probes:A6455 | (1:2000) |
| Antibody | anti-GFP (rabbit polyclonal) | Rockland | Biomol:600-401-215 | (1:1000) |
| Antibody | anti-GFP 3E6 (mouse monoclonal) | Life Technologies | Life Technologies:A11120 | (1:100, TSA) |
| Antibody | anti-cleaved-Caspase-3 Asp175 (rabbit polyclonal) | Cell Signaling Technology | Cell Signaling Technology:#9661 | (1:100, TSA) |
| Antibody | sheep anti-Digoxigenin (sheep polyclonal) | Roche | Roche:11333089001 | (1:1000, TSA) |
| Commercial assay or kit | VectaStain Elite ABC-HRP kit | Vector Laboratories | Linaris:PK-6100 | |
| Commercial assay or kit | tyramide signal amplification (TSA) reagent Cy3 | PerkinElmer | PerkinElmer: SAT704A001EA | |
| Commercial assay or kit | tyramide signal amplification (TSA) reagent Fluorescein | PerkinElmer | PerkinElmer: SAT701001EA | |
| Commercial assay or kit | TUNEL apoptosis detection kit (Apoptag) | Millipore | Millipore:S7100 |
Additional files
-
Supplementary file 1
Table S1.
Alleles with cardioblast patterning defects isolated and/or characterized in this study. The table lists the results from the genetic, phenotypic and molecular analysis of the characterized mutants. Indicated nucleotide positions are relative to transcription start site of transcript RA and amino acid positions of protein isoform PA (FB2017_01, released February 14, 2017; D. melanogaster R6.14); * indicates a nonsense mutation, n.d.: not determined.
- https://doi.org/10.7554/eLife.32847.030
-
Supplementary file 2
Table S2.
Characterization of edl deletions via PCR. Presence (+) or absence (-) of DNA fragments after PCR reaction including genomic DNA from homozygous S-18a-13b-16c.1 control (WT), Df(2R)edl-S0520, edlk06602 or Df(2R)edl-L19 animals and primer pairs as indicated. CDS: part of coding sequence, TSS: transcription start site, n.d.: not determined. Amplicons are listed in linear order as located on chromosome 2R. * Six additional intronic GEFmeso amplicons were also negative in S0520.
- https://doi.org/10.7554/eLife.32847.031
-
Transparent reporting form
- https://doi.org/10.7554/eLife.32847.032
Download links
A two-part list of links to download the article, or parts of the article, in various formats.
Downloads (link to download the article as PDF)
Open citations (links to open the citations from this article in various online reference manager services)
Cite this article (links to download the citations from this article in formats compatible with various reference manager tools)
Diversification of heart progenitor cells by EGF signaling and differential modulation of ETS protein activity
eLife 7:e32847.
https://doi.org/10.7554/eLife.32847


