Bipolar filaments of human nonmuscle myosin 2-A and 2-B have distinct motile and mechanical properties
- National Heart, Lung and Blood Institute, National Institutes of Health, United States
- National Institute on Deafness and Other Communication Disorders, National Institutes of Health, United States
- National Institutes of Allergy and Infectious Diseases, National Institutes of Health, United States
Figures
Figure 1 with 2 supplements
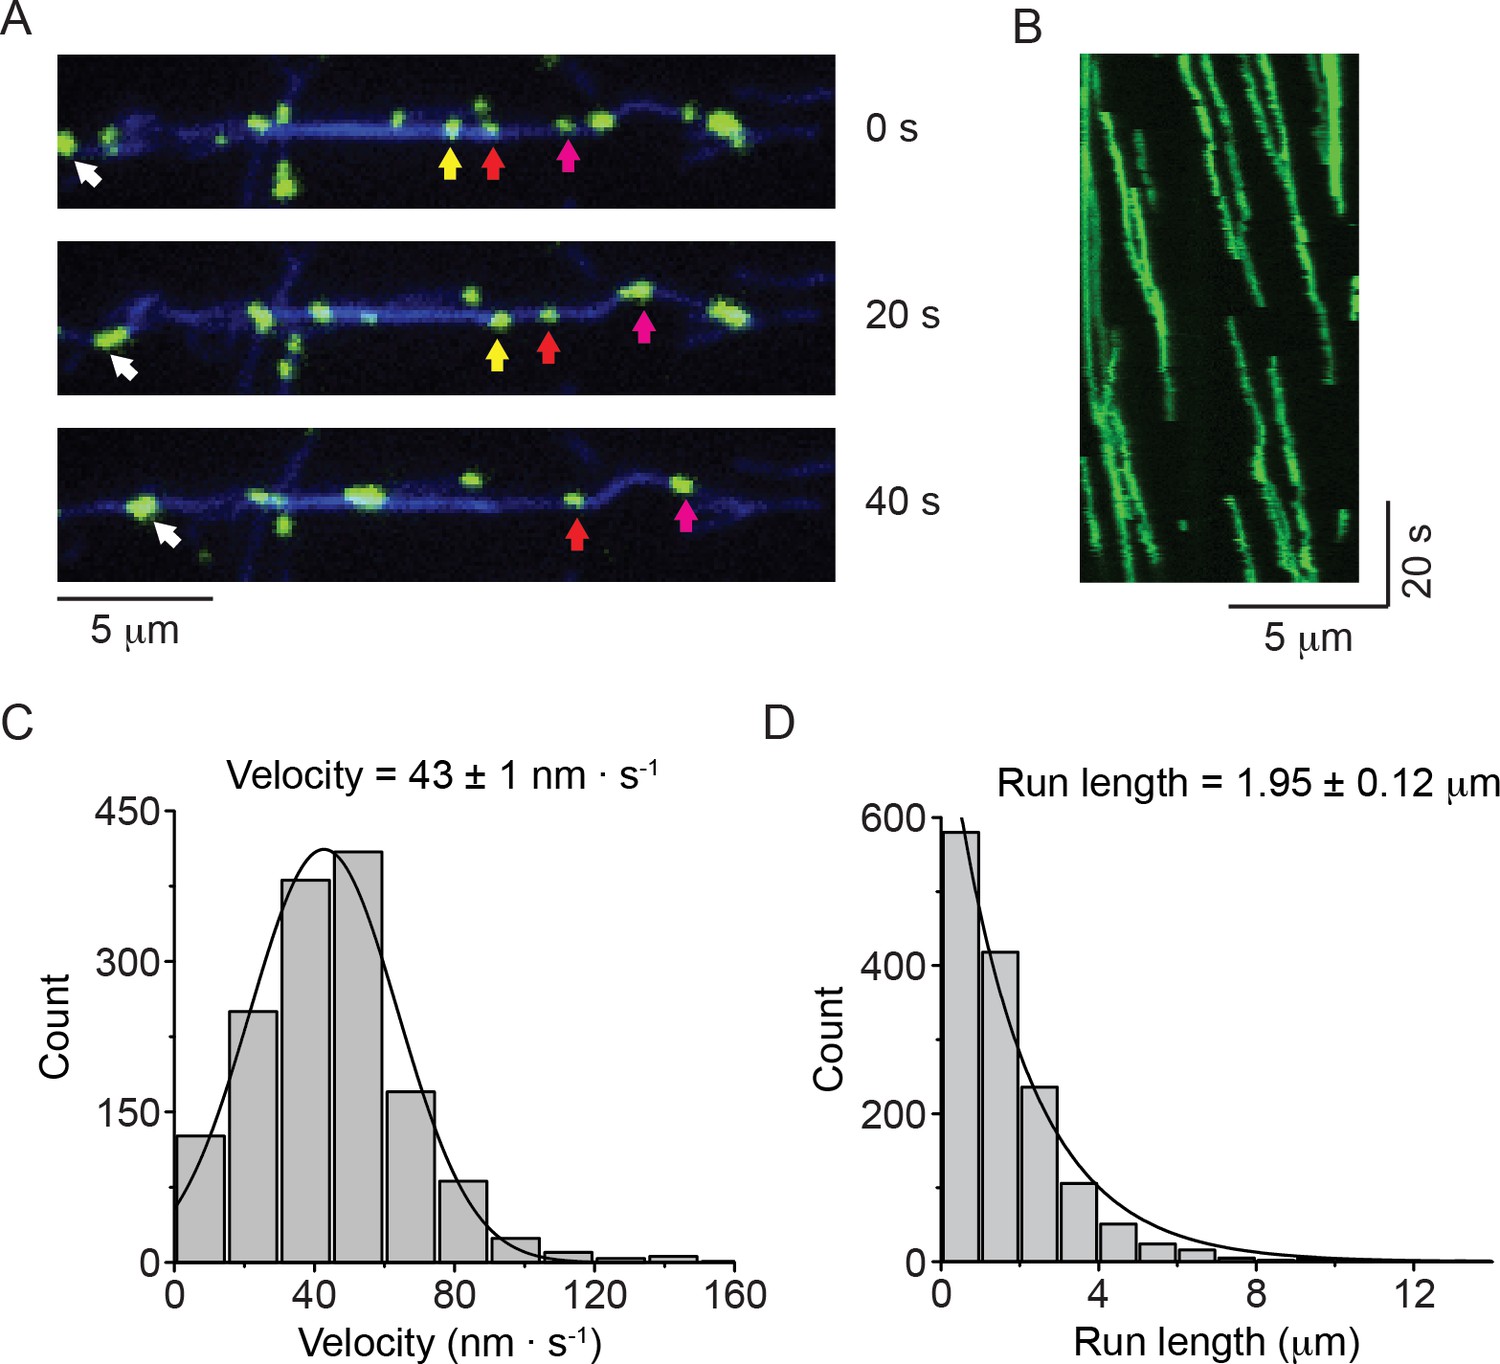
Nonmuscle myosin 2-B filaments move processively along actin filaments.
(A) Movie frames showing HaloTag-NM2-B filaments (individual filaments marked by colored arrows), moving along Alexa Fluor 647 phalloidin labeled actin filaments (blue). (B) Kymograph for NM2-B filaments showing clear processive movement (diagonal lines) and long run lengths. (C) Frequency distribution histogram of NM2-B filament velocity. Black line is the Gaussian fit to the data yielding a velocity of 43 ± 1 nm · s-1(mean ± SEM; SD = 27 nm · s−1, R2 = 0.98). (D) Frequency distribution histogram of NM2-B filament run length. Black line is the single exponential fit to the data. The characteristic velocity and run length with their standard errors obtained from the fits are indicated in the graphs (n = 1463, R2 = 0.99).
-
Figure 1—source data 1
Data for the velocity (panel C) and run length (panel D).
- https://doi.org/10.7554/eLife.32871.007
Figure 1—figure supplement 1
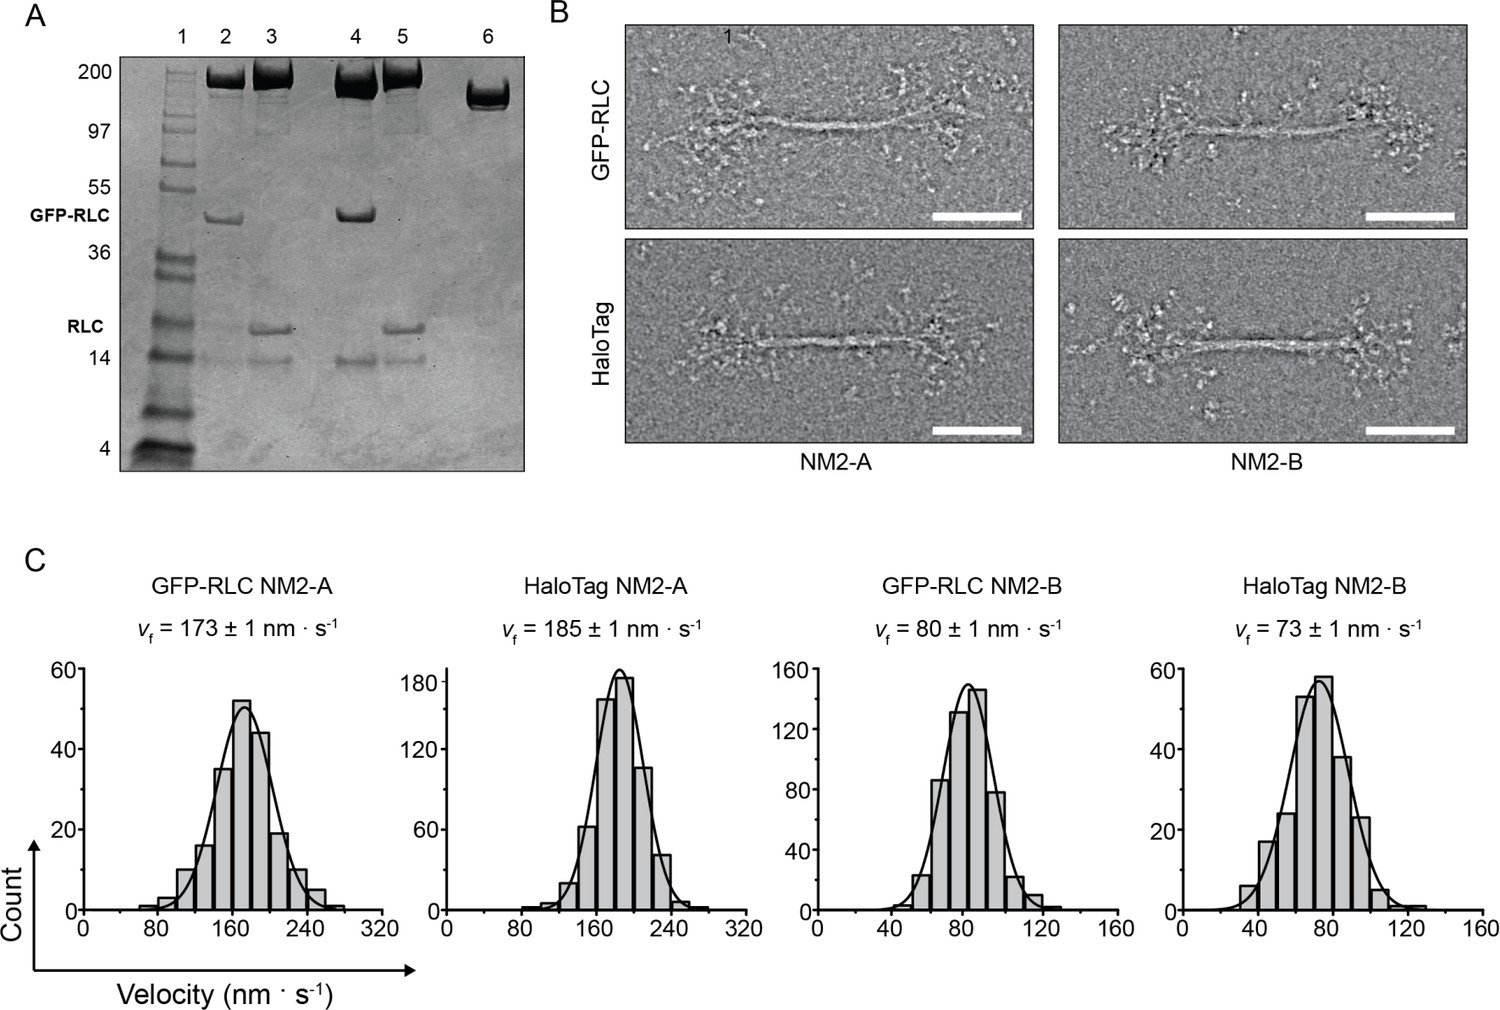
GFP and HaloTags do not significantly interfere with myosin filament structure or motile function.
(A) SDS-polyacrylamide gel of the constructs used in the experiments. The position of the RLC and the GFP-RLC are indicated. Lane 1, Molecular weight markers; lane 2, GFP-RLC-NM2-A; lane 3, HaloTag-NM2-A; lane 4, GFP-RLC-NM2-B; lane 5, HaloTag-NM2-B, lane 6 HaloTag-NM2-B Tail. (B) Negatively stained EM images of the bipolar filaments formed by GFP-RLC- and HaloTag-NM2-A and -NM2-B. For all constructs, the filaments have similar appearances and dimensions as unlabeled NM2-B filaments (Billington et al., 2013). Scale bars 100 nm. (C) Frequency distribution histograms of actin filaments velocity in the actin gliding assays. Black lines are the Gaussian fits to the data. The velocity and standard error obtained from the fit are indicated in each panel. The n value, SD and R2 values are 190, 9 nm · s−1, 0.99; 1617, 11 nm · s−1, 0.99; 471, 18 nm · s−1, 0.98; and 221, 15 nm · s−1, 0.98 for GFP-RLC-NM2-A, HaloTag NM2-A, GFP-RLC-NM2-B and HaloTag-NM2-B, respectively.
-
Figure 1—figure supplement 1—source data 1
Data for the velocity distributions shown in panel C.
- https://doi.org/10.7554/eLife.32871.004
Figure 1—figure supplement 2
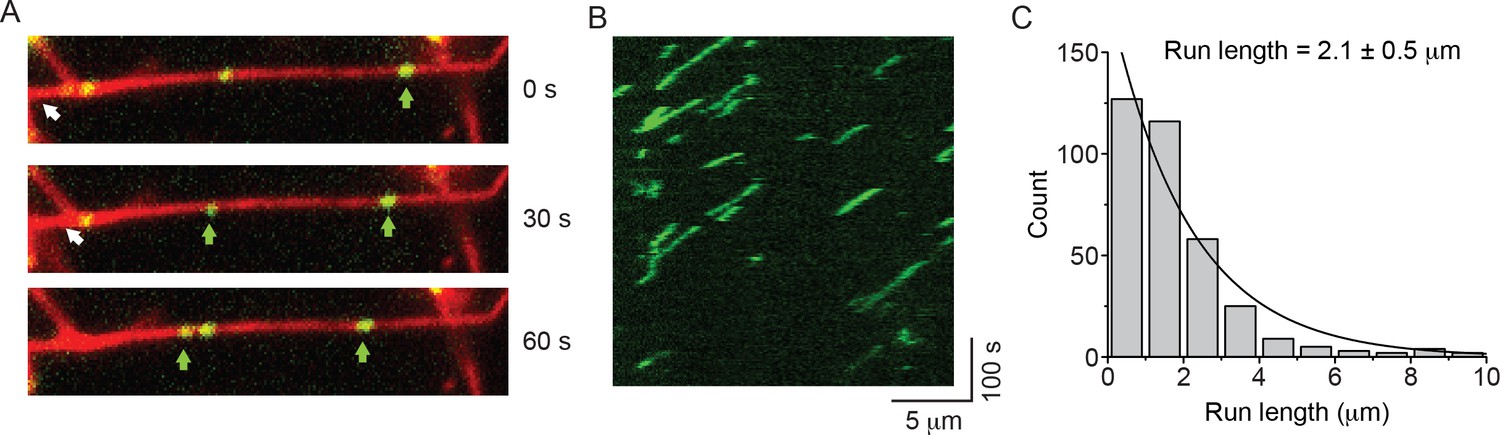
GFP-RLC-NM2-B filaments move processively along actin filaments.
(A) Movie frames showing GFP-RLC-NM2-B filaments (green and arrows), moving along rhodamine phalloidin-labeled actin filaments (red). (B) Kymograph for NM2-B filaments showing clear processive movement (diagonal lines) and long run lengths. (C) Frequency distribution histogram of NM2-B filaments run length. Black line is the single exponential fit to the data. The reported error is the S.E.M. (R2 = 0.94).
-
Figure 1—figure supplement 2—source data 2
Run length data for GFP-RLC NM2-B.
- https://doi.org/10.7554/eLife.32871.006
Figure 2 with 2 supplements

Determination of the number of NM2-B motor domains required for filament processivity.
(A) Negative stain EM images of bipolar filaments formed by 100% HaloTag-NM2-B (left panel), 100% Halotag-NM2-B tail fragments (middle panel) and bipolar co-filament at 1:5 mixing ratio (NM2-B:Tail) (right panel). Arrows indicate a myosin motor domain. Arrowheads indicate a HaloTag moiety which can be seen as discrete globular domain smaller in size that the motor domain. (B) Frequency distribution histograms of NM2 co-filament run length. Black lines are the single exponential fit to the data. The mixing ratio and the characteristic run length obtained from the fit are indicated in each panel (n = 957, 378 and 113 for mixing ratios of 1:1, 1:2 and 1:5 NM2-B:Tail, respectively R2 = 0.99 for each fitting). (C) Characteristic run length is plotted as a function of number of motors per half filament. The black line is the linear fit to the data (R2 = 0.99). (D) Frequency distribution of velocity for all mixing ratios of co-filaments. The experimentally determined average number of motors per half filament are given for each mixing experiment in the inset. Lines are the Gaussian fits to the data. The velocity obtained from the fit is reported in Figure 2—figure supplement 2.. (E) The dependence of the characteristic velocity on the number of motors in a half filament. In all panels, errors represent S.E.M. and sample size is given above.
-
Figure 2—source data 1
Data for run lengths of NM2-B and the hybrid filaments containing NM2-B and NM2-B tail fragment.
- https://doi.org/10.7554/eLife.32871.019
Figure 2—figure supplement 1
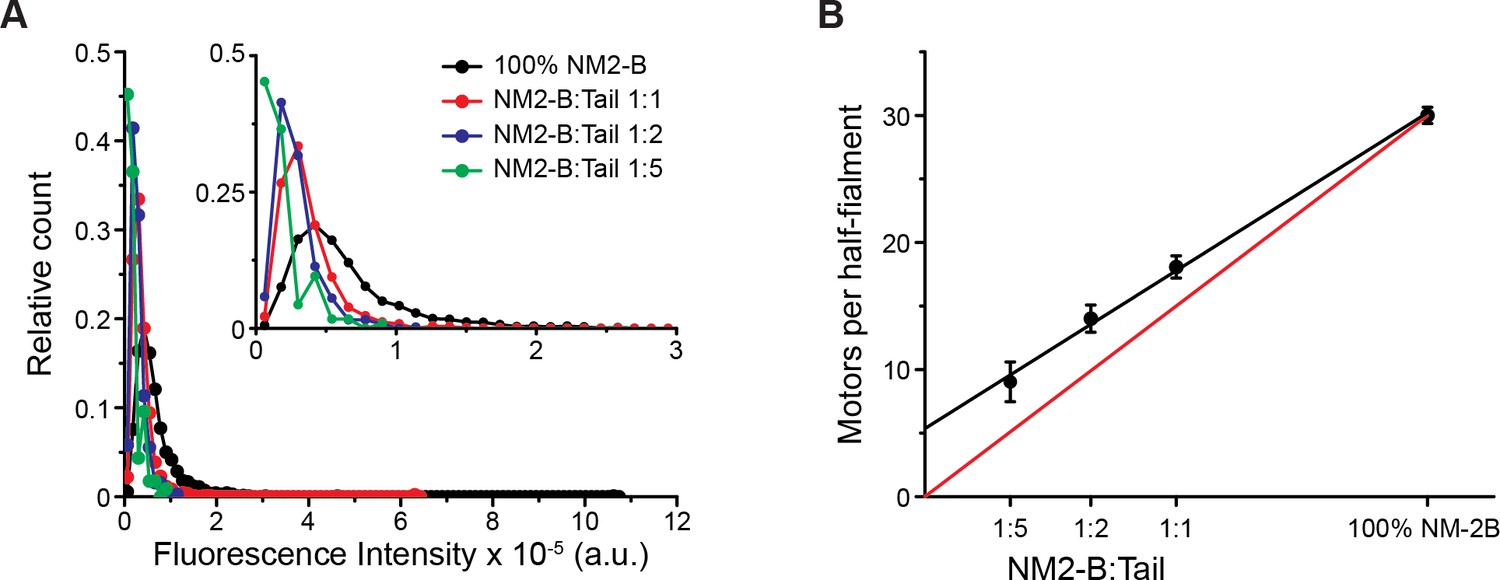
HaloTag-NM2-B and HaloTag-NM2-B myosin tail co-polymerize.
(A) Frequency distributions of the total fluorescence intensity of Alexa Fluor 488 (AF488) labeled molecules from AF488-HaloTag-NM2-B filaments and co-filaments formed by mixing AF488-HaloTag-NM2-B full-length with tetramethylrhodamine (TMR)-labeled HaloTag-NM2-B myosin tail for the three mixing ratio. Only filaments moving along actin were chosen for this analysis. (B) Dependency of the number of NM2-B molecules that formed the co-filaments, calculated according to Equation (2), on the mixing ratio (black symbols). Black line is the linear fit to the data. The error bars are S.E.M. The red line is the calculated relation assuming that the co-polymerization of NM2-B molecules and tails and the subsequent association of these filaments with actin is unbiased. The error bars represent the S.E.M. The deviation from this line suggests that filaments with a higher percentage of NM2-B have a greater probability of binding to and moving along the actin filament.
-
Figure 2—figure supplement 1—source data 1
Fluorescent intensity values of hybrid filaments of NM2-B and NM2-B trail fragment shown in Panel A.
- https://doi.org/10.7554/eLife.32871.017
Figure 2—figure supplement 2

Rate of movement of hybrid filaments of full length NM2-B and NM2-B Tail.
Frequency distribution histograms at three mixing ratios. The velocity and S.E.M. are given above the histograms. The standard deviations and R2 values for the various mixing experiments are 17 nm.s−1, 0.99; 20 nm.s−1, 0.99; and 18 nm.s−1,, 0.99, respectively for the 2:1, 1:2 and 1:5 ratios of NM2-B full length:tail.
Figure 3
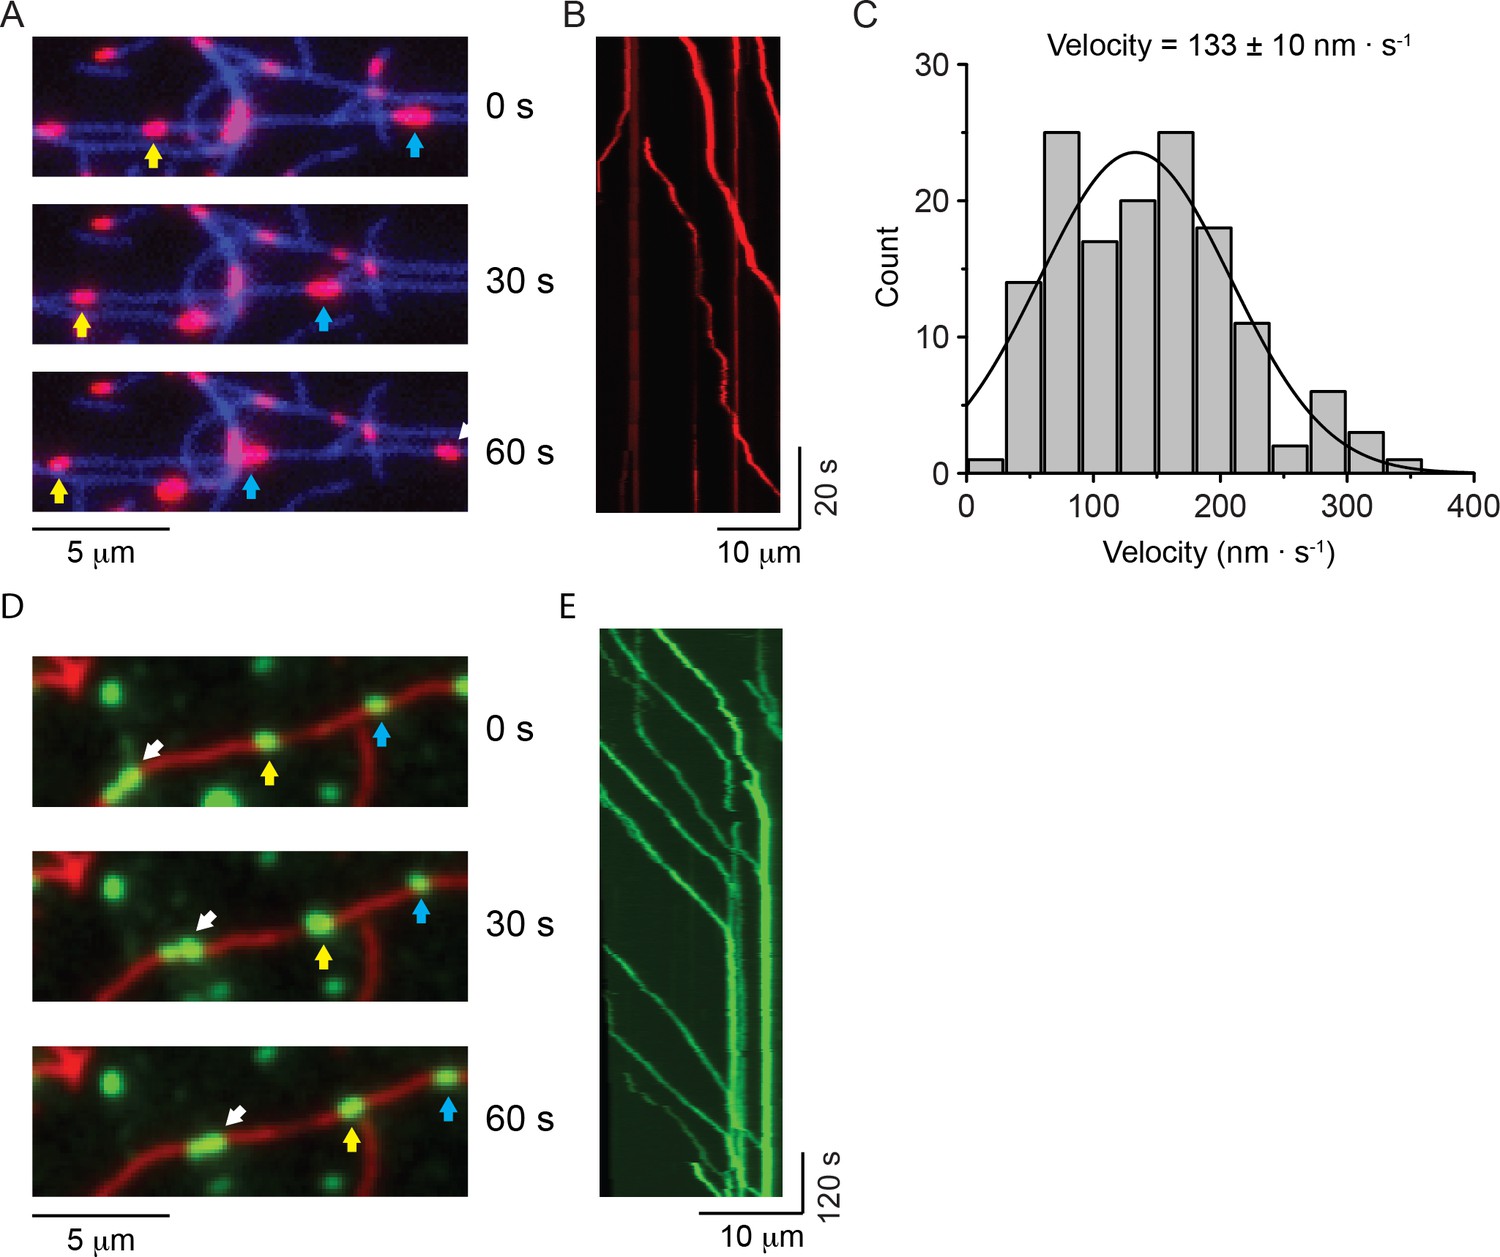
NM2-A filaments move processively in methylcellulose.
(A) Movie frames showing HaloTag-NM2-A filaments (red, selected ones marked by blue and yellow arrows), moving along actin filaments (blue) in presence of 0.5% methylcellulose. Under these conditions, NM2-A filaments are able to move on actin for several microns without detaching. (B) Kymograph for NM2-A filaments in presence of 0.5% methylcellulose. (C) Frequency distribution histograms of NM2-A filament velocity (n = 143). The black line is the Gaussian fit to the data. The velocity is 133 ± 10 nm.s−1 (mean ± SEM; SD = 75 nm.s−1, R2 = 0.81, ). (D) Movie frames showing HaloTag-NM2-B filaments (individual filaments marked by arrows), moving along actin filaments (green) in presence of 0.5% methylcellulose. In these conditions, the processivity of the filaments is increased dramatically relative to experiments in the absence of methylcellulose. (E) Kymograph for NM2-B filaments in presence of 0.5% methylcellulose. Most of the NM2-B filaments reached and accumulated at the end of the actin filaments as shown by the increasing in fluorescence intensity at the end of the actin filament and the vertical line at the end of the kymograph.
-
Figure 3—source data 1
Velocities of NM2-A filament movement.
- https://doi.org/10.7554/eLife.32871.026
Figure 4 with 2 supplements

Motile properties of NM2-A and NM2-B co-filaments.
(A) Frequency distribution histograms of the run length for NM2-A:NM2-B co-filaments. Black lines are the single exponential fit to the data. The mixing ratio and the characteristic run length obtained from the fit are indicated in each panel (n, R2 = 1454, 0.98, 381, 0.99 and 1121, 0.99 for mixing ratios of 2:1, 1:1 and 1:2 NM2-B:NM2-A, respectively. The reported errors are the S.E.M. (B) Frequency distribution histograms of the velocity of mixed filaments for all mixing ratios. The FNM2-A (fraction of NM2-A in a filament) determined by quantification of the average NM2-A content per filament at each of the mixing ratios described in panel A is given in the insert The n values are 143, 1121, 381, 1454 and 1463 for FNM2-A of 1, 0.71, 0.36, 0.23, and 0, respectively. Lines are the Gaussian fit to the data. The distributions of these data are given in Figure 4—figure supplement 2. (C) The average velocity of co-filament movement as a function of FNM2-A. The velocity for 100% NM2-A is depicted in red and comes from experiments conducted in the presence of methycellulose. The error bars are S.E.M. (D) Dependence of the characteristic run length on FNM2-A. The run length decreases roughly linearly as fraction of NM2-A increases. The value for 100% NM2-A filaments, depicted in red, is set to 0 since NM2-A filaments do not move processively under these conditions. The error bars are S.E.M.
-
Figure 4—source data 1
Run length data for NM2-A:NM2-B mixed filaments.
- https://doi.org/10.7554/eLife.32871.031
Figure 4—figure supplement 1

NM2-A and NM2-B co-polymerize into filaments.
(A) Frequency distributions of the fluorescence intensity of Halotag-NM2-A/NM2-B co-filaments at three mixing ratios and for NM2-A filaments alone. (B) Frequency distributions of the fluorescence intensity of AF488-HaloTag-NM2-B at three mixing ratio and for NM2-B filaments alone. (C) Measured versus expected fraction of NM2-A molecules in the co-filaments. FNM2-A, calculated according to Equation (4) (black symbols). Red line shows the expected values assuming random co-polymerisation of the two myosins. The error bars represent the S.E.M.
-
Figure 4—figure supplement 1—source data 1
Fluorescent intensity values of mixed filaments of NM2-A and NM2-B.
- https://doi.org/10.7554/eLife.32871.029
Figure 4—figure supplement 2
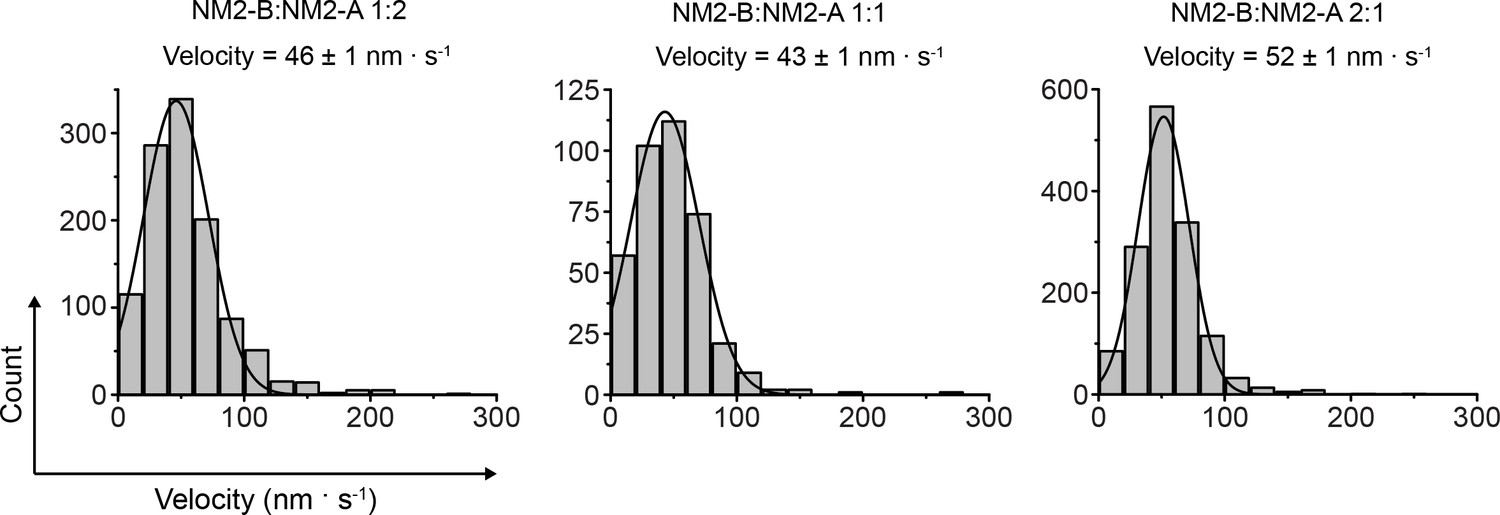
Velocities of co-filaments of HaloTag-NM2-B myosin and HaloTag NM2-A moving on actin filaments.
Frequency distribution histograms of HaloTag-NM2-B:HaloTag-NM2A tail fragment co-filaments velocity at the three mixing ratios used in the experiments. Lines are the Gaussian fit to the data. The mixing ratio and the characteristic velocity (±standard error) obtained from the fit are reported in each panel. The n, S.D., and R2 values are 1454, 20 nm.s−1; 0.98) -, 381; 27 nm.s−1; 0.99; and 1121, 26 nm.s−1, 0.99 for mixing ratios of 2:1, 1:1 and 1:2 NM2-B:NM2A, respectively).
Author response image 1
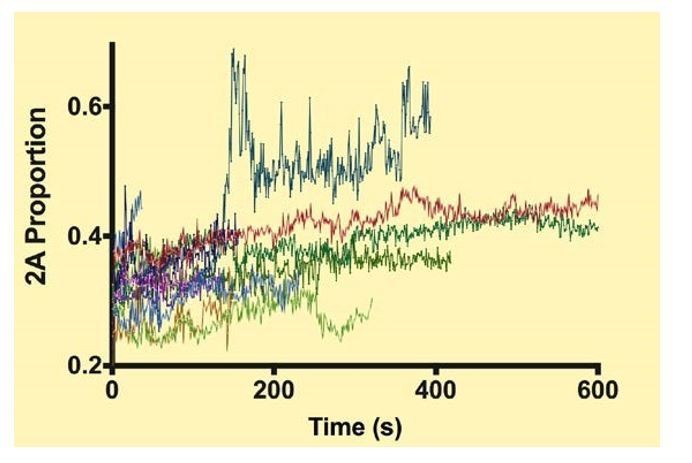
Each color shows the proportion of NM2-A in a given filament during a processive run.
https://doi.org/10.7554/eLife.32871.044Videos
Video 1
Movement of NM2-B filaments on surface bound actin filaments.
The movie shows Alexa 488 labelled HaloTag-NM2-B filaments (green) moving along surface immobilized Alexa-647-labeled actin filaments (blue).
Video 2
Different modes of physical interactions between NM2-B filaments and actin during processive movements.
Left panels are EM images of NM2-B filaments that interact with an actin filament using the myosin heads from one (upper panel) or both their ends (lower panel) (images taken from Billington et al., 2013). In the right panels, movies from single filament in vitro motility assays show several examples of GFP-RLC-NM2-B filaments (green) moving along actin filaments (red). It can be seen that NM2-B filaments were able to move with their long axis either perpendicular or parallel to the actin filaments according with the EM images. Moreover, upper and middle right panels show clearly GFP-RLC-NM2-B filaments that tumbled on actin filaments (arrows).
Video 3
A single myosin filament can interact simultaneously with two actin filaments.
Left panel shows an EM image of an NM2 filament interacting with two actin filaments simultaneously (image taken from Billington et al., 2013). The movies in the right panels show examples of GFP-RLC-NM2-B filaments (green) that move along an actin filament (red) and stop at the intersection with another actin filament with opposite polarity (magenta arrows). In this situation, as in the EM image on the right, the NM2-B filaments interact with their bipolar ends with two different actin filaments in an isometric condition.
Video 4
Actin filaments can be moved by myosin filaments bound to another actin filament.
In this movie, an actin filament previously free in solution lands on a surface immobilized actin filament (blue arrow). The free actin filament is moved by an GFP-RLC-NM2-B filament that is bound to the immobilized actin filament. The NM2-B filament responsible for this movement is also translocating along the immobilized filament. Near the end of the movie, the free actin filament takes an abrupt turn as it is caught by a myosin filament that is bound to the surface close to the immobilized actin filament.
Video 5
Formation of myosin filament stacks.
Left panel shows an EM images of GFP-RLC-NM2 stacks. These supramolecular structures are formed by lateral and serial interactions of single NM filaments. The movie in the right panel shows an object larger and brighter than a single filament, likely a stack of NM2-B filaments, that lands near an actin filament (blue arrow). A single NM2-B filament can be seen leaving the stack, while another joined it (magenta arrows).
Video 6
Formation of myosin stacks.
Actin filaments bound to the surface are labeled with Alexa-647-phalloidin (blue). Free actin filaments are label with Rhodamine phalloidin (Red). The myosin filaments are HaloTag-NM2-B labeled with AlexaFluor488 (green). At the start of the assay, numerous individual NM2-B filaments are bound to and moving along the fixed actin filament and free actin filaments can be seen to be moved by these same myosins. Whenever an individual myosin filament overtakes another the two filaments merge to form a stack until finally, only a small number of myosin filament stacks remain.
Video 7
Myosin filaments can dissociate from a myosin stack while moving.
A bright stack of GFP-RLC-NM2B myosin filaments moving along an actin filament loses fluorescence intensity in quantal steps suggesting dissociation of one or more individual NM2-B units
Video 8
Determination of the number of myosin motors required for processivity.
The movies show co-filaments (yellow) of HaloTag-NB2B (green) and HaloTag-Tail (red) at a mixing ratio of 1:1 moving along surface immobilized Alexa-647-labeled actin filaments (blue). The NM2-B molecules and tail fragments were labeled with AlexaFluor488 and TMR, respectively. In these conditions, the average number of NM2-B motors per co-filament, n, was 36 ± 2.
Video 9
Determination of the number of myosin motors required for processivity.
The movies show co-filaments (yellow) of HaloTag-NB2B (green) and HaloTag-Tail (red) at a mixing ratio of 1:2 moving along surface immobilized Alexa-647-labeled actin filaments (blue). The NM2-B molecules and tail fragments were labeled with AlexaFluor488 and TMR, respectively. In these conditions, the average number of NM2-B motors per co-filament, n was 28 ± 2.
Video 10
Determination of the number of myosin motors required for processivity.
The movies show co-filaments (yellow) of HaloTag-NB2B (green) and HaloTag-Tail (red) at a mixing ratio of 1:5 moving along surface immobilized Alexa-647-labeled actin filaments (blue). The NM2-B molecules and tail fragments were labeled with AlexaFluor488 and TMR, respectively. In these conditions, the average number of NM2-B motors per co-filament, n was 18 ± 4.
Video 11
NM2-A filaments do not move processively under conditions where NM2-B filaments do.
This movie shows that under the same experimental conditions used to study the movement of NM2-B filaments, GFP-RLC-NM2-A filaments (green) were not able to move processively along actin (red) and even binding events were rarely observed. It must be noted that the experimental conditions and concentrations were the same as for NM2-B filaments experiments.
Video 12
NM2-A monomers move actin filaments in the gliding actin in vitro motility assay.
The movie shows actin filaments (red) moving as translocated by surface bound GFP-RLC-NM2-A monomers in an in vitro gliding assay. The actin filaments movement was smooth and continuous with only a small fraction of immobile filaments. This suggests that the absence of processive movement in the single filament TIRF experiments with GFP-RLC-NM2-A is not due to a lack of NM2-A activity.
Video 13
NM2-A filaments are processive in the presence of methylcellulose.
The movie shows TMR-labeled HaloTag-NM2-A filaments (green) moves processively along surface immobilized Alexa-647-labeled actin filaments (blue) in presence of 0.5% methylcellulose.
Video 14
NM2-B filament processivity is enhanced in the presence of methylcellulose.
The movie shows Alexa-488-labeled HaloTag-NM2-B filaments (green) moving along surface immobilized actin filaments (red) in presence of 0.5% methylcellulose. It can be seen that the processivity of the NM2-B filaments was further increased over that seen in the absence of methylcellulose with many filaments moving greater than 10 µm. Many of the NM2-B filaments reached the end of the filament and did not detach.
Video 15
NM2B filaments accumulate at the ends of actin filaments in the presence of methylcellulose.
The movie shows GFP-RLC-NM2B (green) moving along surface immobilized actin filaments (red) in the presence of 0.5% methylcellulose. Note the strong accumulation of myosin at the ends of the actin filaments as the assay proceeds.
Video 16
NM2-A and NM2-B mixed filaments are processive.
The movies show mixed paralog NM filaments moving along surface immobilized Alexa-647-labeled actin filaments (blue) at a mixing ratio of 2:1. HaloTag-NM2-B and HaloTag-NM-2A molecules were labeled with Alexa 488 (green) and TMR (red), respectively. In these conditions the actual average fraction of NM2-A molecules in the filaments, FNM2-A, was 0.24 ± 0.03.
Video 17
NM2-A and NM2-B mixed filaments are processive.
The movies show mixed paralog NM filaments moving along surface immobilized Alexa 647 labelled actin filaments (blue) at a mixing ratio of 1:1. In these conditions FNM2-A was 0.37 ± 0.06.
Video 18
NM2-A and NM2-B mixed filaments are processive.
The movies show mixed paralog NM filaments moving along surface immobilized Alexa-647-labeled actin filaments (blue) at a mixing ratio of 1:2. In these conditions FNM2-A was 0.72 ± 0.03.
Tables
Key resources table
| Reagent type (species) or resource | Designation | Source or reference | Indentifiers | Additional information |
|---|---|---|---|---|
| Cell line (Spodoptera fugiperda) | Sf9 | Thermo Fisher Scientific | Thermo Fisher Scientific 11496015 | Maintained in Sf-900 III SFM |
| Recombinant DNA reagent | pFastBac1-NM2-A | PMID: 24072716 | N/A | |
| Recombinant DNA reagent | pFastBac1-NM2-B | PMID: 24072716 | N/A | |
| Recombinant DNA reagent | pFastBac1-NM2-B tail | This paper | NM2-B tail | Progenitor: pFastBac1-NM2-B |
| Software, algorithm | FAST | http://spudlab.stanford.edu/fast-for-automatic-motility-measurements | ||
| Software, algorithm | ImageJ | http://imageJ.nih.gov/ij |
Additional files
-
Supplementary file 1
Results of mixing full-length NM2-B molecules with NM2-B tail fragments.
- https://doi.org/10.7554/eLife.32871.038
-
Supplementary file 2
Results of mixing NM2-A with NM2-B.
- https://doi.org/10.7554/eLife.32871.039
-
Supplementary file 3
Effect of phalloidin on the rate of gliding of actin by NM2-A.
- https://doi.org/10.7554/eLife.32871.040
-
Supplementary file 4
Data for the rate of actin filament gliding for actin labeled at Cys 374 with Atto 538 and with Alexa 647 phalloidin.
- https://doi.org/10.7554/eLife.32871.041
-
Transparent reporting form
- https://doi.org/10.7554/eLife.32871.042
Download links
A two-part list of links to download the article, or parts of the article, in various formats.
Downloads (link to download the article as PDF)
Open citations (links to open the citations from this article in various online reference manager services)
Cite this article (links to download the citations from this article in formats compatible with various reference manager tools)
Bipolar filaments of human nonmuscle myosin 2-A and 2-B have distinct motile and mechanical properties
eLife 7:e32871.
https://doi.org/10.7554/eLife.32871


