Neurogenic decisions require a cell cycle independent function of the CDC25B phosphatase
- Université de Toulouse, CNRS, UPS, France
Figures
Figure 1 with 1 supplement
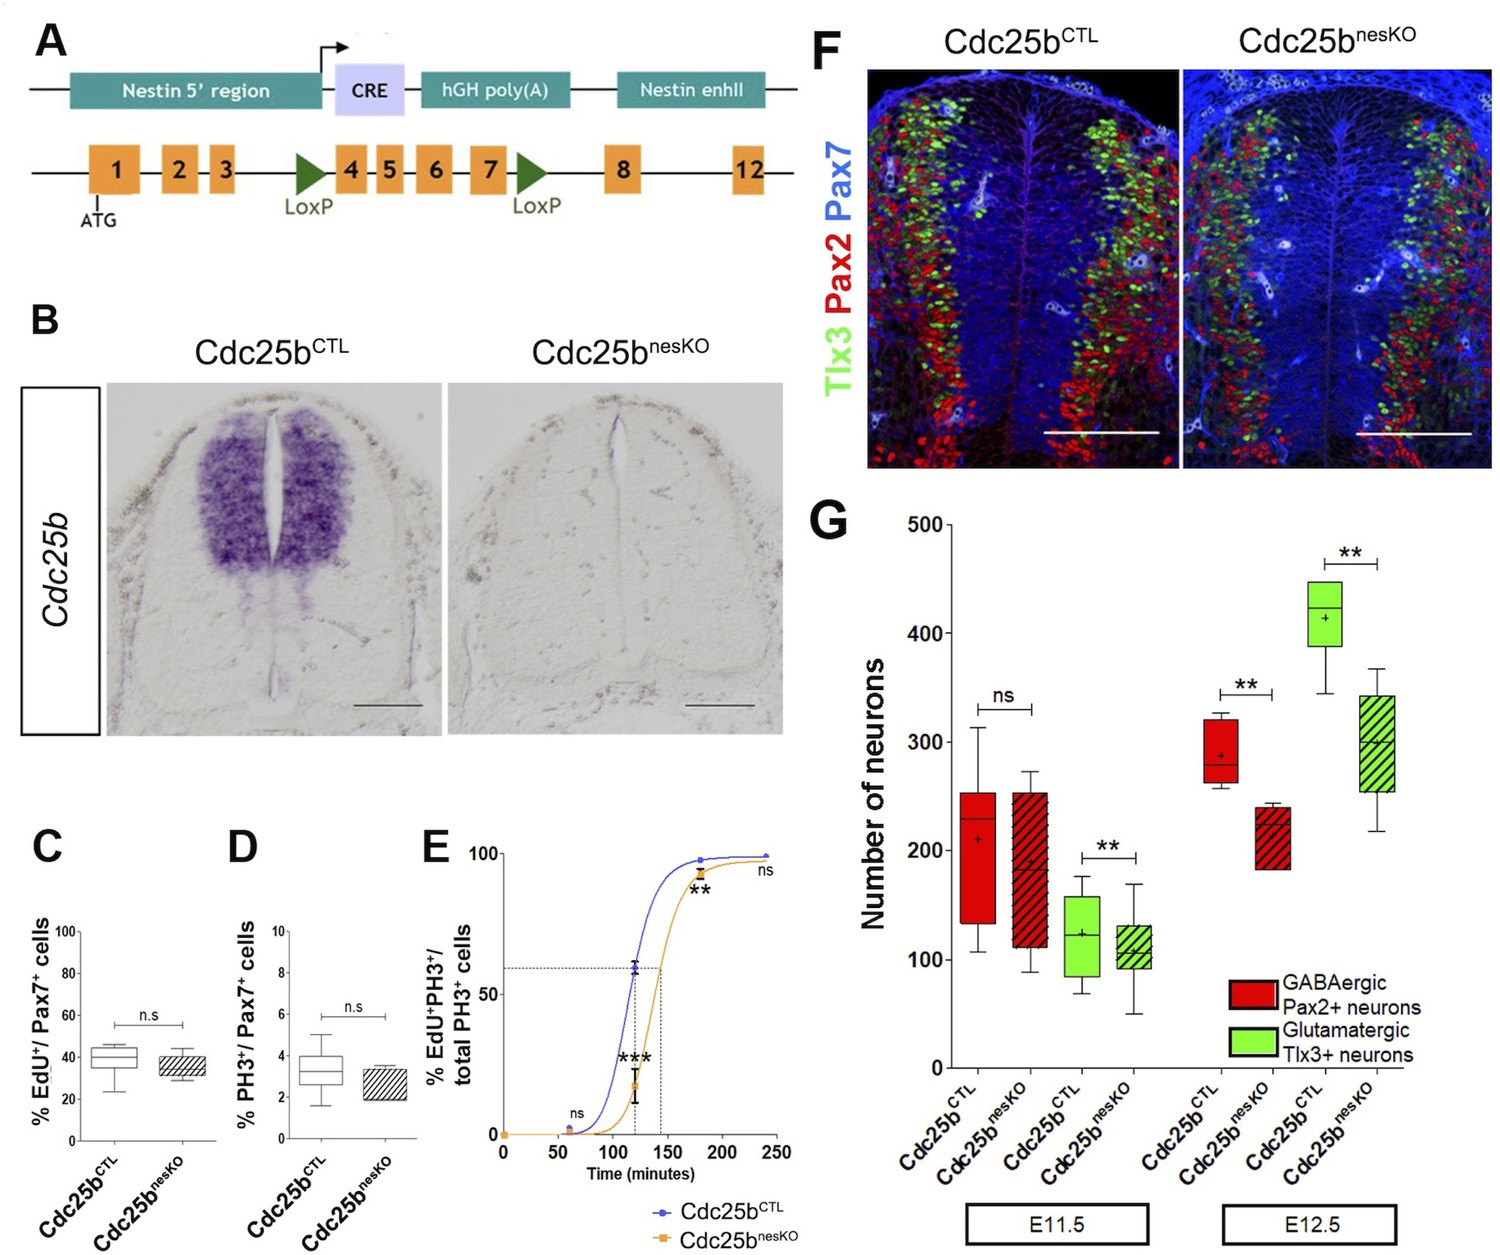
Cdc25b conditional genetic loss-of-function increases the G2-phase length and impairs dorsal spinal neurogenesis.
(A) Scheme of the genetic construction for Cdc25b conditional loss-of-function. (B) Cdc25b in situ hybridization at E11.5 in control (Cdc25b) and conditional nesKO (Cdc25b) conditions. (C–D) Box plots (5/95 percentile) comparing the proliferative index: distribution of the percentage of EdU/Pax7 cells indicative of the rate of S-phase cells at E11.5 in control and nesKO neural tubes (C), distribution of the percentage of PH3/Pax7 cells indicative of the mitotic index at E11.5 in control and nesKO neural tubes (D). The proliferative index was analyzed using 20 control and seven nesKO embryos. (E) Progression of the percentage of EdUPH3/total PH3 labeled nuclei with increasing EdU exposure time in control and nesKO conditions. The dashed lines correspond to 50% EdU/PH3 cells and indicate the G2 length. (F) Cross-sections of E12.5 embryo neural tubes, stained with Pax7, Pax2 and Tlx3 immunostaining in control and nesKO conditions. (G) Box plots (5/95 percentile) comparing the distribution of the number of Pax2 and Tlx3 neurons in control and nesKO conditions at E11.5 and E12.5. The number of analyzed embryos was 15 control vs 11 nesKO for Pax2 and 15 control vs 10 nesKO for Tlx3. The cross indicates the mean value. Mixed model, ** p0.01. Scale bar represents 100 µm.
Figure 1—figure supplement 1
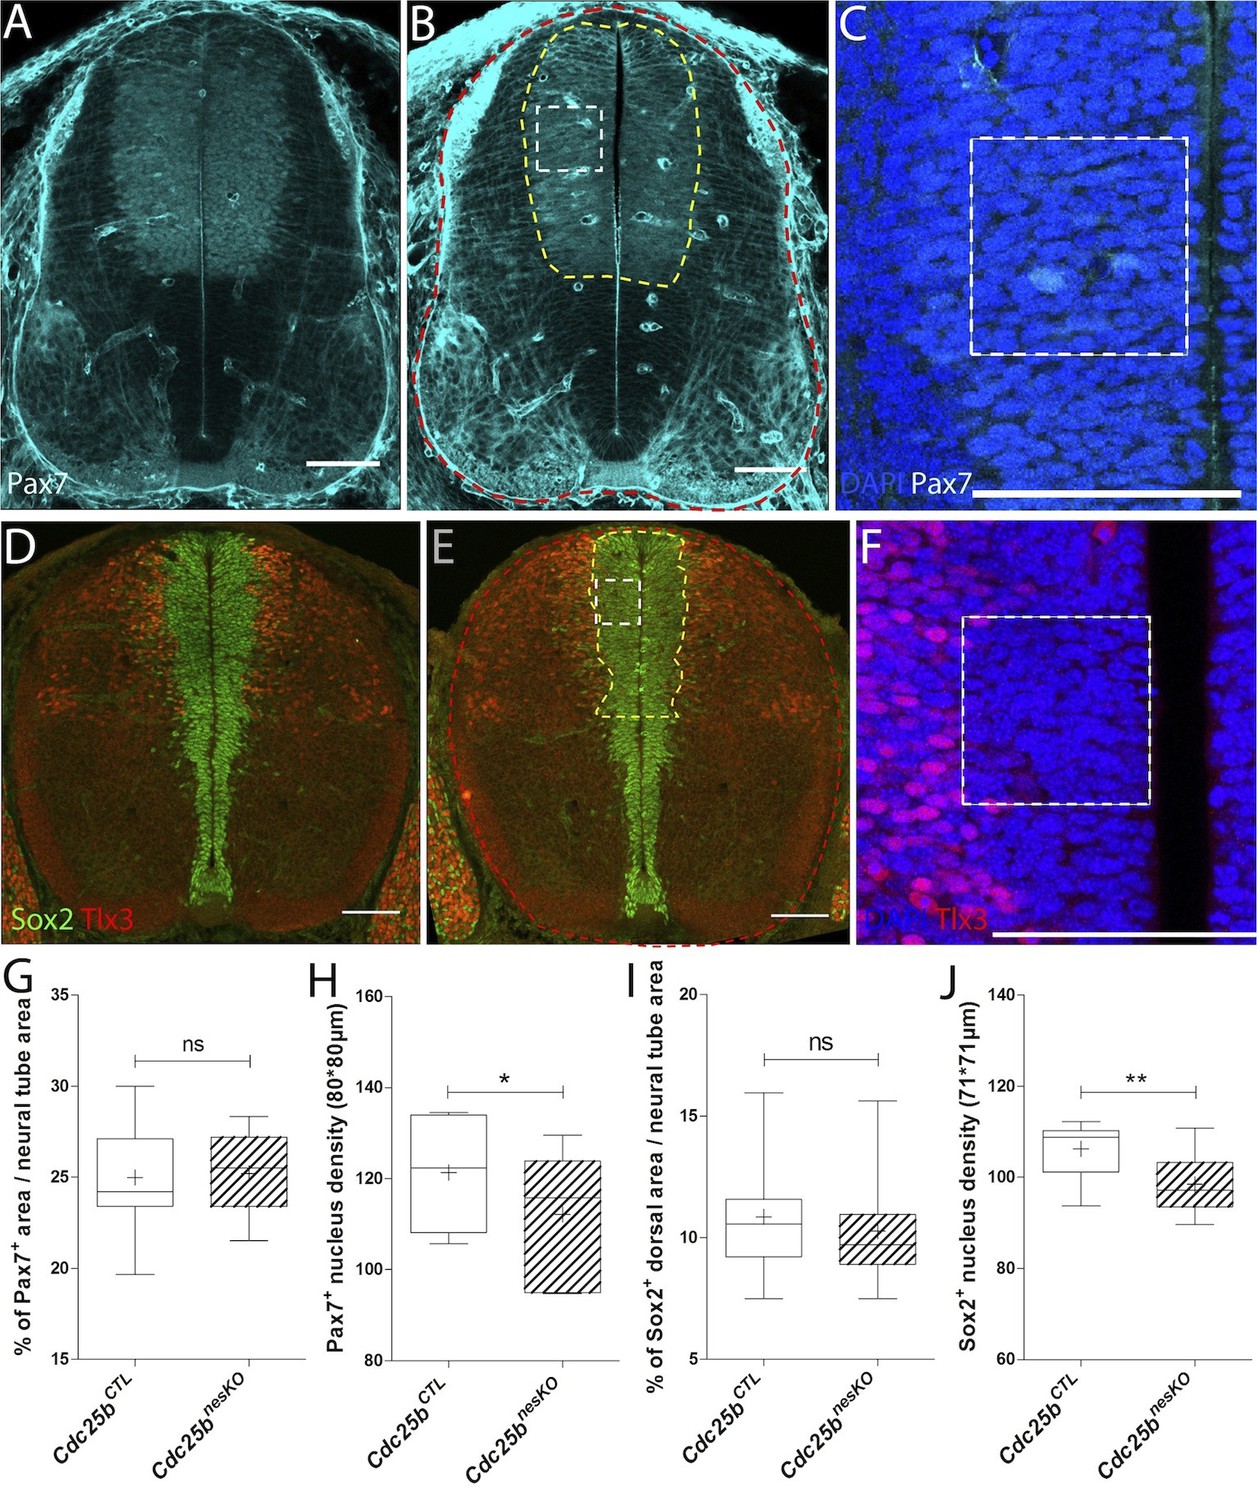
Cdc25b conditional genetic loss-of-function affects the progenitor pool.
(A–C) Cross-sections of E11.5 embryo neural tubes in control (A) and conditional nesKO conditions (B–C). The progenitor pool size is evaluated by the percentage of the Pax7 progenitor area (B, yellow dashes) compared to the neural tube area (B, red dashes). Nuclei number is quantified using DAPI staining (C) in a 80 × 80 µm square (B-C, white dashes). (D–F) Cross-sections of E12.5 embryo neural tubes in control (D) and conditional nesKO conditions (E–F). The progenitor pool size is evaluated by the percentage of the dorsal Sox2 progenitor area delimited by Tlx3 domain (E, yellow dashes) compared to the neural tube area (E, red dashes). Nucleus density (F) is quantified using DAPI staining in a 71 × 71 µm square (E-F, white dashes). (G–J) Box plots (5/95 percentile) comparing at E11.5 the progenitor area in 19 control, and 13 nesKO embryos (G), the nucleus density in 8 Control, and 6 NesKO embryos (H), at E12.5, the progenitor area in 15 control, and 9 nesKO embryos (I), and the nucleus density in 12 control, and 8 nesKO embryos (J). The cross indicates the mean value. Scale bar represents 100 µm.
Figure 2 with 2 supplements
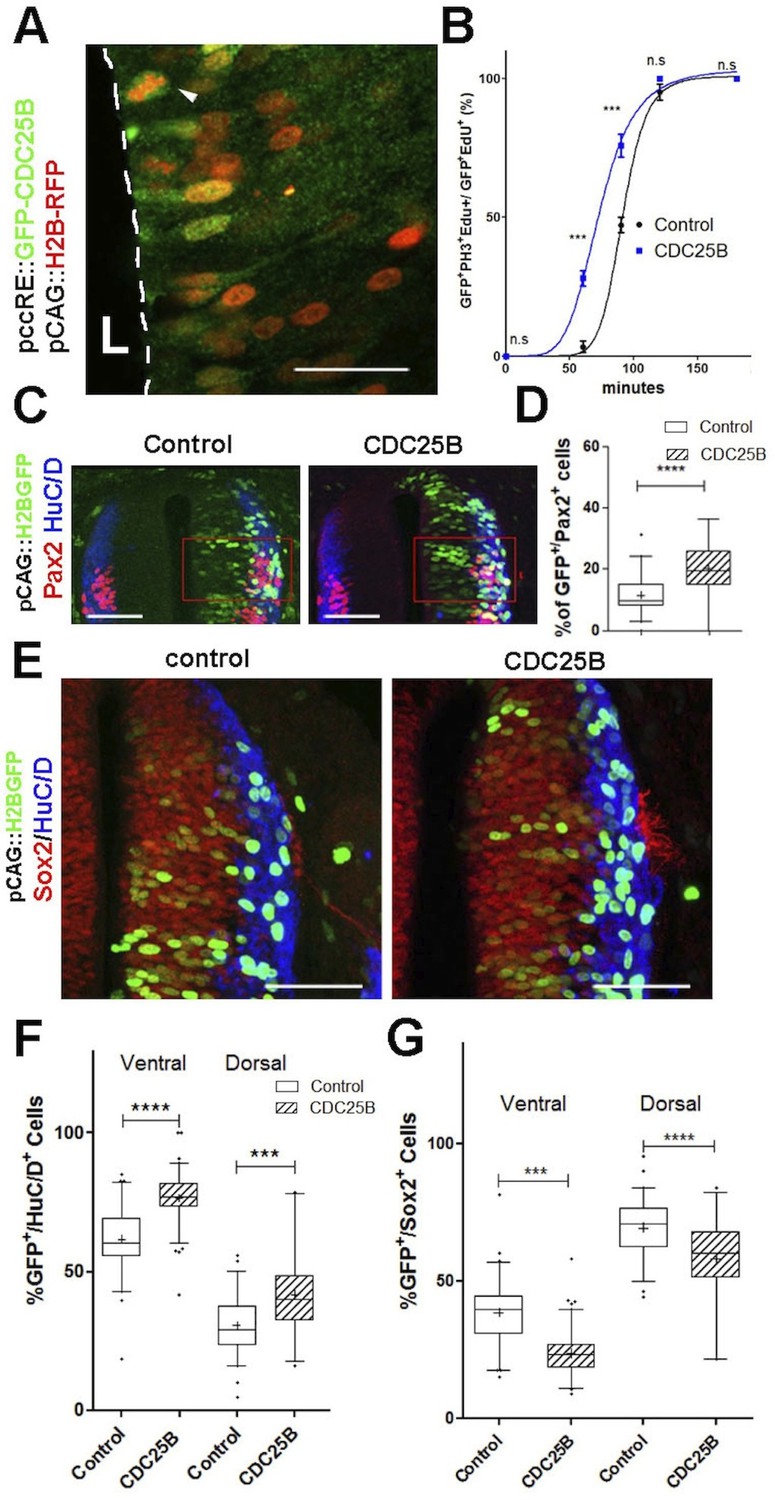
CDC25B speeds up neuronal production.
(A) Cross section of E2.5 chick spinal cord 24 hr after electroporation of pCAG::H2B-RFP vector and pccRE::GFP-CDC25B vector, followed by an anti-GFP immunolocalisation. Note that the protein is expressed in the dorsal neuroepithelium in cells exhibiting a nucleus close to the lumen side (L) or undergoing mitosis (arrowhead). Scale bar indicates 50 µm. (B) Curves representing the percentage of electroporated GFPEdUPH3 over the total GFP EdU cells with increasing EdU exposure times: control (black), CDC25B gain of function (blue). Note that the curve corresponding to the CDC25B condition (blue) is shifted to the left, showing a reduction in G2 phase length. (C) Representative sections of E3.5 chick spinal cord 48 hr after co-electroporation of a pCAG::H2B-GFP with either a pccRE::lacZ (control) or a pccRE::CDC25B expression vector and processed for Pax2 (red) and HuC/D (blue) immunostaining. The red box illustrates the quantified domain. Scale bars indicate 100 µm. (D) Box plots (5/95 percentile) comparing the percentage of Pax2 cells within the electroporated population in the control and CDC25B gain-of-function experiments in the dorsal neural tube. Data from three different experiments with eight embryos for the control, and five embryos for the CDC25B gain-of-function. (E) Representative sections of E3.5 chick spinal cord 48 hr after co-electroporation of pCAG::H2B-GFP with either a control or a CDC25B expression vector and processed for Sox2 (red) and HuC/D (blue) immunostaining. Scale bars indicate 100 µm. (F) Box plots (5/95 percentile) comparing the percentage of electroporated HuC/D cells in the ventral and dorsal neural tube. Data represent three different experiments with a total of 13 dorsal and six ventral embryos for the control, and 6 dorsal and seven ventral embryos for the CDC25B gain-of-function. The cross represents the mean value. (G) Box plots (5/95 percentile) comparing the percentage of Sox2 cells within the electroporated dorsal or ventral neural tube in the control, and CDC25B gain-of-function. Same conditions as in F.
Figure 2—figure supplement 1
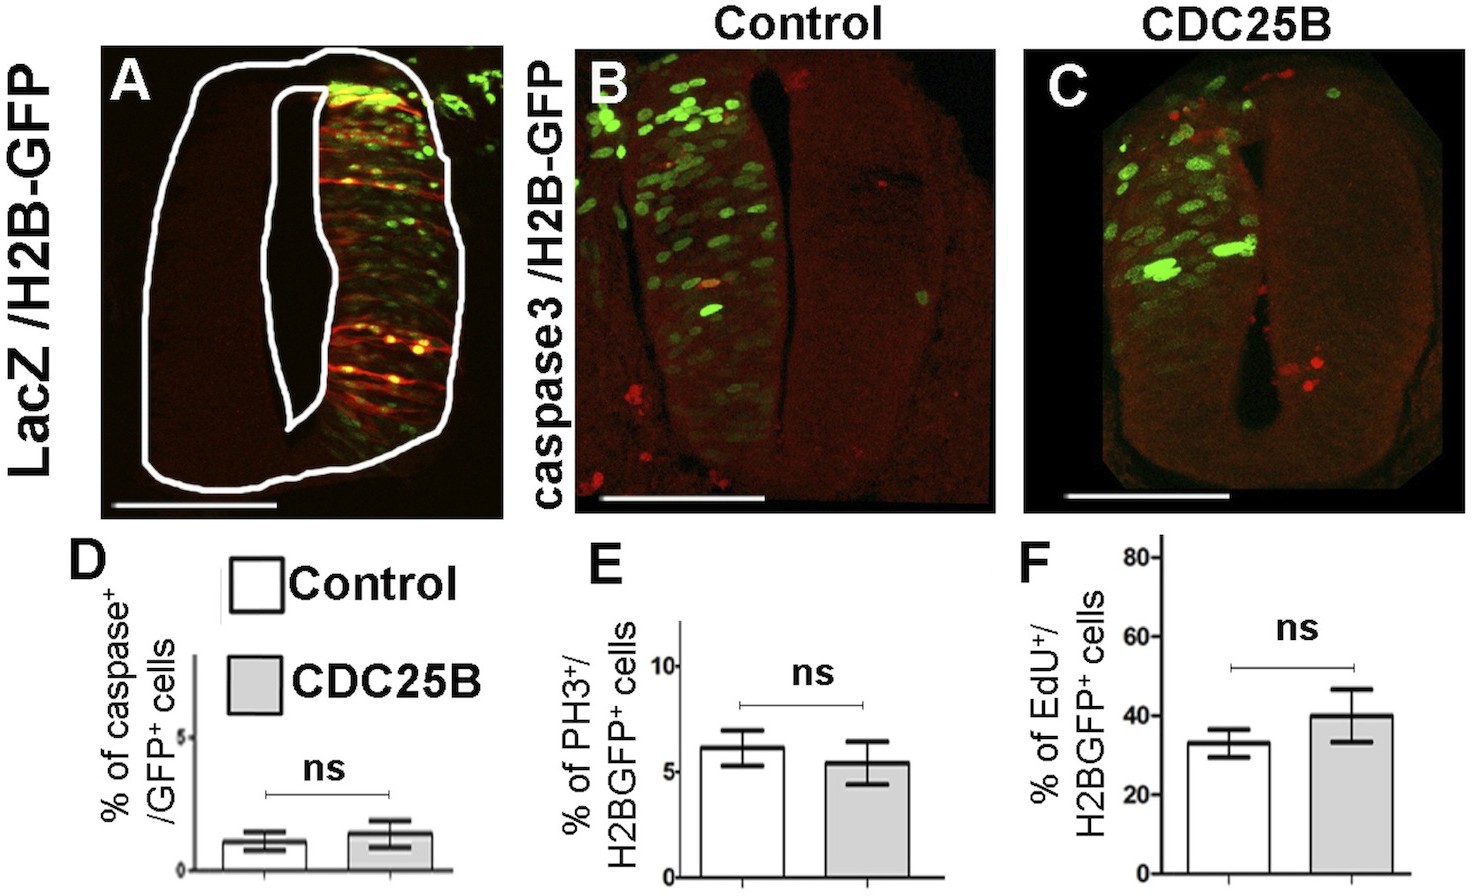
CDC25B gain-of-function does not increase apoptosis, S or M cell cycle phase lengths.
(A) Section of embryonic spinal cord at HH17 after co-electroporation of pccRE::LacZ and pCAG::H2B-GFP and anti lacZ immunostaining in red. Note that the ccRE promoter leads to lacZ positive cells localized throughout the dorso-ventral axis of the neural tube. B-C: Anti active Caspase-3 immunostaining (red) 24 hr after co-electroporation of pCAG::H2B-GFP plus pccRE::lacZ (control) (B) or pccRE::CDC25B vector (C). Scale bars represent 100 µm. (D) Percentage of active-Caspase 3, H2B-GFP cells in the total H2B-GFP population after 24 hr: control (1.1 0.84%) and CDC25B gain-of-function (1.39 0.5%). Mean SEM from three experiments, seven control embryos, and 9 CDC25B gain-of-function embryos. (E) Mitotic index represented as the percentage of PH3 cells among H2B-GFP electroporated cells after 24 hr: control (6.1 0.34%) and CDC25B gain-of-function (5.4 1%). Mean SEM from three different experiments, 8 control and 10 CDC25B gain-of-function embryos. F: Proliferative index represented as the percentage of EdU cells in the H2B-GFP population after 24 hr: control (33 3.5%) and CDC25B gain-of-function (40 6.6%). Mean SEM from three experiments, 9 control, and 7 CDC25B gain-of-function embryos.
Figure 2—figure supplement 2
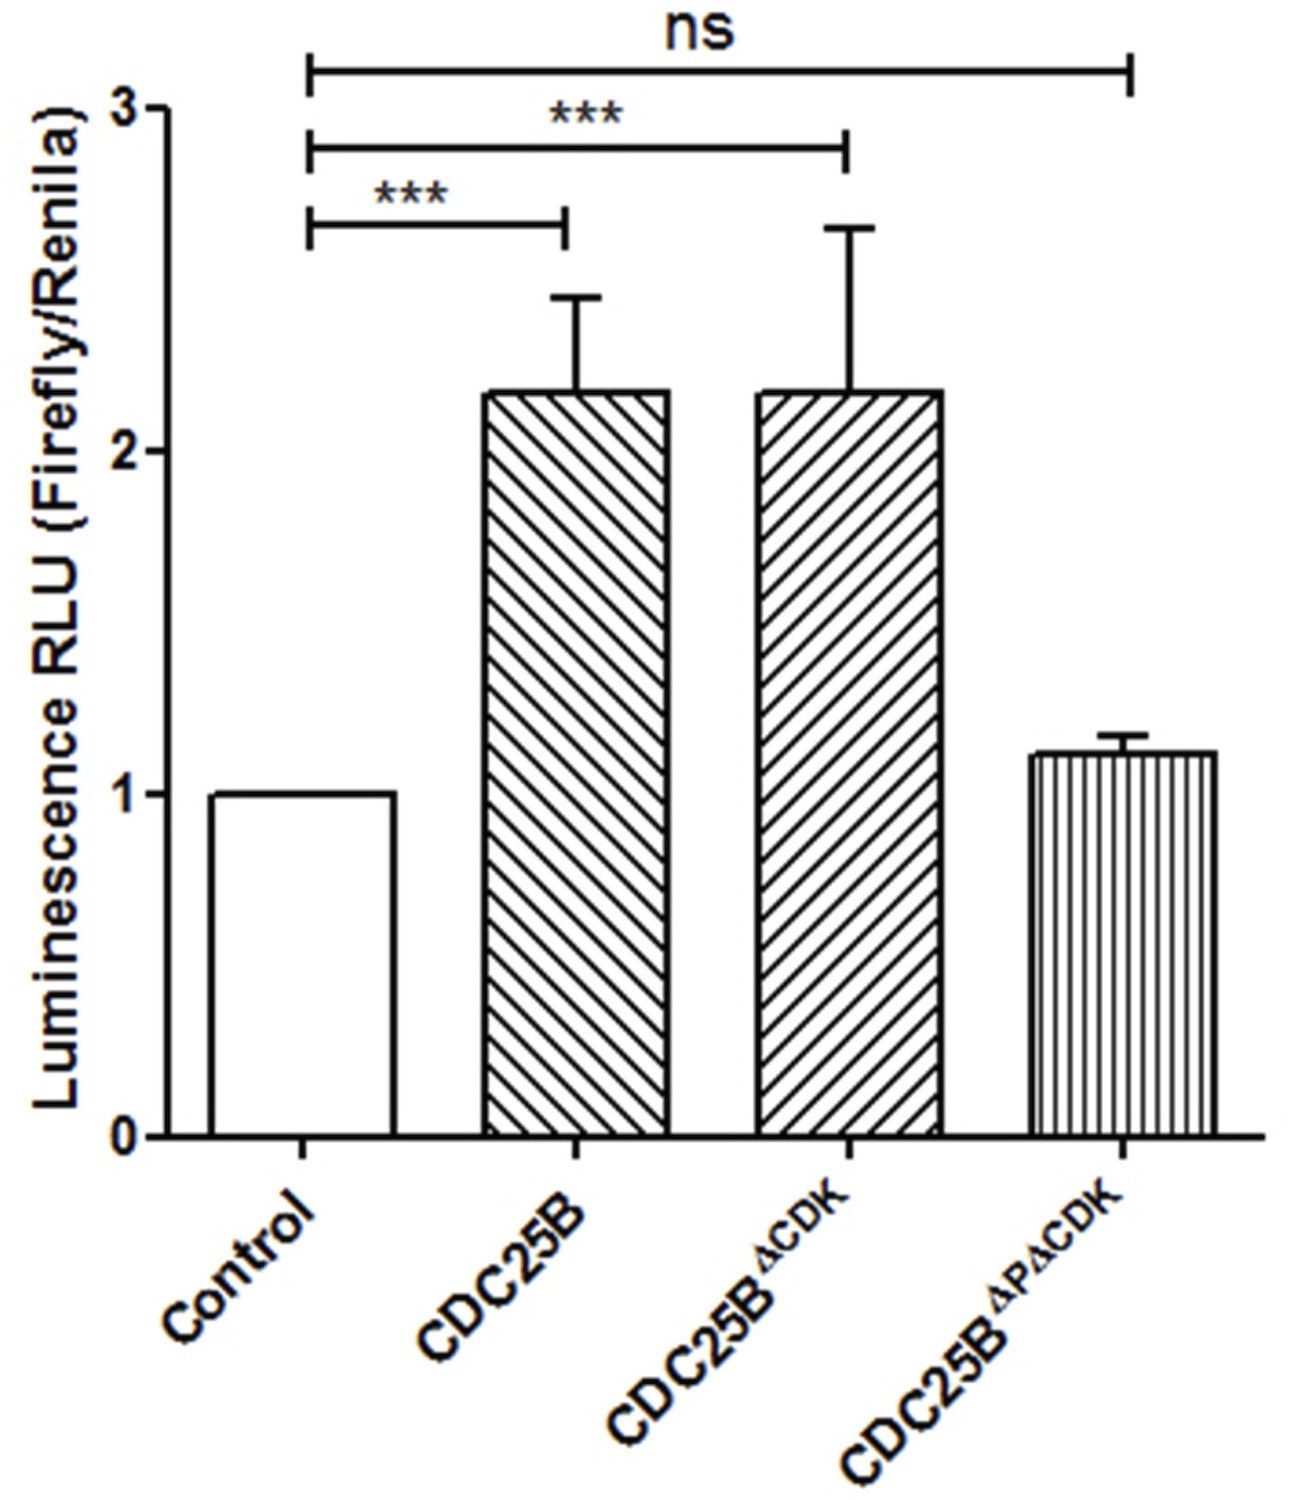
Effects of various CDC25B constructs on NeuroD promoter activity.
Bar plot representing the transcriptional activity of the NeuroD promoter assessed in vivo following electroporation of the indicated CDC25B constructs. At HH11, the embryos were electroporated with the pNeuroD::Luc vector and a renilla luciferase reporter construct carrying the cytomegalovirus immediate early enhancer promoter for normalization (Promega), together with the indicated DNAs. At HH22, 48 hr post electroporation, the neural tubes were dissected and processed following the Dual Luciferase Reporter Assay System protocol (Promega). The data are presented as the means ± SEM from at least 14 embryos in four experiments.
Figure 3
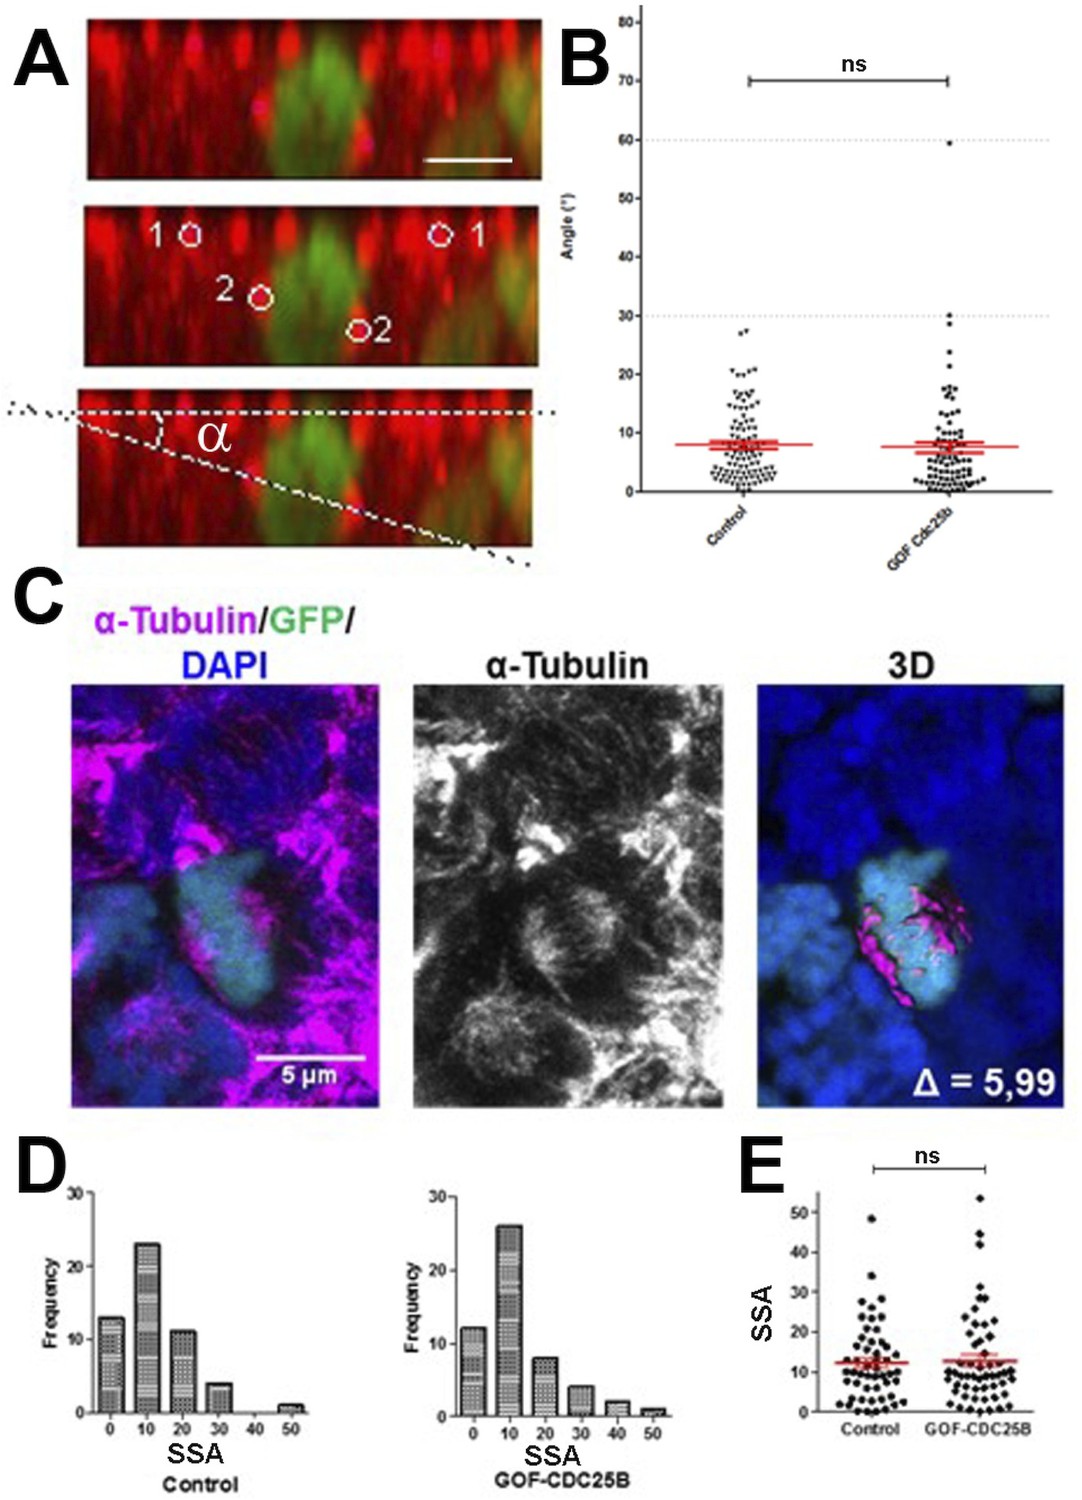
CDC25B gain-of-function does not affect mitotic spindle orientation or spindle-size asymmetry (SSA).
(A) Representative Z plane image of an anaphase cell expressing H2B-GFP that decorates chromosomes (green) and immunostained with anti tubulin antibody to label centrosomes (red). Aligned interphase centrosomes labelled as one and mitotic spindle poles labelled as 2 (middle image) were used to measure mitotic spindle angle (lower image). (B) Quantification of mitotic spindle angle , 24 hr after electroporation in control and CDC25B gain-of-function experiments. (C) Representative image of a symmetric metaphase cell: H2B-GFP and DAPI stain the nuclei, and -Tubulin stains the mitotic spindle (left and middle images). Right image, 3D reconstruction of the symmetric spindle using Imaris software. (D, E) Distribution of the Spindle-Size Asymmetry (SSA) difference between the two sides of the spindle 24 hr after electroporation in control and CDC25B gain-of-function: Histogram of SSA distribution (D) and scatter plot of SSA distribution (E). Scale bars represent 5 µm.
Figure 4
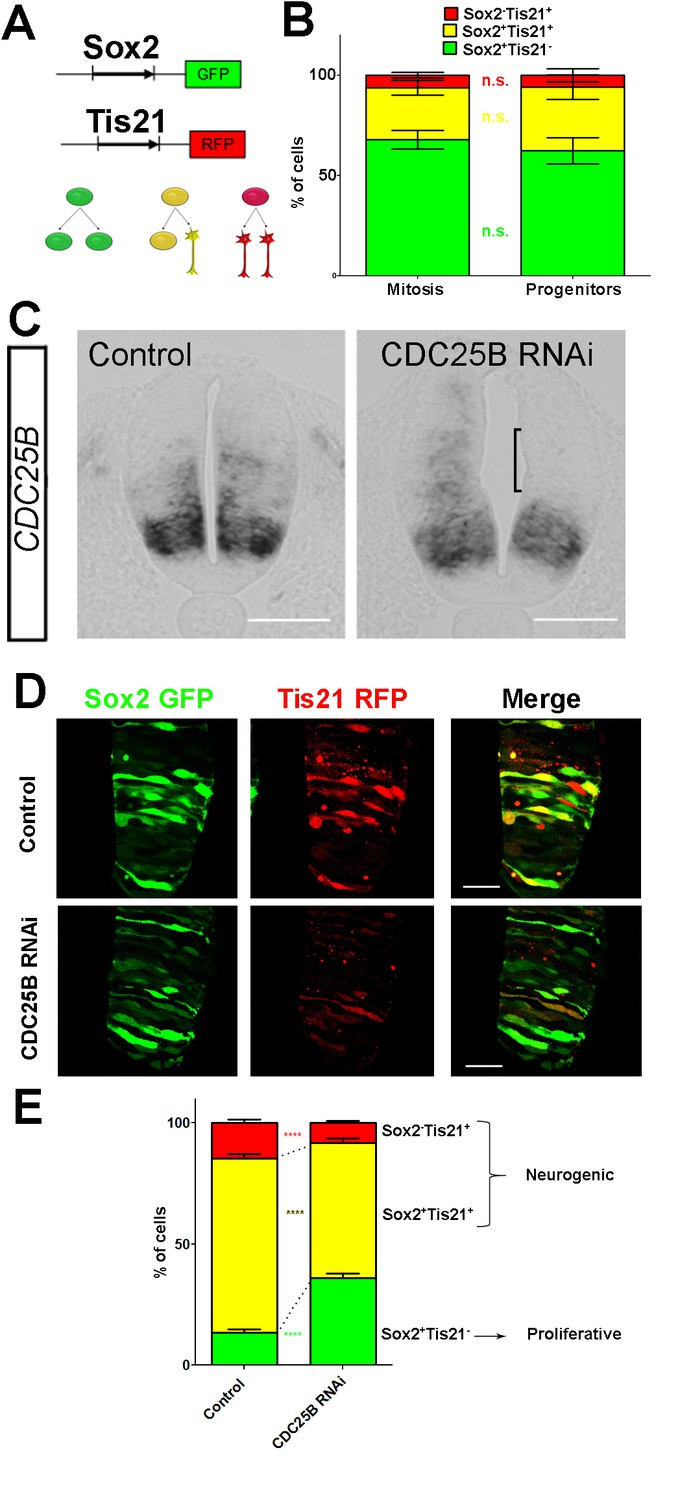
CDC25B downregulation reduces neurogenic divisions.
(A) Schematic representation of the Sox2::GFP Tis21::RFP labelling strategy. A GFP expressing cell (green cell) corresponds to a PP division, a cell expressing both GFP and RFP (yellow cell) corresponds to a PN division, and a RFP expressing cell (red cell) corresponds to a NN division. (B) Bar plot representing the percentage of cells expressing the reporters Sox2::GFP and Tis21::RFP at HH17 in the entire progenitor population, or in progenitors performing mitosis identified with phospho-histone-3 (PH3) immunostaining. Note that these results are not significantly different. These data are obtained from three different experiments, seven embryos, 365 progenitors, and 79 mitoses. (C) In situ hybridization for CDC25B on HH17 spinal cord, 24 hr post electroporation of Control RNAi (left panel) and CDC25B RNAi (right panel). The reduction of CDC25B expression in the intermediate region is indicated by a bracket. Cells were electroporated on the right side of the neural tube (not shown). Scale bars indicate 100 µm. (D) Cross-sections of chick spinal cord at HH17, 24 hr after co-electroporation of Sox2::GFP and Tis21::RFP reporter, plus a control RNAi vector or the CDC25B-RNAi vector. Scale bars indicate 50 µm. (E) Bar plot representing the percentage of progenitors expressing Sox2::GFP and Tis21::RFP 24 hr after co-electroporation of a control vector or a CDC25B RNAi vector. 4 experiments include seven control embryos and 15 CDC25B RNAi embryos.
Figure 5

CDC25B gain-of-function promotes neurogenic divisions.
(A) Representative cross-sections of HH17 chick spinal cord, 24 hr after electroporating Sox2::GFP and Tis21::RFP reporters, plus a control vector pccRE::lacZ, or a pccRE::CDC25B vector. Scale bars indicate 50 µm. (B) Representative cross-sections of HH21 chick spinal cord, 40 hr after electroporation of Nucbow and pCX CRE vectors, and immunostaining with HuC/D antibody. Scale bar indicates 50 µm. (C) Specific two cell clone examples, 40 hr after transfection of Nucbow and immunostaining with HuC/D antibody. Scale bars indicate 10 µm. (D) Box plots (5/95 percentile) comparing the percentage of progenitors expressing Sox2::GFP and Tis21::RFP 24 hr after co-electroporation with control or CDC25B vectors in the entire spinal cord. Data represent the means SEM of 3 different experiments with 5 control and 6 CDC25B gain-of-function embryos. (E) Box plots (5/95 percentile) comparing the percentage of two cell clones expressing Nucbow and pCX CRE vectors, 40 hr after co-electroporation with control or CDC25B vectors in the entire spinal cord. Data represent the means SEM of 3 different experiments with 387 clones in 12 control embryos, and 659 clones in 11 CDC25B gain-of-function embryos. (F) Bar plot representing the percentage of progenitors expressing Sox2::GFP and Tis21::RFP 24 hr after co-electroporation with control or CDC25B vectors in the dorsal and ventral spinal cord. Data represent the means SEM. Data represent three different experiments with 5 dorsal and 10 ventral neural tubes in the control, and 5 dorsal and six ventral neural tubes in the CDC25B gain-of-function.
Figure 6
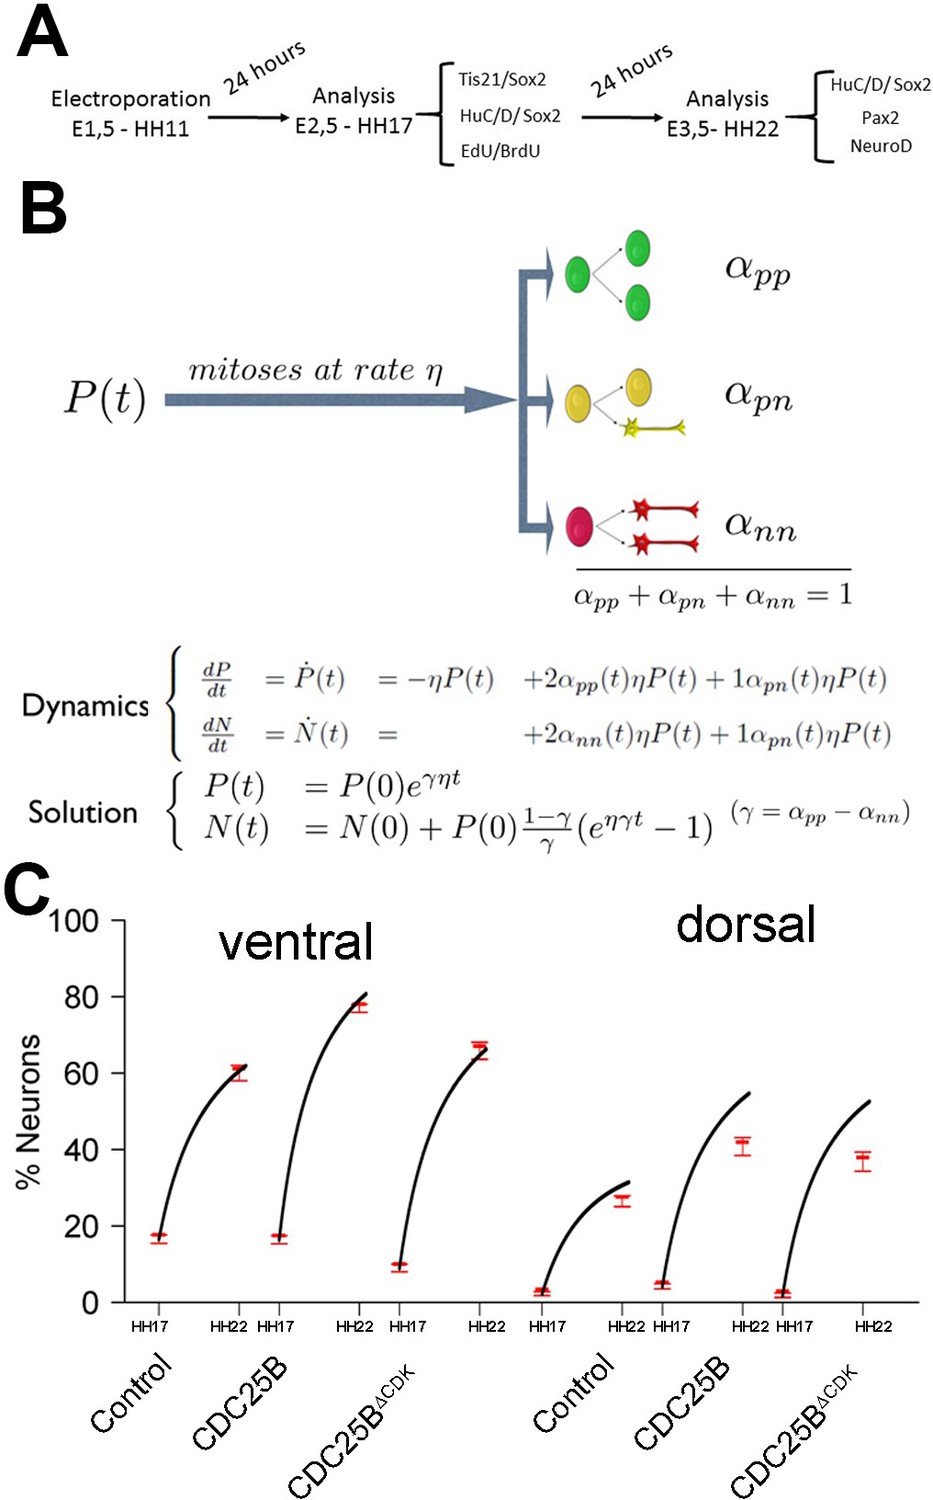
Mathematical model linking the mode of division to the fraction of neurons generated.
(A) Scheme of the experimental time course. Neural tubes are electroporated at stage HH11. 24 hr (HH17) and 48 hr (HH22) post electroporation, cell cycle parameters, mode of division and progenitor/neuronal markers are analyzed. (B) Illustration of our mathematical model. We consider P(t) a pool of progenitors at a given time with a mitotic rate . These mitoses lead to three modes of division: a fraction producing symmetric proliferative divisions yielding two progenitors, a fraction producing asymmetric divisions yielding one progenitor and one neuron (a precursor of), and a fraction producing symmetric neurogenic divisions yielding two neurons. The equations display the dynamics governing the pools of progenitors P(t) and neurons N(t) at any time t. These dynamics are solved for a given initial condition P(0), N(0), and we obtain the state of the system any time later (Solution, details in Appendix 2 and Appendix 4). (C) Kinetic predictions of the neuronal fraction between stages HH17 and HH22 in the different conditions, compared to the mean 95% confidence interval (in red) of the experimental data at stages HH17 and HH22 (from Figures Figure 2F and Figure 7E).
Figure 7
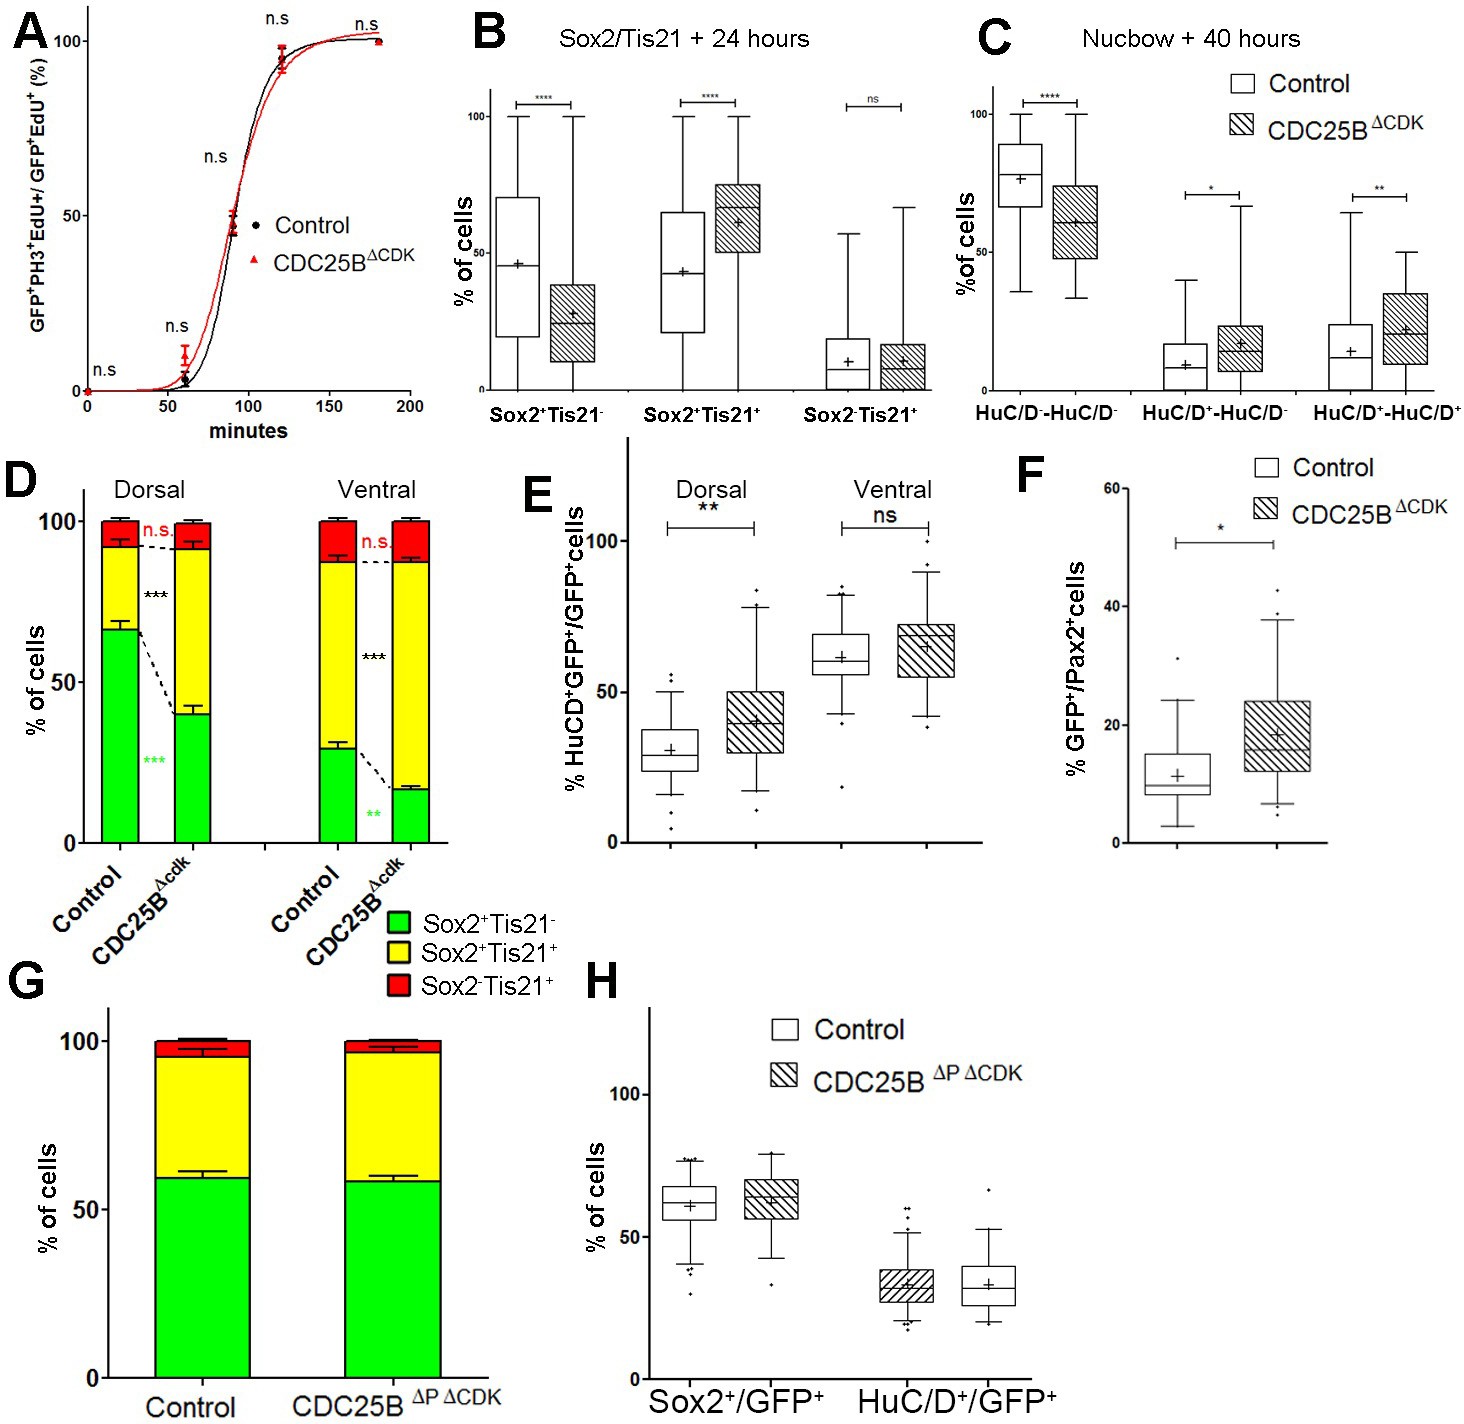
CDC25B gain-of-function promotes neurogenesis independently of CDK interaction.
(A) Curves representing the percentage of electroporated GFPEdUPH3 over the total GFPEdU cells with increasing EdU exposure times: control (black), CDC25B (red). Note that the curve for the CDC25B condition is similar to the control, indicating an absence of effect on G2 length. (B) Box plots (5/95 percentile) comparing the percentage of progenitors expressing Sox2::GFP and Tis21::RFP 24 hr after co-electroporation with control or CDC25B vectors in the entire spinal cord. Data represent the means SEM of 3 different experiments with 6 control and 6 CDC25B gain-of-function embryos. (C) Box plots (5/95 percentile) comparing the percentage of two cell clones expressing Nucbow and pCX CRE vectors, 40 hr after co-electroporation with control or CDC25B vectors in the entire spinal cord. Data represent the means SEM of 3 different experiments with 387 clones in 12 control embryos, and 692 clones in 10 CDC25B gain-of-function embryos. (D) Bar plot representing the percentage of cells expressing Sox2::GFP and Tis21::RFP 24 hr after co-electroporation with control or CDC25B vectors, in the dorsal or ventral spinal cord. Data represent the means SEM. Data represent three different experiments with a total of 5 dorsal and 10 ventral neural tubes under control conditions, and 4 dorsal and 9 ventral neural tubes in CDC25B gain-of-function. (E) Box plots (5/95 percentile) comparing the percentage of HuC/D cells within the electroporated population in control or CDC25B gain-of-function experiments, in the dorsal or ventral neural tube at HH22. Data represent three different experiments with 13 dorsal and 6 ventral neural tubes in the control and 6 dorsal and 3 ventral neural tubes in the CDC25B gain-of-function. (F) Box plots (5/95 percentile) comparing the percentage of Pax2 cells in the dorsal neural tube at HH22. Data from three different experiments with 8 control embryos, and 11 CDC25B gain-of-function embryos. (G) Bar plot representing the percentage of progenitors expressing Sox2::GFP and Tis21::RFP at HH17, 24 hr after electroporation of a control or CDC25B expressing vector in the dorsal half of the spinal cord. Data from three different experiments with 6 control embryos, and 9 CDC25B embryos. (H) Box plots (5/95 percentile) comparing the percentage of Sox2 or HuC/D cells within the electroporated population in the control or CDC25B gain-of-function experiments, in the dorsal spinal cord at HH17. Data from three different experiments with 11 control embryos, and 6 CDC25B embryos. The cross indicates the mean value.
Figure 8 with 1 supplement
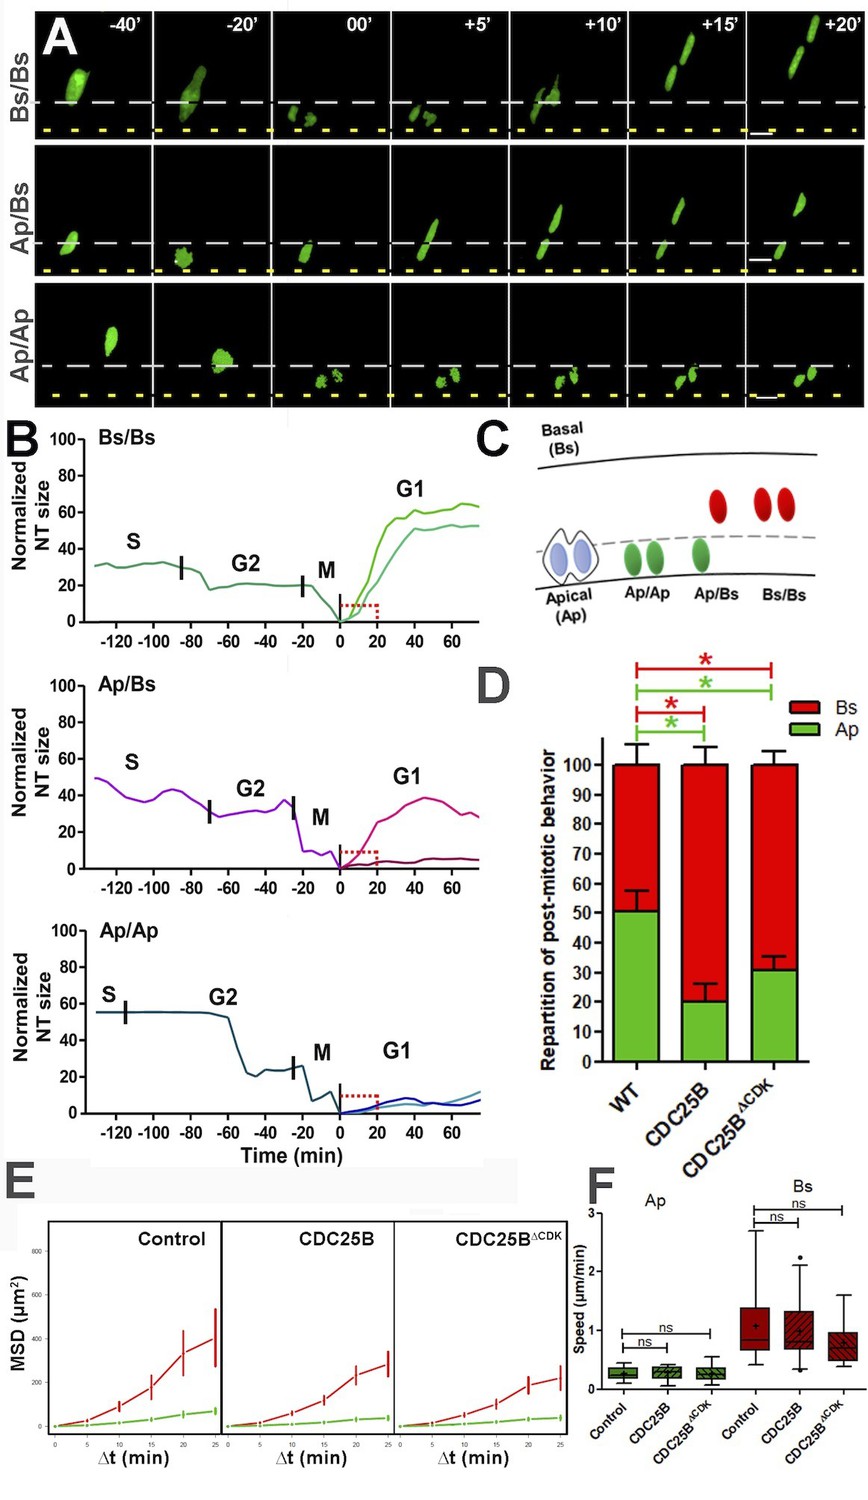
CDC25B affects G1 nuclei movement independently of CDK interaction.
(A) Time-lapse series of the different daughter cell nuclear behaviors. Yellow dashed lines indicate the lumen; grey dashed lines represent 10% of the apico-basal length. Scale bars: 10 µm. (B) Quantitative tracking of nuclear movement in embryonic chicken neural tube. Daughter cell nuclei can display three different behaviors after cytokinesis: both nuclei migrate immediately after mitosis (Bs/Bs) (upper panel); one of the nuclei remains at the apical side and the sister nucleus migrates to the basal side (Ap/Bs) (middle panel) or both nuclei remain at the apical side for at least 20 min before starting basal migration (Ap/Ap) (lower panel). Nuclei were labelled by NLS-EGFP-L2-PCNA (Leonhardt et al., 2000) that allows the distinction between G2/M/G1 phases, and their movements were tracked by time-lapse microscopy and Imaris software. The end of mitosis (cytokinesis) showed the most apical localization and was defined as zero. Cell cycle phases (S, G2, M, G1) are indicated above the tracks. (C) Scheme representing nuclear behavior during G1. (D) Quantification of the repartition of post mitotic behavior, that is, Ap or Bs positioning after mitosis in WT, CDC25B and CDC25B gain-of-function. 156, 174 and 212 cells in 16, 9 and 20 explants of 10, 5 and 8 experiments in WT, CDC25B and CDC25B gain-of-function, respectively. (E) Mean squared displacement (MSD) profile (error bars show 95% confidence interval) of Ap nuclei (green line) and Bs nuclei (red line) in the control, CDC25B and CDC25B gain-of-function. Under all conditions, Ap nuclei display slow motion (linear trend), while Bs nuclei display a persistent apico-basal motion (parabolic trend). (F) Box plots (5/95 percentile) comparing the mean speed over the first 20 min post mitosis of Ap and Bs nuclei. Number of nuclei tracked are 16, 17, and 11 Ap nuclei, and 14, 25, and 19 Bs nuclei, in control and CDC25B and CDC25B gain-of-function, respectively for E and F.
Figure 8—figure supplement 1
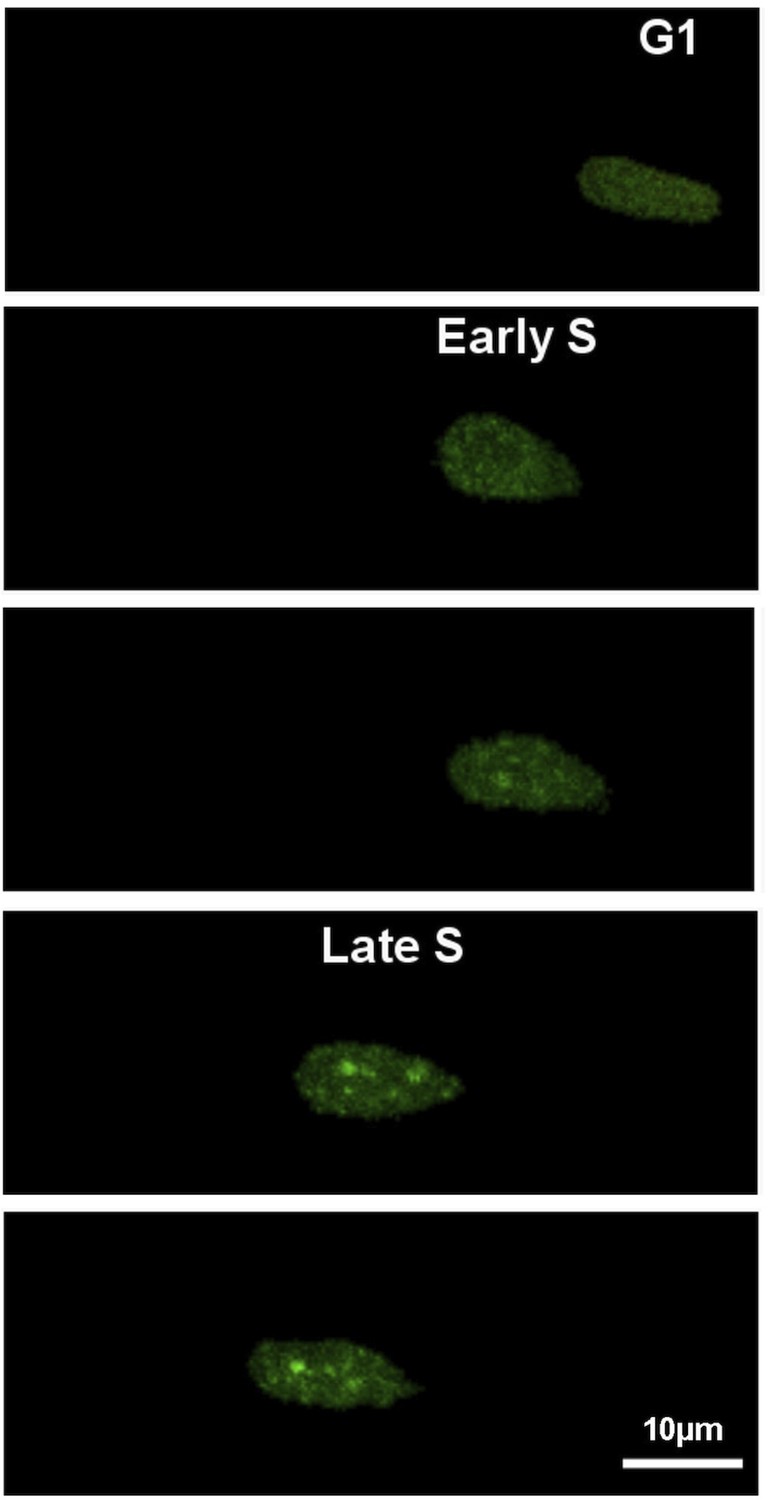
Time-lapse series of neural progenitor cell electroporated with GFP-PCNA.
This cell entering S phase is recognized by the appearance of a dot-like staining inside the nucleus, corresponding to PCNA recruitment into DNA replication foci. At early S phase, small dots are detected that will get bigger and brighter as soon as S phase continues (Late S-phase).
Figure 9
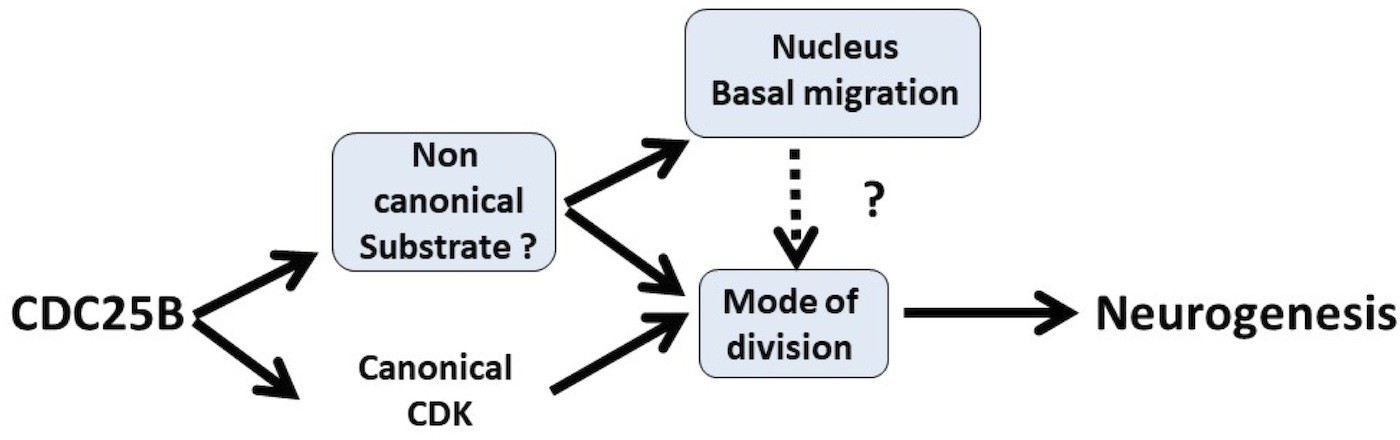
Schematic of CDC25B modes of action.
CDC25B activity on an unknown substrate changes G1 nucleus basalward movement during Interkinetic Nuclear Migration (INM), and also acts on the mode of division leading to increased neurogenesis. It remains to be determined whether a link exists between these two activities. In addition to this new pathway, the data obtained in mice and using the Tis21/Sox2 assay suggest that the activity of CDC25B on CDK might account for part of its activity on the mode of division and neurogenesis.
Appendix 2—figure 1
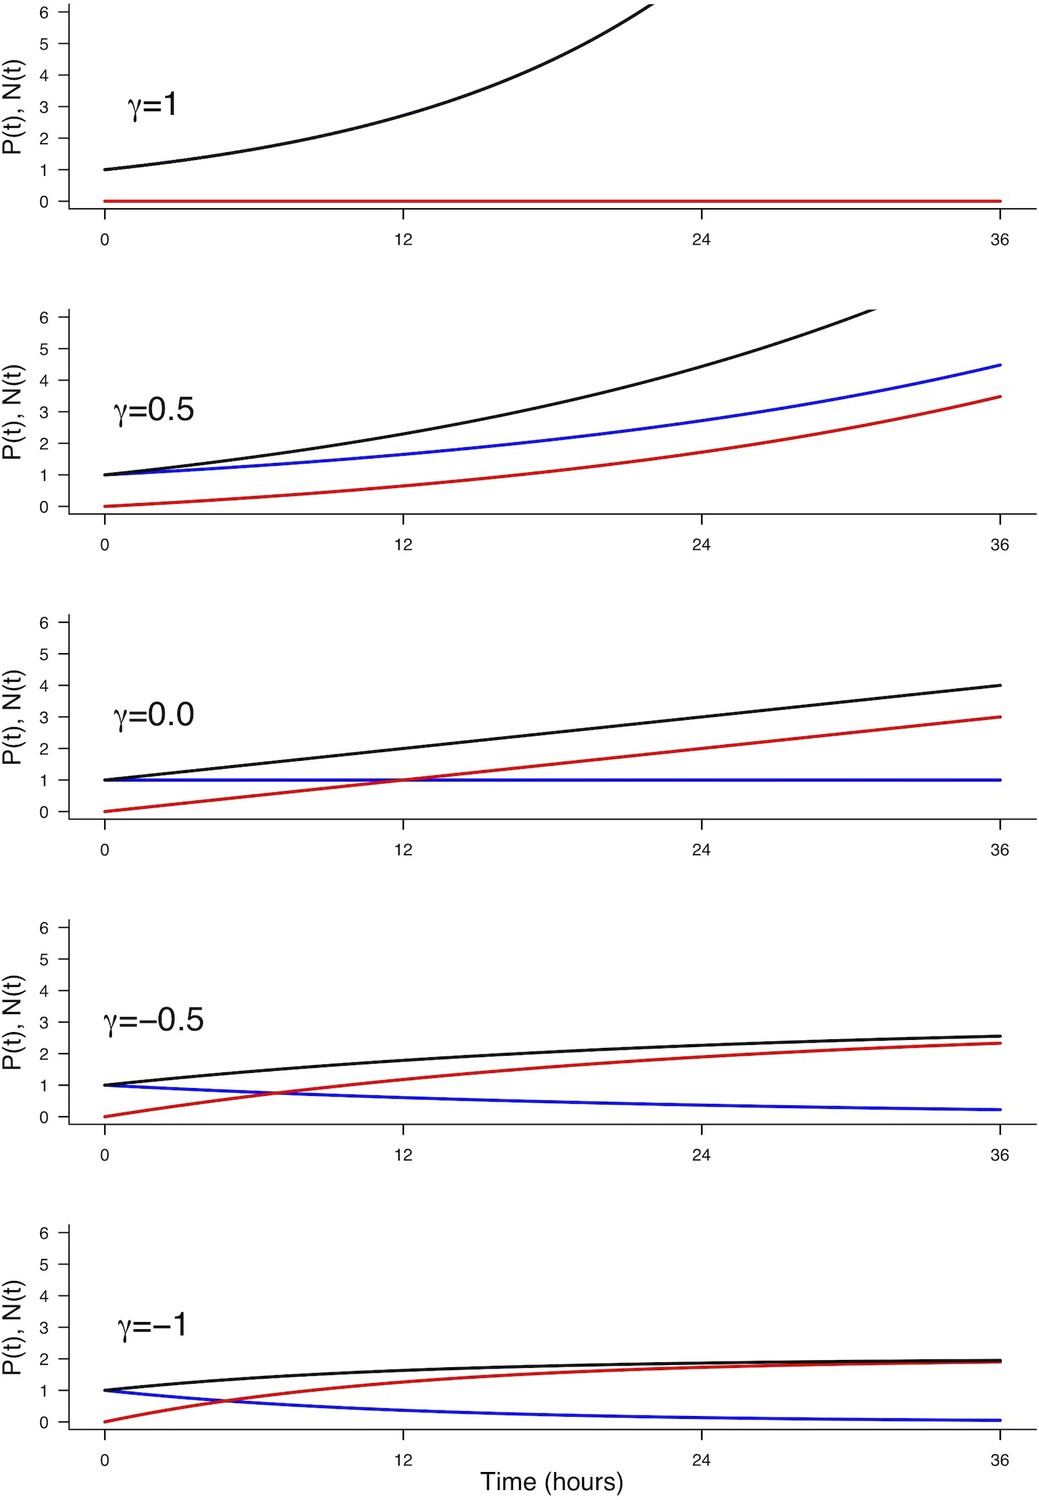
Effect of on the evolution of (blue), (red) and (black).
Parameters used: , , , corresponding to a cycle time of 12 hr.
Appendix 2—figure 2
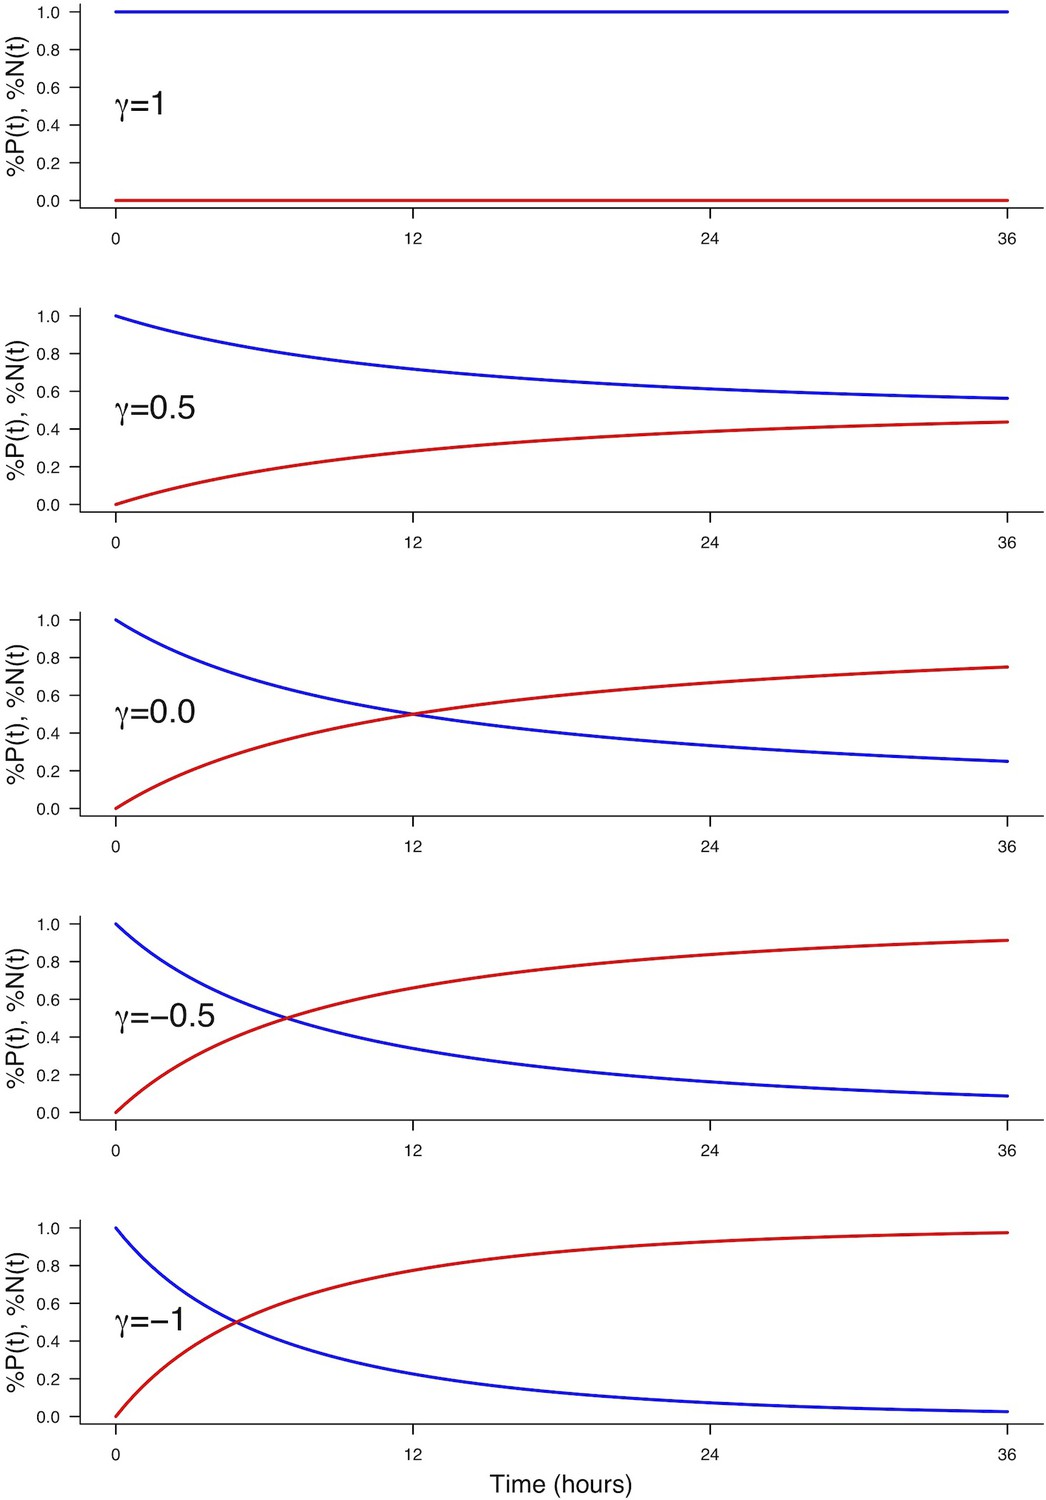
Effect of on the evolution of the fractions (blue) and (red).
https://doi.org/10.7554/eLife.32937.024
Appendix 3—figure 1
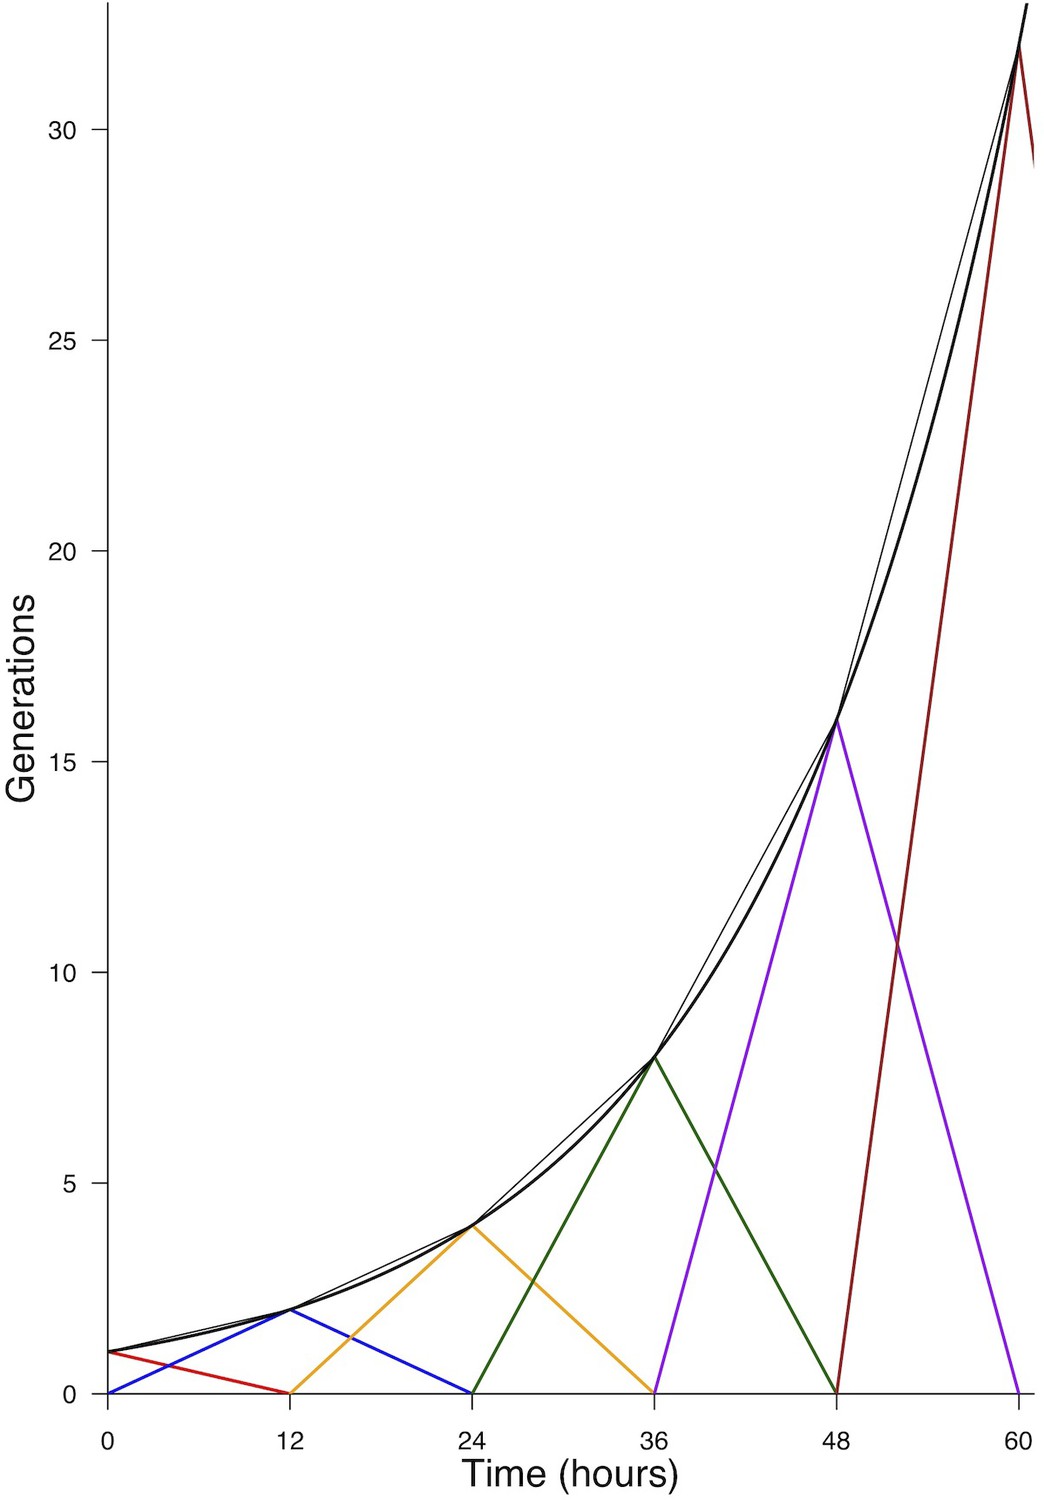
Generations produced by an initial pool.
, under the hypothesis of a common deterministic division time . Each generation is reported by a color. The thin black curve indicates the total pool present at time (adding the two generations). The thick black curve reports the continuous approximation (Equation 22).
Appendix 4—figure 1
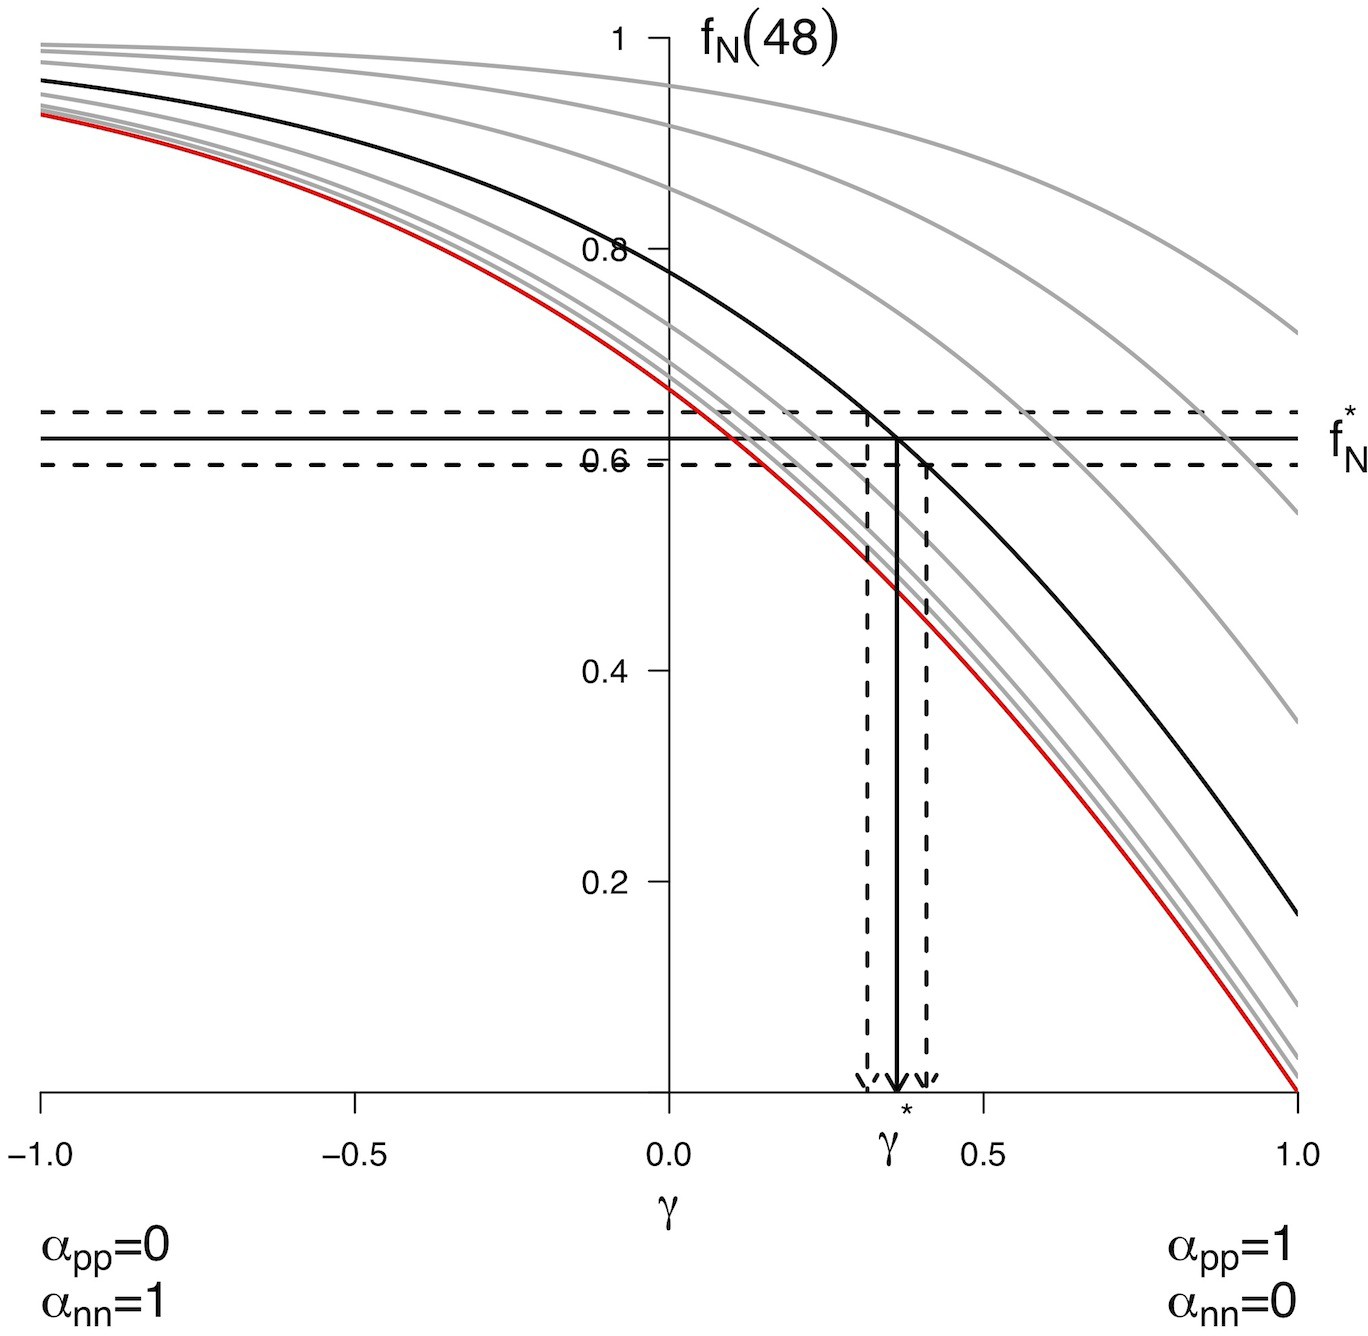
Predicted from for every distribution of symmetric division.
The different curves correspond to different starting values taken in . The bold line corresponds to , the red line to . Each curve reports the predicted value for starting from the corresponding , and for all possible distributions of fates given by (x-axis). Each combined yields only one predicted . Conversely, experimental values for the pair allow to retrieve the corresponding theoretical value. As an example, the value corresponding to the arbitrary value was retrieved numerically using Equation 31. We found , yielding and . Confidence interval upon the distributions of fates can also be drawn using the experimental noise about , as illustrated here considering .
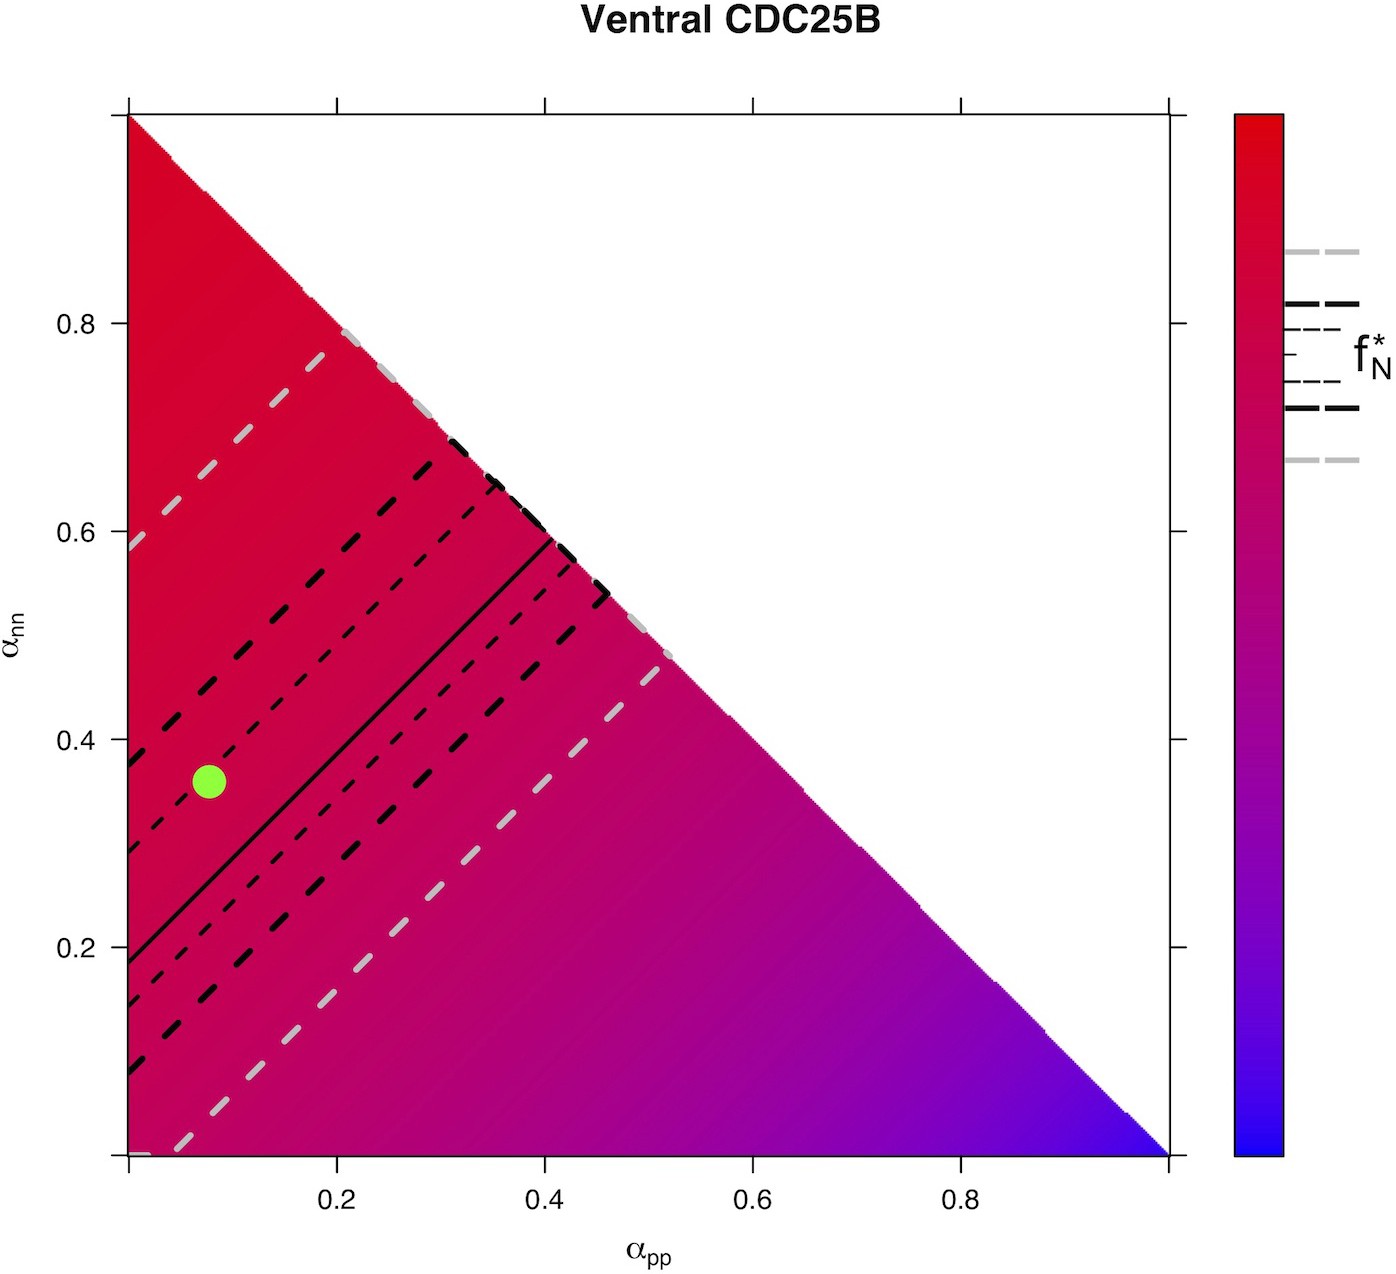
Appendix 4—figure 2

Predicted from for every distribution of fates for control condition in Ventral area.
The color scale indicates . It is computed from the model, starting from the experimental value of in the prevailing condition, and using all possible distributions of fates (x-axis), (y-axis) and . The upper side of the triangle corresponds to . Confidence interval upon the predicted distributions of fates are drawn for the experimental value . Plain line: all distributions of fates giving exactly . Region delimited by thin dotted line: all distributions of fates compatible with , thick dotted line : , gray dotted line: . Green dot: observed distribution of fates.
Appendix 4—figure 3
Predicted from for every distribution of fates for condition in Ventral area.
https://doi.org/10.7554/eLife.32937.030
Appendix 4—figure 4

Predicted from for every distribution of fates for condition in Ventral area.
https://doi.org/10.7554/eLife.32937.031
Appendix 4—figure 5
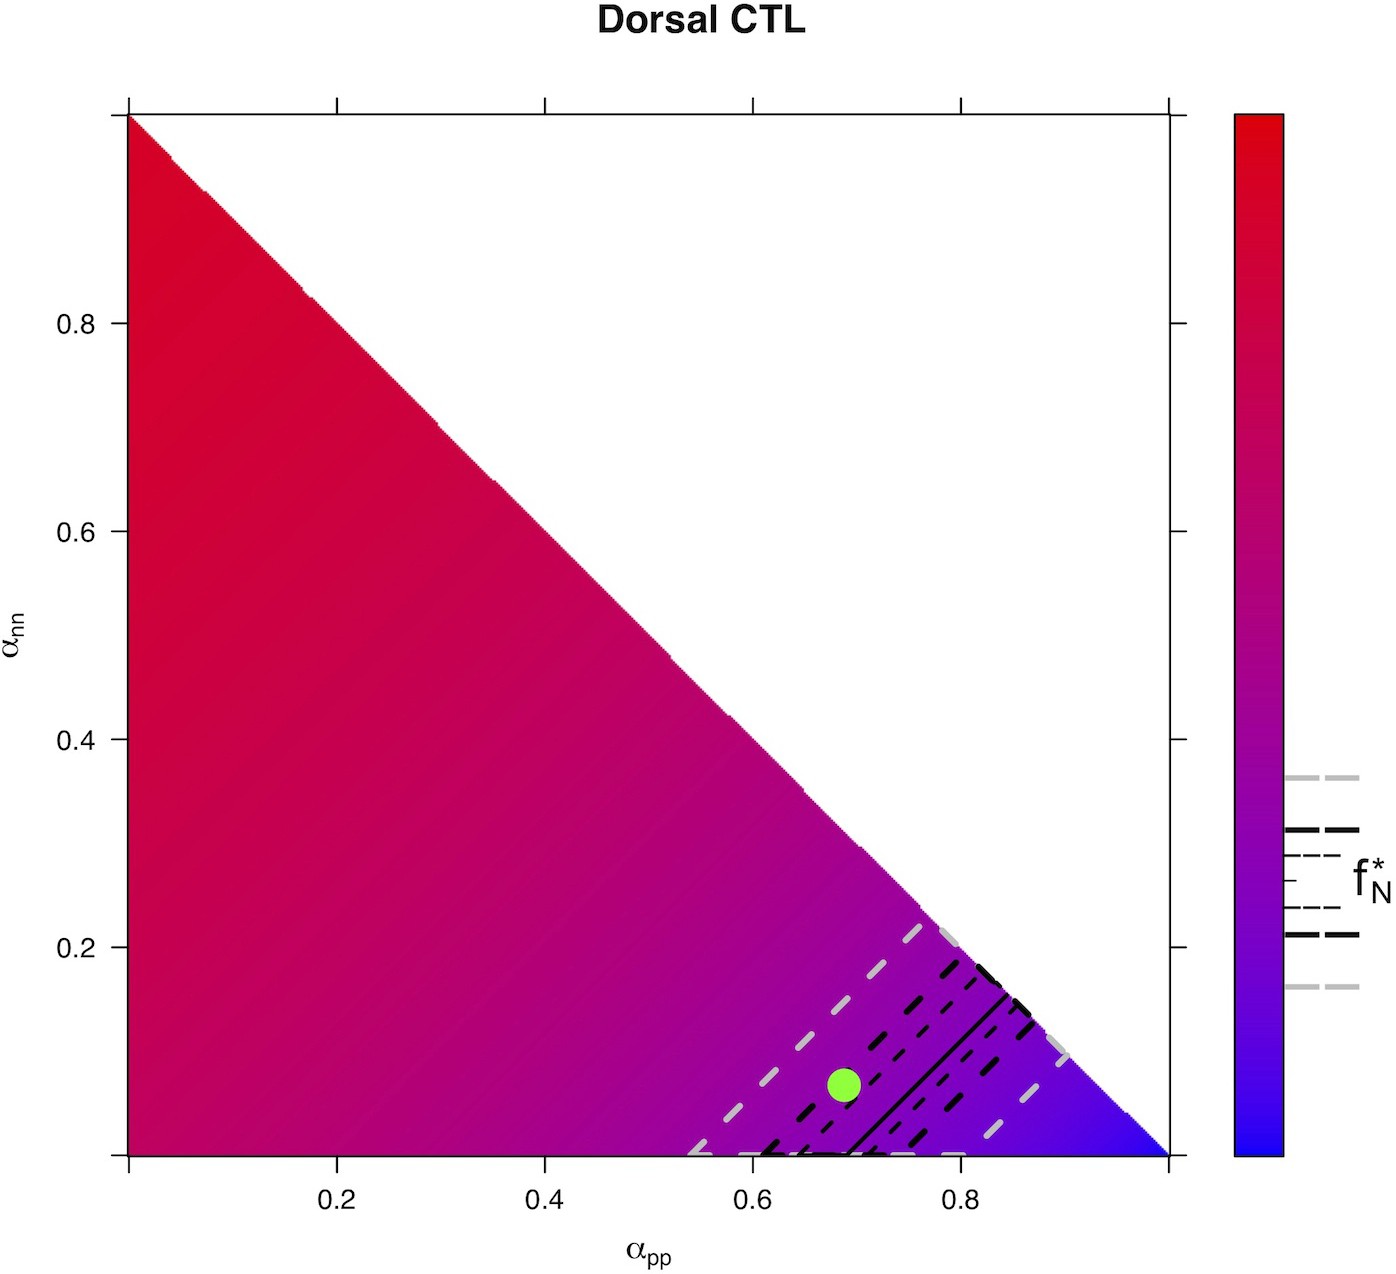
Predicted from for every distribution of fates for control condition in Dorsal area.
https://doi.org/10.7554/eLife.32937.032
Appendix 4—figure 6

Predicted from for every distribution of fates for condition in Dorsal area.
https://doi.org/10.7554/eLife.32937.033
Appendix 4—figure 7

Predicted from for every distribution of fates for condition in Dorsal area.
https://doi.org/10.7554/eLife.32937.034
Appendix 4—figure 8
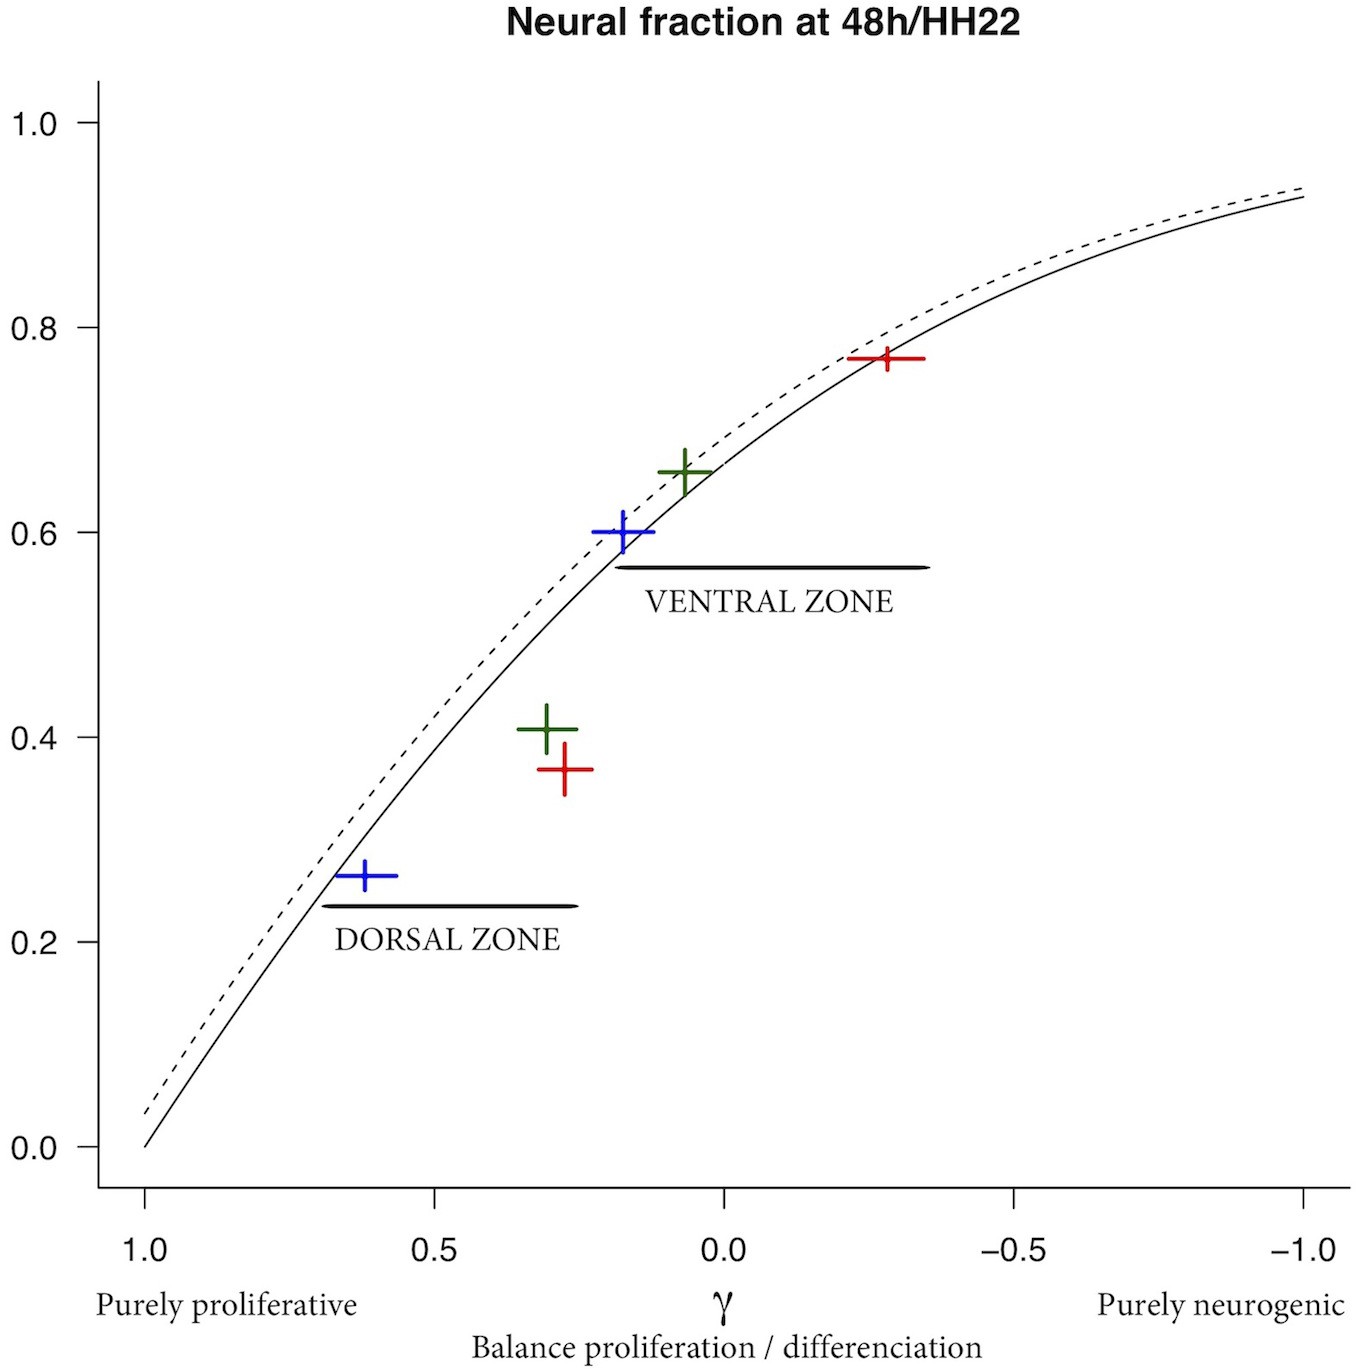
Predicted from varying the balance proliferation/differentiation .
Plain line reports the model prediction for the dorsal zone, dotted line the model prediction for the ventral zone (predictions differ due to differences in the initial fraction in the two zones). The experimental data are reported by crosses (cross arm lengths are 95% CI). Blue cross: CTL, red cross: , green cross: .
Appendix 4—figure 9
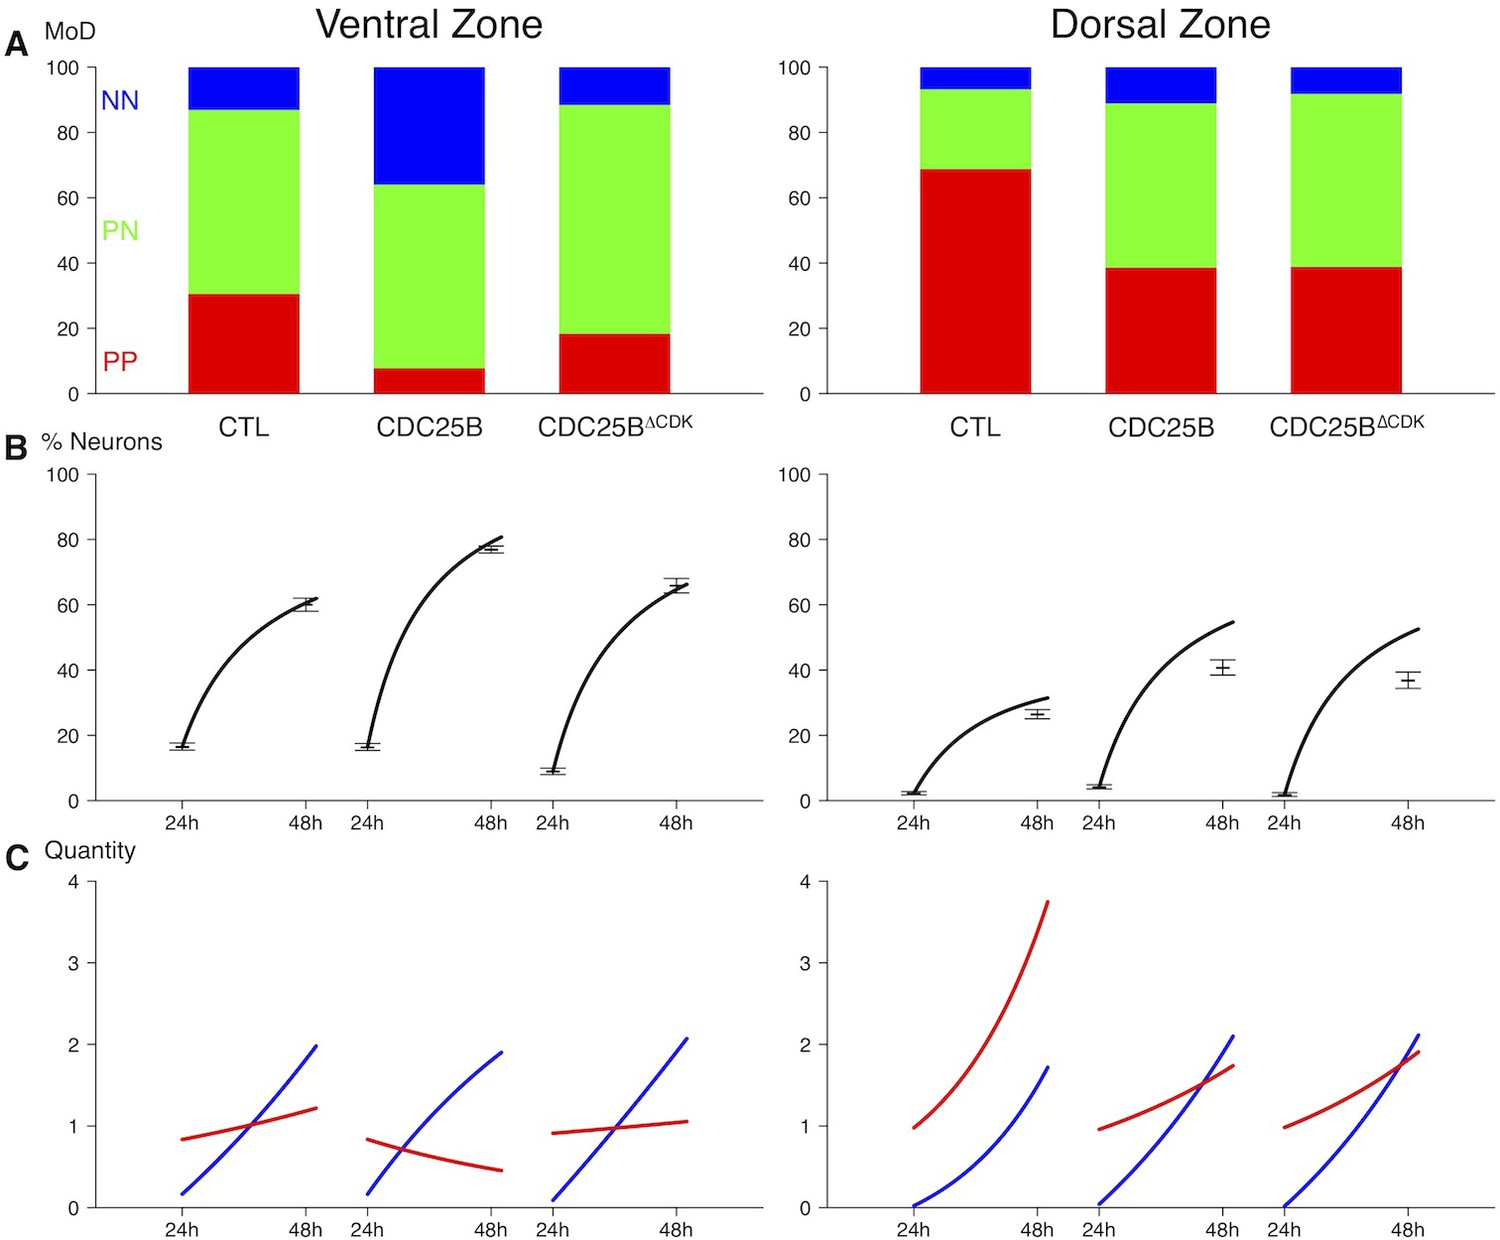
Summary of the data and predictions.
(A) Observed distributions of modes of divisions (MoD) for the three conditions and the two zones. (B) Predicted evolutions of the neuronal fraction from to given the observed distribution of fates (lines) and observed fractions at 24 hr and 48 hr. (C) Corresponding evolution in numbers of the two pools (Red: progenitors, Blue: neurons).
Videos
Video 1
Time-lapse imaging of neural tube daughter nuclei performing apical movements (Ap/Ap).
Mother and daughter cells expressing GFP-PCNA can be followed over time and interkinetic nuclear movement of cells is observed. Images were taken every 5 min at 63X magnification and are played at 12 frames per second (fps).
Video 2
Time-lapse imaging of neural tube daughter nuclei performing apical and basal movements (Ap/Bs).
Mother and daughter cells expressing GFP-PCNA can be followed over time and interkinetic nuclear movement of cells is observed. Images were taken every 5 min at 63X magnification and are played at 12 fps.
Video 3
Time-lapse imaging of neural tube daughter nuclei performing basal movements (Bs/Bs).
Mother and daughter cells expressing GFP-PCNA can be followed over time and interkinetic nuclear movement of cells is observed. Images were taken every 5 min at 63X magnification and are played at 12 fps.
Tables
Table 1
Putative time it would take to achieve the three kinds of division under a model which assumes that only cycle time determines the fate output.
Full consequences derived from this assumption are given in Appendix 3. Basically, such an assumption implies that cycling rates associated with each mode of division are proportional to the observed fraction of that mode. If we observe, for instance, 60% PP-divisions and 10% NN-divisions (like it is in the Control dorsal), then a NN-division should take six times as long as a PP-division. If we exclude such a possibility, then fate distribution cannot be exclusively determined by differences in fate-based cycle times. It does not exclude that a given kind of fate (e.g. proliferative divisions PP) could require a longer time to be achieved than others; it excludes that such differences would suffice per se to explain the differences between the fractions of fates.
| Zone and condition | (hours) | (hours) | (hours) | (hours) |
|---|---|---|---|---|
| Control dorsal neural tube | 18.1 | 46.3 | 154.1 | 12.0 |
| CDC25B dorsal neural tube | 31.1 | 23.9 | 106.0 | 12.0 |
| CDC25B dorsal neural tube | 29.8 | 23.5 | 150.0 | 12.1 |
| Control ventral neural tube | 41.0 | 20.7 | 94.5 | 12.0 |
| CDC25B ventral neural tube | 172.7 | 22.9 | 29.5 | 12.0 |
| CDC25B ventral neural tube | 72.2 | 17.0 | 94.7 | 12.0 |
Table 2
Distribution of post-mitotic Basal and Apical nuclei performing a new cell division (S-phase) or remaining in G1-phase (Long G1).
n: number of cells counted. S-Phase: cell that re-enters S phase during the time lapse. Long G1: cell that performs a G1 longer that 10 h hours and that does not re-enter S phase during the time lapse. ND: not determined because the time lapse conditions did not allow to follow the cell long enough.
| S-phase | Long G1 | ND | Total | ||||
|---|---|---|---|---|---|---|---|
| n | % | n | % | n | % | n | |
| Basal | |||||||
| WT | 9 | 11.8 | 7 | 9.2 | 60 | 79.0 | 76 |
| CDC25B | 32 | 25.6 | 5 | 4.0 | 88 | 70.4 | 125 |
| CDC25B | 40 | 27.2 | 0 | 0.0 | 107 | 72.8 | 147 |
| Apical | |||||||
| WT | 30 | 37.5 | 6 | 7.5 | 44 | 55.0 | 80 |
| CDC25B | 15 | 30.6 | 6 | 12.3 | 28 | 57.1 | 49 |
| CDC25B | 16 | 24.6 | 4 | 6.2 | 45 | 69.2 | 65 |
Additional files
-
Transparent reporting form
- https://doi.org/10.7554/eLife.32937.020
Download links
A two-part list of links to download the article, or parts of the article, in various formats.
Downloads (link to download the article as PDF)
Open citations (links to open the citations from this article in various online reference manager services)
Cite this article (links to download the citations from this article in formats compatible with various reference manager tools)
Neurogenic decisions require a cell cycle independent function of the CDC25B phosphatase
eLife 7:e32937.
https://doi.org/10.7554/eLife.32937


