Structural basis of ribosomal peptide macrocyclization in plants
- The University of Western Australia, Australia
- University of Western Australia, Australia
- University of Minnesota, United States
Figures
Figure 1
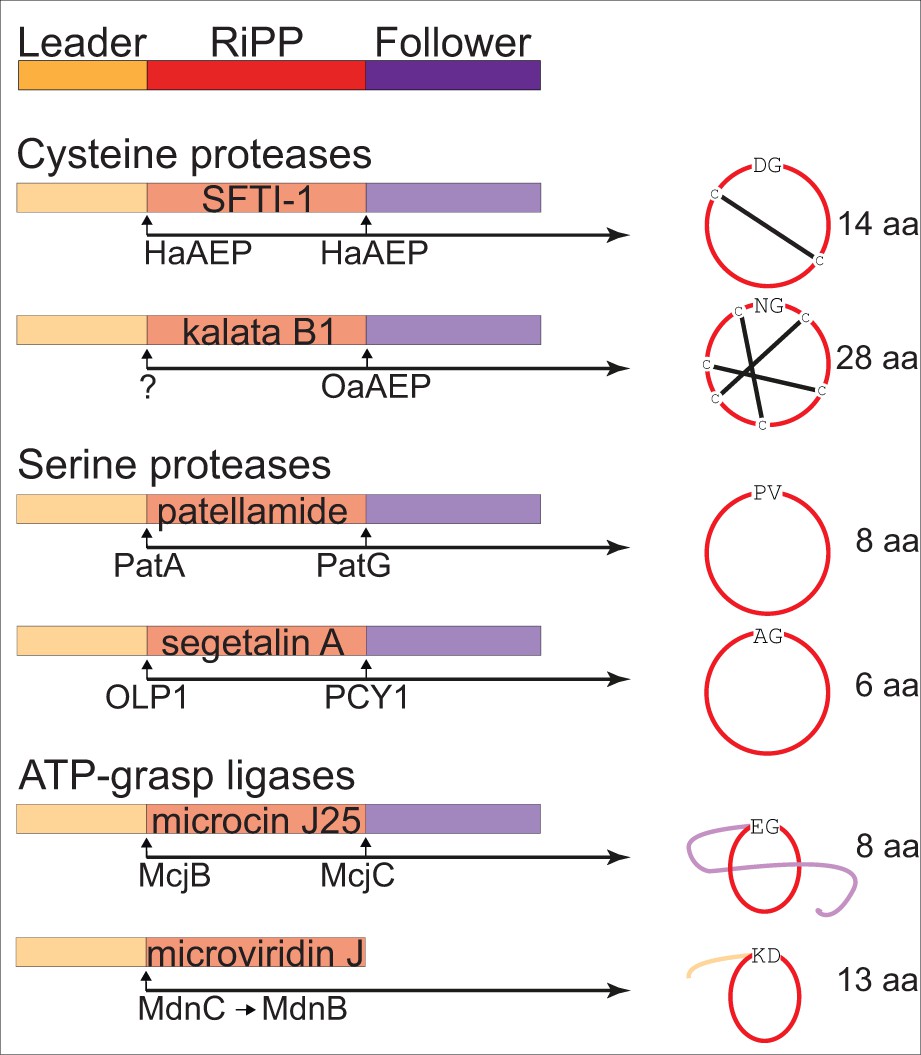
Examples of enzyme catalyzed formation of cyclic RiPPs.
Cyclic RiPPs that are enzyme catalyzed from linear peptide precursors are commonly flanked by an N-terminus leader sequence and a C-terminus follower sequence prior to cyclization. These flanking sequences commonly aid in substrate recognition and catalysis. Well characterized examples of enzymes that are able to perform macrocyclization currently include cysteine proteases (Helianthus annuus AEP – HaAEP, and Oldenlandia affinis AEP – OaAEP; following removal of the leader peptide by an as yet undefined enzyme), serine proteases (patellamide A/G – PatA/G, and peptide cyclase 1 – PCY1; following removal of the leader peptide by oligopeptidase 1 – OLP1) and the ATP dependent ATP-grasp ligases (microviridin C and B – MdnC/B, and microcin J25 C - McjC; following removal of the leader peptide by microcin J25 B – McjB). These examples also illustrate a range of cyclic scaffolds that may have potential therapeutic applications.
Figure 2 with 3 supplements
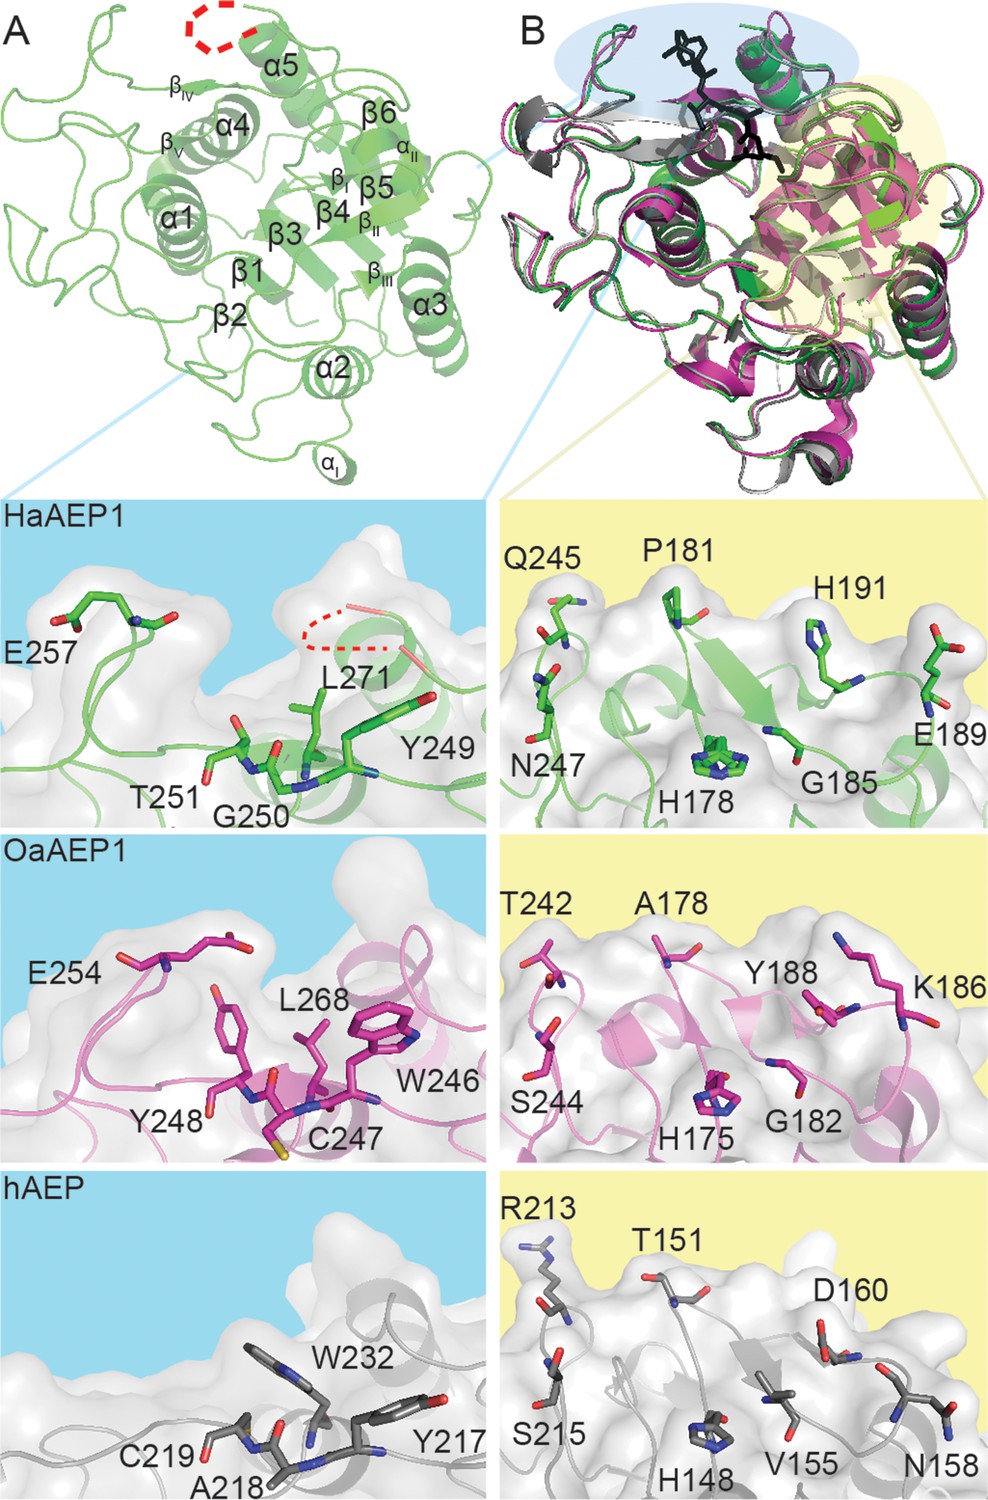
Architecture of HaAEP1 versus other AEP structures.
(A) Cartoon representation of the overall topology of HaAEP1 with major α-helices and β-sheets annotated. Residues 304–309 that exhibited weak electron density and are missing from the model are shown as red dotted loop. (B) Comparison of HaAEP1 core domain (green) with OaAEP1 (magenta) and hAEP (gray) with bound chloromethylketone inhibitor (black) illustrating high overall structural similarity. Expanded surface and cartoon representations of highlighted regions of βIV-βV substrate binding region (blue backgrounds) and catalytic region (βI sheet, β5-βIV loop and βI-βIII region) orientated over the catalytic His residue (yellow backgrounds) are shown below illustrating the residue differences that could alter substrate specificity (shown in stick format). Also see Figure 2—figure supplements 1–3.
Figure 2—figure supplement 1
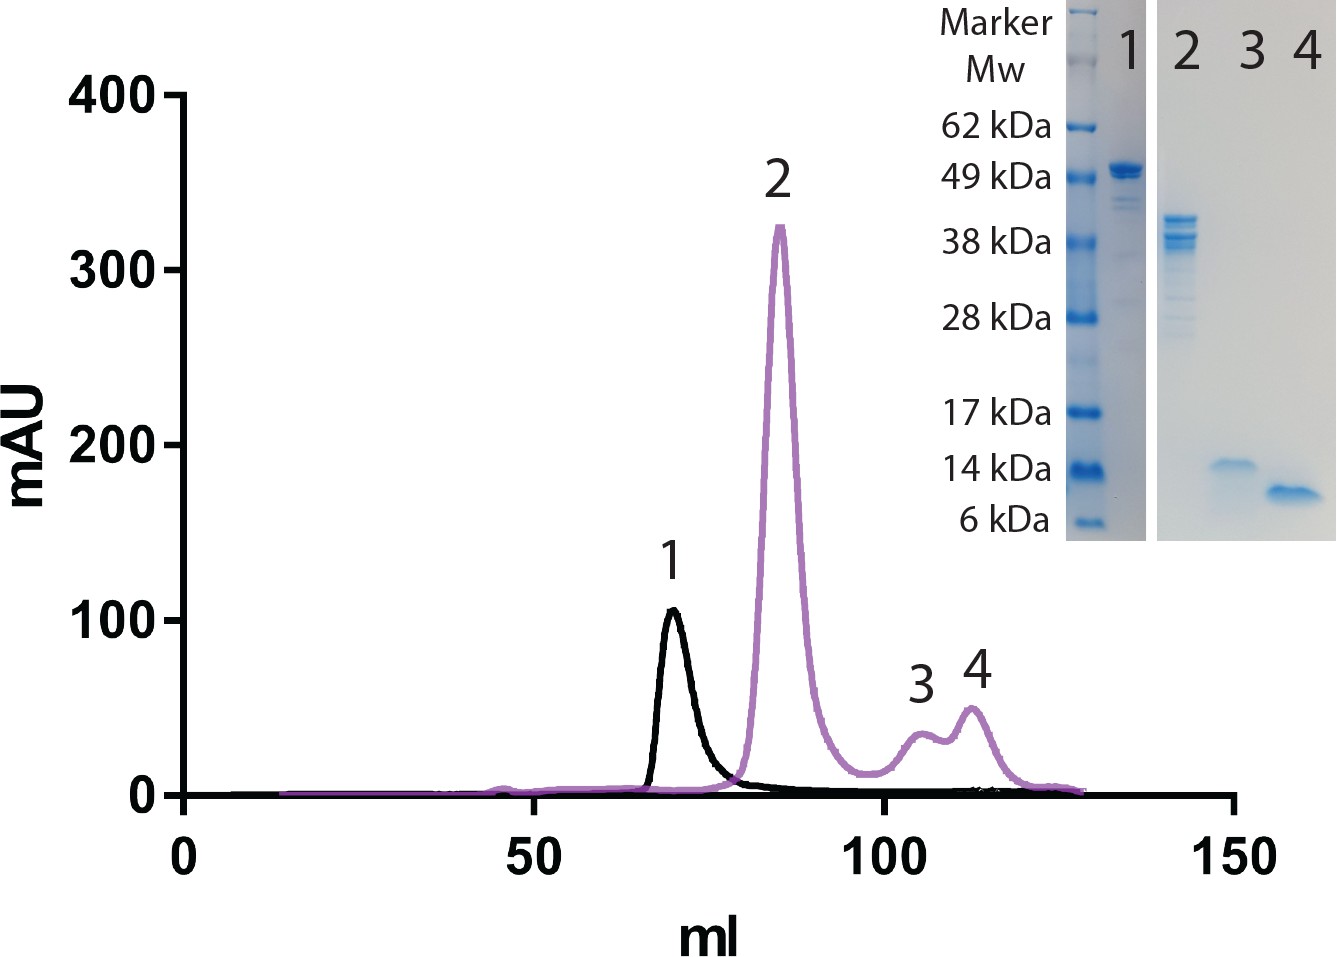
HaAEP1 auto-catalytically activates upon pH shift to pH 4.
HiLoad 16/600 Superdex 200 size exclusion chromatograph of HaAEP1 purified at pH 8 (black) and HaAEP1 purified at pH 8 then dialyzed at pH 4 overnight at 16°C (purple). Right insert - SDS-PAGE analysis of fractions collected from labeled size exclusion peaks illustrating ~52 kDa inactive HaAEP1 (Lane 1), heterogeneous self-cleavage products of HaAEP1 activation (Lane 2), alternatively cleaved and removed C-terminal cap domains (Lane 3 and 4).
Figure 2—figure supplement 2

Sequence alignment of C13 family of cysteine proteases.
Proteins labeled with UniProt codes, AOAOG2RI59 – HaAEP1. Plant AEPs grouped in green box. Mammalian AEPs grouped in dark blue box. GPI8 proteins grouped in gray box. Identical residues shown with white text and red box, similar residues shown with red text. Potential cleavage sites of HaAEP1 shown with green stars. Catalytic triad highlighted with black stars. Succinimide forming aspartic acid, not conserved in GPI8 proteins highlighted with gold stars. Predicted N-linked glycosylation sites in HaAEP1 and human AEP shown with black and blue inverted triangles, respectively. Variable insertion sites between βIV:βV and α5:β6 strands in HaAEP1 highlighted with cyan brackets.
Figure 2—figure supplement 3
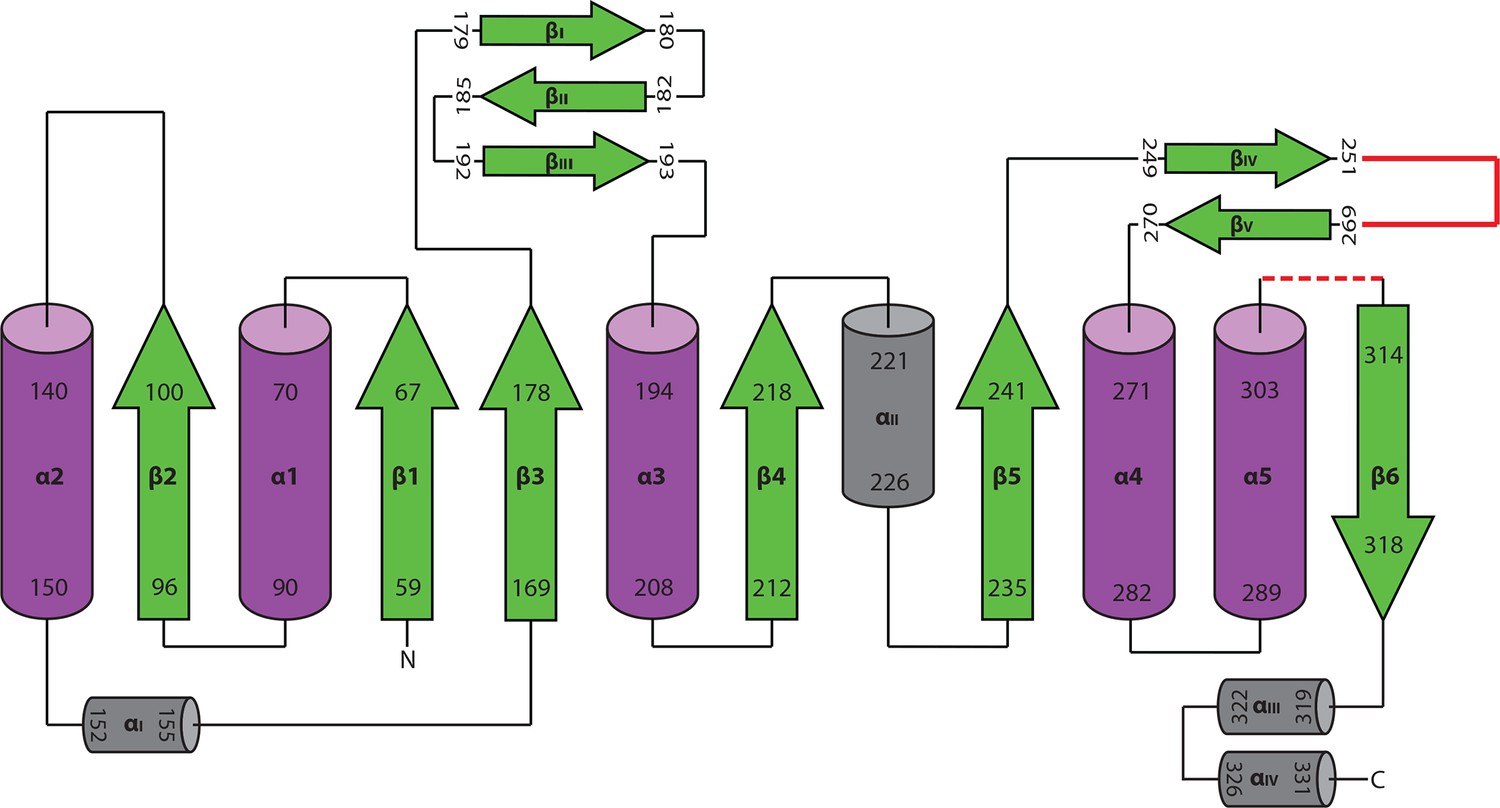
Topology diagram of active HaAEP1.
Topology diagram based on previously published diagram of highly similar structure of hAEP (Dall and Brandstetter, 2013). Polyproline insertion site found in HaAEP1 between βIV:βV shown in red. Residues 304–309 which exhibit low electron density are illustrated with red dotted loop.
Figure 3 with 2 supplements
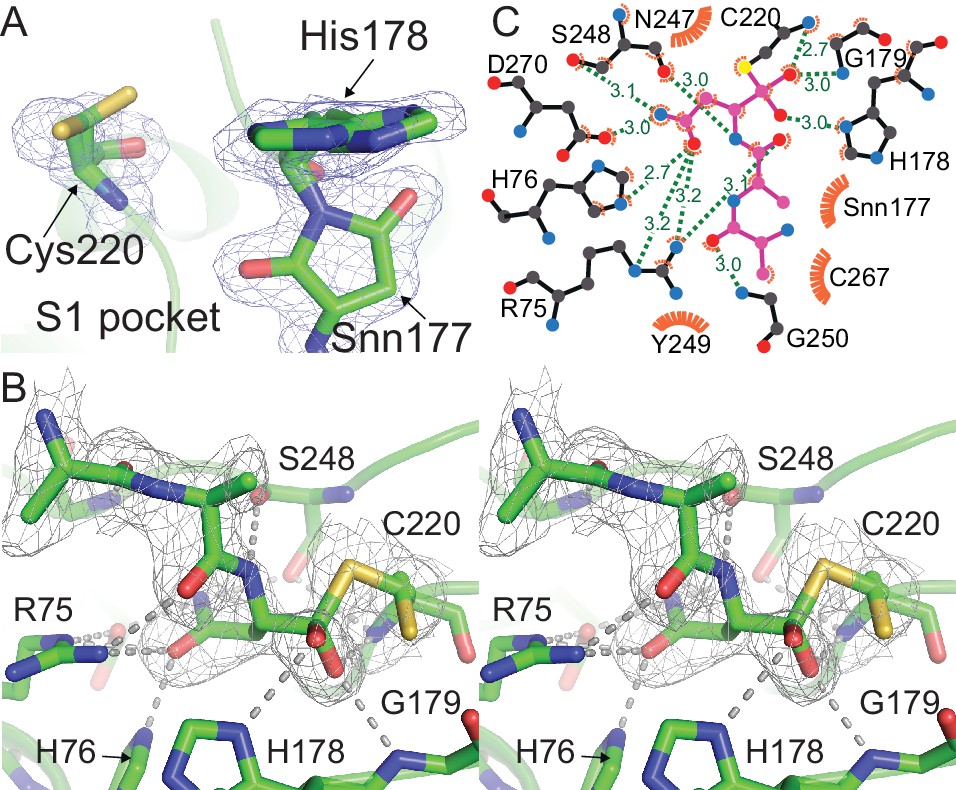
Outstanding features of the HaAEP1 active site.
(A) Catalytic residues with dual conformations illustrated in the HaAEP1 active site with simulated annealing omit electron density maps (2 Fobs - Fcalc) contoured at 1σ level. (B) Cross-eyed stereo view of polder OMIT map (Fobs - Fcalc) calculated in the absence of the shown overlaid AAN tetrahedral intermediate, contoured at 3σ level. (C) Schematic representation of interactions between AAN tetrahedral intermediate (purple sticks) and labeled active site residues generated using LigPlot+ (Laskowski and Swindells, 2011). Residues forming hydrogen bonds (green) are illustrated with black sticks with distances shown (Å). Residues and atoms that provide hydrophobic interactions are highlighted with orange eyelash symbols. Also see Figure 3—figure supplement 1.
Figure 3—figure supplement 1
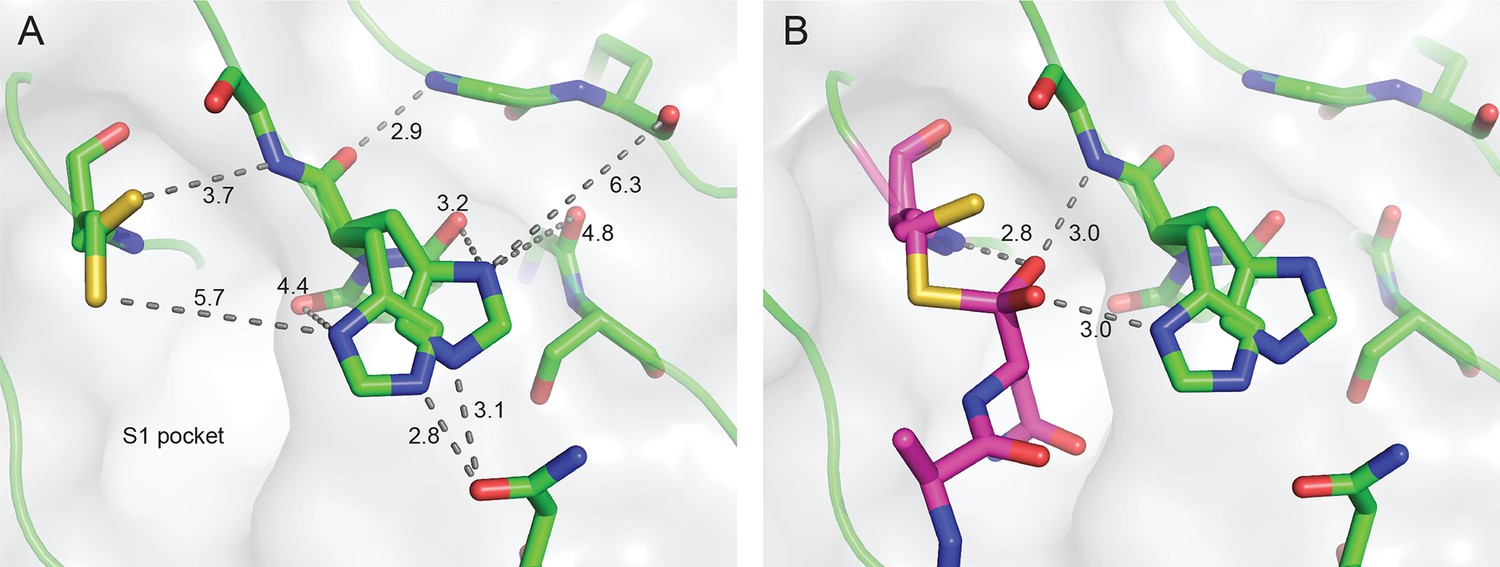
HaAEP1 active site geometry.
(A) Alternate conformations of catalytic residues H178 and C220, distances illustrated with text (Å) and dots. Distance of His178 to other local residues indicates that, with the exception of N73 and Snn177, H178 is relatively free from steric hindrance. (B) Tetrahedral peptide conformation bound to C220 (purple sticks) suggests that H178 and the backbone amines of G179 and C220 contribute to stabilizing this intermediate by forming an oxyanion hole, hydrogen bonds illustrated with text (Å) and dots. Furthermore, H178 is ideally situated to deprotonate an attacking nucleophilic group leading to formation of a tetrahedral intermediate and protonate the leaving group upon resolution of the intermediate.
Figure 3—figure supplement 2
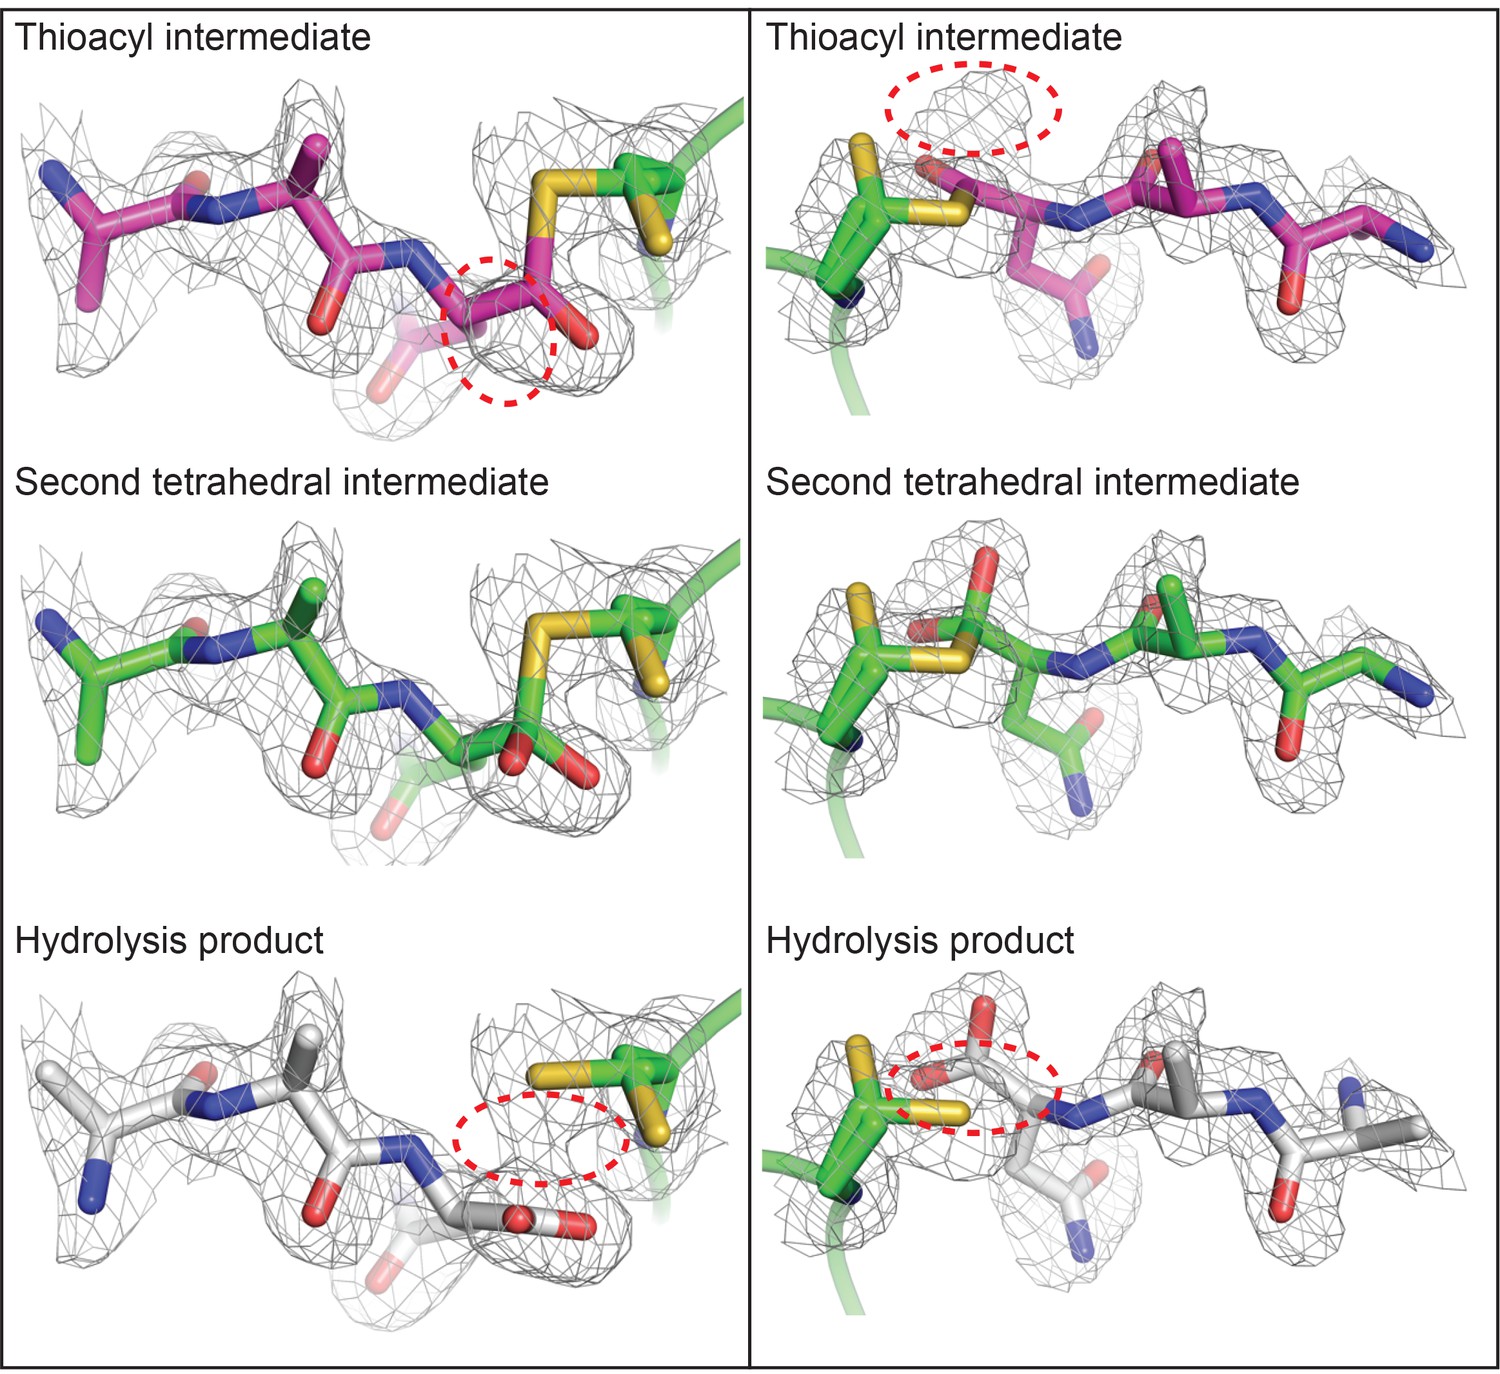
Polder OMIT maps define the presence of a tetrahedral intermediate in the HaAEP1 active site.
Polder OMIT maps (Fobs - Fcalc) calculated in the absence of an AAN peptide ligand, contoured at 3σ level, indicate that models of alternative intermediate AAN peptide structures (thioacyl intermediate – purple) and cleavage product (hydrolysis product – gray) appear not to fit the observed electron density as well as the modeled tetrahedral intermediate (second tetrahedral intermediate – green). Model peptides are shown from above (left) and side on (right) to aid visualization of electron density maps with incongruous regions of models circled (red dashed line).
Figure 4 with 4 supplements
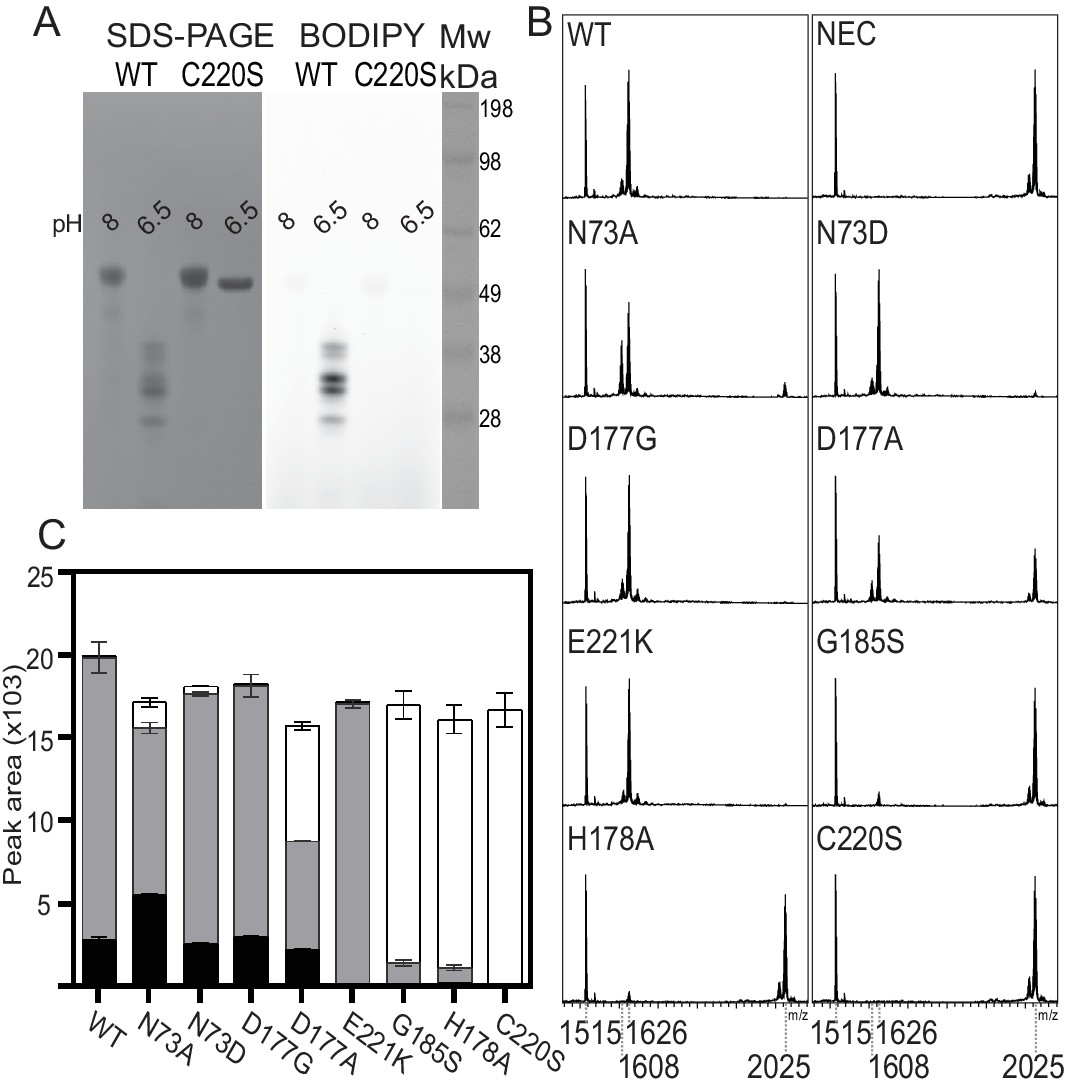
Mutagenesis studies of HaAEP1.
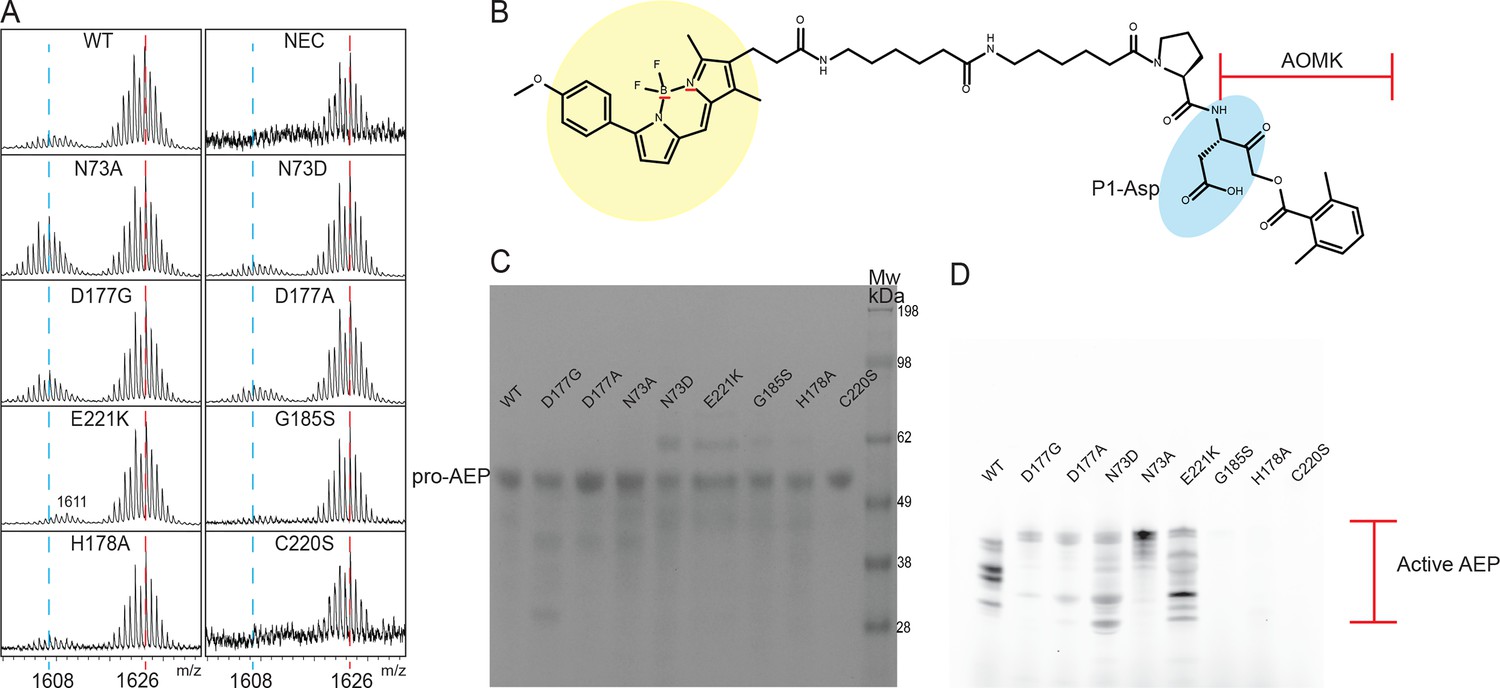
(A) Activity based probe analysis of HaAEP1 WT and C220S mutant illustrates that WT is active at pH 6.5 after activation at pH 4 whereas C220S mutant remains inactive. In-gel fluorescence of activity based probe (right) and post-fluorescence Coomassie stain of SDS-PAGE gel (left). (B) MALDI-TOF spectra of SFTI(D14N)-GLDN processing by WT and a range of HaAEP1 mutants directed at altering the ability of HaAEP1 to cleave and macrocyclize the substrate SFTI(D14N)-GLDN. NEC – no enzyme control. (C) Quantitation of peak areas from B. Peak areas of mass 1608 - cyclic SFTI(D14N), mass 1626 - acyclic-SFTI(D14N) and mass 2025 - unprocessed seleno-Cys modified SFTI(D14N)-GLDN substrate, were normalized for ionization efficiency using an internal standard mass 1515 - native SFTI-1. Black - cyclic SFTI-1(D14N), gray - acyclic-SFTI(D14N) and white - unprocessed seleno-Cys modified SFTI(D14N)-GLDN substrate. Peak areas with acyclic and cyclic forms have previously been shown to exhibit similar ionization efficiencies (Bernath-Levin et al., 2015). Error bars illustrate standard deviation n = 3 (D177A n = 2) technical replicates. Also see Figure 4—figure supplements 1–4.
Figure 4—figure supplement 1
Analysis of WT HaAEP1 and mutants activity.
(A) Expanded view of MALDI-TOF spectra of seleno-Cys SFTI(D14N)-GLDN processing by WT and a range of HaAEP1 mutants. Peak of mass 1608 - cyclic SFTI-1(D14N) and mass 1626 - acyclic-SFTI(D14N) indicated with blue and red dashed lines, respectively. (B) Structure of activity based probe with fluorescent BODIPY structure (yellow), P1 Asp residue (blue) and acyloxymethyl ketone (AOMK) highlighted. (C) SDS-PAGE analysis of Pro-AEP (Mw ~ 52 kDa) HaAEP1 WT and mutants at 0.1 mg/ml (pH 8). (D) Activity based probe analysis of HaAEP1 WT and mutants at pH 6.5 following activation at pH four illustrates heterogeneity of active HaAEP1 mutants sizes and drastically reduced levels of activity of G185S, H178A and C220S mutants.
Figure 4—figure supplement 2
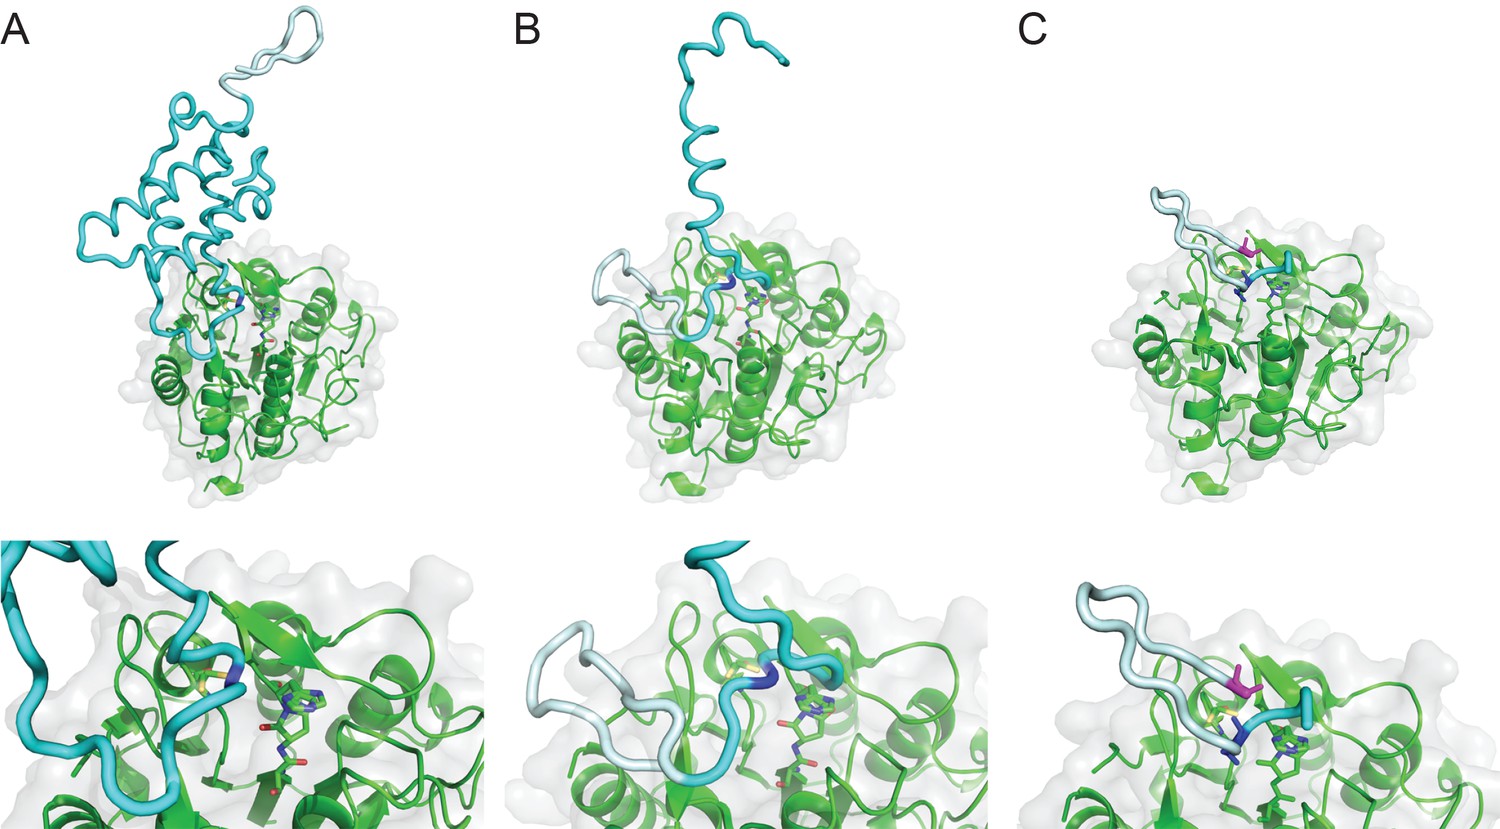
Model of SFTI-1 processing from PawS1.
Model aligned on framework of tetrahedral intermediate in the active site and where the substrate should orient through the S1-S5 pocket, between the β5-β6 and βIV:βV loops, using a PawS1 NMR structure (PDB 5U87). HaAEP1 modeled PawS1 cleavage at Asn49 (A), Asn18 (B) and Asp14 (C) with expanded views of active site shown below. HaAEP1 green, SFTI-1 precursor light cyan, Preproalbumin cyan. Cleavage residues highlighted with dark blue sticks. N-terminal Gly, shown as magenta sticks, acts as nucleophile to attack C-terminus of SFTI-GLDN (C).
Figure 4—figure supplement 3
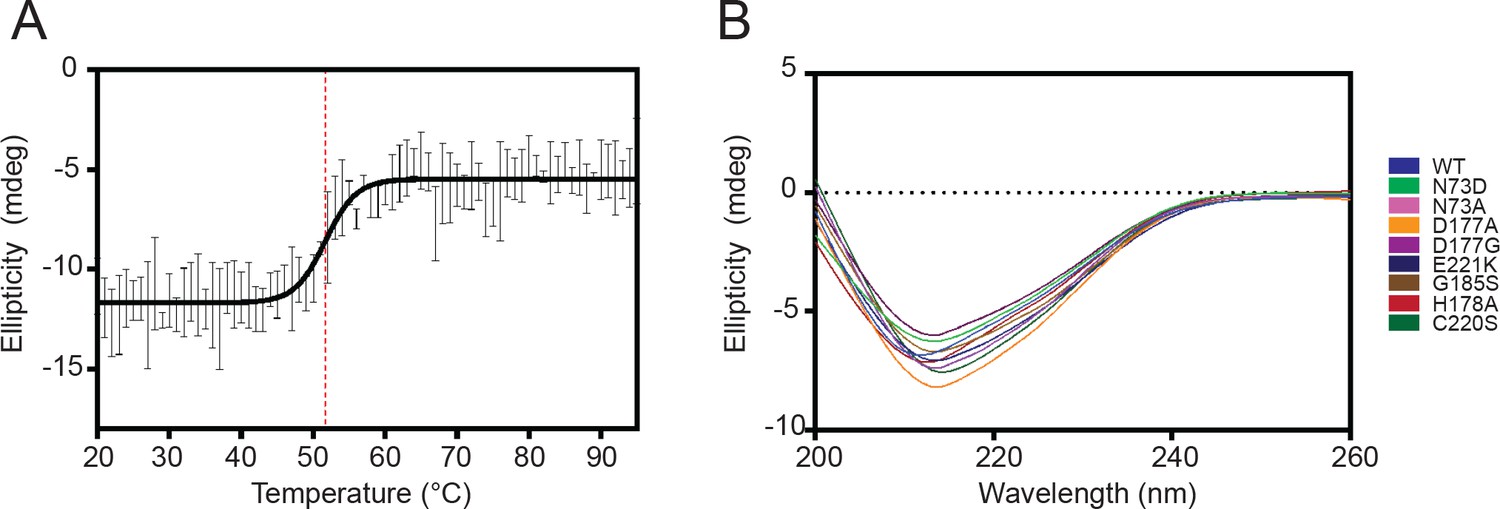
Circular dichroism analysis of HaAEP1 secondary structure.
(A) Melt curve of pro-AEP (pH 8) HaAEP1 measured at 222 nm, [0.2 mg/mL], shows a melting temperature of ~52°C. n = 3 technical replicates data fitted with sigmoidal four parameter logistic regression fit. (B) Circular dichroism spectroscopy of pro-AEP (pH 8) WT HaAEP1 and active site mutants, [0.1 mg/mL], average of n = 2 technical replicates.
Figure 4—figure supplement 4

Re-ligation of cap domain at pH 8 favored after activation at pH 6.5.
In-gel fluorescence of activity based probe (right) and post-fluorescence Coomassie stain of SDS-PAGE gel (left) of WT HaAEP1, N73A, E221K and D177G mutants. Activity based probe illustrates presence of active HaAEPs after dialysis at pH 4/5.5/6.5. Coomassie staining of gels reveals that upon pH shift to pH 8 re-ligation of the cap domain is favored post-dialysis at pH 6.5, with strong pro-AEP bands also seen post-dialysis at pH 5.5 with N73A and D177G mutants.
Figure 5 with 1 supplement
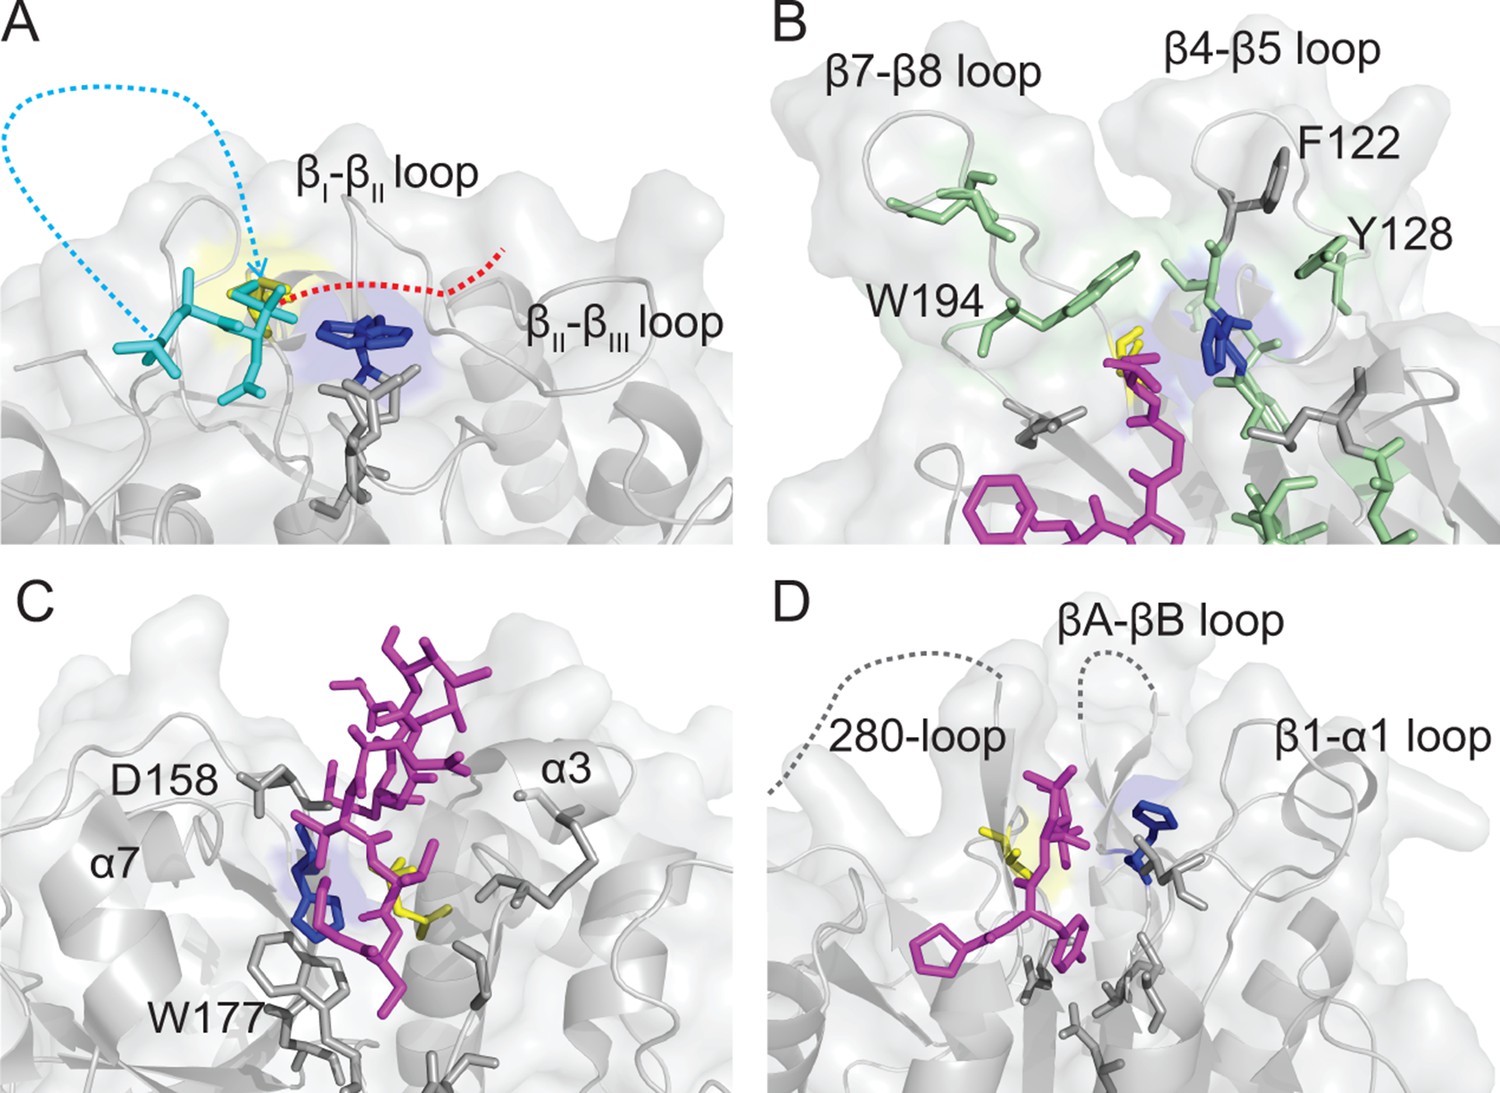
Comparison of Cys protease active site topologies.
Substrates are oriented towards the catalytic dyad of Cys and His, highlighted in yellow and blue sticks, respectively. Regions and residues likely to impart steric hindrance on the proposed mode of macrocyclization by AEPs in other Cys proteases are labeled. (A) Proposed binding mode for SFTI-1 macrocyclization (cyan sticks and dots) based on the position of the tetrahedral intermediate in the HaAEP1 structure with the N-terminus attacking the intermediate and the GLDN-tail (red-dots) oriented over the catalytic His towards the βII-βIII region. (B) Structure of sortase A (PDB 2KID) covalently bound to an analog of the sorting signal (purple sticks). Residues implicated in transpeptidation are highlighted with green sticks, in a region analogous to the β5-βIV loop and βI-βII loop of HaAEP1. (C) Structure of papain (PDB 3IMA) bound to residues 2–7 and 49–53 of tarocystatin (purple sticks) illustrating restricted access to the catalytic dyad. (D) Structure of the metacaspase MCA2C213A (PDB 4AFV) with residues 30–33 of the N-terminal domain (purple sticks) bound in the predicted direction for substrate binding. Flexible regions of low electron density are shown with gray dots. Also see Figure 5—figure supplement 1.
Figure 5—figure supplement 1
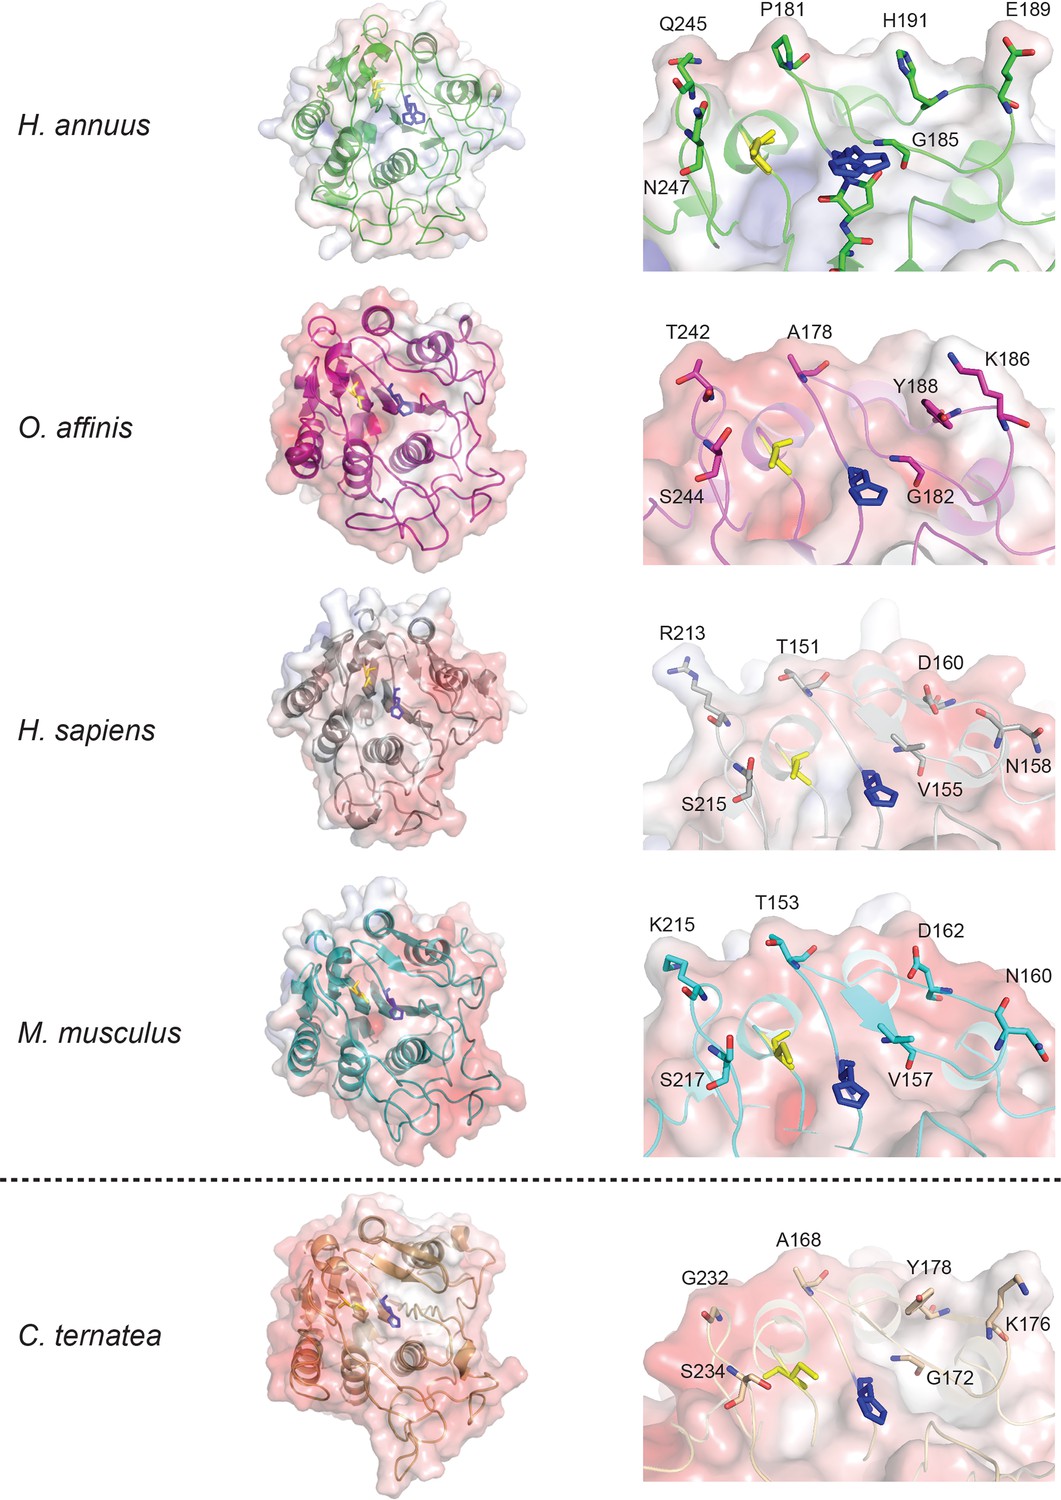
Comparison of crystal structures of AEPs and a model of an efficient macrocyclizing AEP.
Crystal structures of AEPs with APBS generated electrostatic potential maps contoured at ±10 kT/e and catalytic Cys and His shown in yellow and blue sticks, respectively. Overall topology of AEPs (left) appear similar with slight differences in surface electrostatic potential. Expanded views of catalytic region (βI sheet, β5-βIV loop and βI-βIII region) orientated over the catalytic His residue (right) illustrates variation around the active site, with residues that are proposed to alter substrate specificity shown with sticks. A model of an efficient macrocyclizer, C. ensiformis AEP (accession code: AIB06797), built on the HaAEP1 structure which displays 76.3% amino acid identity, is shown below the dotted line. C. ensiformis AEP appears to exhibit a more accessible active site, in comparison to other AEP structures, due to the presence of several short side-chain amino acids.
Figure 6

The ability to macrocyclize is inherent to AEPs.
MALDI-TOF spectra of SFTI-GLDN (A) and SFTI(D14N)-GLDN (B) with AEPs from species thought not to contain cyclic peptides, namely Arabidopsis thaliana (AtAEP2) and Ricinus communis (RcAEP1). (C) Quantitation of peak areas from seleno-Cys modified substrates in A) (mass 1609 - cyclic SFTI-1, mass 1627 - acyclic-SFTI and mass 2026 - unprocessed SFTI-GLDN substrate) and B) (mass 1608 - cyclic SFTI(D14N), mass 1626 - acyclic-SFTI(D14N) and mass 2025 - unprocessed seleno-Cys modified SFTI(D14N)-GLDN substrate) normalized to mass 1515 - native SFTI-1. Black – cyclic peptide, gray – acyclic peptide and white – unprocessed substrate. Error bars illustrate standard deviation n = 3 technical replicates. (D) SDS-PAGE analysis of inactive (pH 8) and active (pH 6.5) AtAEP2 and RcAEP1 proteins.
Tables
Table 1
Crystallography data collection and refinement statistics.
Numbers in parenthesis refer to the highest resolution bin.
| Data collection | |
| Space group | P31 2 1 |
| Unit cell dimensions | |
| a, b, c (Å) | 77.03, 77.03, 108.17 |
| α, β, γ (°) | 90.00, 90.00, 120.00 |
| Wavelength | 0.9537 |
| Resolution (Å) | 1.8 |
| Rmerge (%) | 6.0 (43.3) |
| I/σI | 14.7 (2.2) |
| Completeness (%) | 93.8 (65.1) |
| Redundancy | 4.1 (1.8) |
| CC 1/2 | 0.997 (0.727) |
| Refinement | |
| Resolution (Å) | 66.71–1.80 |
| No. reflections | 31205 |
| Rwork/Rfree | 15.15/18.88 |
| No. Atoms | 2415 |
| Protein | 2168 |
| Water | 229 |
| Ligand | 18 |
| Wilson B (Å2) | 15.7 |
| Average refined B-factor (Å2) | |
| Protein only (Å2) | 22.2 |
| Water (Å2) | 35.0 |
| Ligand (Å2) | 41.1 |
| r.m.s. deviations: | |
| Bond lengths (Å) | 0.018 |
| Bond angles (°) | 1.84 |
| Ramachandran analysis | |
| Favored (%) | 98.84 |
| Allowed (%) | 1.16 |
| Outliers (%) | 0 |
Additional files
-
Transparent reporting form
- https://doi.org/10.7554/eLife.32955.020
Download links
A two-part list of links to download the article, or parts of the article, in various formats.
Downloads (link to download the article as PDF)
Open citations (links to open the citations from this article in various online reference manager services)
Cite this article (links to download the citations from this article in formats compatible with various reference manager tools)
Structural basis of ribosomal peptide macrocyclization in plants
eLife 7:e32955.
https://doi.org/10.7554/eLife.32955


