Distinct contributions of functional and deep neural network features to representational similarity of scenes in human brain and behavior
- National Institutes of Health, United States
- New York University, United States
- Bates College, United States
- Princeton University, United States
- Stanford University, United States
- University of Illinois, United States
Figures
Figure 1

Models and predicted stimulus dissimilarity.
(A) Stimuli were characterized in three different ways: functions (derived using human-generated action labels), objects (derived using human-generated object labels) and DNN features (derived using layer 7 of a 1000-class trained convolutional neural network). (B) RDMs showing predicted representational dissimilarity in terms of functions, objects and DNN features for the 30 scene categories sampled from Greene et al. (2016). Scenes were sampled to achieve minimal between-RDM correlations. The category order in the RDMs is determined based on a k-means clustering on the functional RDM; clustering was performed by requesting eight clusters, which explained 80% of the variance in that RDM. RDMs were rank-ordered for visualization purposes only. (C) Multi-dimensional scaling plots of the model RDMs, color-coded based on the functional clusters depicted in B). Functional model clusters reflected functions such as ‘sports’, and ‘transportation’; note however that these semantic labels were derived post-hoc after clustering, and did not affect stimulus selection. Critically, representational dissimilarity based on the two other models (objects and DNN features) predicted different cluster patterns. All stimuli and model RDMs, along with the behavioral and fMRI measurements, are provided in Figure 1—source data 1.
-
Figure 1—source data 1
- https://doi.org/10.7554/eLife.32962.003
Figure 2
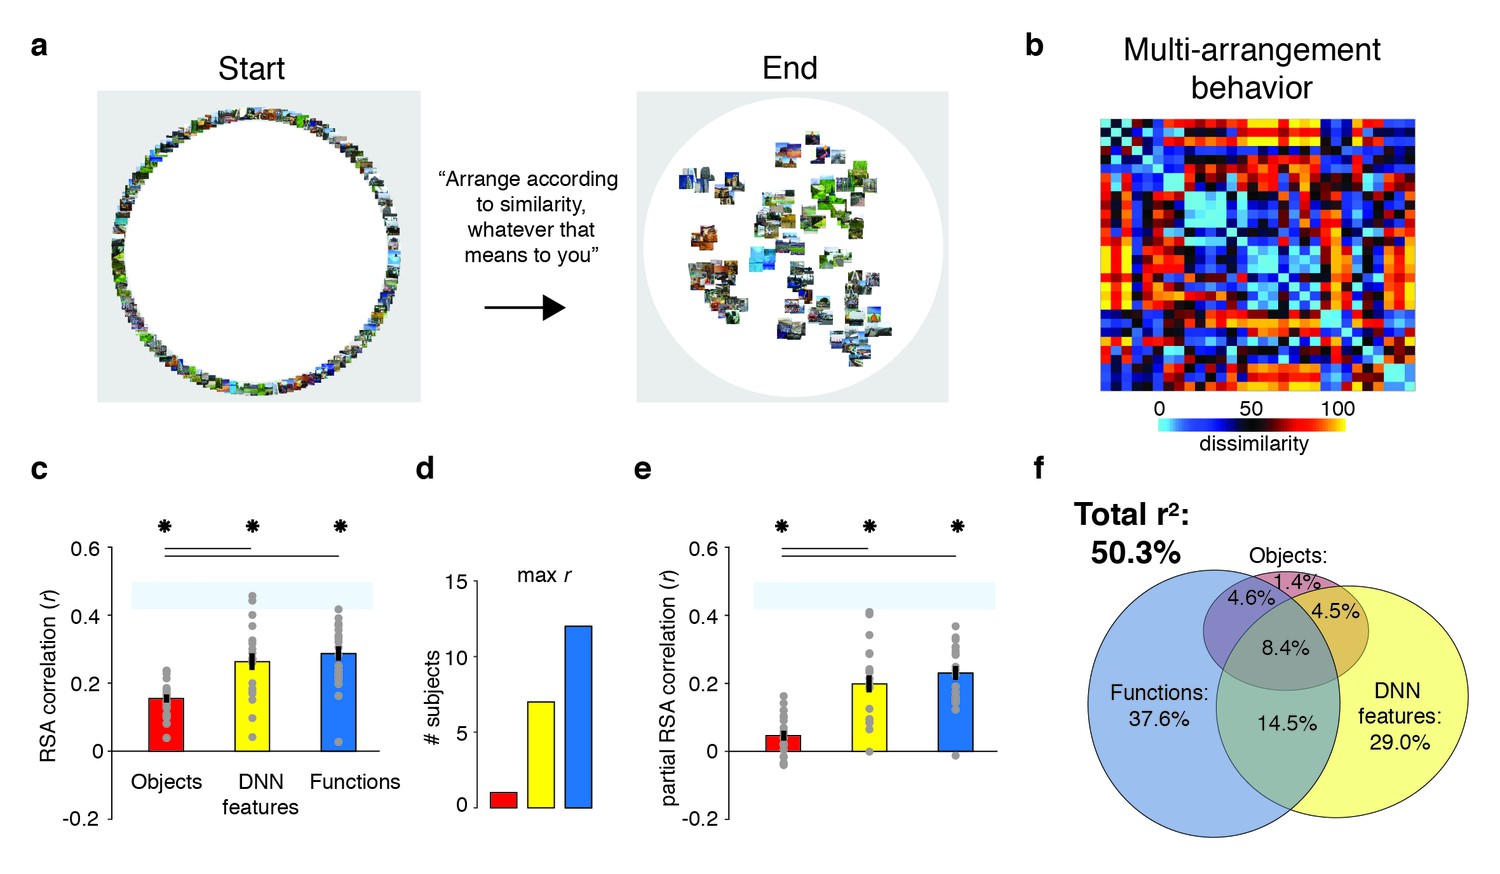
Behavioral multi-arrangement paradigm and results.
(A) Participants organized the scenes inside a large white circle according to their perceived similarity as determined by their own judgment, without receiving instructions as to what information to use to determine scene similarity. (B) RDM displaying the average dissimilarity between categories in the behavioral arrangements, ordered the same way as Figure 1B (rank-ordered for visualization only). (C) Average (bar) and individual participant (gray dots) correlations between the behavioral RDM and the model RDMs for objects (red), DNN features (yellow) and functions (blue). Stars (*) indicate p<0.05 for model-specific one-sided signed-rank tests against zero, while horizontal bars indicate p<0.05 for two-sided pairwise signed-rank tests between models; p-values were FDR-corrected across both types of comparisons. The light-blue shaded rectangular region reflects the upper and lower bound of the noise ceiling, indicating RDM similarity between individual participants and the group average (see Materials and methods). Error bars reflect SEM across participants. (D) Count of participants whose behavioral RDM correlated highest with either objects, DNN features or functions. (E) Partial correlations for each model RDM. Statistical significance was determined the same way as in C). (F) Euler diagram depicting the results of a variance partitioning analysis on the behavioral RDM for objects (red circle), DNN features (yellow circle) and functions (blue circle). Unique (non-overlapping diagram portions) and shared (overlapping diagram portions) variances are expressed as percentages of the total variance explained by all models combined.
Figure 3
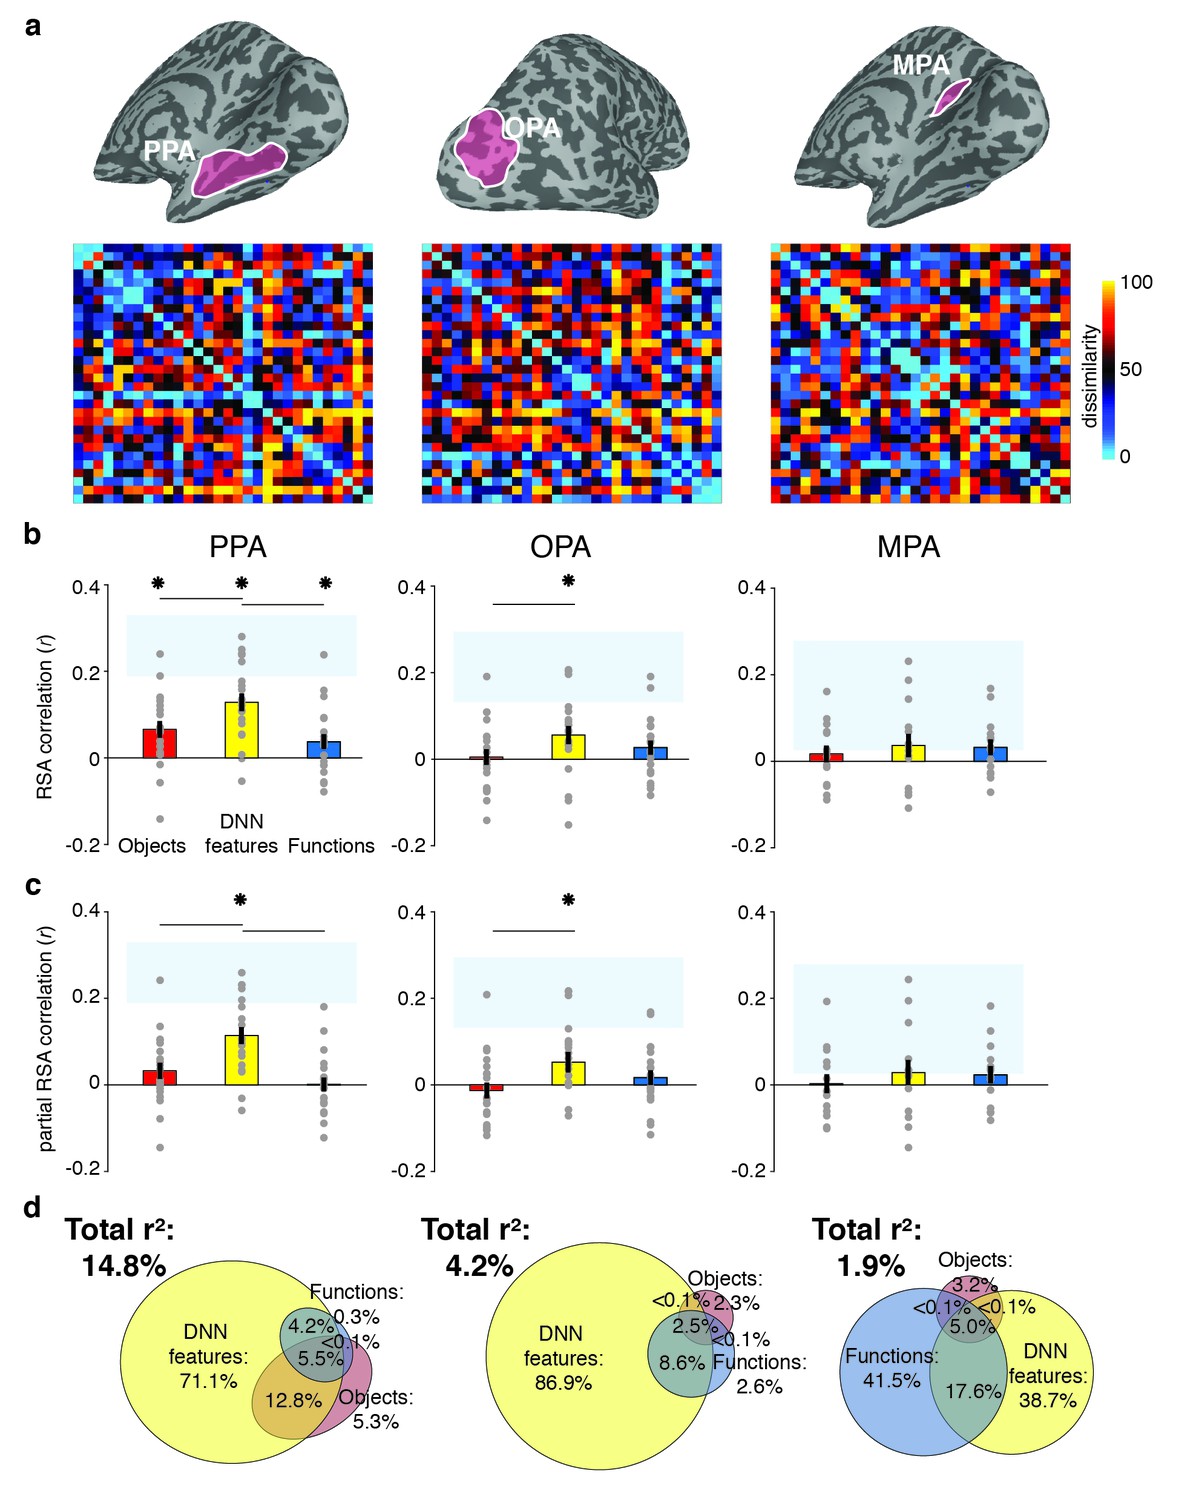
RDMs and model comparisons for fMRI Experiment 1 (n = 20).
(A) RDMs displaying average dissimilarity between categories in multi-voxel patterns in PPA, OPA and MPA, ordered as in Figure 1B (rank-ordered for visualization only). (B) Average (bar) and individual participant (gray dots) correlations between the ROIs in A) and the model RDMs for objects (red), DNN features (yellow) and functions (blue) (FDR-corrected). See legend of Figure 2B for explanation of the statistical indicators and noise ceiling. (C) Partial correlations for each model RDM. Statistics are the same as in B). (D) Euler diagram depicting results of variance partitioning the average dissimilarity in each ROI between models, expressed as percentages of unique and shared variance of the variance explained by all three models together.
Figure 4
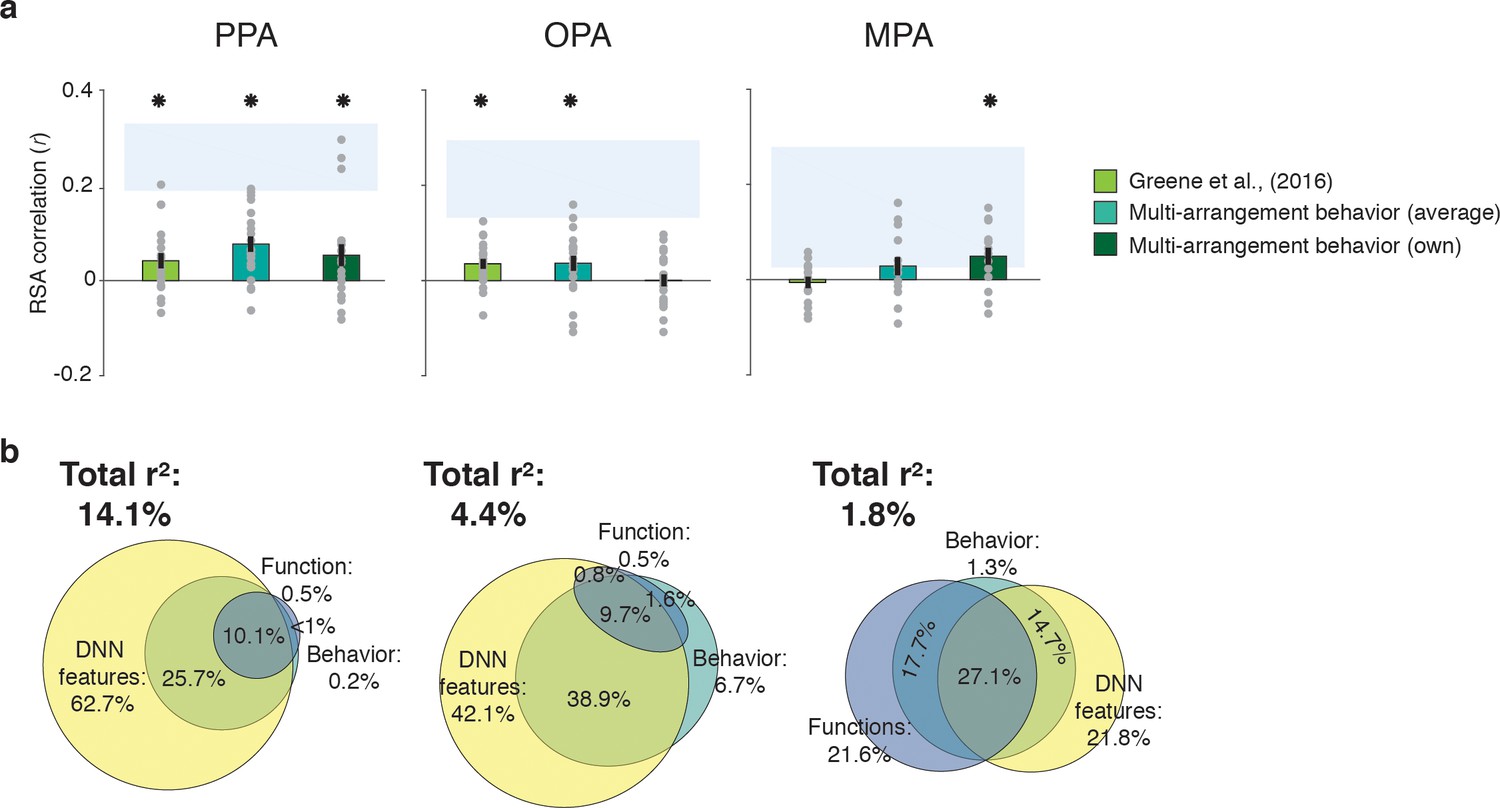
Correlations and variance partitioning of behavioral measurements of scene categorization and similarity of fMRI responses.
(A) Correlations of three measures of behavioral categorization (see Results section for details) with fMRI response patterns in PPA, OPA and MPA. See legend of Figure 2B for explanation of the statistical indicators and noise ceiling. (B) Euler diagram depicting the results of variance partitioning the fMRI responses in PPA, OPA and MPA for DNN features (yellow), functions (blue) and average sorting behavior (green), indicating that the majority of the variance in the fMRI signal that is explained by categorization behavior is shared with the DNN features.
Figure 5
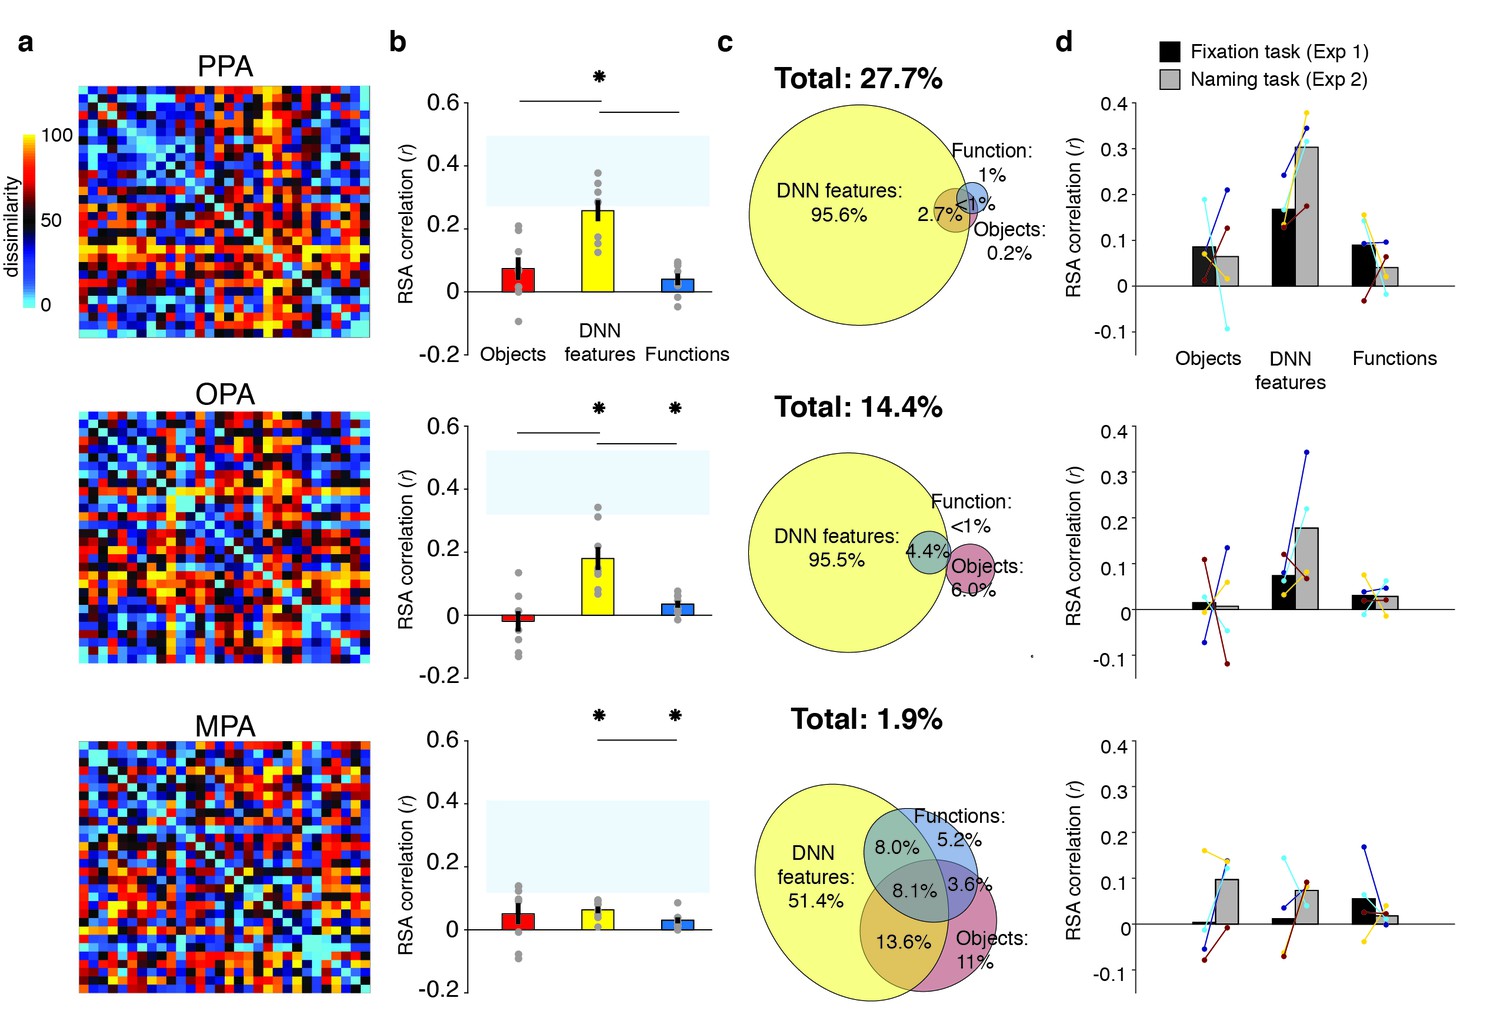
RDMs and model comparisons for Experiment 2 (n = 8, covert naming task).
(A) Average dissimilarity between categories in multi-voxel patterns measured in PPA, OPA and MPA (rank-ordered as in Figure 1B). (B) Correlations between the ROIs in A) and the model RDMs for objects (red), DNN features (yellow) and functions (blue) (FDR-corrected). See legend of Figure 2B for explanation of the statistical indicators and noise ceiling. Note how in PPA, the DNN model correlation approaches the noise ceiling, suggesting that this model adequately captures the information reflected in this ROI. (C) Euler diagram depicting the results of variance partitioning the average dissimilarity in each ROI. (D) Average (bars) and individual (dots/lines) within-participant (n = 4) comparison of fMRI-model correlations across the different task manipulations in Experiment 1 and 2 (participants were presented with a different set of scenes in each task, see Materials and methods). Note how covert naming mainly enhances the correlation with DNN features.
Figure 6
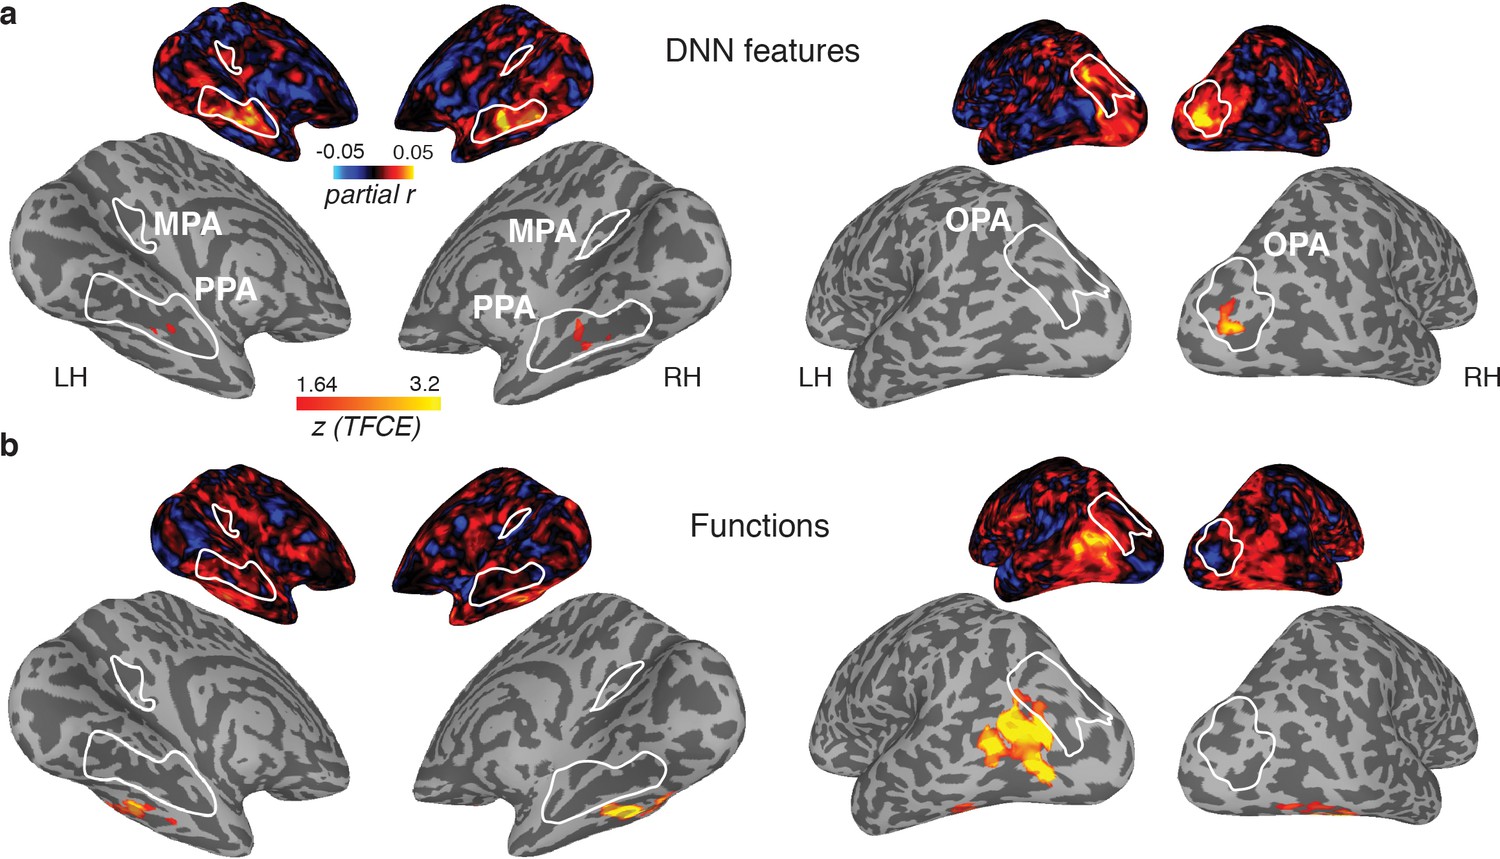
Medial (left) and lateral (right) views of group-level searchlights for (A) the DNN and (B) function model, overlaid on surface reconstructions of both hemispheres of one participant.
Each map was created by submitting the partial correlation maps for each model and hemisphere to one-sample tests against a mean of zero, cluster-corrected for multiple comparisons using Threshold-Free Cluster Enhancement (thresholded on z = 1.64, corresponding to one-sided p<0.05). Unthresholded versions of the average partial correlation maps are inset above. Group-level ROIs PPA, OPA and MPA are highlighted in solid white lines. Consistent with the ROI analyses, the DNN feature model contributed uniquely to representation in PPA and OPA. The function model uniquely correlated with a bilateral ventral region, as well as a left-lateralized region overlapping with the middle temporal and occipital gyri.
Figure 7
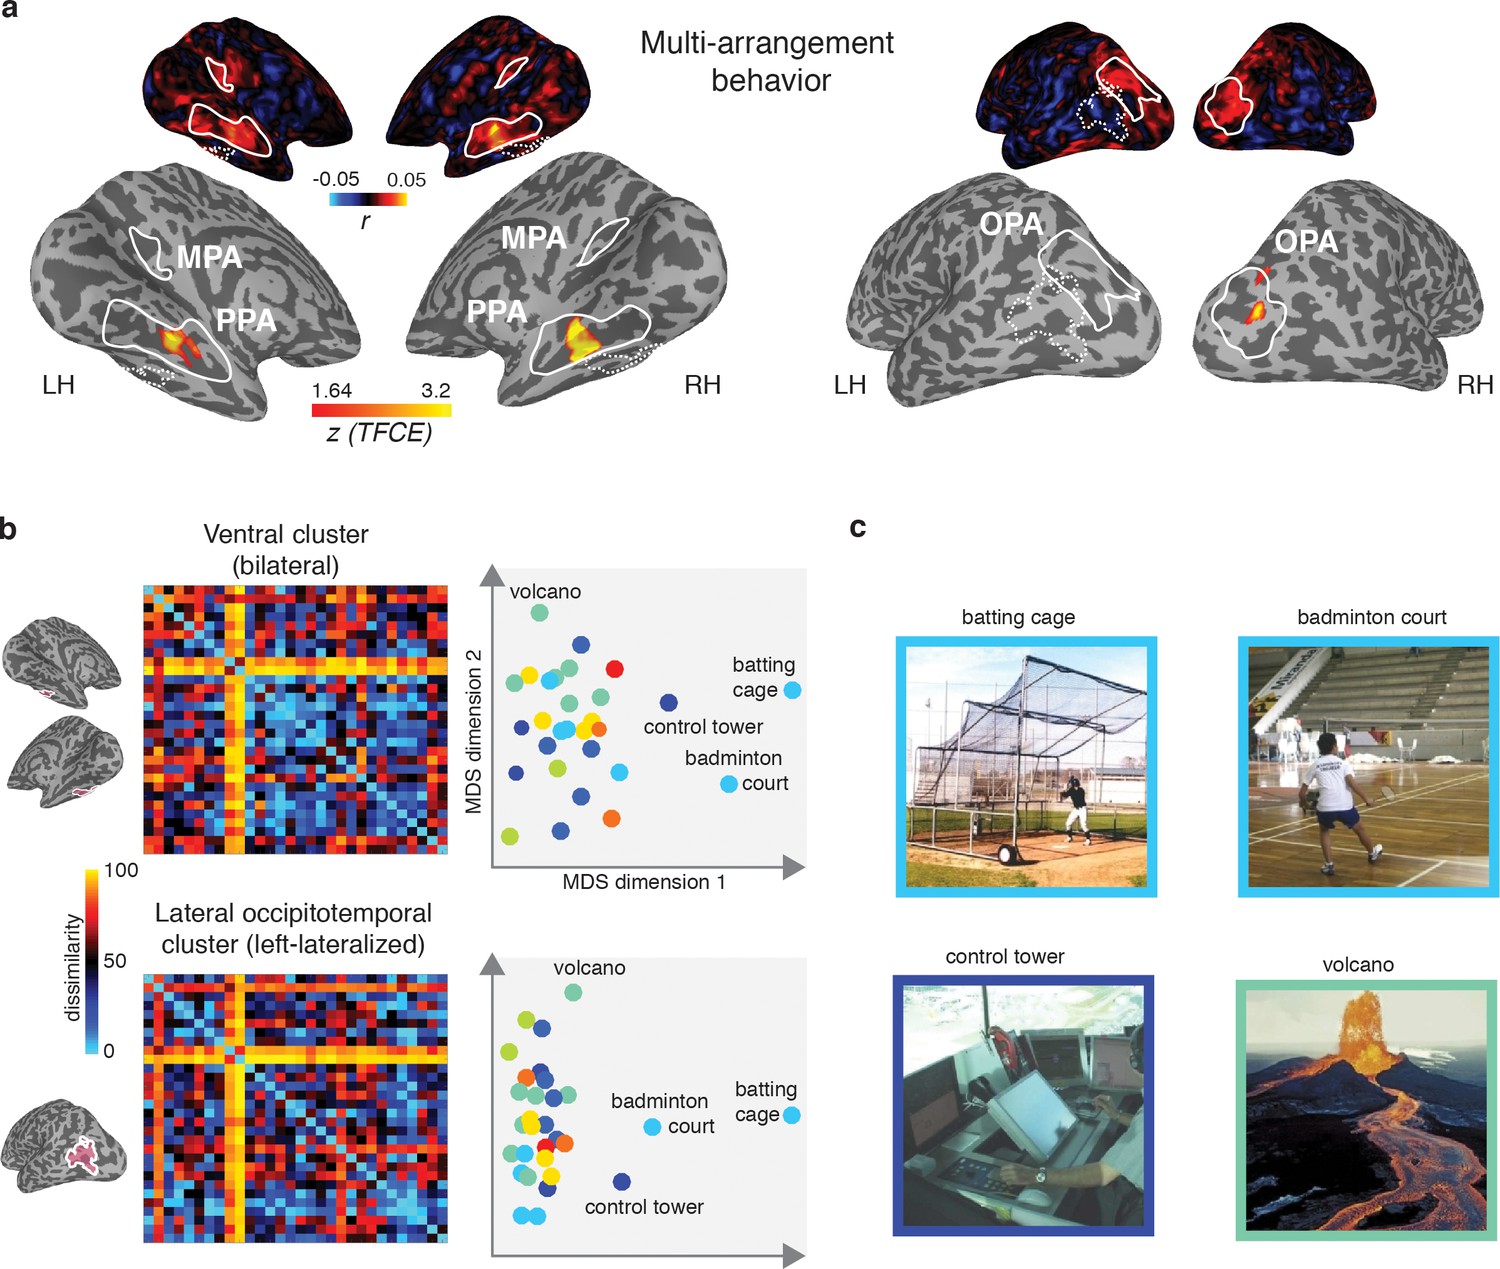
Multi-arrangement behavior searchlights and post-hoc analysis of functional clusters.
(A) Searchlight result for behavioral scene categorization. Maps reflect correlation (Pearson’s r) of the group-average behavior in the multi-arrangement task from the participants of Experiment 1. Scene-selective ROIs are outlined in white solid lines; the searchlight clusters showing a significant contribution of the functional model are outlined in dashed white lines for reference. See Figure 6 for further explanation of the searchlight display. (B) RDM and MDS plots based on the MVPA patterns in the function model searchlight clusters. RDM rows are ordered as in Figure 1B and category color coding in the MDS plots is as in Figure 1C. (C) Illustrative exemplars of the four categories that were most dissimilar from other categories within the searchlight-derived clusters depicted in B.
Figure 8 with 2 supplements
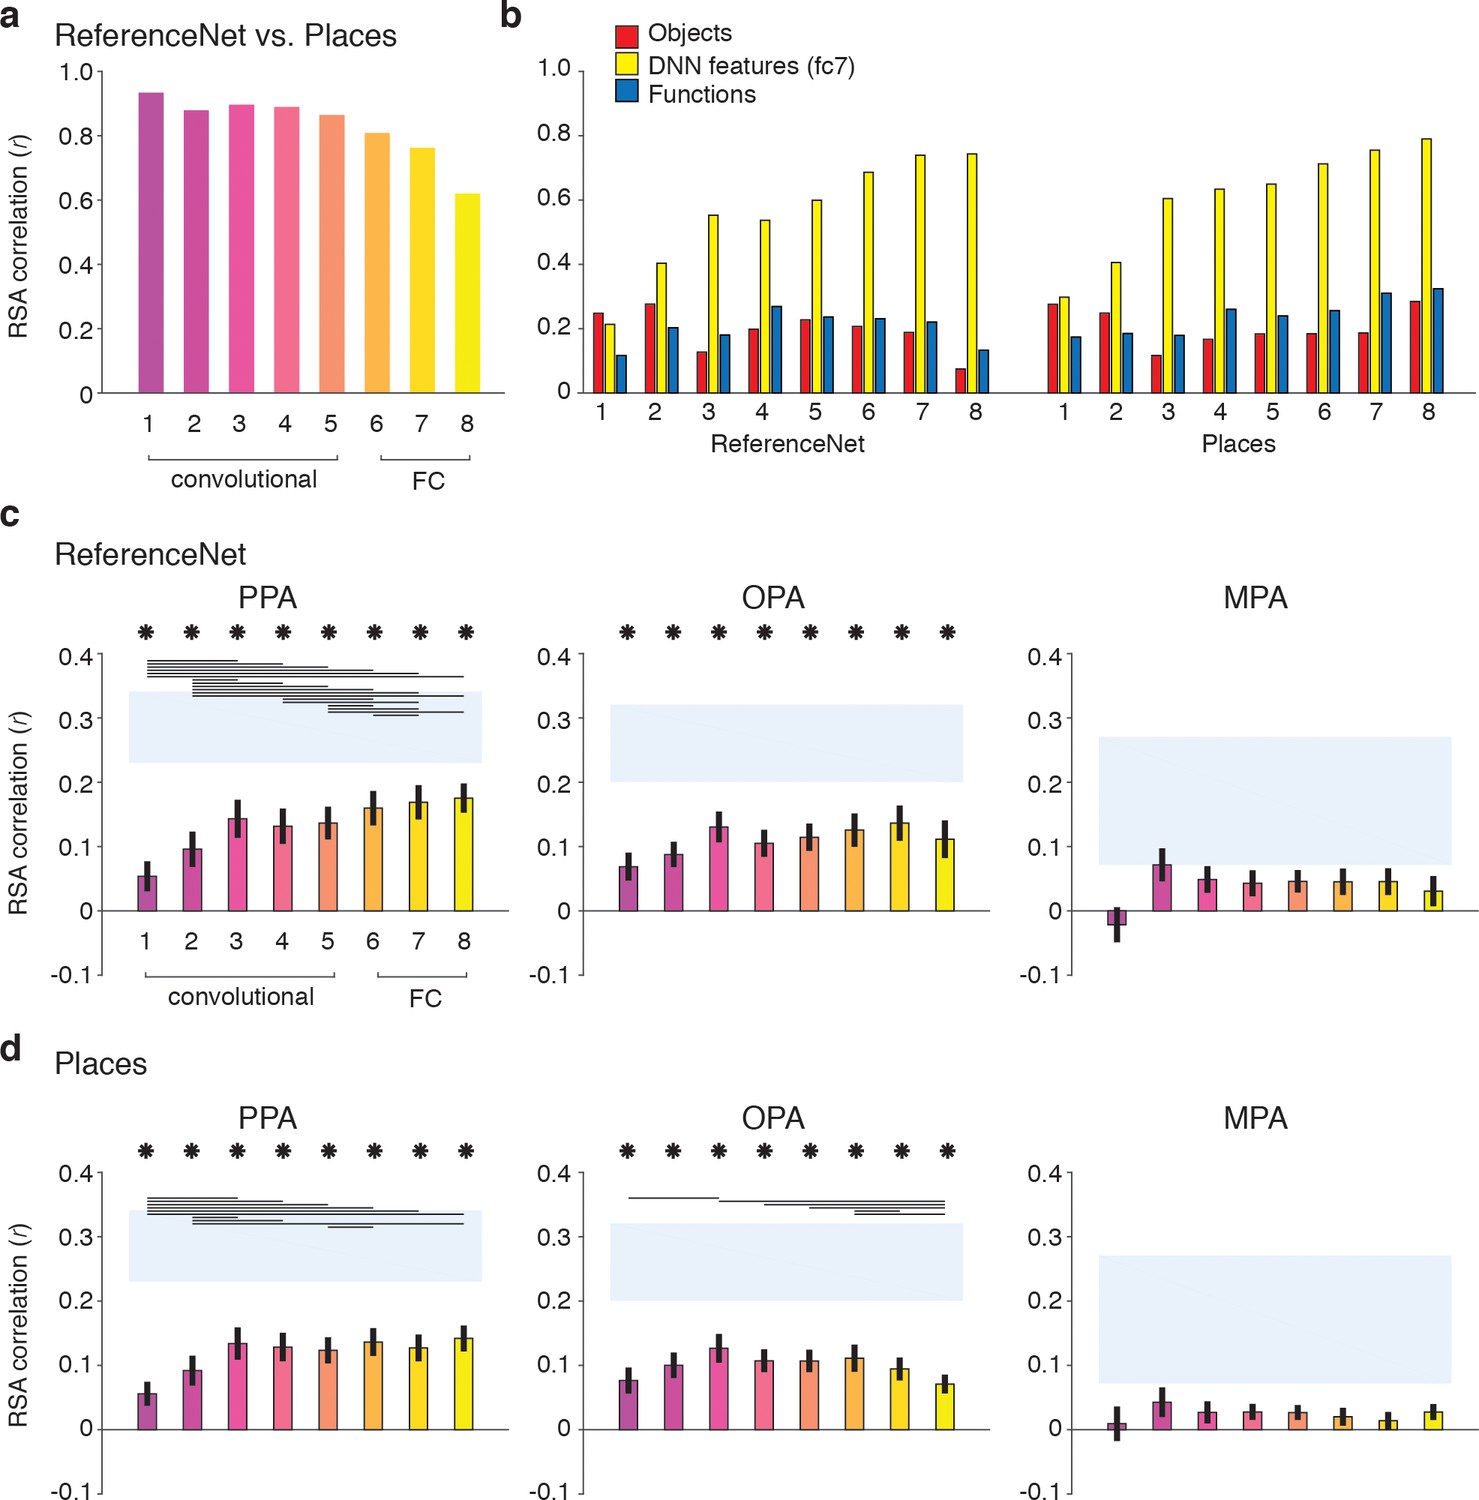
DNN layer and DNN training comparisons in terms of correlation with fMRI responses in scene-selective cortex.
Panels show convolutional and fully-connected (FC) layer-by-layer RDM correlations between (A) an object-trained (ReferenceNet) and a scene-trained (Places) DNN; (B) both DNNs and the a priori selected feature models; (C) the object-trained DNN and scene-selective ROIs; (D) the scene-trained DNN and scene-selective ROIs (all comparisons FDR-corrected within ROI; See legend of Figure 2B for explanation of the statistical indicators and noise ceiling). While the decreasing correlation between DNNs indicates stronger task-specificity of higher DNN layers, the original fc7 DNN feature model correlated most strongly with high-level layers of both DNNs. The object-trained and the scene-trained DNN correlated similarly with PPA and OPA, with both showing remarkable good performance for mid-level layers. The RDMs for each individual DNN layer are provided in Figure 1—source data 1. Searchlight maps for each layer of the object- and scene-trained DNN are provided in Figure 8—video 1 and Figure 8—video 2, respectively.
Figure 8—video 1
Layer-by-layer searchlight results for the object-trained DNN (ReferenceNet).
The first half of the movie shows group-average correlation maps for layer 1–8, cluster-corrected for multiple comparisons using Threshold-Free Cluster Enhancement (thresholded on z = 1.64, corresponding to one-sided p<0.05), overlaid on medial and lateral views of inflated surface reconstructions of the left (LH) and right (RH) hemisphere of one participant. The second half of the movie shows the same data but without thresholding. Group-level ROIs PPA, OPA and MPA are highlighted in solid white lines.
Figure 8—video 2
Layer-by-layer searchlight results for the scene-trained DNN (Places).
See legend of Figure 8—video 1 for details.
Additional files
-
Transparent reporting form
- https://doi.org/10.7554/eLife.32962.013
Download links
A two-part list of links to download the article, or parts of the article, in various formats.
Downloads (link to download the article as PDF)
Open citations (links to open the citations from this article in various online reference manager services)
Cite this article (links to download the citations from this article in formats compatible with various reference manager tools)
Distinct contributions of functional and deep neural network features to representational similarity of scenes in human brain and behavior
eLife 7:e32962.
https://doi.org/10.7554/eLife.32962


