Rem2 stabilizes intrinsic excitability and spontaneous firing in visual circuits
- Brandeis University, United States
Figures
Figure 1
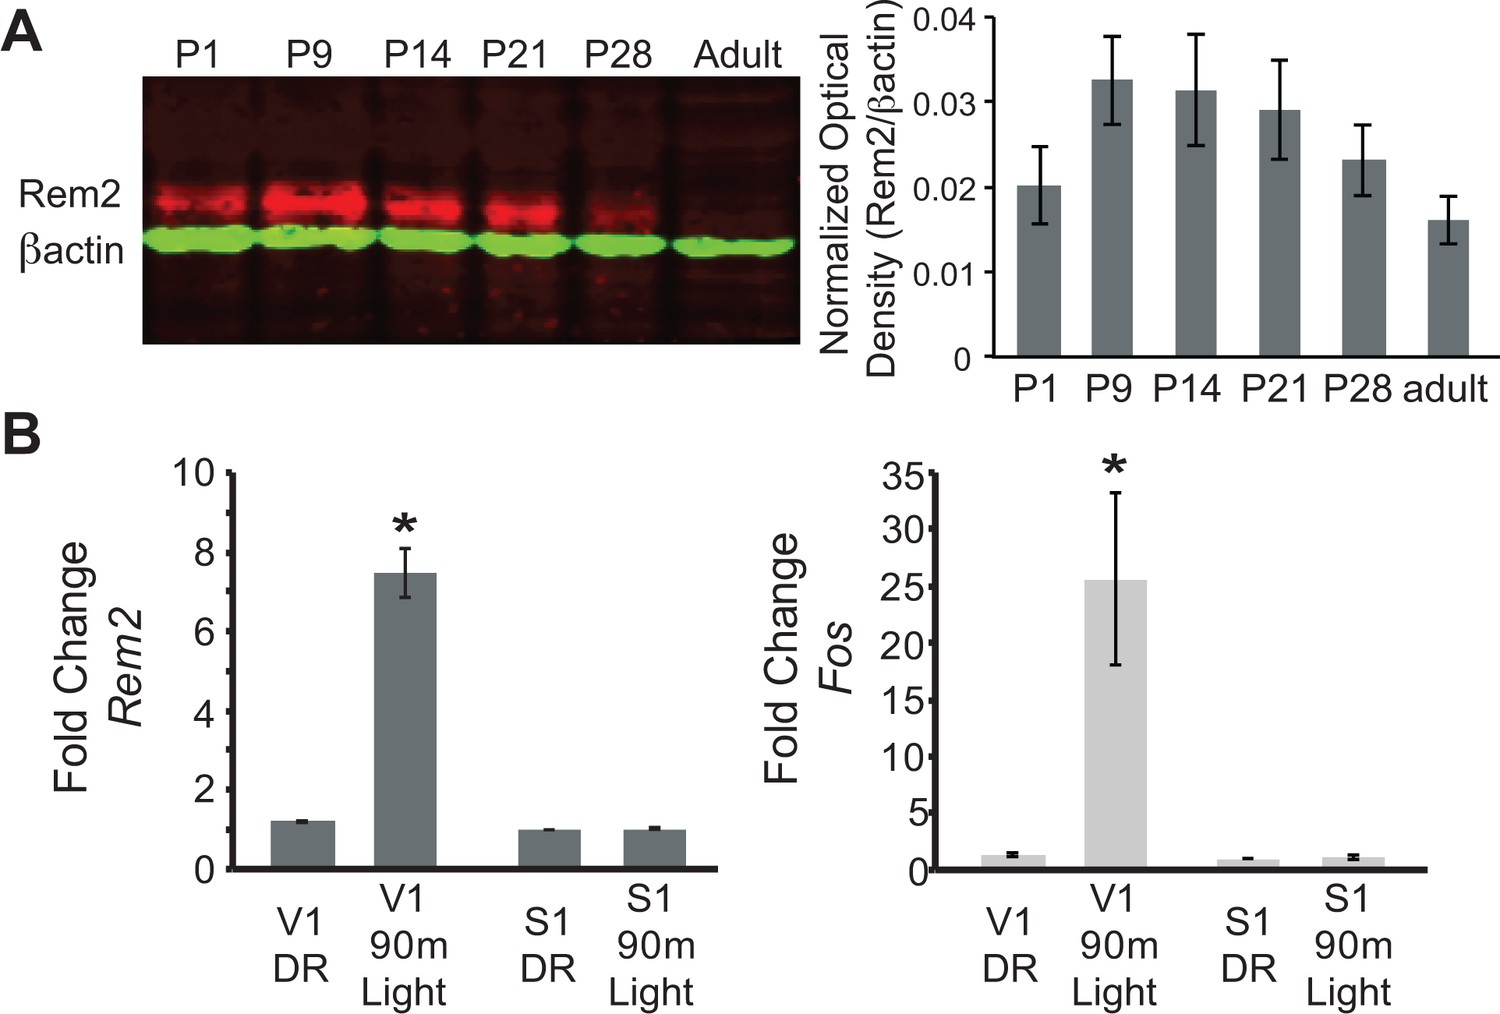
Rem2 expression is developmentally regulated and activity-dependent.
(A) (left) Western Blot of cortical lysate from rat brains at different developmental ages detected using anti-Rem2 (1:500); anti-βactin (1:5000) was used as a loading control. (right) Quantification of relative Rem2 intensity at different developmental ages normalized to anti-βactin. Molecular Weight of REM2: ~50 kDa. Molecular weight of ACTB: 42 kDA. (B) Fold change in Rem2 (left) or Fos mRNA expression (right) in isolated primary visual cortex (V1) or somatosensory cortex (S1) from P28 mice raised in the dark (DR, from P9-P28) or raised in the dark (P9–P28) and exposed to light for 90 m (90 m Light). N = 3 biological replicates of 4 mice in each experiment. mRNA levels were normalized to Actb levels and then to S1 DR condition and presented as mean ± SEM. *p<0.05 from V1 DR by one-way ANOVA followed by a Dunnett’s post hoc test.
Figure 2 with 2 supplements
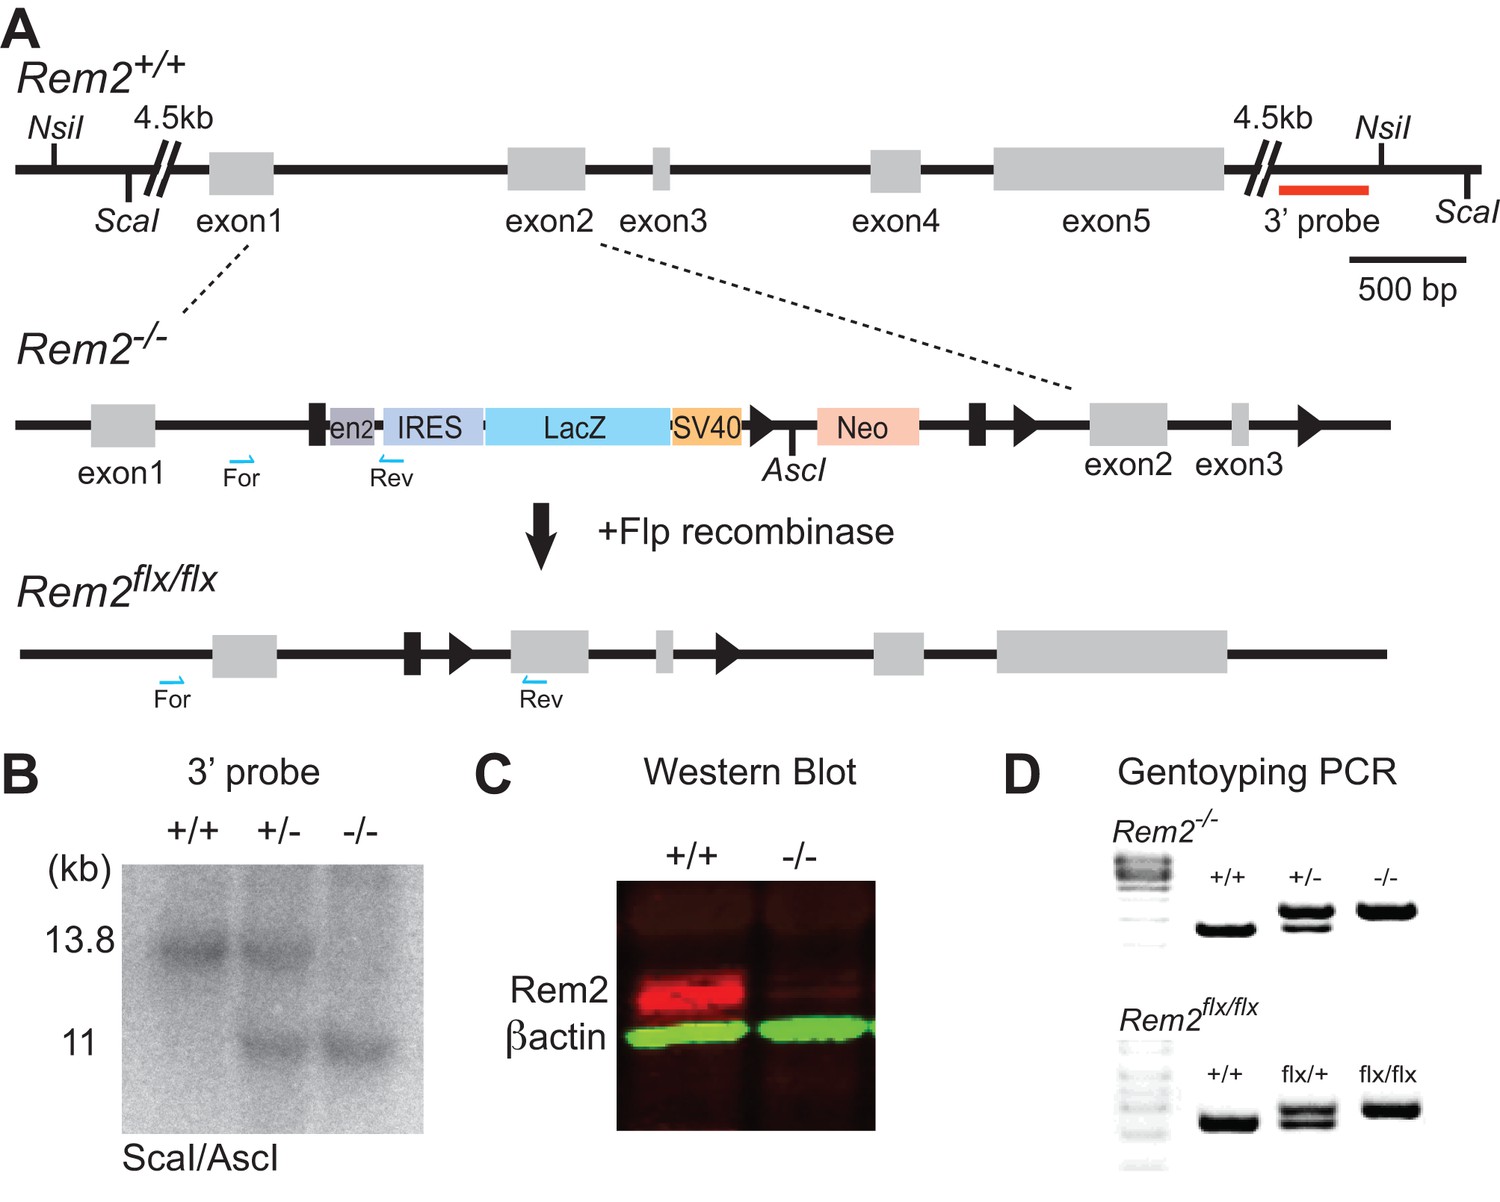
Generation of a Rem2 knockout mouse.
(A) The Rem2 locus (top, Rem2+/+) with exons 1–5 depicted as gray boxes. Homologous recombination was used to insert a 7.5 kb cassette containing a mouse En2 splice acceptor sequences(EN2), IRES, a LacZ gene, a SV40 polyadenylation, and a Neo gene flanked by FRT sites (black rectangles) and LoxP sites flanking exons 2 and 3 (indicated by black triangles). Insertion of this cassette yielded a Rem2 null allele (Rem2-/-). Following germline transmission of the insert allele, the mice were crossed to a mouse expressing Flp recombinase in the germline, which produced a floxed Rem2 allele (termed Rem2flx/flx, bottom). Blue half arrows indicate PCR forward and reverse primer locations. Scale bar, 500 bp. (B) Southern blot analysis of ScaI/AscI-digested genomic DNA from mice that are Rem2 wildtype (+/+), heterozygous (+/-) or homozygous (-/-) using the 3’ probe (red line, top A). Fragments of the predicted size (11 kb) indicate correct targeting. (C) Western blot analysis of Rem2+/+ and Rem2-/- mice confirming the loss of Rem2 expression. Molecular Weight of REM2: 37 kDa. Molecular weight of ACTB: 42 kDA. D) Genotyping PCR products of genomic DNA isolated from tails of mice that were (top) wildtype (Rem2+/+), heterozygous (Rem2+/-) or homozygous (Rem2-/-) or (bottom) wildtype (Rem2+/+), heterozygous (Rem2flx/+) or homozygous (Rem2flx/flx). See Materials and methods for genotyping details.
Figure 2—figure supplement 1
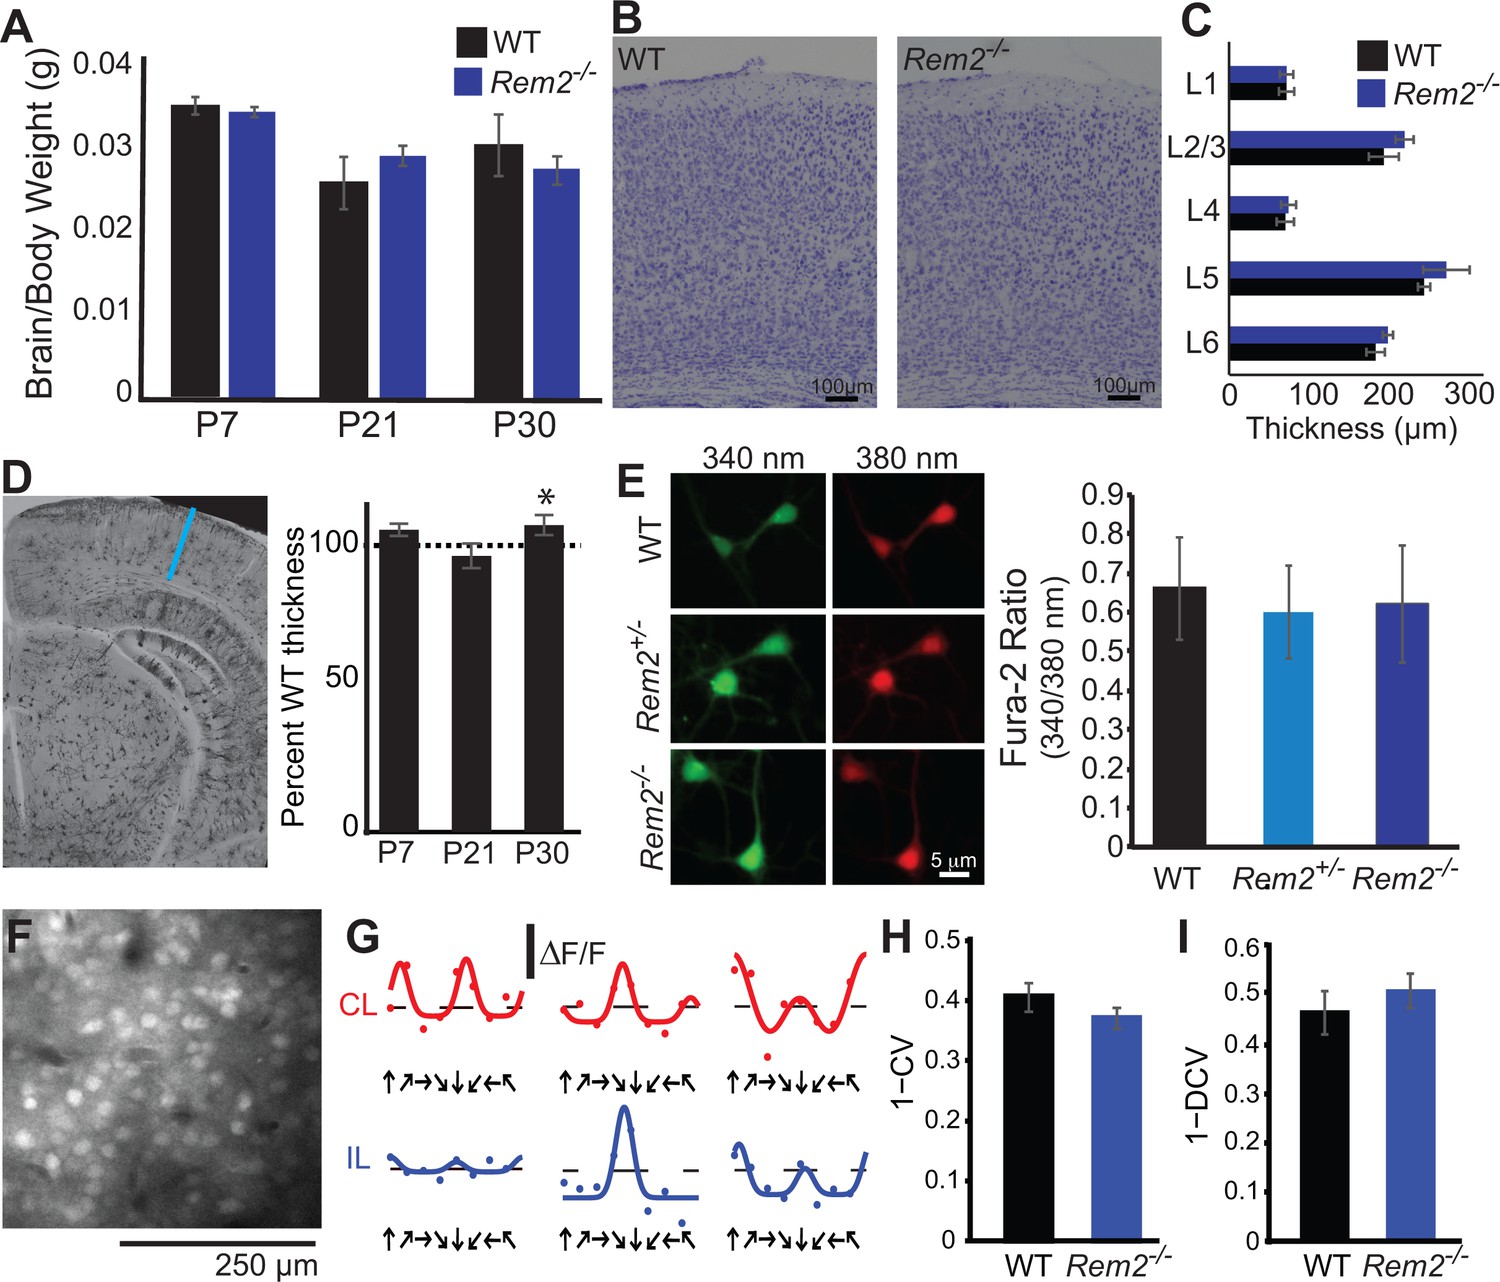
Rem2-/- mice display no gross anatomical or function cortical abnormalities.
(A) Brain/body weight ratio of P7, P21 and P30 WT and Rem2-/- mice. (B) Representative images of WT and Rem2-/- Nissl stained brain slices from P16 mice (30 μm sections, scale bar 100 μm). (C) Cortical layer thickness measured in P16 WT and Rem2-/- mice (N = 3 animals per condition). (D) (Left) Representative image of visual cortex of P21 mouse brain stained with Golgi-Cox labeling. Blue line shows the distance of cortical thickness measured from the deep extent of L6 to the pial surface. (Right) Percent cortical thickness measured in P7 (N = 2 animals per condition), P21 (N = 3 animals per condition), and P30 mice (N = 4 animals per condition). Data is presented as percent thickness of Rem2-/- to WT cortical thickness. *p<0.05 by student’s t-test. (E) (Left) Representative images of Fura-2 calcium acquired at 340 nm (green) and 380 nm (red) in WT, Rem2+/-, or Rem2-/- cultured neurons. (Right) The ratio of Fura-2 signal (340 nm/380 nm) measured in WT, Rem2+/-, or Rem2-/- cultured cortical neurons. (F) Representative imaging field of neurons in mouse binocular visual cortex loaded with the calcium indicator dye Oregon Green BAPTA-1AM. Scale bar, 250 μm. (G) Example responses of 3 cells to visual stimulation (represented as ΔF/F, black vertical bar) of the contralateral (C) eye (top; red lines) and ipsilateral (I) eye (bottom; blue lines) with drifting gratings moving in different directions (black arrows). (H) Orientation selectivity as assessed by circular variance (1-CV) for WT (n = 59 cells, N = 7 animals) and Rem2-/- mice (n = 82 cells; N = 5 animals). (I) Direction selectivity as assessed by circular variance in direction space (1-DCV) for WT and Rem2-/- mice. All data is presented as mean ± SEM.
Figure 2—figure supplement 2

Rem2-/- mice exhibit decreased spine density in vivo.
(A) Representative images of Golgi-cox labeled dendritic spines. Images were taken from terminal branches off the apical tree 50–100 μm from the cell soma of layer 2/3 pyramidal neurons located in primary visual cortex. Scale bar, 10 μm. (B) Spine density measured in wildtype and Rem2-/- mice dark reared from P9-P30 (WT DR, n = 36 neurons; Rem2-/- DR n = 36 neurons) or under normal light rearing conditions (WT LR, n = 29 neurons; Rem2-/- LR, n = 29 neurons). N = 4 animals for WT LR and Rem2-/- LR and N = 5 animals for WT DR and Rem2-/- DR experiments. Data is presented as mean ± SEM. *p<0.05 compared to WT LR by two-way ANOVA followed by Tukey post hoc.
Figure 3
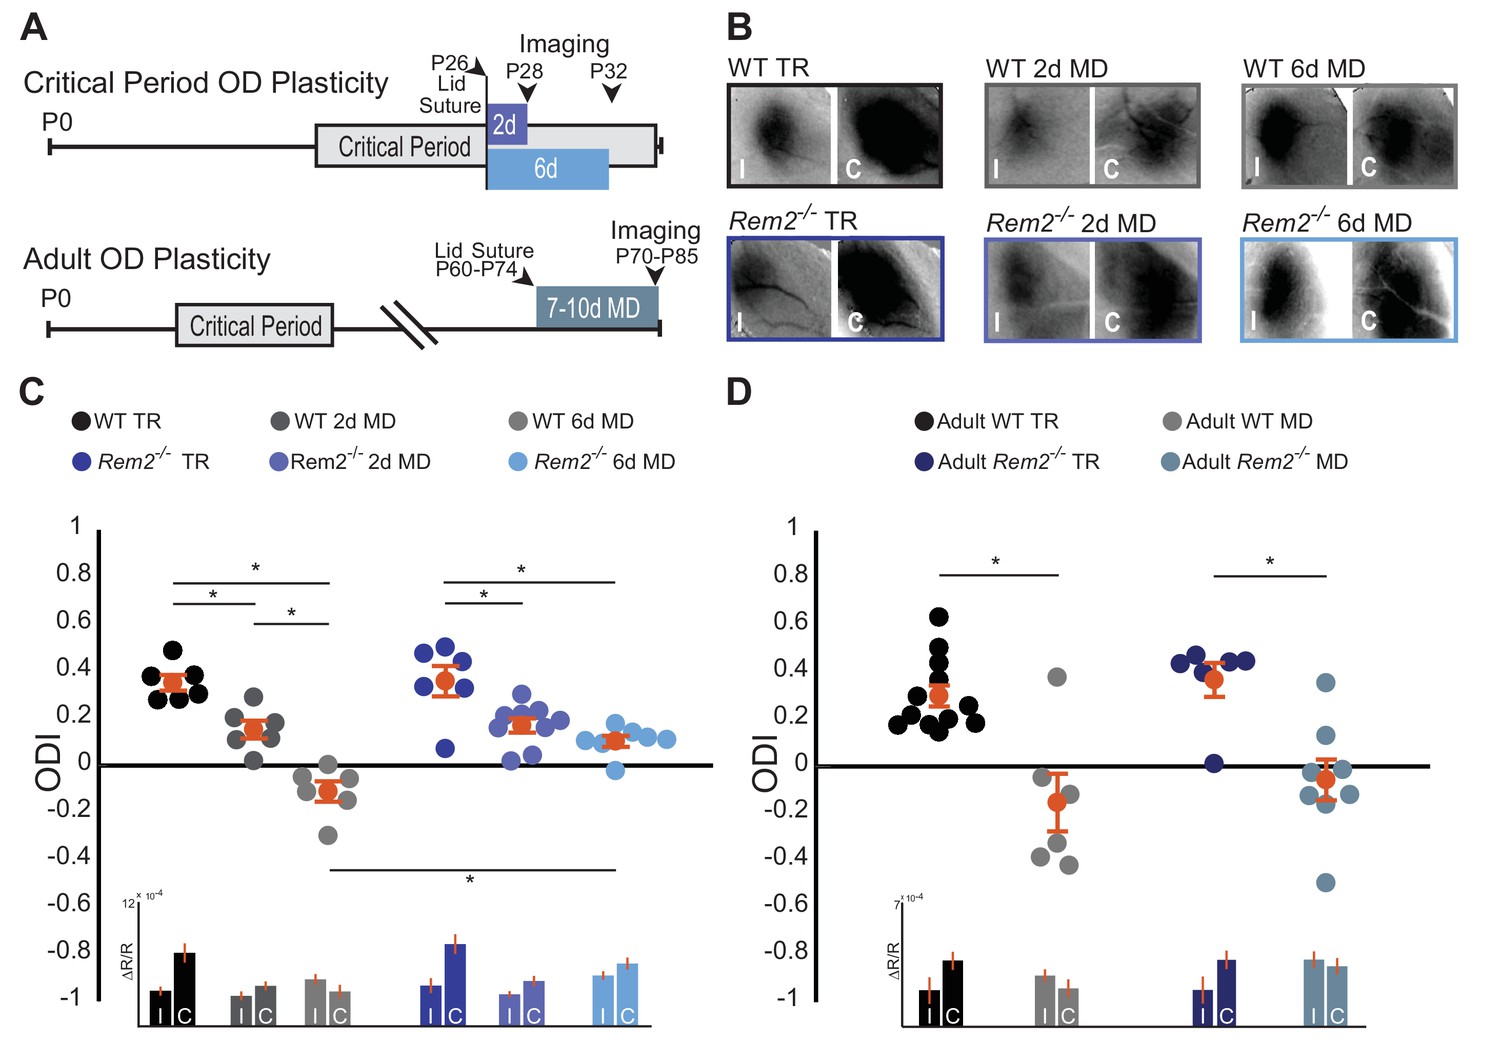
Rem2 is required for late-phase critical period ocular dominance plasticity.
(A) Representative experimental timeline for (top) critical period ocular dominance (OD) plasticity and (bottom) adult OD plasticity. (B) Example fields showing intrinsic signal imaging data from the ipsilateral (I) and contralateral (C) eyes in wildtype or Rem2-/- mice that were (left) typically reared (TR) or monocularly deprived (MD) for 2 days (middle) and 6 days (right). (C) Ocular dominance index (ODI) for WT TR (black, n = 6), WT 2d MD (dark gray, n = 6), WT 6d MD (light gray, n = 6), Rem2-/- TR (blue, n = 6), and Rem2-/- 2d MD (medium blue, n = 9), Rem2-/- 6d MD (light blue, n = 7). Mice are shown as circles for each animal. Orange circles with error bars represent the group averages. Inset at bottom: Changes in reflectance over baseline reflectance (ΔR/R) as measured by ISI driven ipsilateral (I) or contralateral (C) eye for wildtype and Rem2-/- mice that were either typically reared or monocularly deprived. (D) ODI for Adult WT TR (black, n = 12), Adult WT MD (gray, n = 6), Adult Rem2-/- TR (navy blue, n = 6), and Adult Rem2-/- MD (gray blue, n = 8). Inset: ΔR/R for Adult WT and Rem2-/- TR and MD mice. Data is presented as mean ± SEM. *p<0.05 by two-way ANOVA and Tukey post-hoc. Significance comparisons for ΔR/R in C and D insets are listed in Table 1.
Figure 4
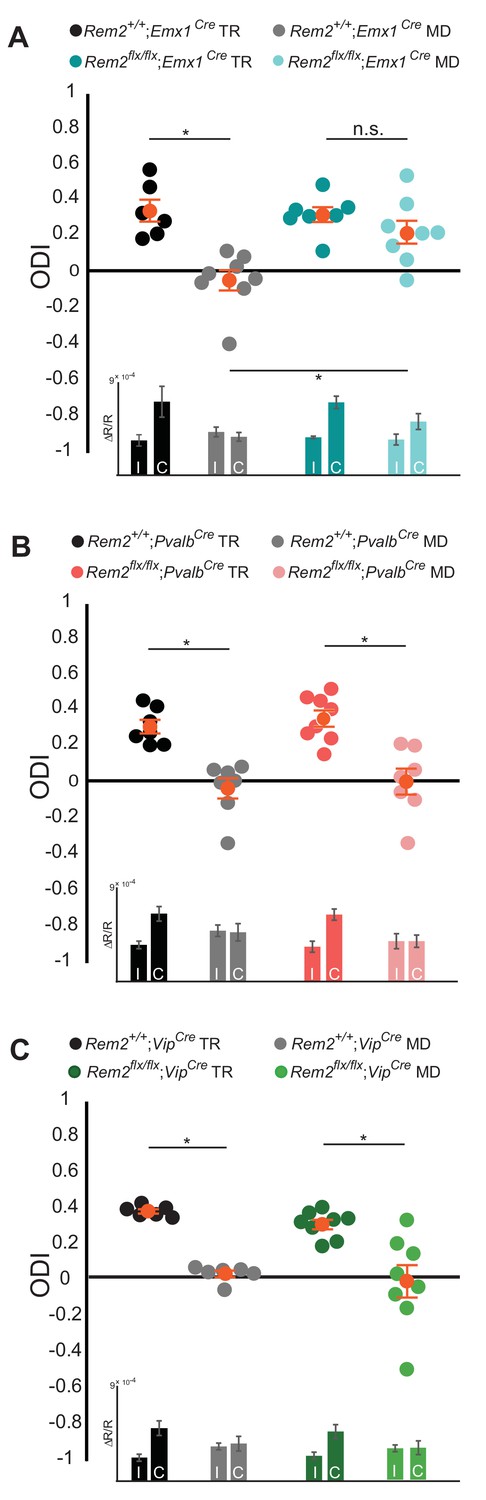
Rem2 is required in cortical excitatory neurons for ocular dominance plasticity.
(A) Ocular dominance index (ODI) for Rem2+/+; Emx1Cre typically reared (TR, black, n = 6), Rem2+/+; Emx1Cre monocularly deprived (MD, gray, n = 8), Rem2-/-; Emx1Cre TR (dark teal, n = 7) or Rem2-/-; Emx1Cre MD (light teal, n = 8). Inset: ΔR/R for Rem2+/+; Emx1Cre and Rem2-/-; Emx1Cre TR and MD mice. (B) ODI for Rem2+/+; PvalbCre TR (black, n = 7), Rem2+/+; PvalbCre MD (gray, n = 7), Rem2-/-; PvalbCre TR (magenta, n = 8) or Rem2-/-; PvalbCre MD (light pink, n = 7). Inset: ΔR/R for Rem2+/+; PvalbCre and Rem2-/-; PvalbCre TR and MD mice. (C) ODI for Rem2+/+; VipCre TR (black, n = 6), Rem2+/+; VipCre MD (gray, n = 6), Rem2-/-; VipCre TR (green, n = 8) or Rem2-/-; PvalbCre MD (light green, n = 8). Inset: ΔR/R for Rem2+/+; VipCre and Rem2-/-; VipCre TR and MD mice. Each animal is depicted as an individual circle. Orange circles with error bars represent the averages for each group ± SEM. Data is presented as mean ± SEM. *p<0.05 by two-way ANOVA with Tukey post-hoc. Significance comparisons for ΔR/R in C and D insets are listed in Table 1.
Figure 5
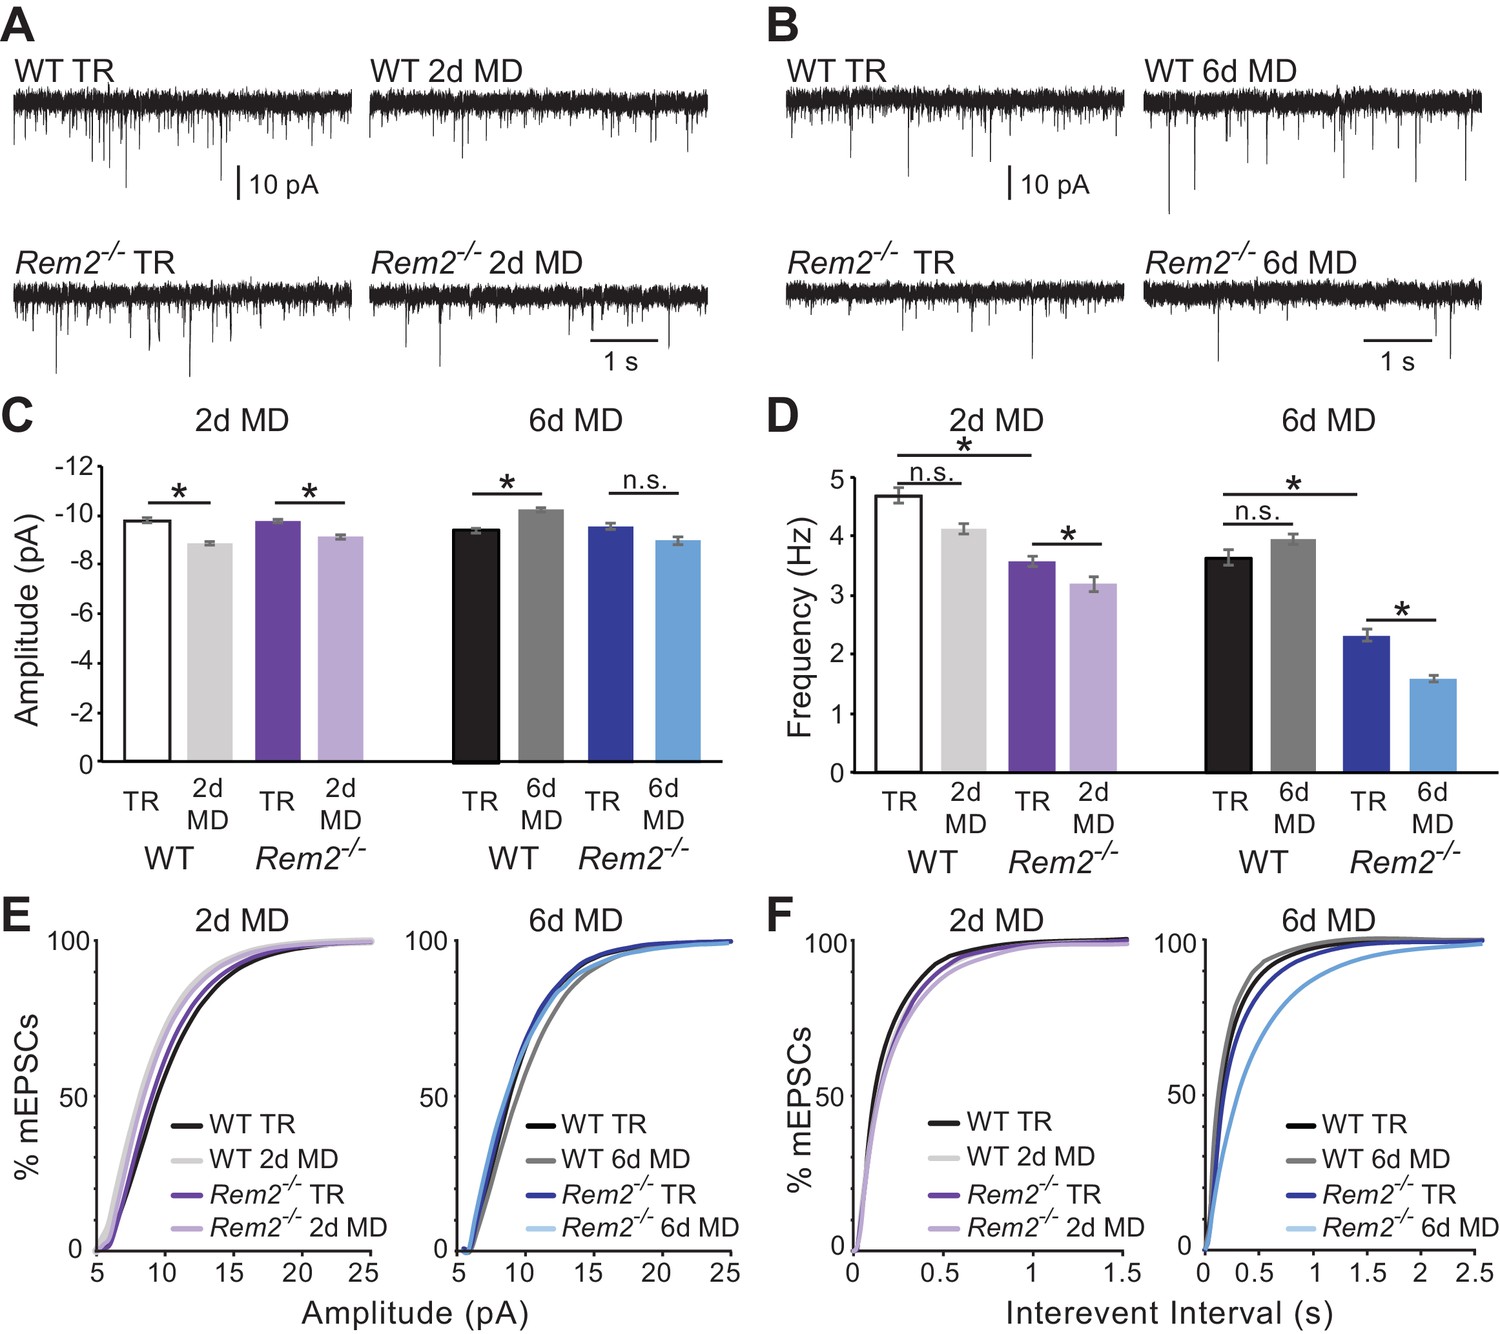
Rem2 is required for postsynaptic strengthening following 6 days of monocular deprivation.
(A) Representative whole-cell voltage clamp recordings of mEPSCs from layer 2/3 pyramidal neurons in binocular visual cortex (V1b) of wildtype typically reared mice at P28 (WT TR), wildtype mice undergoing 2 days of monocular deprivation (WT 2d MD), Rem2-/- typically reared mice at P28 (Rem2-/- TR), or Rem2-/- mice following 2 days of monocular deprivation (Rem2-/- 2d MD). (B) Representative voltage-clamp traces from layer 2/3 pyramidal neurons from V1b of wildtype typically reared mice at P32 (WT TR), wildtype mice undergoing 6 days of monocular deprivation from P26-P32 (WT 6d MD), Rem2-/- typically reared mice at P32 (Rem2-/- TR) or following 6 days of MD (Rem2-/- 6d MD). (C) Average mEPSC amplitude recorded from wildtype or Rem2-/- layer 2/3 pyramidal neurons with normal visual experience at (left) P28 (WT TR, white, n = 25; Rem2-/- TR, dark purple, n = 29), or following 2 days of monocular deprivation (WT DR, light gray, n = 25; Rem2-/- 2d MD, light purple, n = 23) or (right) at P32 with normal visual experience (WT TR, black, n = 24; Rem2-/- TR, dark blue, n = 24) or following 6 days of monocular deprivation (WT 6d MD, gray, n = 25; Rem2-/- 6d MD, light blue, n = 25). N = 4 animals per experimental condition. (D) Average mEPSC frequency in wildtype and Rem2-/- mice undergoing 2 days (Left) or 6 days (Right) of monocular deprivation compared to typically reared age-matched controls. (E) Cumulative distribution plot of mEPSC amplitude or (F) Interevent Interval recorded in wildtype and Rem2-/-mice following 2 days (Left) or 6 days (Right) of monocular deprivation. Data is presented as mean ± SEM. *p<0.05, by two-way ANOVA and Tukey post-hoc for mEPSC frequency and amplitude mean data plots.
Figure 6

Rem2-/- does not alter inhibition in layer 2/3 pyramidal neurons.
(A) Representative whole-cell recordings of mIPSCs from layer 2/3 pyramidal neurons in V1b in wildtype or Rem2-/- that were either typically reared (TR) until P32 or monocularly deprived (from P26-P32) for 6 days (6d MD). Quantification of average mIPSC frequency (B) and amplitude (C) in WT and Rem2-/- cells (WT TR n = 22, WT 6d MD n = 17, Rem2-/-TR n = 22, and Rem2-/- 6d MD n = 17). N = 3 animals per condition. (D) Cumulative distribution plot of mIPSC amplitudes in WT TR, WT 6d MD, Rem2 TR, and Rem2 MD. Data is presented as mean ±SEM. *p<0.05 by two-way ANOVA with Tukey post-hoc.
Figure 7
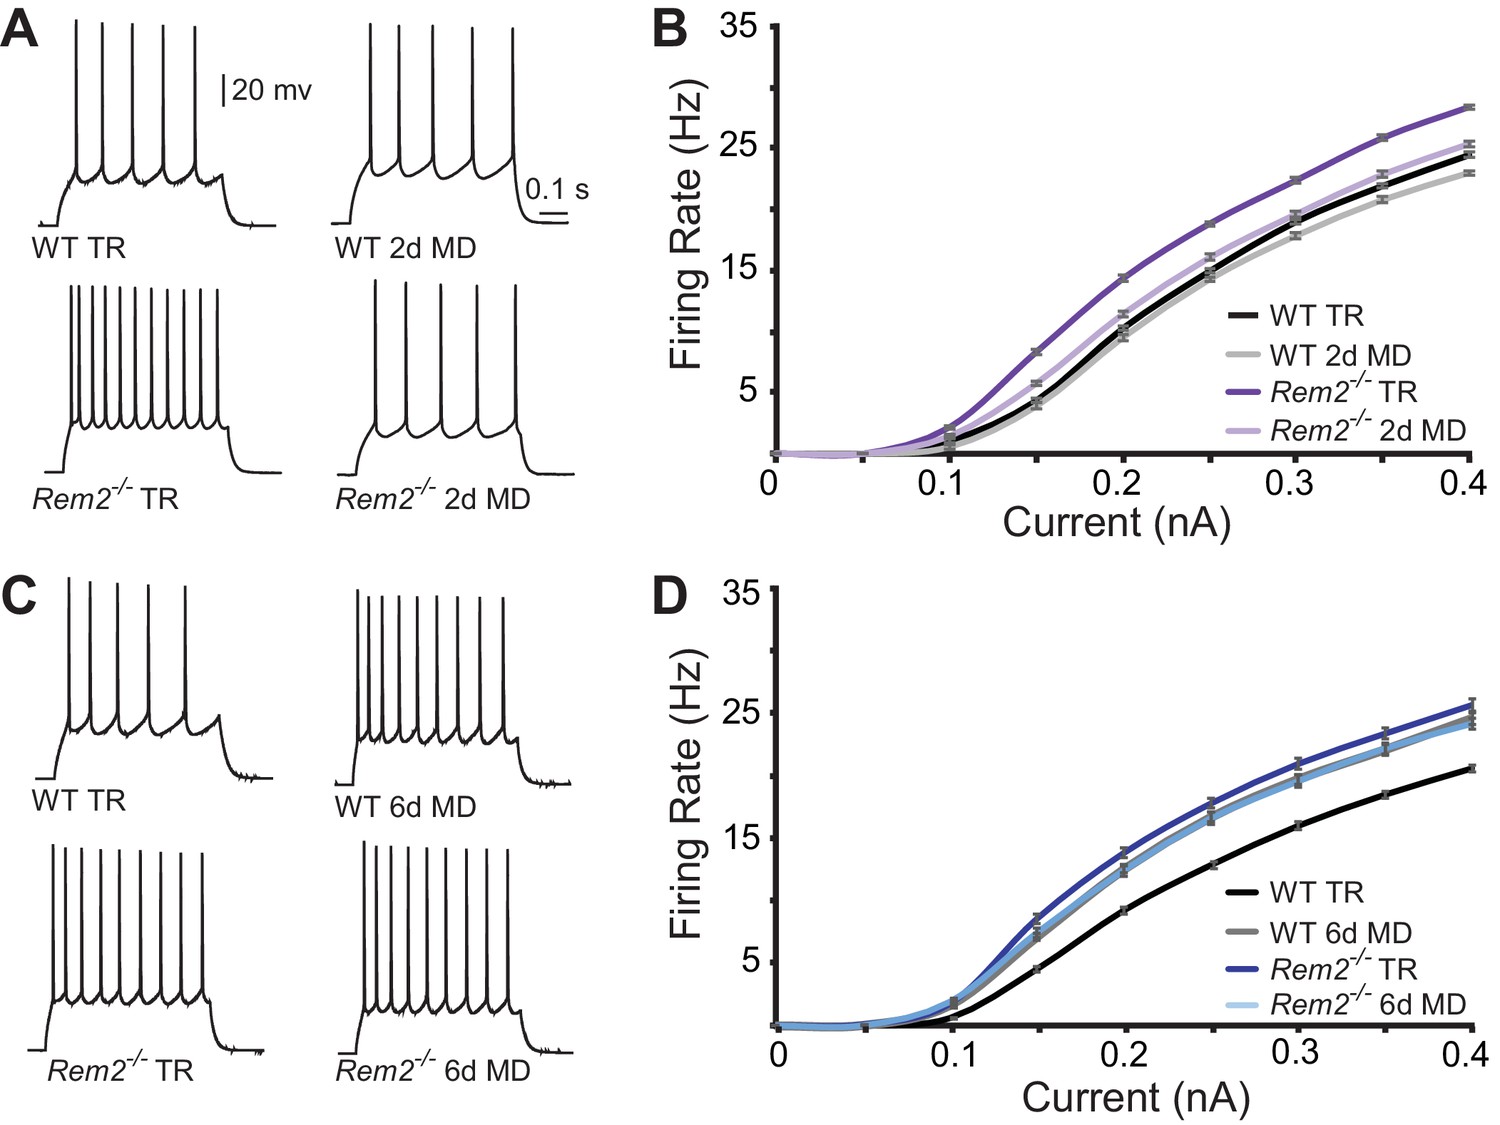
Rem2 alters the intrinsic excitability of layer 2/3 pyramidal neurons.
(A) Example traces of evoked action potential responses (0.2 nA current injected) of neurons from WT or Rem2-/- mice either typically reared (TR) to P28 or monocularly deprived for 2 days from P26-P28 (2d MD). (B) Average f-I curves for WT TR (black line, n = 25), WT 2d MD (gray line, n = 22), Rem2-/- TR (dark purple line, n = 23) and Rem2-/- 2d MD (light purple line, n = 22) in response to normal visual experience or 2 days of monocular deprivation. N = 4 animals per experimental condition. (C) Examples of evoked responses from neurons of WT or Rem2-/- following at P32 that were either typically reared (WT TR and Rem2-/- TR) or monocularly deprived for 6 days from P26-P32 (WT 6d MD and Rem2-/- 6d MD). (D) Average f-I curves for WT TR (black line, n = 32), WT 6d MD (gray line, n = 22), Rem2-/- TR (dark blue line, n = 24) and Rem2-/- 6d MD (light blue line, n = 22) in response to normal visual experience or after 6 days of monocular deprivation. N = 5 mice for WT TR and 4 mice for all other conditions.
Figure 8 with 1 supplement
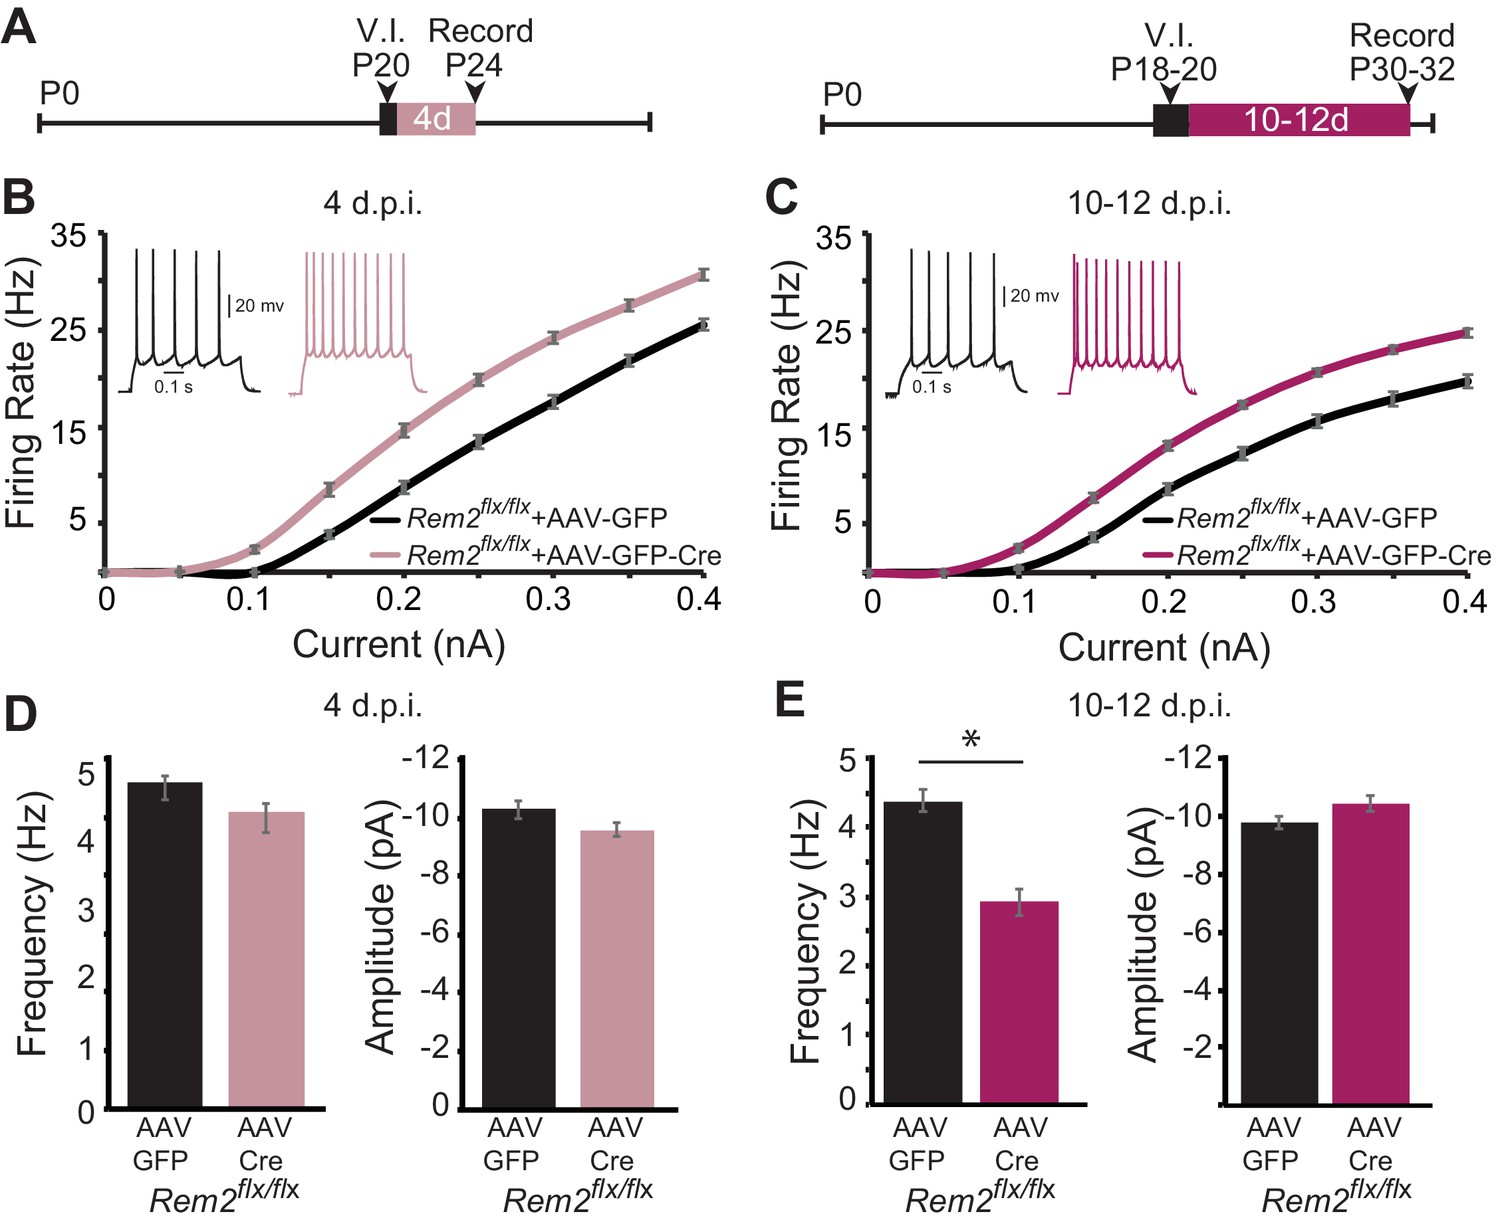
Rem2 cell-autonomously regulates intrinsic excitability in vivo.
(A) Experimental timeline of acute, viral-mediated Rem2 deletion in Rem2flx/flx mice. V.I., virus injection. (B) Average f-I curves recorded from neurons of Rem2flx/flx mice injected with either a control GFP (Rem2flx/flx + AAV GFP, black, n = 17) or GFP-Cre expressing virus (Rem2flx/flx + AAV GFP-Cre, mauve, n = 19) measured 4 days post infection (d.p.i.). Inset: representative traces of evoked responses measured at 0.2 nA from Rem2flx/flx + AAV GFP and Rem2flx/flx + AAV GFP-Cre neurons 4 d.p.i.. (C) Average f-I curves recorded from neurons of Rem2flx/flx + AAV GFP (black, n = 18) or Rem2flx/flx + AAV GFP-Cre (magenta, n = 20) measured 10–12 days post infection. Inset: representative traces of evoked responses measured at 0.2 nA from Rem2flx/flx + AAV GFP and Rem2flx/flx + AAV GFP-Cre neurons 10–12 d.p.i.. (D) Average mEPSC (left) frequency and (right) amplitude measured in Rem2flx/flx + AAV GFP (black, n = 14) or Rem2flx/flx + AAV GFP-Cre (mauve, n = 17) measured 4 days post infection. (E) Average mEPSC (left) frequency and (right) amplitude measured in Rem2flx/flx + AAV GFP (black, n = 22) or Rem2flx/flx + AAV GFP-Cre (magenta, n = 18) measured 10–12 days post infection. N = 3–5 animals per condition. Data is presented as mean ± SEM. *p<0.05, by two-way ANOVA and Tukey post-hoc for mEPSC frequency and amplitude mean data plots.
Figure 8—figure supplement 1
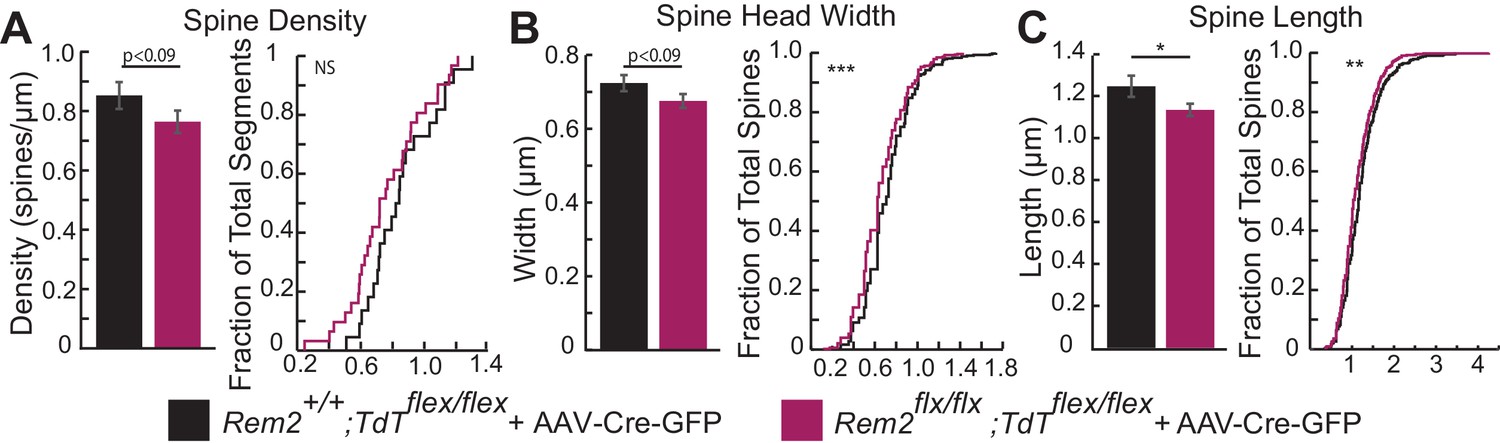
Brief loss of Rem2 results in a modest decrease in spine density and spine remodeling.
(A) Average spine density (left) and cumulative histogram of spine densities (right) for control Rem2+/+;Tdtflex/flex (black, n = 22) or Rem2flx/flx;Tdtflex/flex (orange, n = 31) GFP-Cre epressing neurons at 11 days post injection (d.p.i). GFP-Cre expressing neurons from Rem2flx/flxTdtflex/flex animals show a trend toward decreased mean spine density compared to control Rem2+/+;Tdtflex/flex neurons (p=0.09, two sample t-test) and a shifit in the population of spine densities toward lower values. (B) Average spine head width (left) and cumulative histogram (right) of spine head measurements from control Rem2+/+;Tdtflex/flex (black, n = 22) or Rem2flx/flx;Tdtflex/flex (orange, n = 31) GFP-Cre epressing neurons at 11d.p.i. GFP-Cre expressing neurons from Rem2flx/flx;Tdtflex/flex mice show a trend toward decreased mean spine head width compared to control Rem2+/+;Tdtflex/flex neurons (p=0.09, two sample t-test) and a highly significant shift in the distribution of spine head widths toward narrower spine heads (p<0.001, Kolmogorov-Smirnov test). (C) Average spine neck length (left) and cumulative histogram (right) of spine neck measurements from control Rem2+/+;Tdtflex/flex (black, n = 22) or Rem2flx/flx;Tdtflex/flex mice (orange, n = 31) GFP-Cre epressing neurons at 11d.p.i. GFP-Cre expressing neurons from Rem2flx/flx;Tdtflex/flex mice show decreased mean spine neck length compared to control Rem2+/+;Tdtflex/flex (p<0.05, 2 sample t-test) and a highly significant shift in the distribution of spine head widths toward narrower spine heads (p<0.01, Kolmogorov-Smirnov test). N = 5 animals per condition. Data is presented as mean ± SEM (left) and as cumulative distribution plots (right).
Figure 9
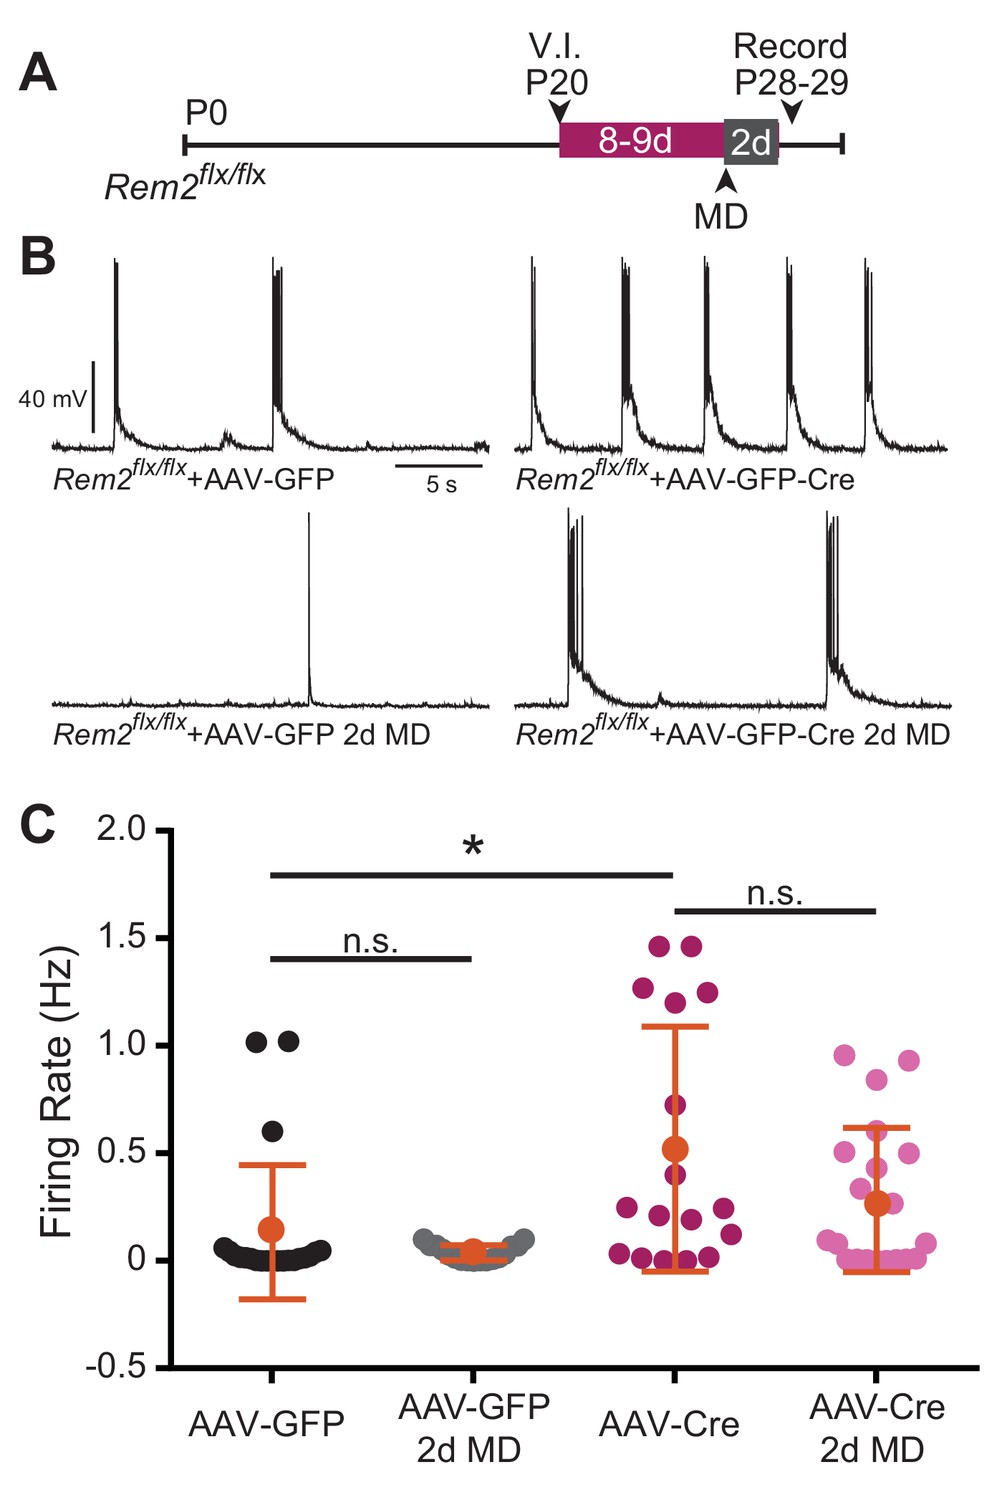
Spontaneous firing rate is regulated by Rem2 in vitro.
(A) Experimental timeline of acute, viral-mediated Rem2 deletion in Rem2flx/flx mice with 2 days monocular deprivation (MD). V.I., virus injection. (B) Examples of spontaneous firing recorded in GFP+ layer 2/3 pyramidal neurons in Rem2flx/flx + AAV GFP (top left, n = 22), Rem2flx/flx + AAV GFP+2 d MD (bottom left, n = 17), Rem2flx/flx + AAV GFP-Cre (top right, n = 17), and Rem2flx/flx + AAV GFP-Cre+2 d MD (bottom right, n = 20). (C) Average firing rate measured in layer 2/3 pyramidal neurons. Data is presented as individual data points, with the horizontal bar denoting average. N = 4 animals per condition. Error bars represent S.E.M. *p<0.05, by two-way ANOVA with Tukey post-hoc.
Figure 10
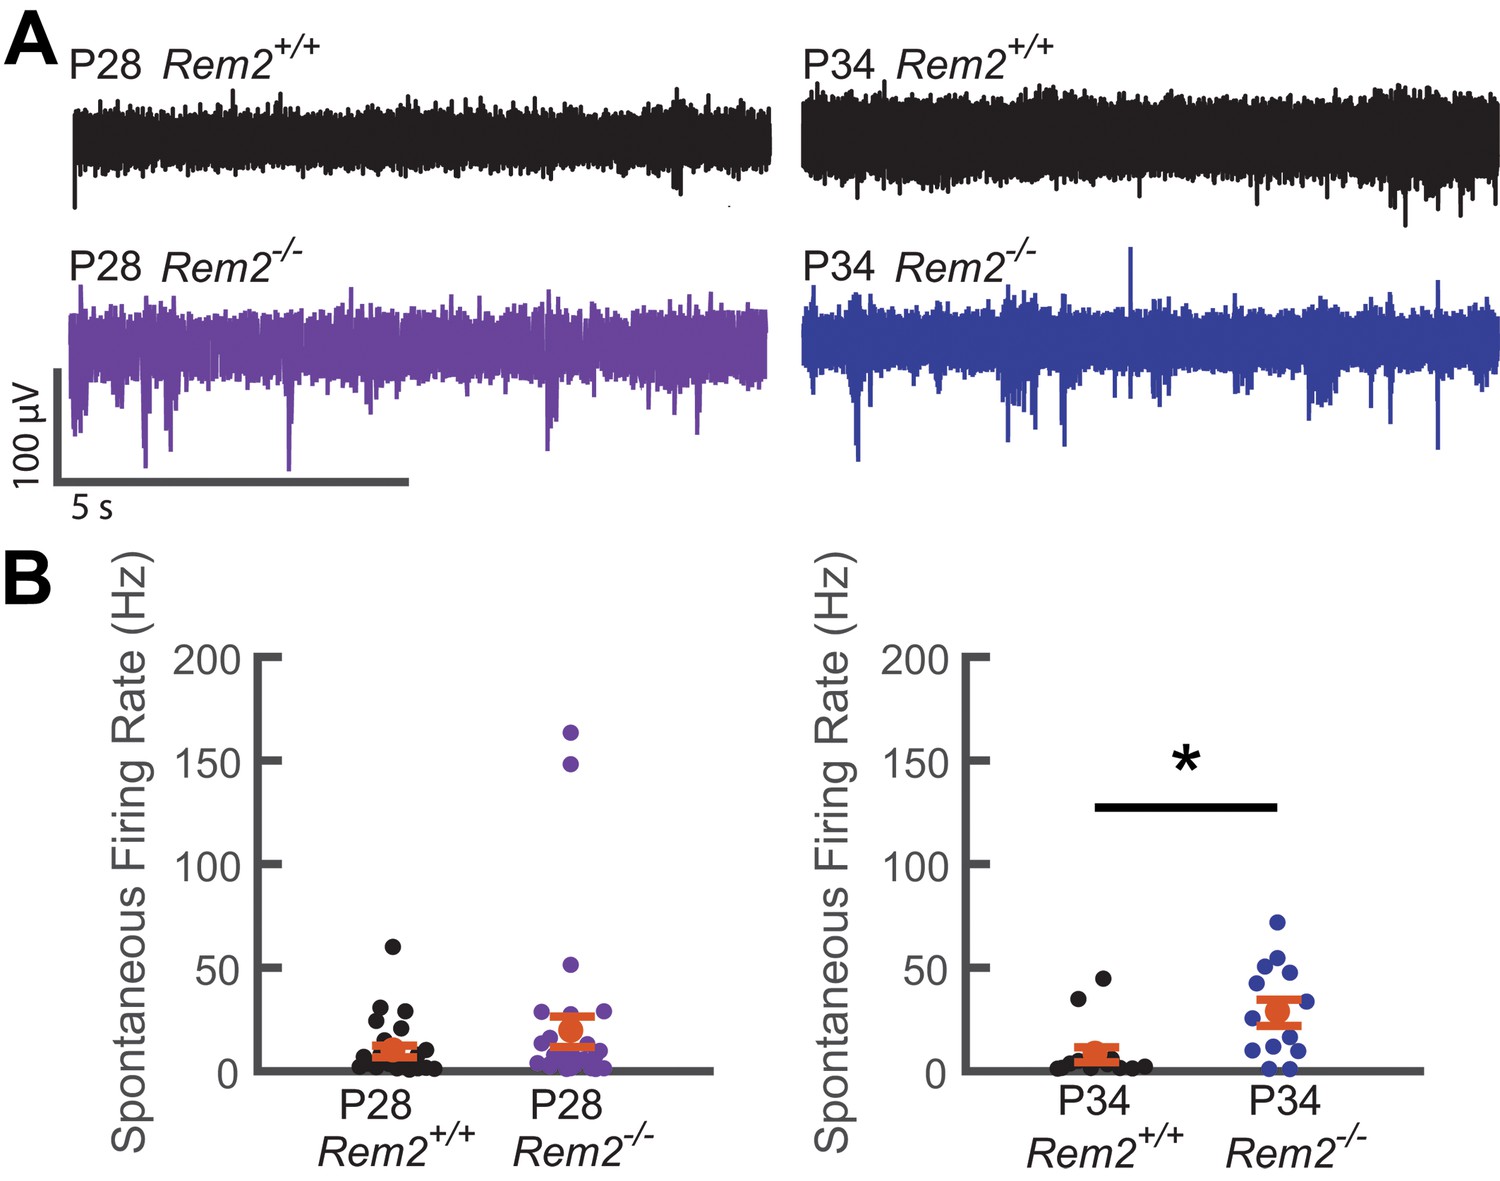
Spontaneous firing rate is regulated by Rem2 in vivo.
A) Representative extracellular multi-unit voltage traces from L2/3 neurons in binocular visual cortex (V1b) of wildtype (top) and Rem2-/- (bottom) typically reared mice sampled during the peak (P28, left) and late (P34, right) visual critical period. (B) Average spontaneous multiunit firing rate of L2/3 V1b neurons sampled from anesthetized wildtype and Rem2-/- mice during the peak (Right, P28 WT, black, n = 24 sites recorded from 4 mice; P28 Rem2-/-, purple, n = 29 sites recorded from 5 mice) and late (Left, P34 WT, black, n = 14 sites sampled from 3 mice; P34 Rem2-/-, blue, n = 13 sites sampled from 3 mice) visual critical period. Each small circle represents one recording site. Orange circles and error bars are mean ± SEM. *p<0.0153 by Kruskal-Wallis test.
Tables
Table 1
Statistical comparisons of Individual Eye Responses as measured for ocular dominance index.
Statistical comparisons of changes in reflectance over baseline reflectance (ΔR/R) for ipsilateral (I) or contralateral (C) eye response vales for wildtype and Rem2 deletion mice as measured by intrinsic signal imaging. These values correspond to the ΔR/R values displayed in Figure 3C–D and Figure 4 insets.
| Statistical comparison | Ipsi p-Value | Contra p-value |
|---|---|---|
| WT TR vs. WT 2d MD | 0.7689 | 0.0149* |
| WT TR vs. WT 6d MD | 0.2242 | 0.0050* |
| WT 2d MD vs. WT 6d MD | 0.0678 | 0.8486 |
| Rem2-/- TR vs. Rem2-/- 2d MD | 0.4259 | 0.0031179* |
| Rem2-/- TR vs. Rem2-/- 6d MD | 0.3594 | 0.1637101 |
| Rem2-/- 2d MD vs. Rem2-/- 6d MD | 0.0247* | 0.1673178 |
| WT TR vs. Rem2-/- TR | 0.5419 | 0.5363 |
| WT 2d MD vs. Rem2-/- 2d MD | 0.7797 | 0.5264 |
| WT 6d MD vs. Rem2-/- 6d MD | 0.5847 | 0.0096* |
| Adult WT TR vs. Adult WT 10d MD | 0.0632 | 0.0257* |
| Adult Rem2-/- TR vs. Adult Rem2-/- 10d MD | 0.0598 | 0.6656 |
| Adult WT TR vs. Rem2-/- TR | 0.9587 | 0.7801 |
| Adult WT 10d MD vs. Rem2-/- 10d MD | 0.1709 | 0.0998 |
| Rem2+/+;Emx1Cre TR vs. Rem2+/+;Emx1Cre 6d MD | 0.7784 | 0.0440* |
| Rem2flx/flx;Emx1Cre TR vs. Rem2flx/flx;Emx1Cre 6d MD | 0.9992 | 0.3774 |
| Rem2+/+;Emx1Cre TR vs. Rem2flx/flx;Emx1Cre TR | 0.9990 | 0.9990 |
| Rem2+/+;Emx1Cre 6d MD vs. Rem2flx/flx;Emx1Cre 6d MD | 0.7446 | 0.5876 |
| Rem2+/+;PvalbCre TR vs. Rem2+/+;PvalbCre 6d MD | 0.3275 | 0.2828 |
| Rem2flx/flx;PvalbCre TR vs. Rem2flx/flx;PvalbCre 6d MD | 0.7515 | 0.0513 |
| Rem2+/+;PvalbCre TR vs. Rem2flx/flx;PvalbCre TR | 0.9956 | 0.9997 |
| Rem2+/+;PvalbCre 6d MD vs. Rem2flx/flx;PvalbCre 6d MD | 0.7564 | 0.7999 |
| Rem2+/+;VipCre TR vs. Rem2+/+; VipCre 6d MD | 0.0443* | 0.0875 |
| Rem2flx/flx; VipCre TR vs. Rem2flx/flx; VipCre 6d MD | 0.2417 | 0.0554 |
| Rem2+/+; VipCre TR vs. Rem2flx/flx; VipCre TR | 0.7063 | 0.7400 |
| Rem2+/+; VipCre 6d MD vs. Rem2flx/flx; VipCre 6d MD | 0.5437 | 0.3990 |
-
*p≤0.05 by a two-way ANOVA followed by a Tukey test. All other comparisons are not significant.
Table 2
Passive membrane properties of layer 2/3 neurons in visual cortex.
Passive membrane properties including resting membrane potential (VR), input resistance (RIN), membrane capacitance (CM), and Tau measured in layer 2/3 pyramidal neurons in wildtype and Rem2-/- TR or MD mice for the cells assayed in Figure 7.
| Experimental condition | VR (mV) | RIN (GΩ) | CM (pF) | Tau (ms) |
|---|---|---|---|---|
| WT TR | −68.01 ± 0.43 | 95.09 ± 1.56 | 113.98 ± 1.70 | 10.78 ± 0.21 |
| WT 2d MD | −66.78 ± 0.38 | 96.46 ± 2.11 | 108.84 ± 2.48 | 10.12 ± 0.15 |
| Rem2-/- TR | −64.98 ± 0.26 | 111.61 ± 1.80 | 105.50 ± 1.95 | 11.44 ± 0.16 |
| Rem2-/- 2d MD | −68.38 ± 0.38# | 100.94 ± 2.25 | 109.70 ± 2.72 | 10.79 ± 0.27 |
| WT TR | −64.22 ± 0.23 | 104.15 ± 1.64 | 118.55 ± 1.97 | 12.03 ± 0.15 |
| WT 6d MD | −64.92 ± 0.19 | 109.38 ± 1.10 | 119.94 ± 1.46 | 10.77 ± 0.10# |
| Rem2-/- TR | −63.39 ± 0.43 | 112.06 ± 1.62 | 124.80 ± 2.15 | 13.86 ± 0.29 |
| Rem2-/- 6d MD | −64.38 ± 0.19 | 99.61 ± 1.34 | 125.31 ± 1.61 | 11.96 ± 0.15 |
| 4 days post infection Rem2flx/flx + AAV-GFP | −67.48 ± 0.54 | 108.88 ± 3.81 | 101.69 ± 2.35 | 11.26 ± 0.35 |
| Rem2flx/flx + AAV-GFP-CRE | −69.38 ± 0.59 | 101.26 ± 2.68 | 96.75 ± 2.59 | 9.66 ± 0.31 |
| 10–12 days post infection Rem2flx/flx + AAV GFP | −64.04 ± 0.56 | 105.87 ± 3.75 | 111.54 ± 3.62 | 11.35 ± 0.39 |
| Rem2flx/flx + AAV-GFP-CRE | −64.21 ± 0.44 | 122.07 ± 3.10 | 102.56 ± 2.42 | 12.30 ± 0.37 |
-
*p≤0.05 compared to WT TR or #p≤0.05 compared to Rem2-/- TR by a two-way ANOVA followed by a Tukey test. All other comparisons are not significant. For Rem2flx/flx mice, data is compared using an independent student’s t-test.
Key resources table
| Reagent type (species) or resource | Designation | Source or reference | Identifiers | Additional information |
|---|---|---|---|---|
| Strain, strain background (M. musculus) | Rem2 | EUCOMM | IKMC 92501 | Rem2tm1a(EUCOMM)Hmgu |
| Strain, strain background (M. musculus) | Flp | The Jackson Laboratory | RRID:IMSR_JAX009086 | B6.129S4-Gt(ROSA)26 Sortm1(FLP1)Dym/RainJ |
| Strain, strain background (M. musculus) | Emx1Cre | The Jackson Laboratory | RRID:IMSR_JAX:005628 | B6.129S2-Emx1tm1(cre)Krj/J |
| Strain, strain background (M. musculus) | PvalbCre | The Jackson Laboratory | RRID:IMSR_JAX:017320 | B6.129P2-Pvalbtm1(cre)Arbr/J |
| Strain, strain background (M. musculus) | VipCre | The Jackson Laboratory | RRID: IMSR_JAX:010908 | STOCK Viptm1(cre)Zjh/J |
| Strain, strain background (M. musculus) | TdT Flex | The Jackson Laboratory | RRID:IMSR_JAX:007909 | B6.Cg-Gt(ROSA)26Sortm9(CAG-tdTomato)Hze/J |
| Transfected construct (Adeno-associated virus) | AAV-GFP | Penn Vector Core, USA | AV-1-PV1696 | AAV1.hSyn.eGFP.WPRE.bGH |
| Transfected construct (Adeno-associaed virus) | AAV-GFP-Cre | Penn Vector Core, USA | AV-1-PV1848 | AAV1.hSyn.HI.e GFP-Cre.WPRE.SV40 |
| Antibody | polyclonal Anti-Rem2 | Santa Cruz | sc160722; RRID: AB_2179340 | use 1:500 |
| Antibody | monoclonal Anti-Bactin | Abcam | ab8226; RRID: AB_306371 | use 1:5000 |
| Software, algorithm | ImageJ software (Fiji) | NIH | RRID:SCR_003070 | |
| Software, algorithm | ClampFit 10.2 | pClamp, Molecular Devices | RRID:SCR_011323 | |
| Software, algorithm | Matlab | Mathworks | RRID:SCR_001622 | |
| Software, algorithm | Reconstruct | Synapse Web | RRID:SCR_002716 | |
| Software, algorithm | Volocity 3D Image Analysis Software | Perkin Elmer | RRID:SCR_002668 |
Additional files
-
Transparent reporting form
- https://doi.org/10.7554/eLife.33092.018
Download links
A two-part list of links to download the article, or parts of the article, in various formats.
Downloads (link to download the article as PDF)
Open citations (links to open the citations from this article in various online reference manager services)
Cite this article (links to download the citations from this article in formats compatible with various reference manager tools)
Rem2 stabilizes intrinsic excitability and spontaneous firing in visual circuits
eLife 7:e33092.
https://doi.org/10.7554/eLife.33092


