Prediction error and repetition suppression have distinct effects on neural representations of visual information
- The University of Queensland, Australia
- Australian Research Council Centre of Excellence for Integrative Brain Function, Australia
- John Curtin School of Medical Research, The Australian National University, Australia
Figures
Figure 1
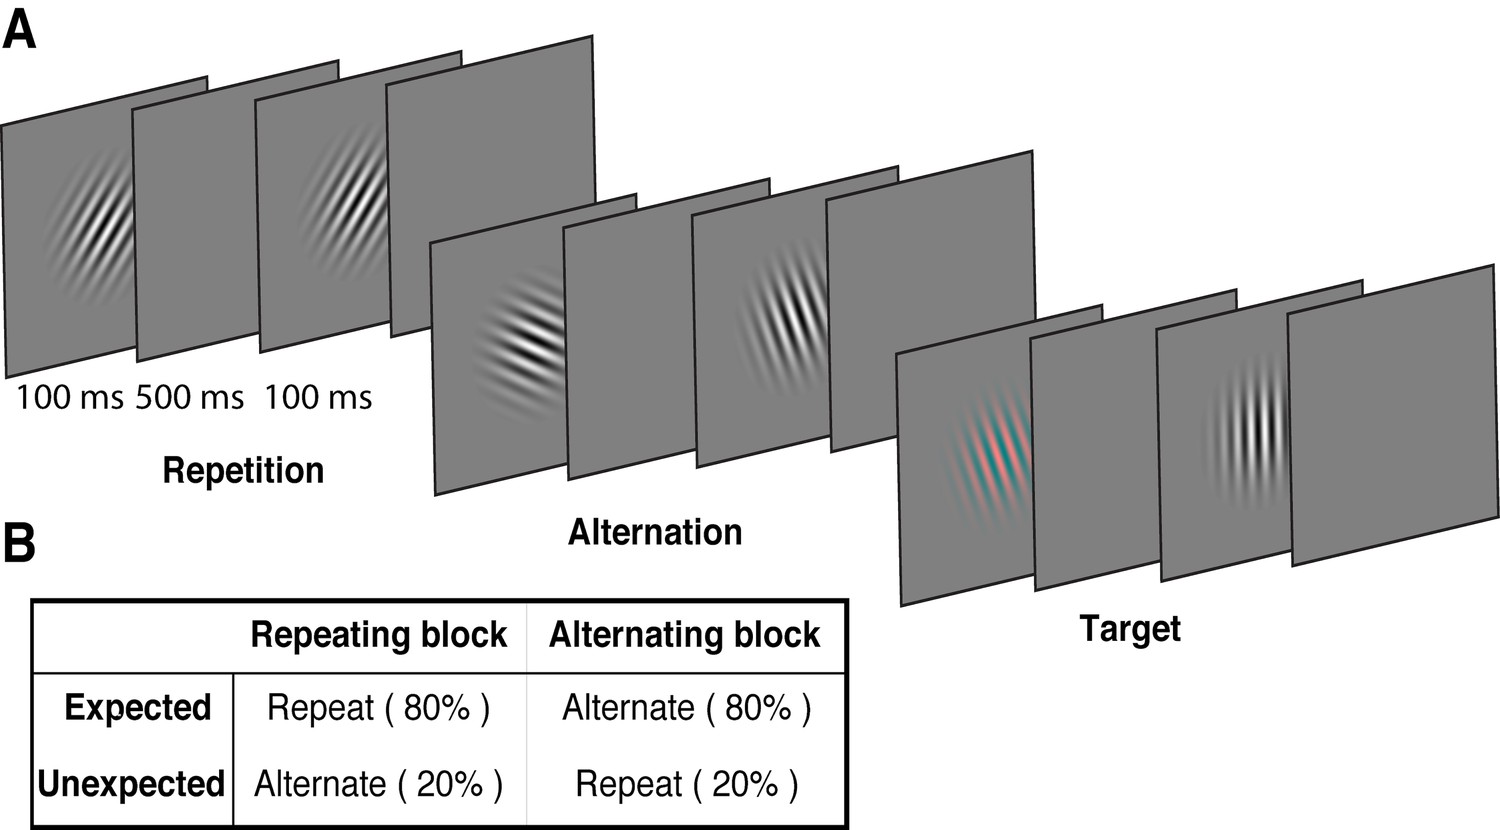
Example stimulus displays and task design.
(A) Schematic of the stimuli and timing used in the experiment. Participants viewed a rapid stream of pairs of Gabors and monitored for an infrequent coloured target (10% of trials). The stimulus orientations were pseudorandomly varied across trials between 0° and 160° (in 20° steps), allowing estimation of orientation-selective information contained within patterns of EEG activity. (B) The orientation of the pairs of Gabors could either repeat or alternate. In one type of block, 80% of trials were orientation repeats and the remaining 20% alternated (Repeating blocks); in the other type of block, these contingencies were reversed (Alternating blocks).
Figure 2
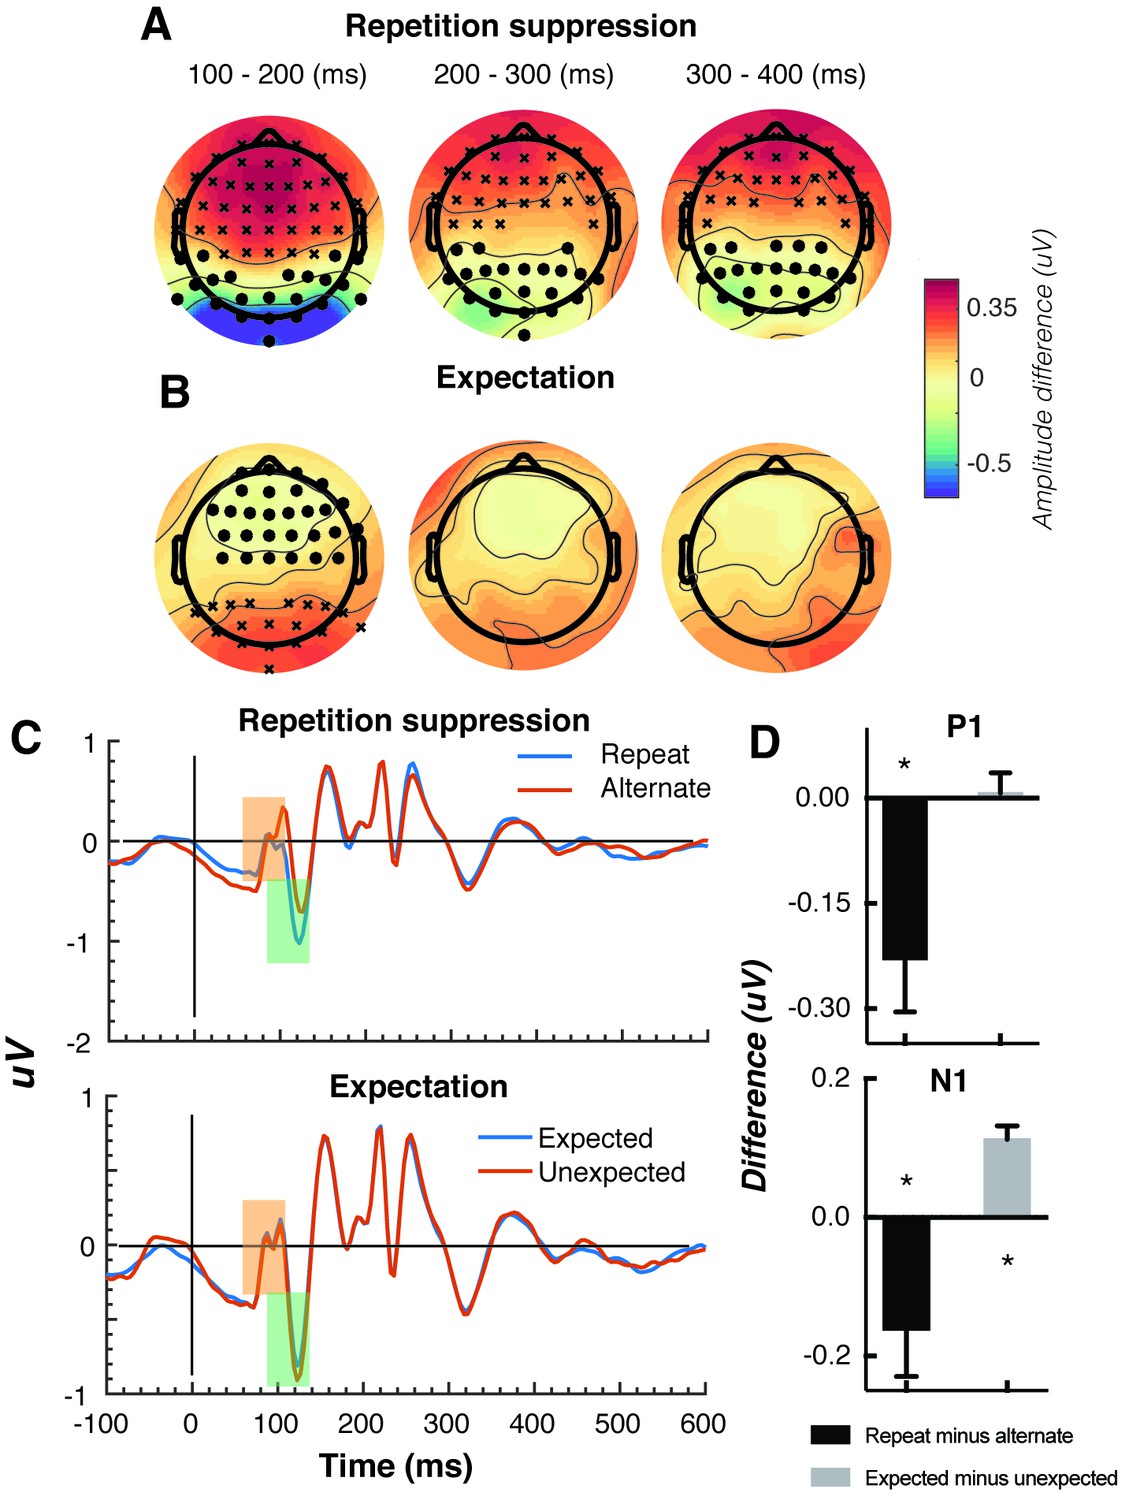
Univariate EEG results for the effect of repetition suppression and expectation on the second stimulus in a pair.
Panels A and B show the main effects of repetition suppression and expectation, respectively, over three post-stimulus epochs (100–200 ms, 200–300 ms, 300–400 ms) and across all electrodes. The main effect of repetition suppression is displayed as Repeating minus Alternating trials. The main effect of expectation is displayed as Expected minus Unexpected trials. Circles indicate clusters of electrodes with significantly reduced activity, and crosses indicate clusters of electrodes with significantly increased activity (alpha p < 0.05, cluster p < 0.025, N permutations = 1500). (C) Bandpass filtered (2–40 Hz) event-related potentials (ERPs) for the two conditions, averaged over occipital-parietal electrodes (O1, O2, Oz, POz, PO7, PO3, PO8, PO4, P3, Pz, P2). A peak analysis was conducted to aid comparison with previous studies. Orange shading indicates the P1 component; green shading indicates the N1 component. (D) Peak analysis results for P1 and N1 components. Note that the plotted values represent differences between conditions, as indicated, rather than condition-specific evoked responses. Asterisks indicate p < 0.05. Error bars indicate ±1 standard error.
Figure 3
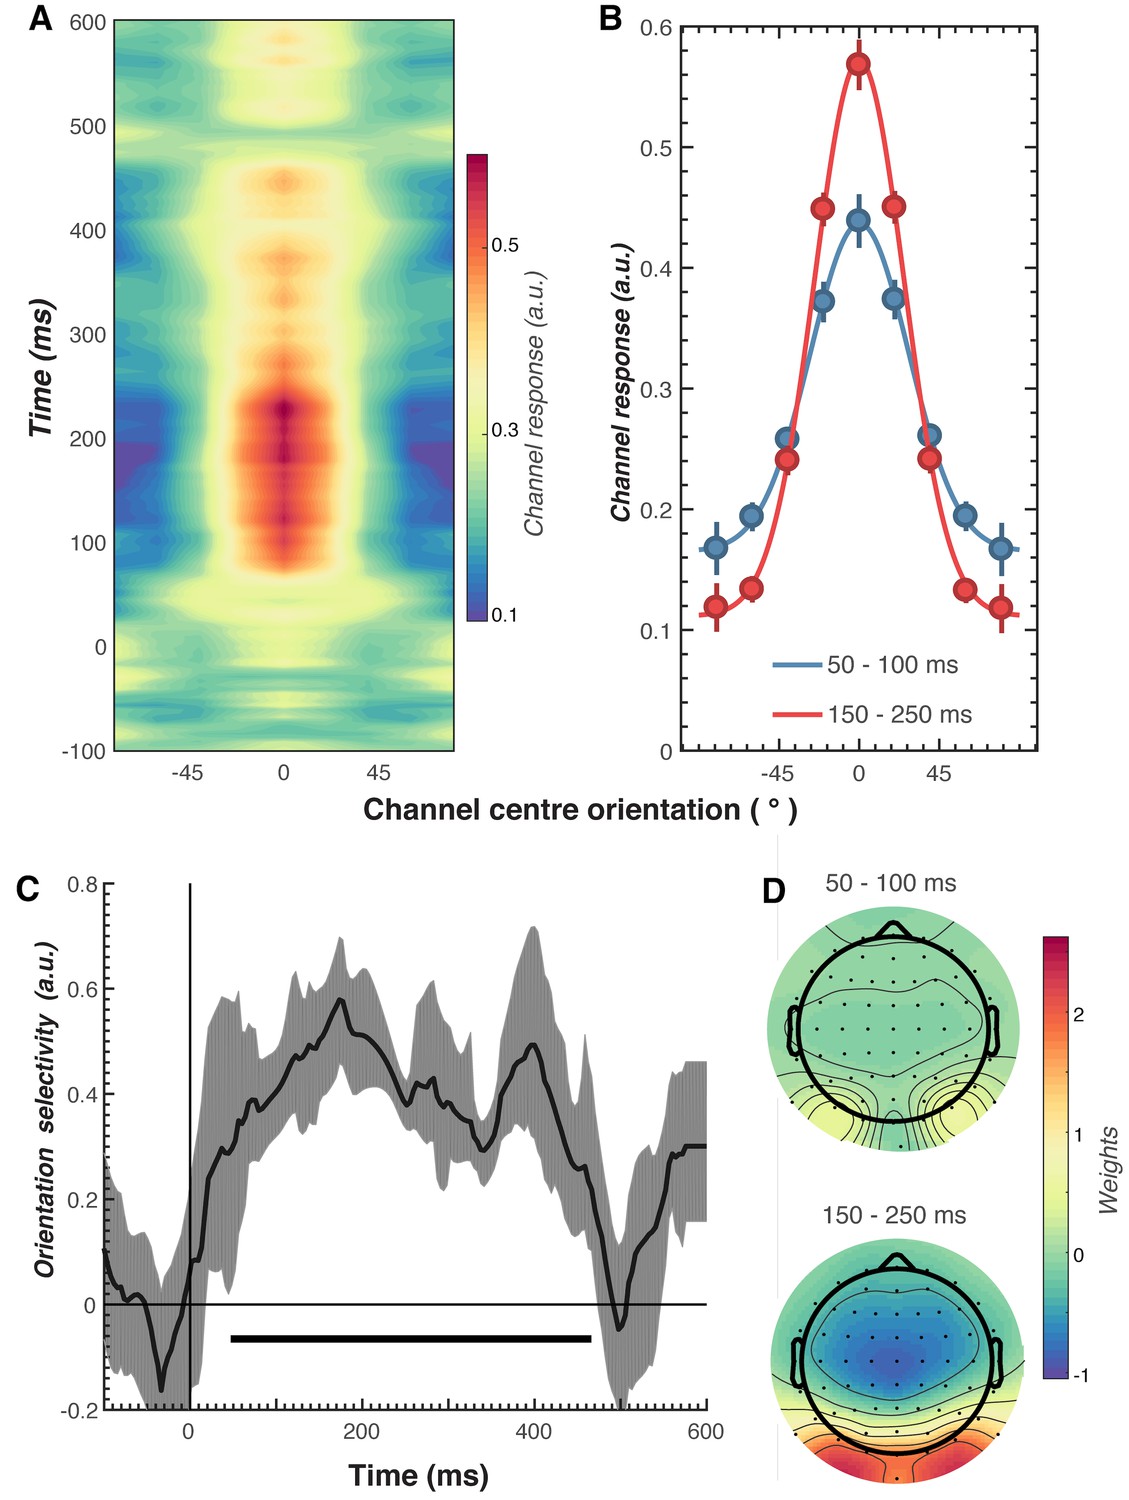
Results of the forward encoding modelling for orientation-selectivity.
(A) Time-resolved orientation tuning curve across all participants and conditions in response to the second Gabor in the pair. The forward encoding approach resulted in a tuning curve for each of the nine presented orientations. These tuning curves were then centred at each presented orientation (here labelled as 0°) to combine across all orientations. The orientation-selective response is contained within the overall pattern of EEG; activity begins soon after stimulus onset and peaks at around 250 ms before declining. (B) Population tuning curve of the stimulus reconstruction across participants, averaged between 50–100 ms and 150–250 ms after stimulus presentation. Each line is a fitted Gaussian response with a variable offset used to quantify orientation selectivity. Error bars indicate ±1 standard error of the mean across participants. (C) Amplitude of the channel response over time, averaged across all conditions (black line). The thick black line indicates significant encoding of stimulus orientation based on a cluster-permutation test across participants (cluster p < 0.05, N permutations = 20,000). Encoding accuracy was reliable from 52 to 470 ms post-stimulus onset. The error shading (in grey) indicates bootstrapped 95% confidence intervals of the mean. (D) Topographic plots of the weights (averaged across the nine orientation channels across all participants) derived from forward encoding at the corresponding time points shown in panel B. (a.u. = arbitrary units).
Figure 4 with 1 supplement
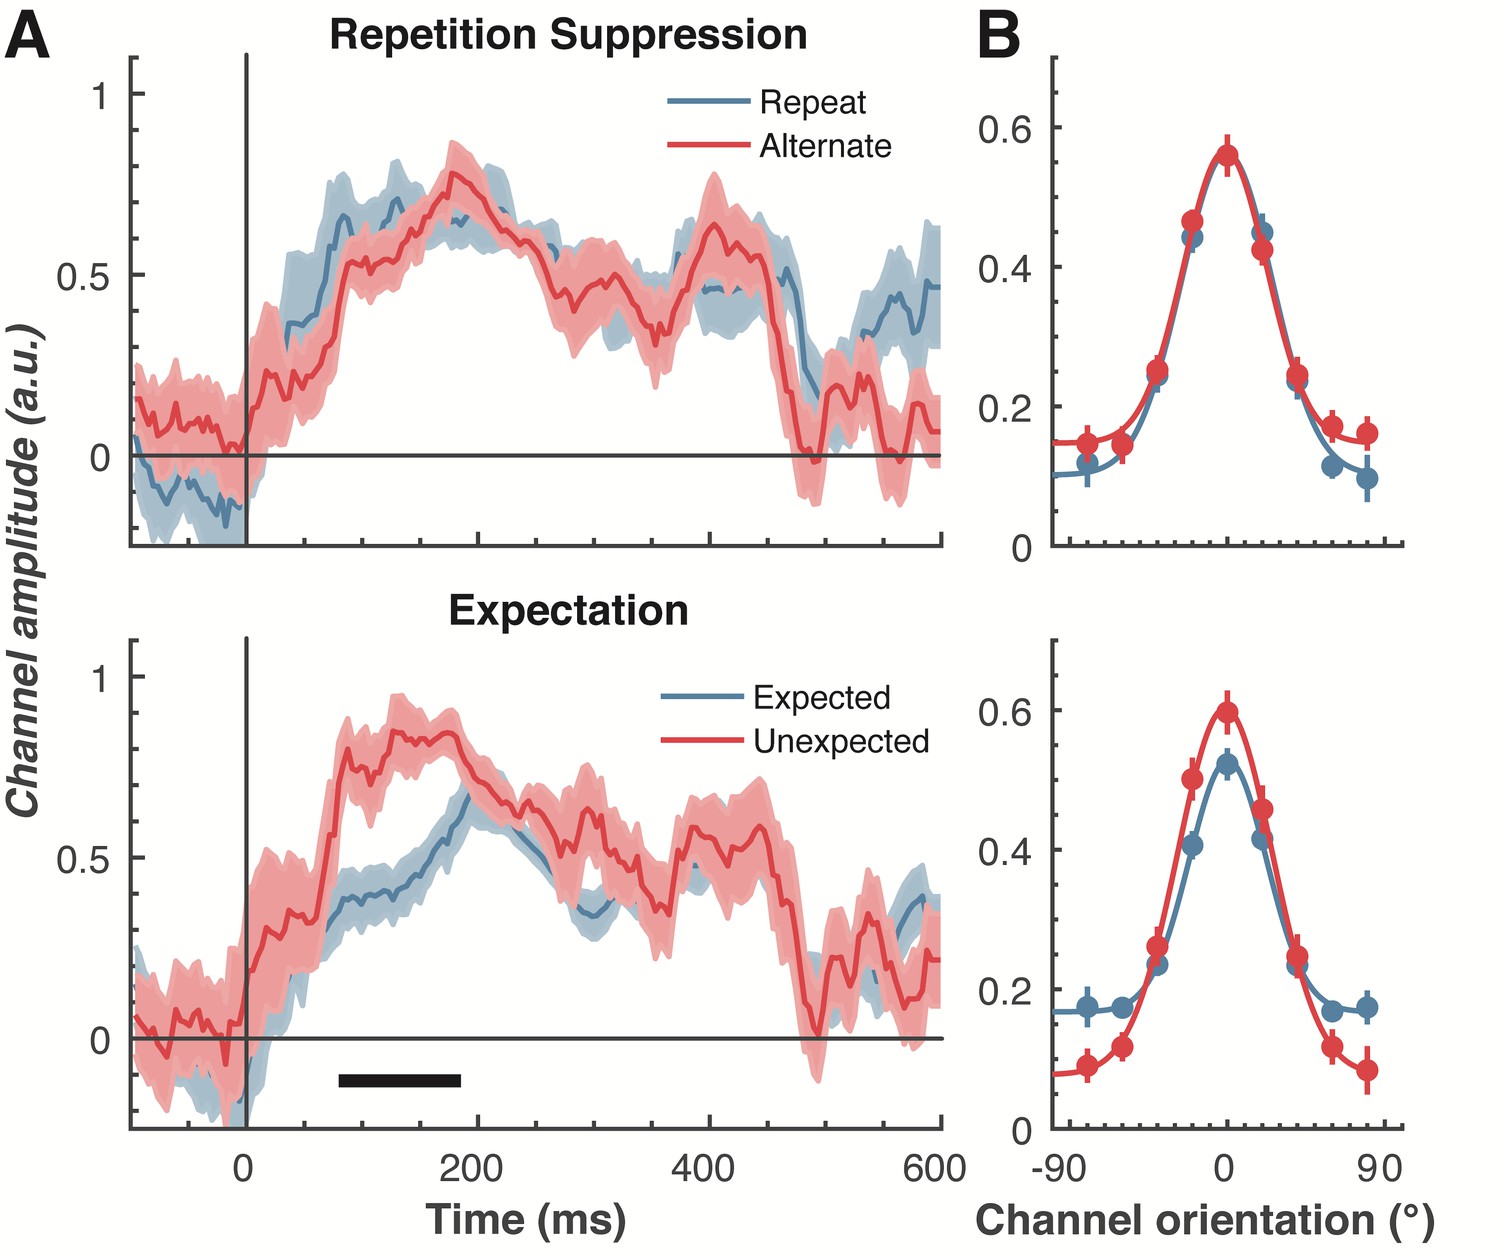
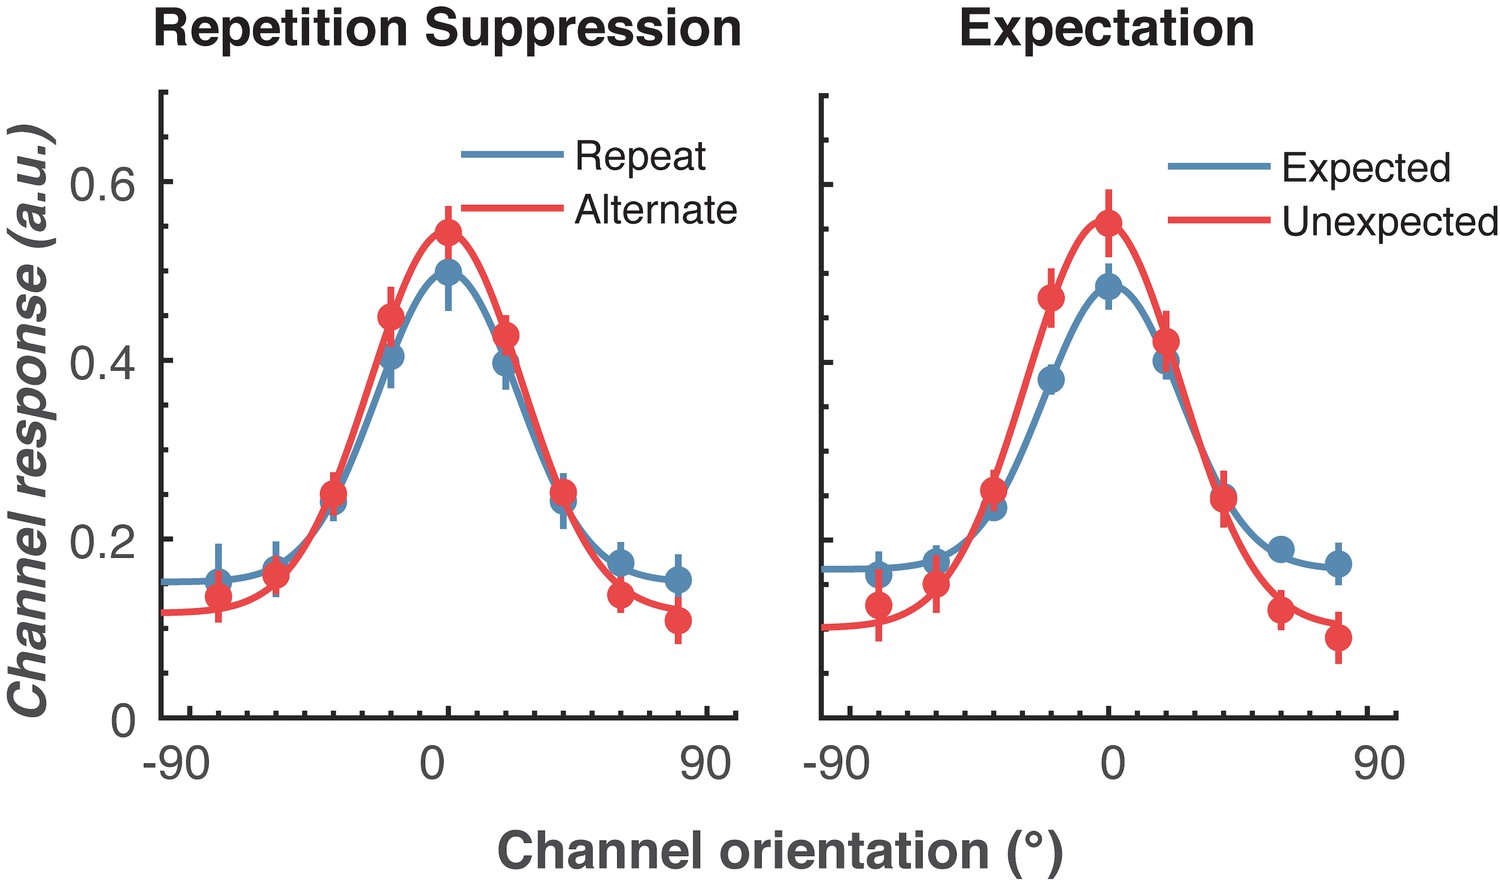
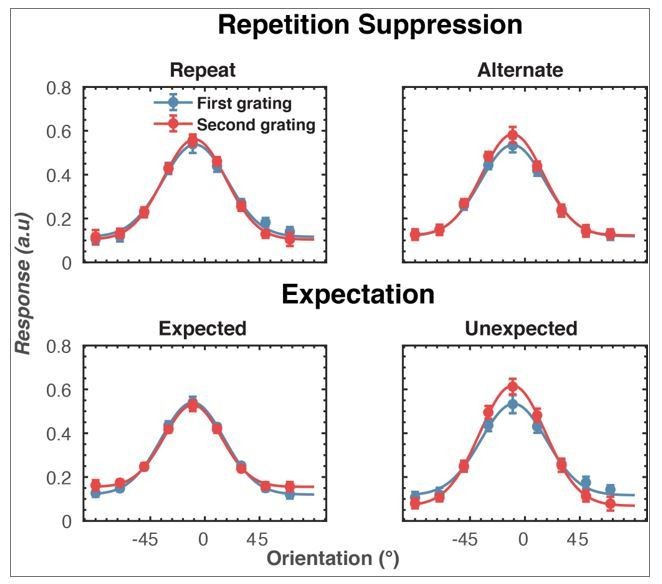
The effect of repetition suppression and expectation on orientation selectivity measured using forward encoding modelling.
(A) Amount of orientation-selective information (given by the amplitude of the fitted Gaussian) from the EEG signal in response to the second Gabor in a pair, shown separately for repetition suppression (upper panel) and expectation (lower panel). The thick black line indicates significant differences between the conditions (two-tailed cluster-permutation, alpha p < 0.05, cluster alpha p < 0.05, N permutations = 20,000). (B) Population tuning curves averaged over the significant time period (79–185 ms) depicted in panel A. The curves, shown as fitted Gaussians, illustrate how overall stimulus representations are affected by repetition and expectation. While there was no difference in orientation tuning for repeated versus alternate stimuli (upper panel), the amplitude of the orientation response increased significantly, and the baseline decreased, for unexpected relative to expected stimuli. Error bars indicate ±1 standard error.
Figure 4—figure supplement 1
The effect of a different baseline period (−100 to 0 ms before onset of the first Gabor) on orientation selectivity for the two main conditions.
Population tuning curves averaged over the significant time period (79–150 ms) shown in Figure 4A. The curves, shown as fitted Gaussians, illustrate how overall stimulus representations are affected by repetition and expectation. While there was no difference in orientation tuning for repeated versus alternating stimuli (left panel), the amplitude of the orientation response increased significantly, and the baseline decreased, for unexpected relative to expected stimuli (right panel). Error bars indicate ±1 standard error.
Figure 5
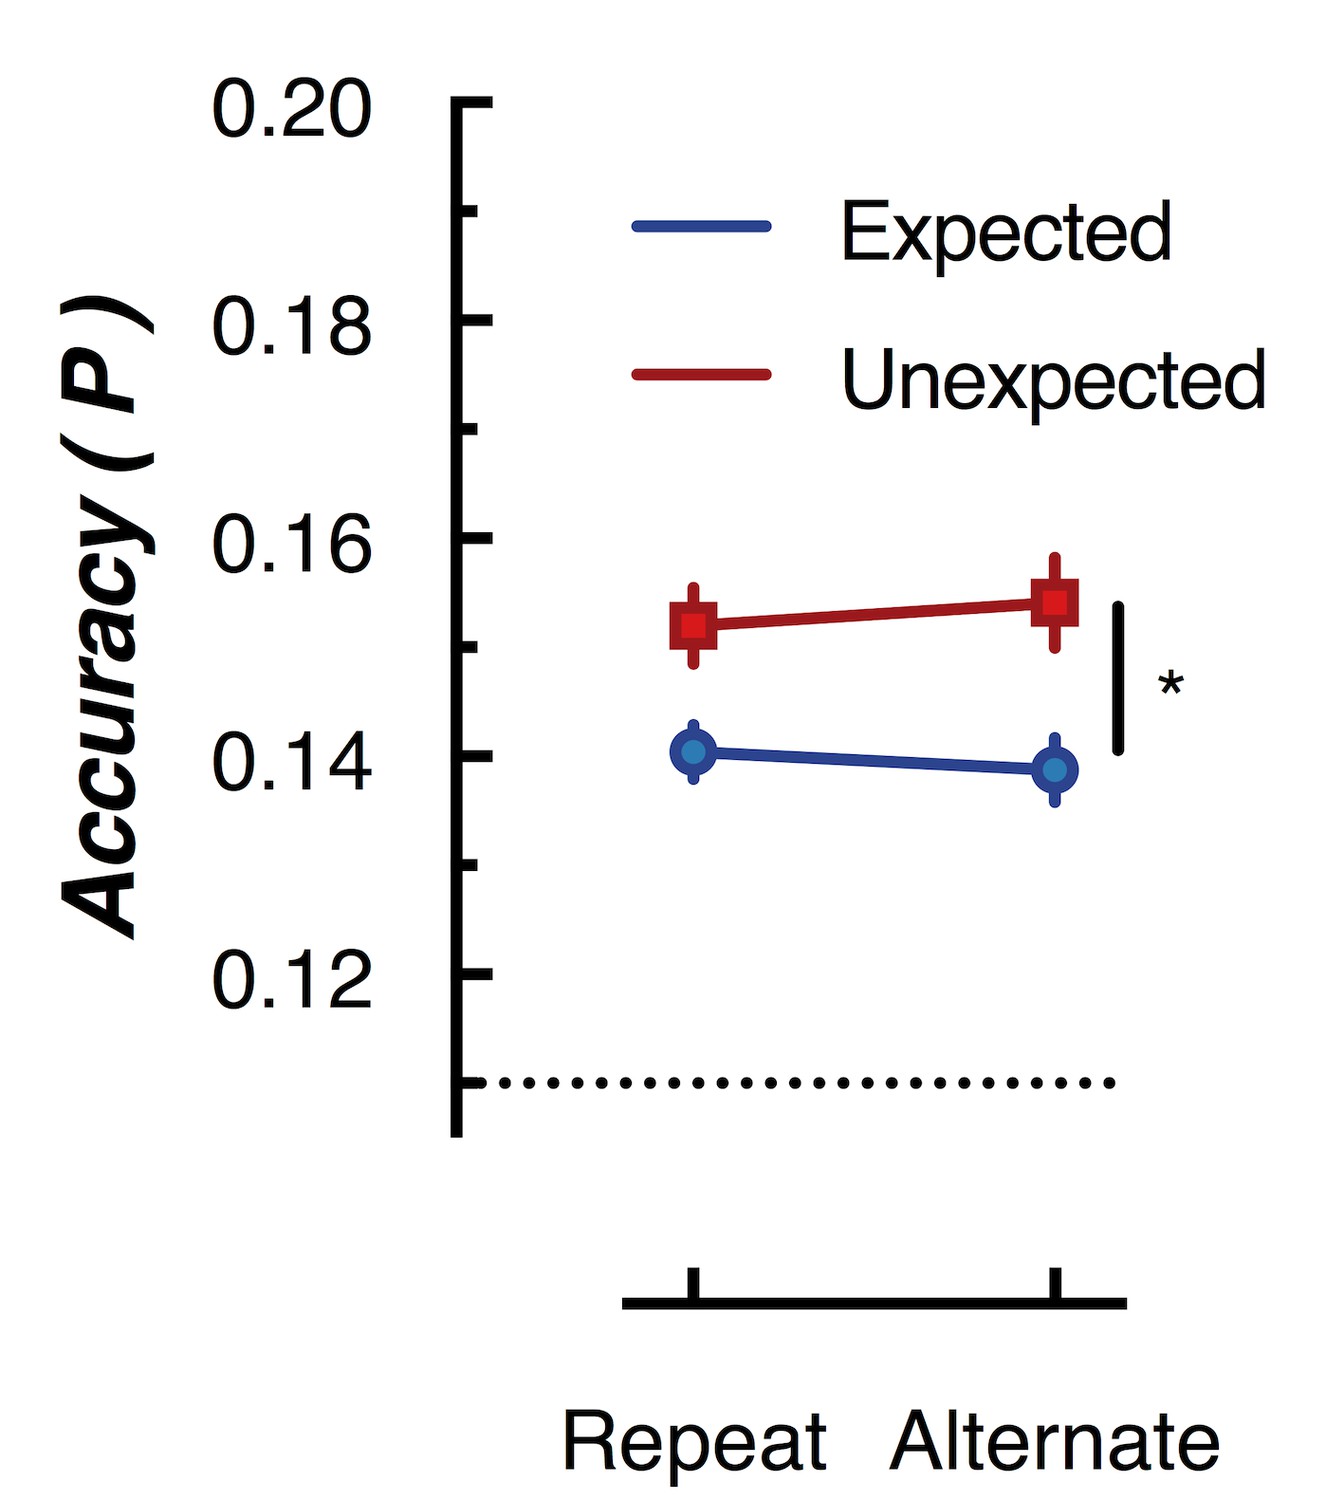
Peak (naive Bayes) classification accuracy of the presented grating orientation for expected and unexpected conditions.
The dotted line indicates chance performance (1/9 orientations). The error bars indicate ±1 standard error of the mean.
Figure 6
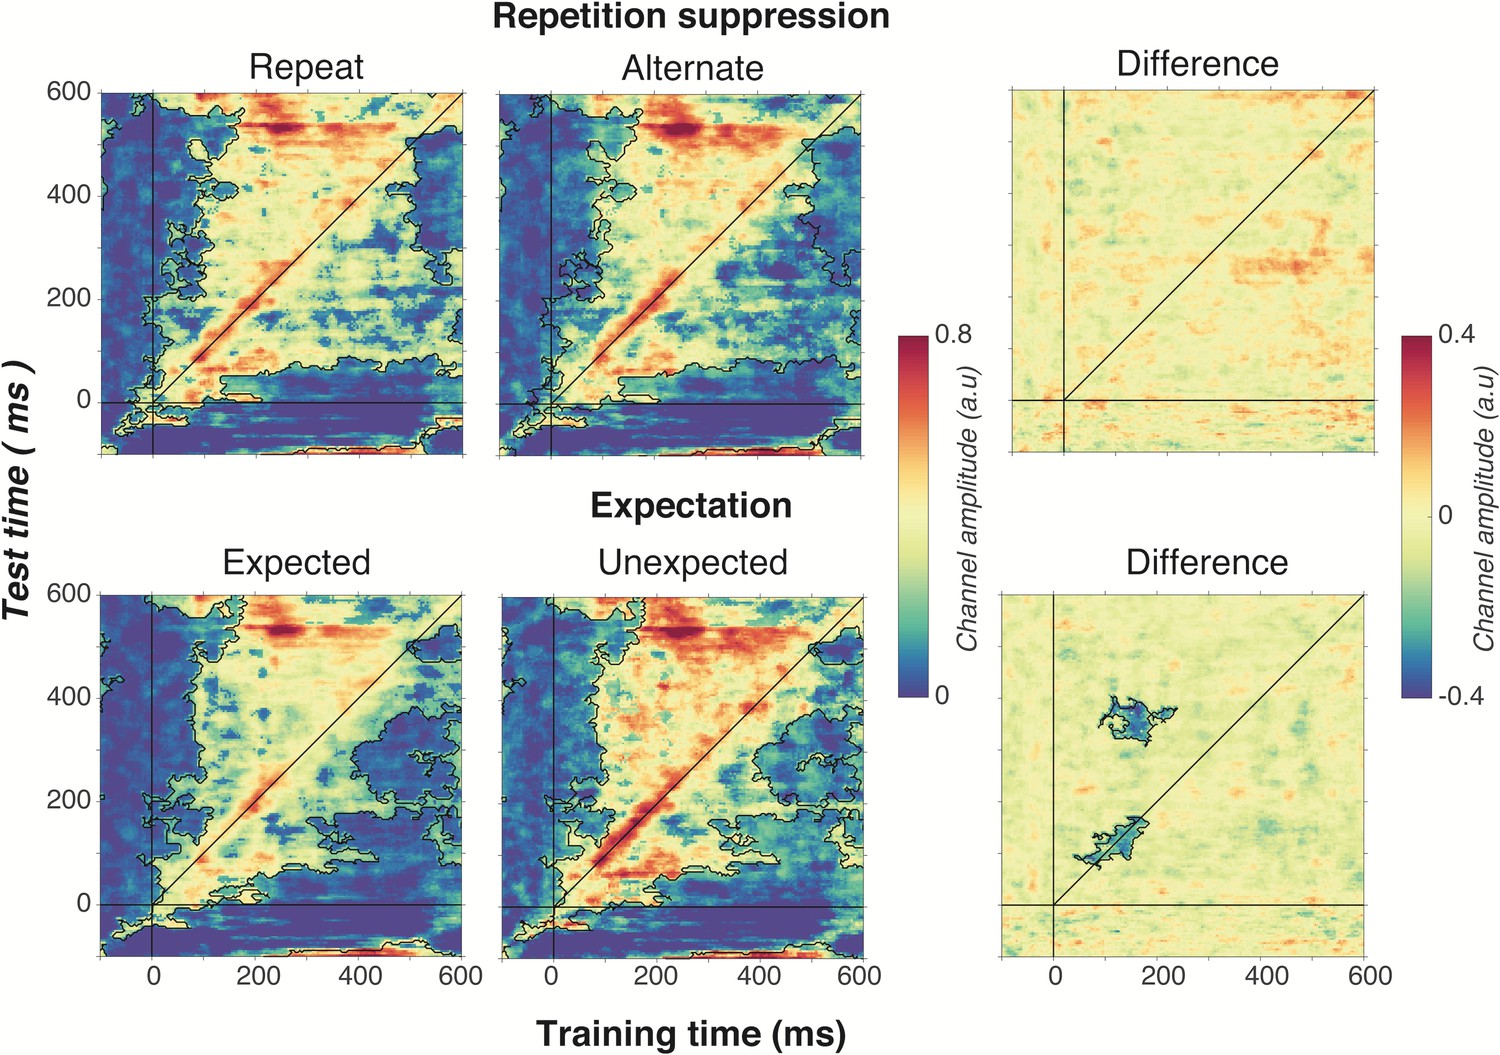
Cross-temporal generalisation of the forward encoding model based on grating orientations for the main effects of repetition suppression (upper panels) and expectation (lower panels).
The maps have been thresholded (indicated by opacity) to show clusters (black outlines) of significant orientation selectivity (permutation testing, cluster threshold p < 0.05, corrected cluster statistic p < 0.05, 5000 permutations). The difference between the conditions is shown in the right-hand column (permutation testing, cluster threshold p < 0.05, corrected cluster statistic p < 0.05). Opacity and outlines indicate significant differences.
Figure 7
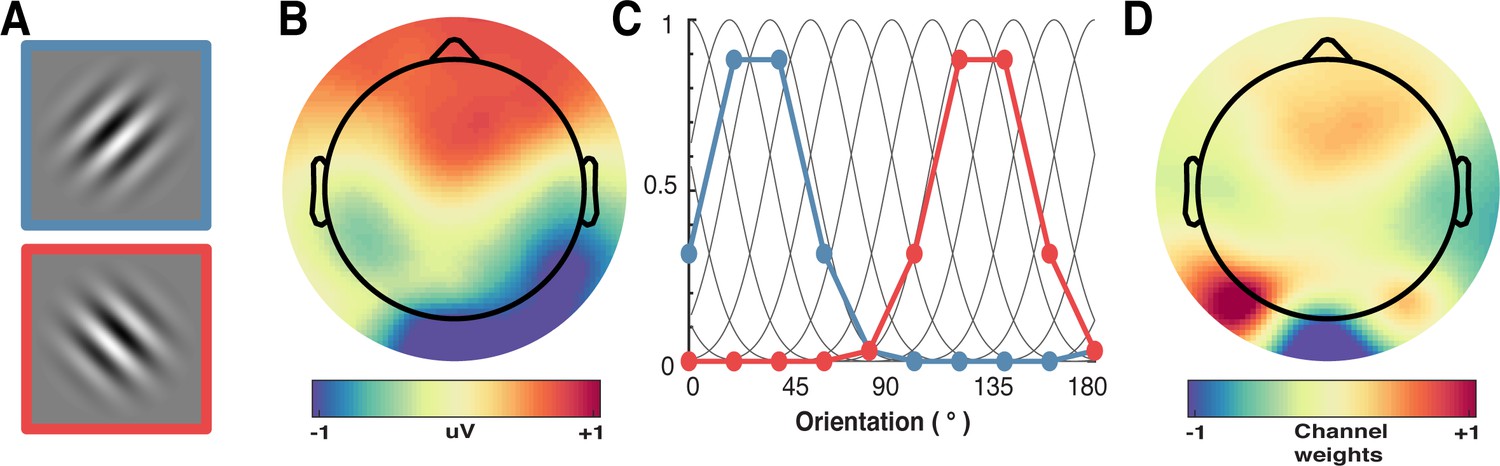
A schematic of the forward-encoding approach applied to EEG activity.
(A) Participants viewed individual gratings at fixation, each with a specific orientation. (B) Neural activity evoked by each grating was measured over the entire scalp. (C) Evoked neural responses were convolved with canonical orientation-selective functions (grey lines in C) to determine coefficients for the different orientations (coloured dots and lines, which match the colours of the outlined gratings in A). These coefficients were then used to generate a regression matrix. (D) General linear modelling was used on a subset of training trials to generate weights for each channel. These weights were inverted and simultaneously applied to an independent test set of data to recover orientation selectivity in the EEG activity. As EEG activity has high temporal resolution, we can apply the procedure to many epochs following stimulus presentation to determine the temporal dynamics of orientation processing (see Figure 3).
Author response image 1
Videos
Video 1
Example of a stimulus sequence of Gabors in a typical alternating block.
https://doi.org/10.7554/eLife.33123.003Additional files
-
Transparent reporting form
- https://doi.org/10.7554/eLife.33123.011
Download links
A two-part list of links to download the article, or parts of the article, in various formats.
Downloads (link to download the article as PDF)
Open citations (links to open the citations from this article in various online reference manager services)
Cite this article (links to download the citations from this article in formats compatible with various reference manager tools)
Prediction error and repetition suppression have distinct effects on neural representations of visual information
eLife 7:e33123.
https://doi.org/10.7554/eLife.33123


