R-spondins can potentiate WNT signaling without LGRs
- Stanford University School of Medicine, United States
Figures
Figure 1 with 1 supplement
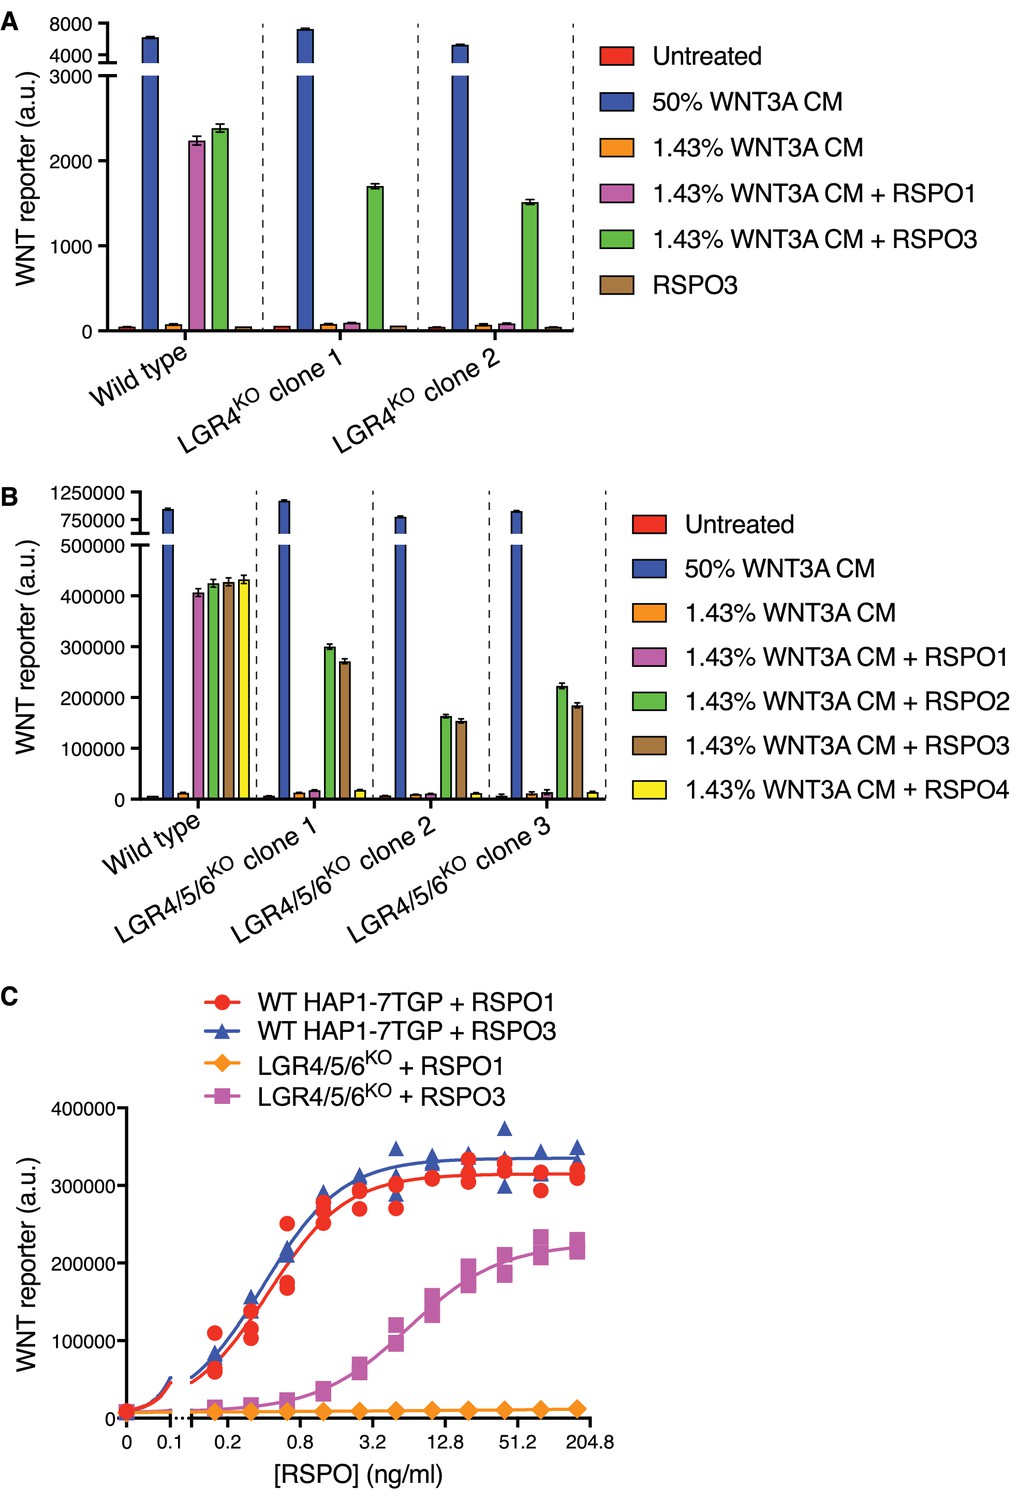
RSPO2 and RSPO3 can potentiate WNT signaling in the absence of LGR4, LGR5 and LGR6.
(A) WNT reporter fluorescence (median ±standard error of the median (SEM) from 10,000 cells) for WT HAP1-7TGP and two distinct LGR4KO clonal cell lines (determined by genotyping, Supplementary file 1) following treatment with the indicated combinations of WNT3A conditioned media (CM) and untagged, recombinant RSPO1 or RSPO3 (both at 20 ng/ml). All cell lines responded similarly to a saturating dose of WNT3A, demonstrating an intact downstream signaling response. (B) WNT reporter fluorescence (median ±SEM from 10,000 cells) for WT HAP1-7TGP and three distinct LGR4/5/6KO clonal cell lines (Supplementary file 1) treated with the indicated combinations of WNT3A CM and various RSPOs. RSPO1, RSPO2 and RSPO3 were used at 40 ng/ml and RSPO4 at 400 ng/ml, concentrations that produced equivalent responses in WT cells. (C) Dose-response curves for RSPO1 and RSPO3 in WT HAP1-7TGP and LGR4/5/6KO cells in the presence of 1.43% WNT3A CM. Each symbol represents the median WNT reporter fluorescence from a single well and measurements from three independently treated wells are shown for each RSPO concentration. The curves were fitted as described in Materials and methods.
Figure 1—figure supplement 1
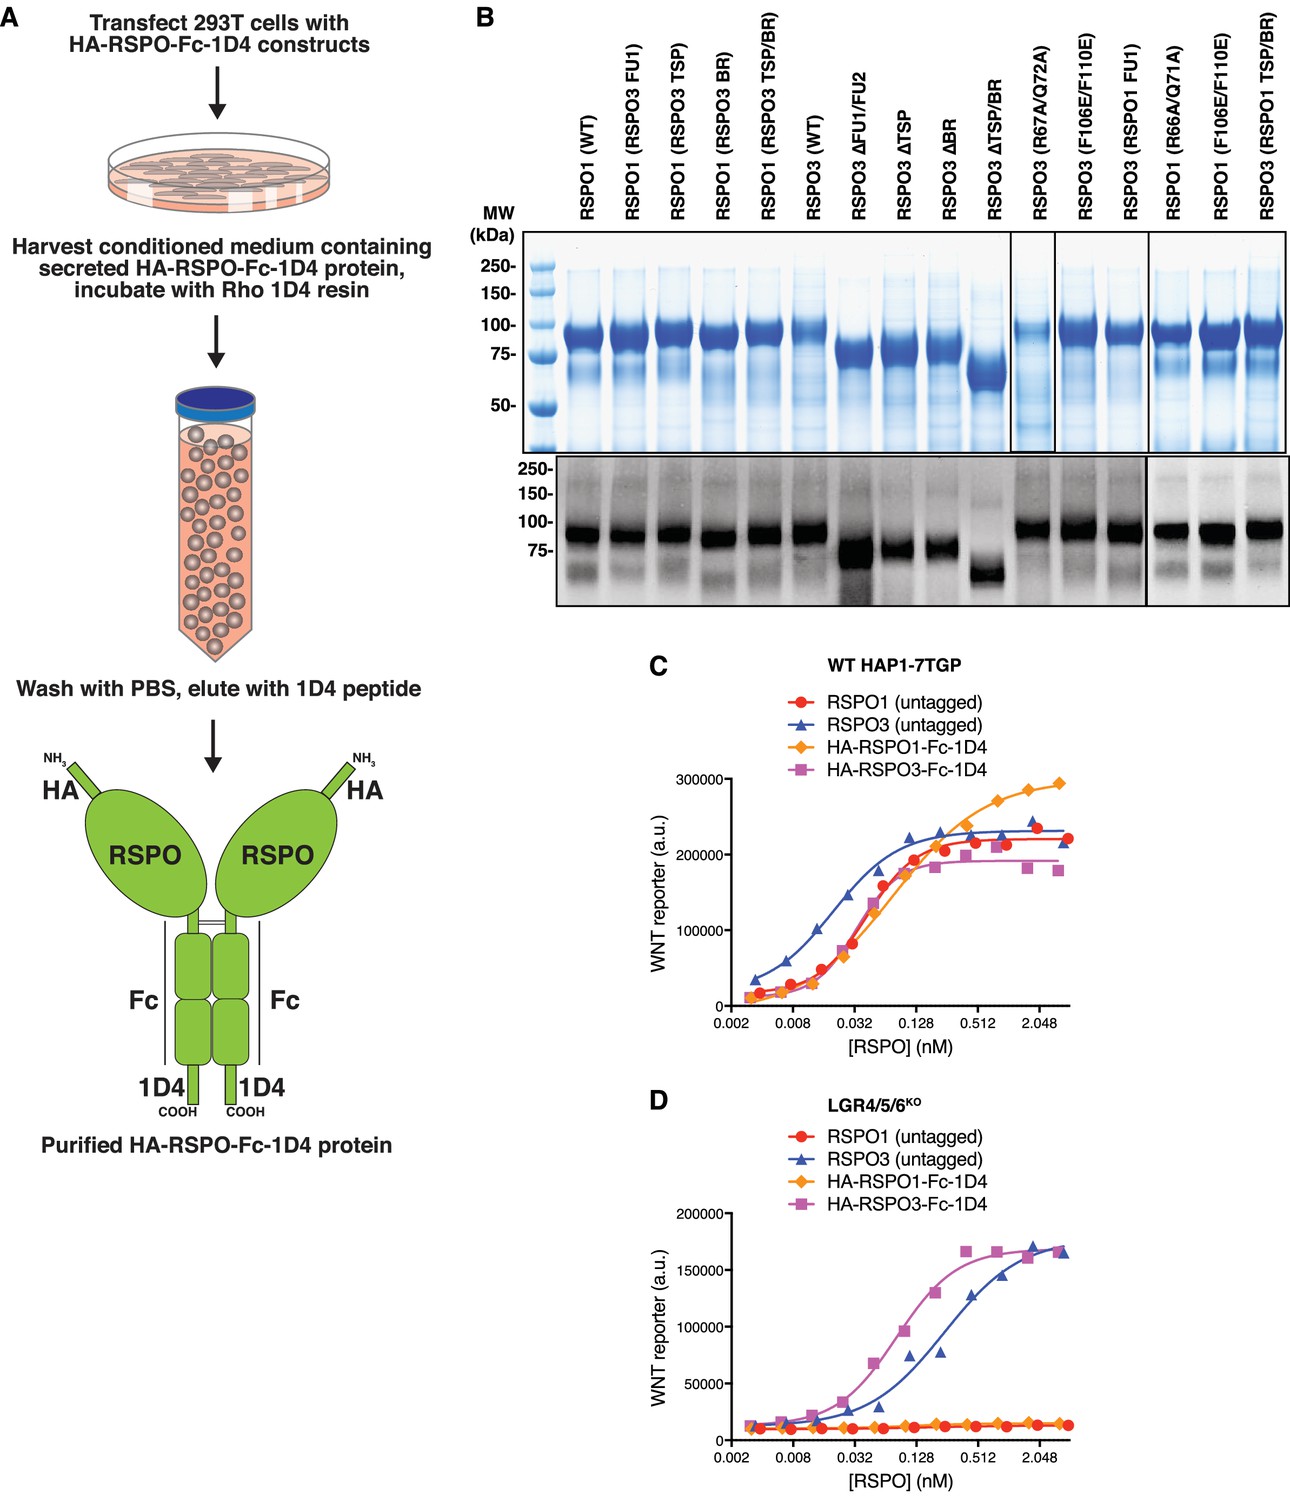
Immuno-affinity purification and functional characterization of recombinant, tagged RSPO proteins used in this study.
(A) Summary of a new experimental strategy for the rapid, one-step purification of secreted WT and mutant RSPO proteins containing an HA epitope tag at the N-terminus and a dual Fc-1D4 tag at the C-terminus. The Fc fusion stabilized the various RSPO mutants used in the study, the 1D4 tag enabled immuno-affinity purification under native conditions, and the HA tag allowed immunoblotting to ensure that each RSPO ligand was produced as a full-length species. See Materials and methods for details. (B) Equal volumes (13.5 μl) of the final eluate for each purified RSPO protein were resolved by polyacrylamide gel electrophoresis (PAGE) and stained with coomassie (top panel). Proteins were quantified by fluorimetry using the Licor Odyssey scanner and then equal mass amounts of each protein were analyzed by immunoblotting against the HA tag (bottom panels). Molecular weight standards (in kilodaltons (kDa)) are shown and/or indicated to the left. (C and D) Dose-response curves comparing untagged RSPOs to RSPOs tagged with HA and Fc-1D4 tags (shown in B) in WT HAP1-7TGP (C) and LGR4/5/6KO (D) cells, in the presence of 1.43% WNT3A CM. Each symbol represents the median WNT reporter fluorescence from 5000 cells.
Figure 2

Domains of RSPO3 required for LGR-independent signaling.
(A) Schematic representation of human WT and mutant RSPO1 (salmon) and RSPO3 (violet) proteins produced and purified as described in Materials and methods and Figure 1—figure supplement 1A. The N-terminal HA and C-terminal Fc and 1D4 tags present in all constructs are not shown. Amino acid numbers for human RSPO1 and RSPO3 (UniProt accession number Q2MKA7 and Q9BXY4, respectively) are indicated below and arrows show mutations made in the FU1 and FU2 domains. Polypeptide lengths are drawn to scale. (B and E) Fold-induction in WNT reporter fluorescence (over 1.43% WNT3A CM alone) caused by treatment of WT HAP1-7TGP (light blue and blue bars) and LGR4/5/6KO (salmon and red bars) cells with two concentrations of purified RSPO proteins. Each circle indicates the fold-induction for a single well, calculated as the median WNT reporter fluorescence from each well treated with 1.43% WNT3A CM and RSPO, divided by the average of the median WNT reporter fluorescence from triplicate wells treated with 1.43% WNT3A CM alone. Bars and error bars indicate the average ±SD of triplicate wells. Significance was determined as described in Materials and methods. (C, D, F, G) Dose-response curves for the indicated purified RSPO proteins in WT HAP1-7TGP (C, F) and LGR4/5/6KO (D, G) cells, in the presence of 1.43% WNT3A CM. Each symbol represents the median WNT reporter fluorescence from 5000 cells. In F and G, RSPO3 ΔTSP/BR was tested with and without the dimerizing Fc tag.
Figure 3
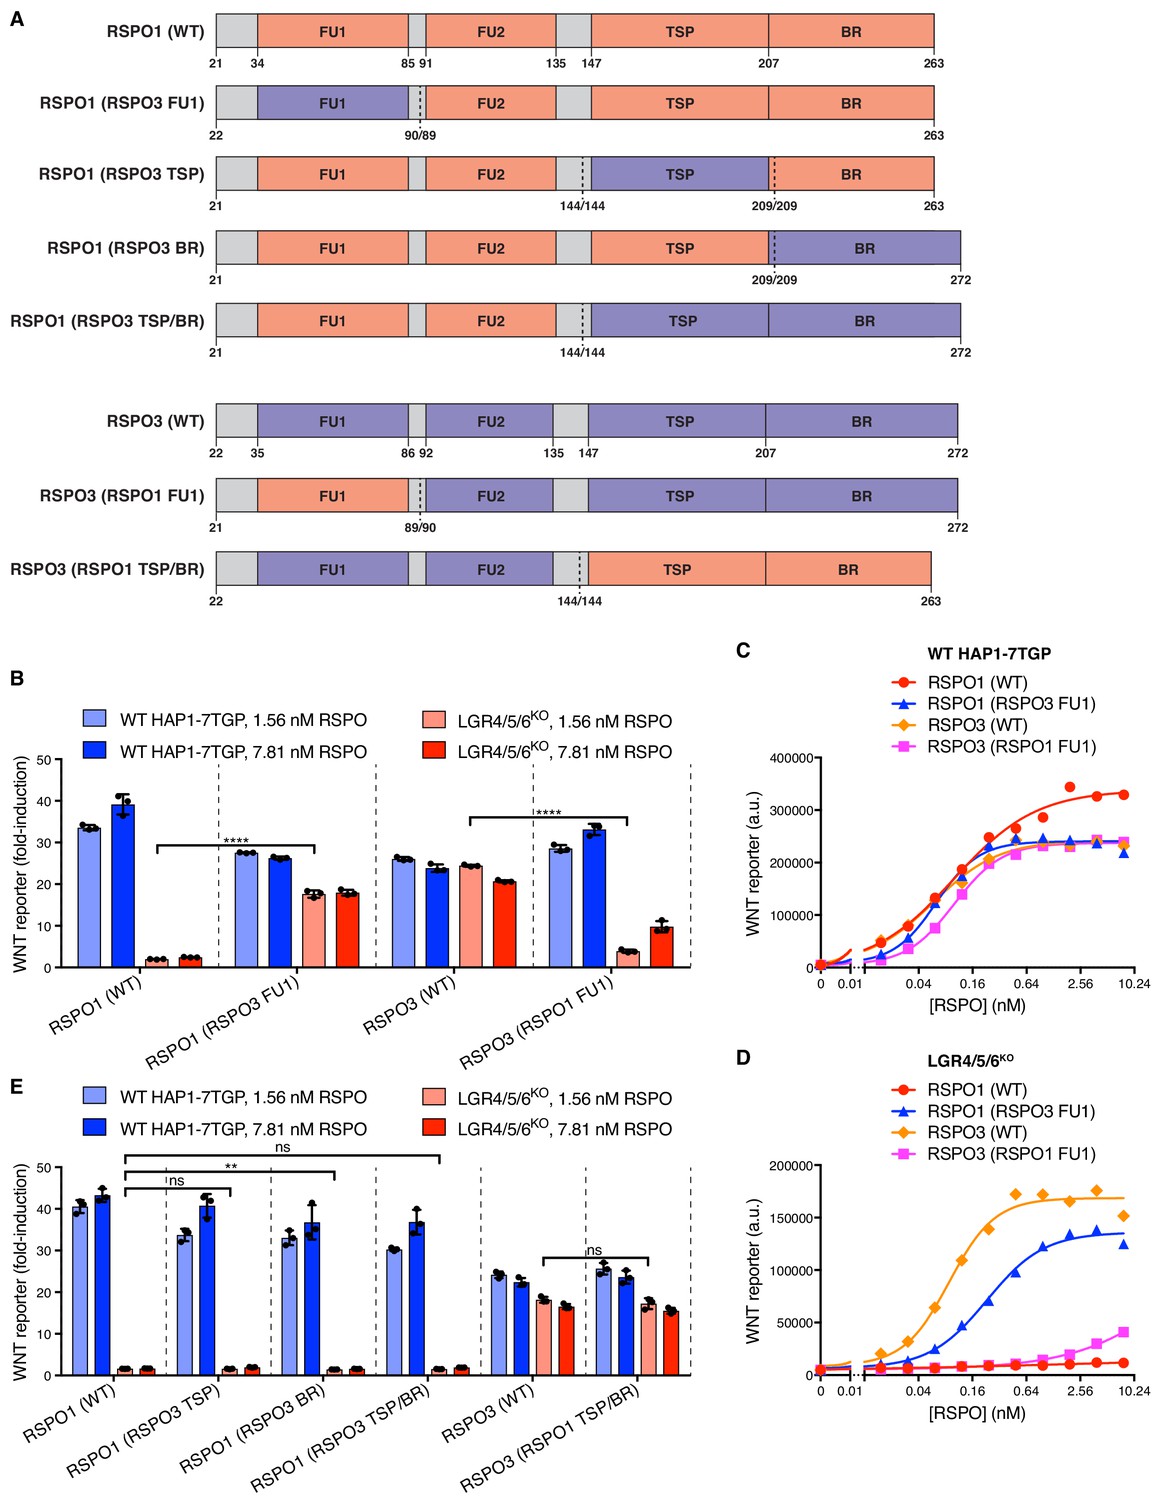
Domains of RSPO3 sufficient to confer the capacity to signal without LGRs.
(A) Schematic representation of human WT and chimeric RSPO1 (salmon) and RSPO3 (violet) proteins, depicted as in Figure 2A. Vertical dotted lines indicate the sites at which swaps were made. Each swap was made at a conserved amino acid indicated under each construct (the amino acid numbers on the left and right of the slash correspond to the proteins depicted on the left and right of the dotted line, respectively). (B and E) Fold-induction in WNT reporter fluorescence (over 1.43% WNT3 CM alone) as described in Figure 2B, E. (C and D) Dose-response curves for the indicated purified RSPO proteins in WT HAP1-7TGP (C) and LGR4/5/6KO (D) cells, in the presence of 1.43% WNT3A CM. Each symbol represents the median WNT reporter fluorescence from 5000 cells.
Figure 4 with 1 supplement
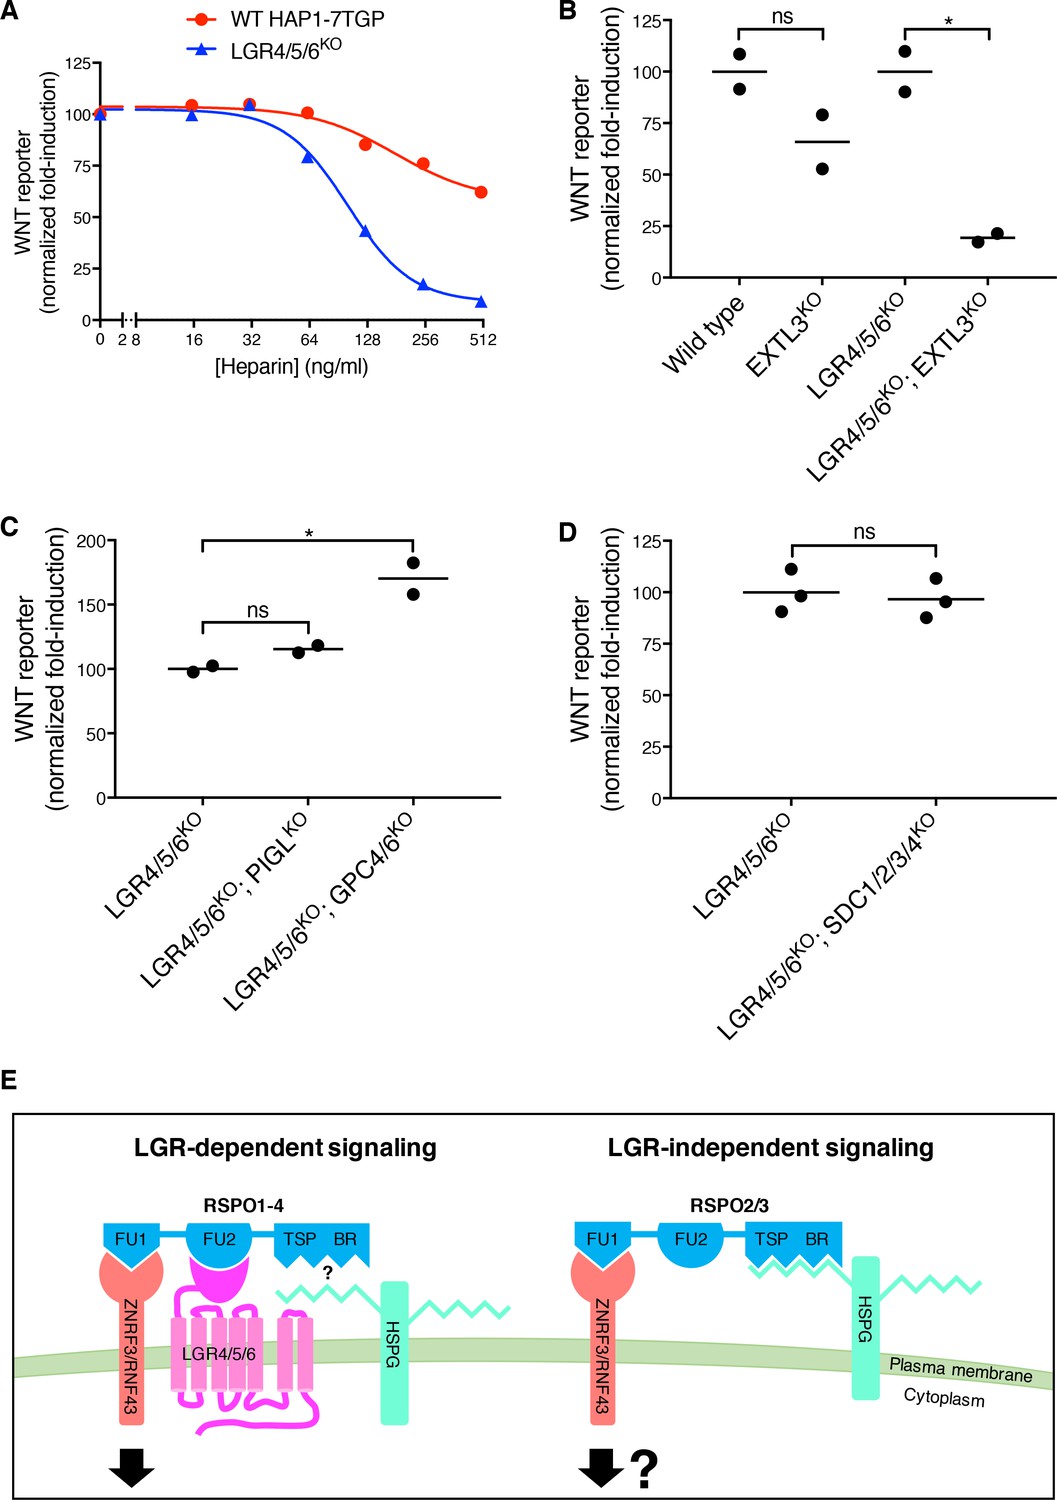
LGR-independent signaling by RSPO3 requires heparan sulfate proteoglycans.
(A) WNT reporter induction in WT HAP1-7TGP and LGR4/5/6KO cells treated with 1.43% WNT3A CM, 2 nM untagged RSPO3 and the indicated concentrations of heparin. For each heparin concentration, the fold-induction (over 1.43% WNT3A CM alone) by RSPO3 was calculated from the median WNT reporter fluorescence from 5000 cells and is expressed as percentage of the fold-induction in the absence of heparin to facilitate comparisons. (B–D) WNT reporter induction following treatment of the indicated cell lines with 2.78% WNT3A CM -/+20 ng/ml untagged RSPO3, except for LGR4/5/6KO; PIGLKO and LGR4/5/6KO; GPC4/6KO cells, which were treated with 11.1% WNT3A CM -/+20 ng/ml untagged RSPO3 (since depletion of PIGL or of GPC4 and GPC6 reduces signaling at low doses of WNT (Lebensohn et al., 2016), different WNT3A CM concentrations were used to achieve comparable signaling responses to WNT3A alone in all cell lines, so that potentiation by RSPO3 could be compared directly). The fold-induction (over WNT3A CM alone) by RSPO3 was calculated from the average of the median WNT reporter fluorescence from duplicate (C) or triplicate (B and D) wells and is expressed as percentage of the average fold-induction for WT HAP1-7TGP (left two genotypes in B) or LGR4/5/6KO (right two genotypes in B and all genotypes in C and D) cells to facilitate comparisons. Each circle represents a distinct clonal cell line (Supplementary file 1) and the average of data from two or three clonal cell lines for each genotype is indicated by a horizontal line. Significance was determined as described in Materials and methods. (E) Proposed models for LGR-dependent and LGR-independent signaling by RSPOs. See text for details.
Figure 4—figure supplement 1
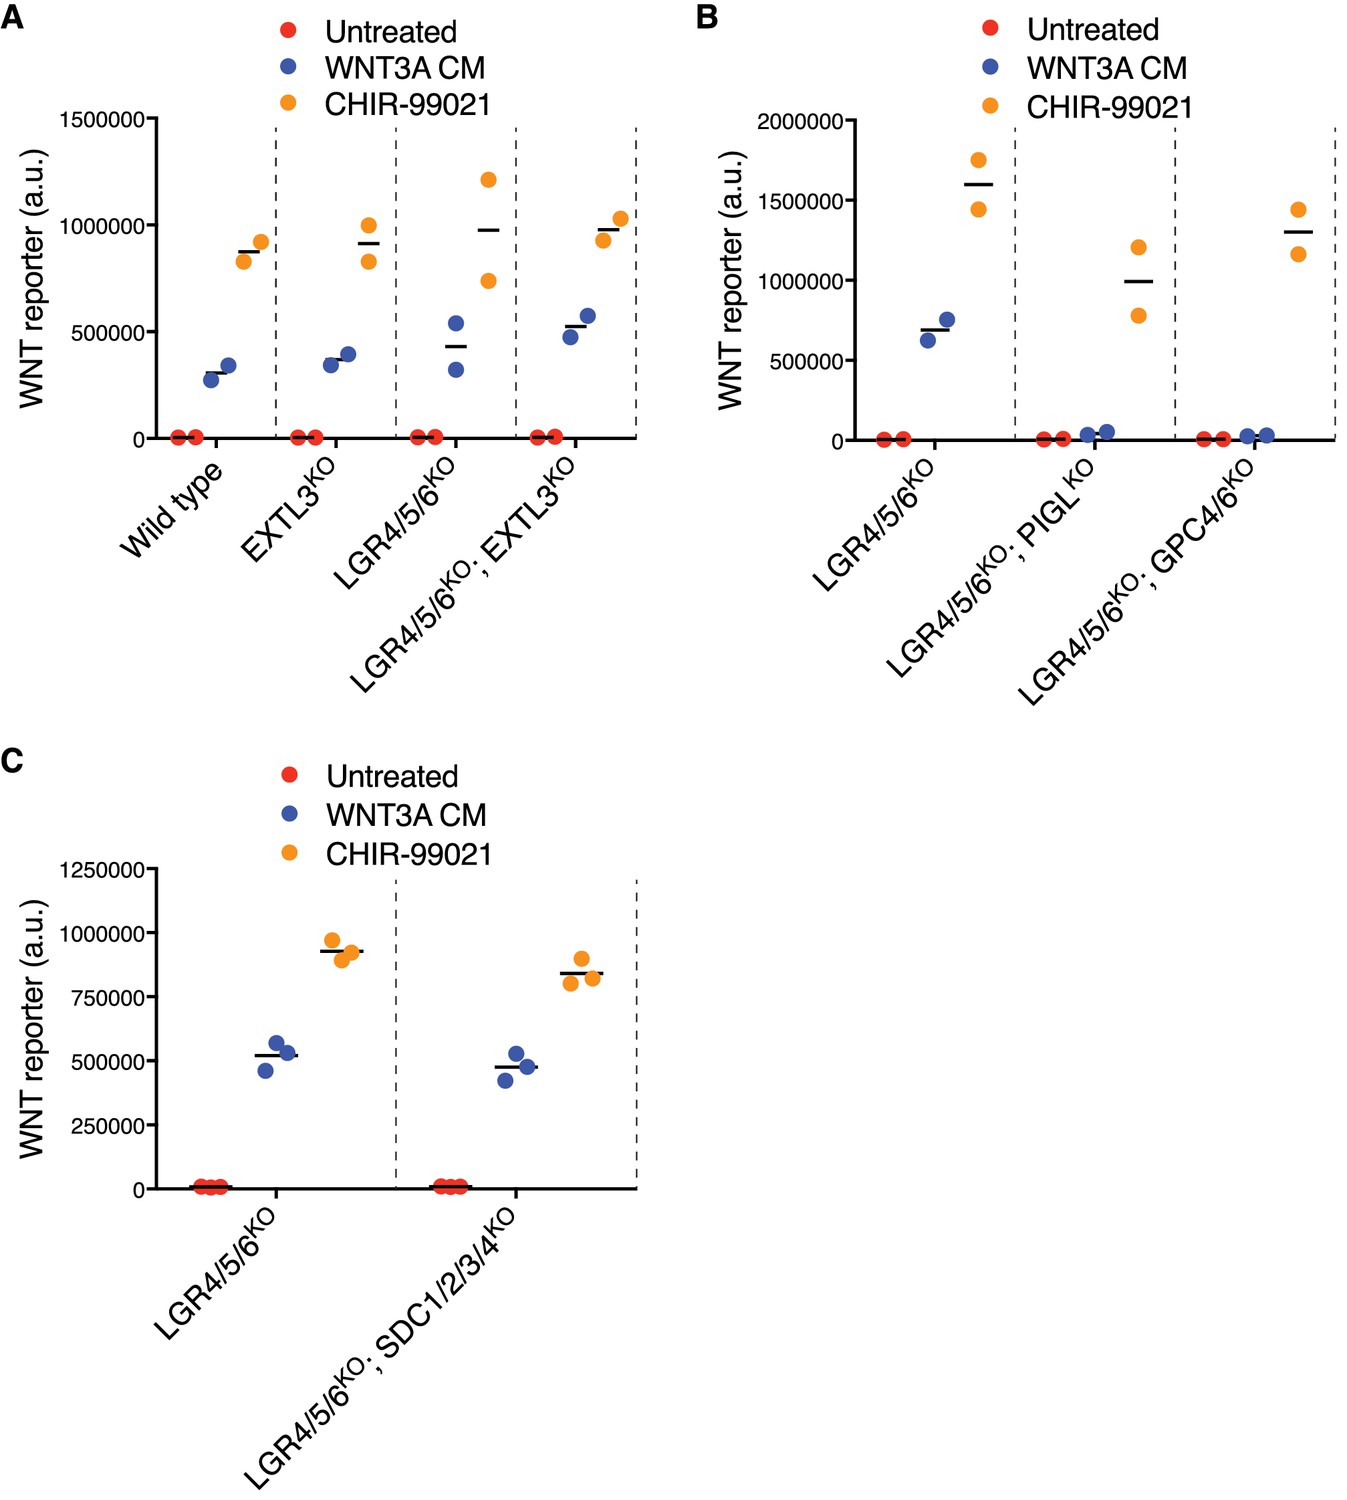
LGR-independent signaling by RSPO3 requires heparan sulfate proteoglycans.
(A–C) WNT reporter fluorescence (average of the meidan from duplicate (B) or triplicate (A and C) wells) for the same clonal cell lines depicted in Figure 4B–D. Where indicated, cells were treated with a sub-saturating concentration (11.1%) of WNT3A CM or with 10 μM of the GSK3 inhibitor CHIR-99021. Each circle represents a unique clonal cell line and the average of data from two or three independent clonal cell lines for each genotype is indicated by a horizontal line.
Tables
Table 1
Relative gene expression level in HAP1 cells of selected genes discussed in this work.
RPKM (Reads Per Kilobase of transcript per Million mapped reads) values from duplicate RNAseq datasets described previously (NCBI GEO accession number GSE75515, https://www.ncbi.nlm.nih.gov/geo/), obtained from two different passages of WT HAP1 cells (Dubey et al., 2016). Groups of paralogues or genes with redundant function are shaded in alternating colors to facilitate comparisons.
| Gene | RPKM | ||
|---|---|---|---|
| Replicate 1 | Replicate 2 | Average | |
| LGR4 | 160.61 | 174.69 | 167.65 |
| LGR5 | 0.02 | 0.00 | 0.01 |
| LGR6 | 0.02 | 0.00 | 0.01 |
| ZNRF3 | 30.9 | 33.3 | 32.1 |
| RNF43 | 0.12 | 0.08 | 0.1 |
| GPC1 | 49.55 | 47.53 | 48.54 |
| GPC2 | 4.17 | 4.79 | 4.48 |
| GPC3 | 170.22 | 144.37 | 157.29 |
| GPC4 | 209.39 | 229.86 | 219.63 |
| GPC5 | 0.1 | 0.1 | 0.1 |
| GPC6 | 13.88 | 14.90 | 14.39 |
| SDC1 | 51.37 | 47.88 | 49.63 |
| SDC2 | 11.42 | 9.2 | 10.31 |
| SDC3 | 43.58 | 50.64 | 47.11 |
| SDC4 | 8.16 | 8.21 | 8.18 |
Additional files
-
Supplementary file 1
Description of engineered cell lines used in this study.
Clonal cell lines derived from HAP1-7TGP in which a single or multiple genes were targeted using CRISPR/Cas9 are described in two separate spreadsheets labeled accordingly. When more than one clonal cell line was generated targeting the same gene or genes, the ‘Cell Line Name’ column indicates the generic name used throughout the manuscript to describe the genotype and the ‘Clone #' column identifies distinct individual clones. The figures in which each clone was used are also indicated. The ‘CRISPR guide’ column indicates the name of the guide used, which is the same as that of the oligonucleotides encoding sgRNAs (see Materials and methods and Supplementary file 3). The ‘Genomic Sequence’ column shows 80 nucleotides of genomic sequence (5’ relative to the gene is to the left) surrounding the target site; when two adjacent sites were targeted within the same gene, 80 nucleotides of genomic sequence surrounding each target site are shown and the number of intervening base pairs that are not shown between the two sites is indicated in parenthesis. Each group of clonal cell lines made using the same CRISPR guides is separated by a horizontal spacer and the ‘Genomic Sequence’ column is headlined by the reference WT genomic sequence (obtained from RefSeq). The guide sequence is colored blue and the site of the double strand cut made by Cas9 is between the two underlined bases. Sequencing results for individual clones are indicated below the reference sequence. Rare differences between the reference RefSeq sequence and the sequencing result obtained from HAP1-7TGP clones, as well as any undetermined sequences, are indicated in green. Some clones obtained following transfection with the indicated sgRNAs and single-cell sorting were found to be WT at the target site or sites; these are indicated as such and were used as controls. For mutant clones, mutated nucleotides are colored red (dashes represent deleted nucleotides, ellipses are used to indicate that a deletion continues beyond the 80 nucleotides of sequence shown and large insertions are indicated in brackets) and the nature of the mutation, the resulting genotype and any pertinent observations are also described. For clones in which multiple genes were targeted, the CRISPR guide (or pair of guides) used to target each gene as well as the genomic sequence, mutation, genotype and observations pertaining to each of the targeted genes are designated ‘1’, ‘2’, ‘3’ and so on in the column headings and are shown under horizontal spacers of different colors.
- https://doi.org/10.7554/eLife.33126.009
-
Supplementary file 2
Nucleotide sequences of RSPO1 and RSPO3 WT, mutant and chimeric constructs used in this study.
The name and length of each construct is indicated. Lowercase sequences overlap the sequence upstream of the unique AgeI site and downstream of the unique KpnI site in the pHLsec-HA-Tev-Fc-Avi-1D4 vector. Uppercase sequences encode human RSPO1 and RSPO3 WT, mutant and chimeric constructs. For point mutants, mutated codons are underlined.
- https://doi.org/10.7554/eLife.33126.010
-
Supplementary file 3
List of oligonucleotides and primers used to generate and characterize clonal cell lines engineered using CRISPR/Cas9.
The names and sequences of pairs of oligonucleotides encoding sgRNAs (which were cloned into pX330 or pX333) are shown in the first and second columns, respectively. The names and sequences of pairs of PCR primers used to amplify corresponding genomic regions flanking sgRNA target sites are shown in the third and fourth columns, respectively. The names and sequences of primers used to sequence the amplified target sites are shown in the fifth and sixth columns, respectively.
- https://doi.org/10.7554/eLife.33126.011
-
Transparent reporting form
- https://doi.org/10.7554/eLife.33126.012
Download links
A two-part list of links to download the article, or parts of the article, in various formats.
Downloads (link to download the article as PDF)
Open citations (links to open the citations from this article in various online reference manager services)
Cite this article (links to download the citations from this article in formats compatible with various reference manager tools)
R-spondins can potentiate WNT signaling without LGRs
eLife 7:e33126.
https://doi.org/10.7554/eLife.33126


