Multimodal cell tracking from systemic administration to tumour growth by combining gold nanorods and reporter genes
- University of Liverpool, United Kingdom
Figures
Figure 1 with 1 supplement
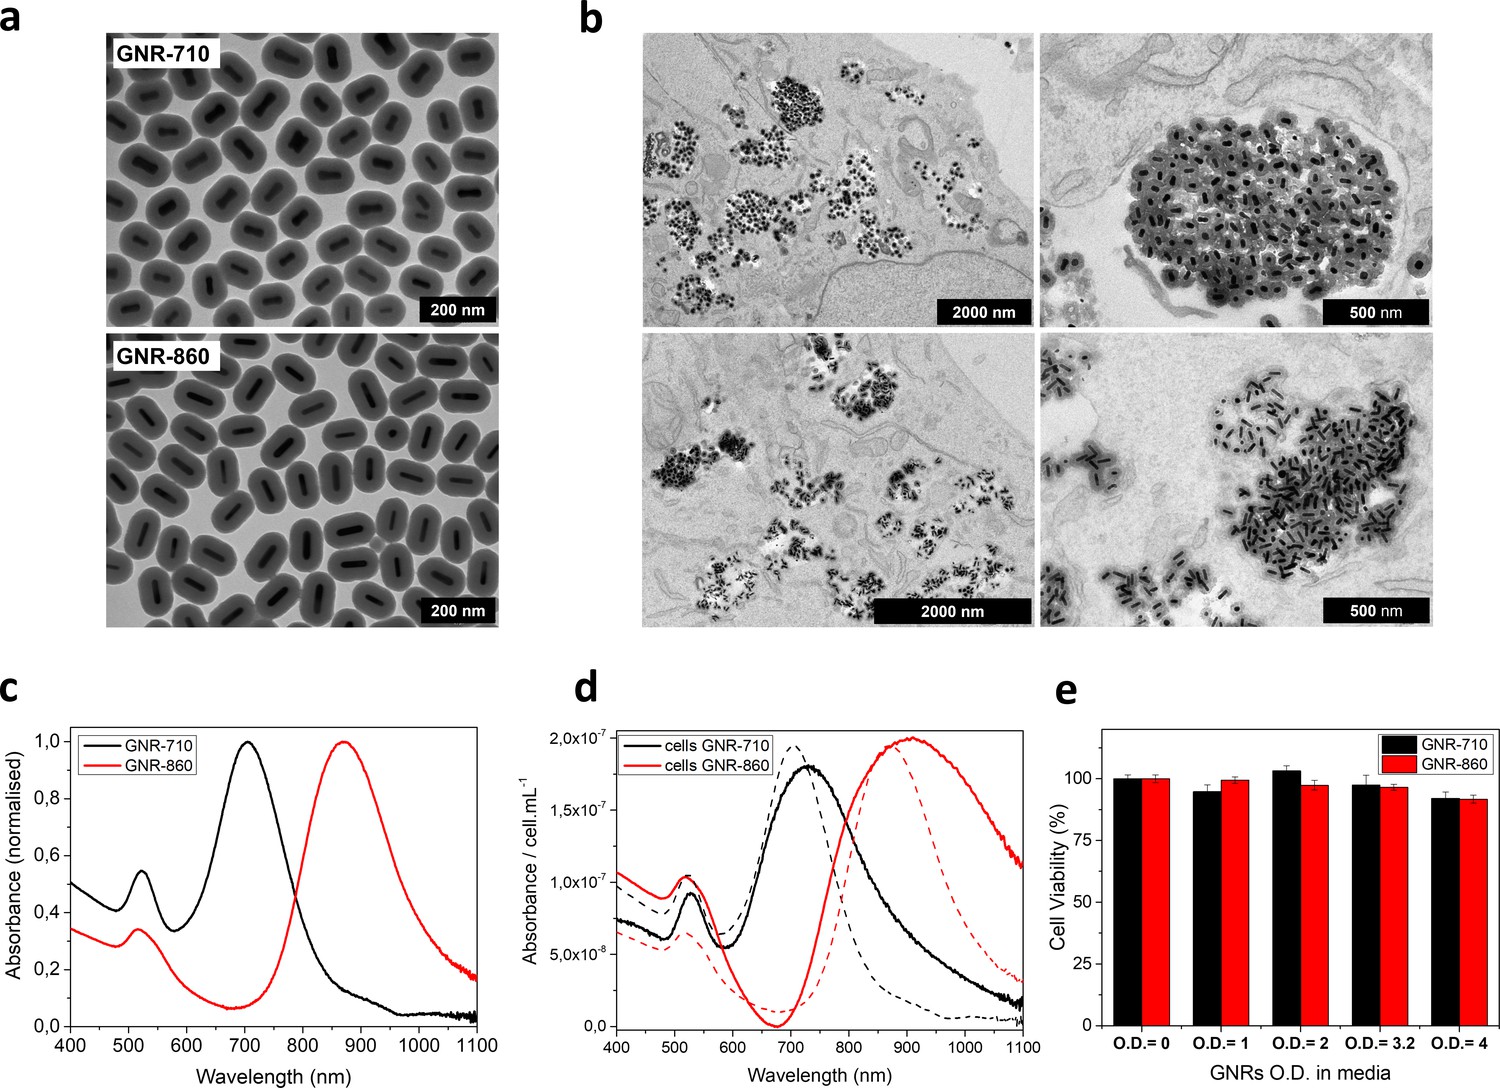
GNR characterization and cell labelling.
(a) Representative transmission electron microscopy (TEM) pictures of GNR-710 (top) and GNR-860 (bottom). (b) TEM pictures of GNR-710 (top panels) and GNR-860 (bottom panels) inside cells. In both cases, the silica shell provides steric hindrance to minimise plasmon coupling in cellular vesicles. (c) Vis-NIR spectrum of GNRs in solution. (d) Vis-NIR spectrum of cells labelled with the corresponding GNRs. Dashed lines correspond to GNRs in solution. (e) Cell viability at different optical densities. Viability was assessed in triplicate and results are given as %±SD relative to cells that were cultured without GNRs.
Figure 1—figure supplement 1
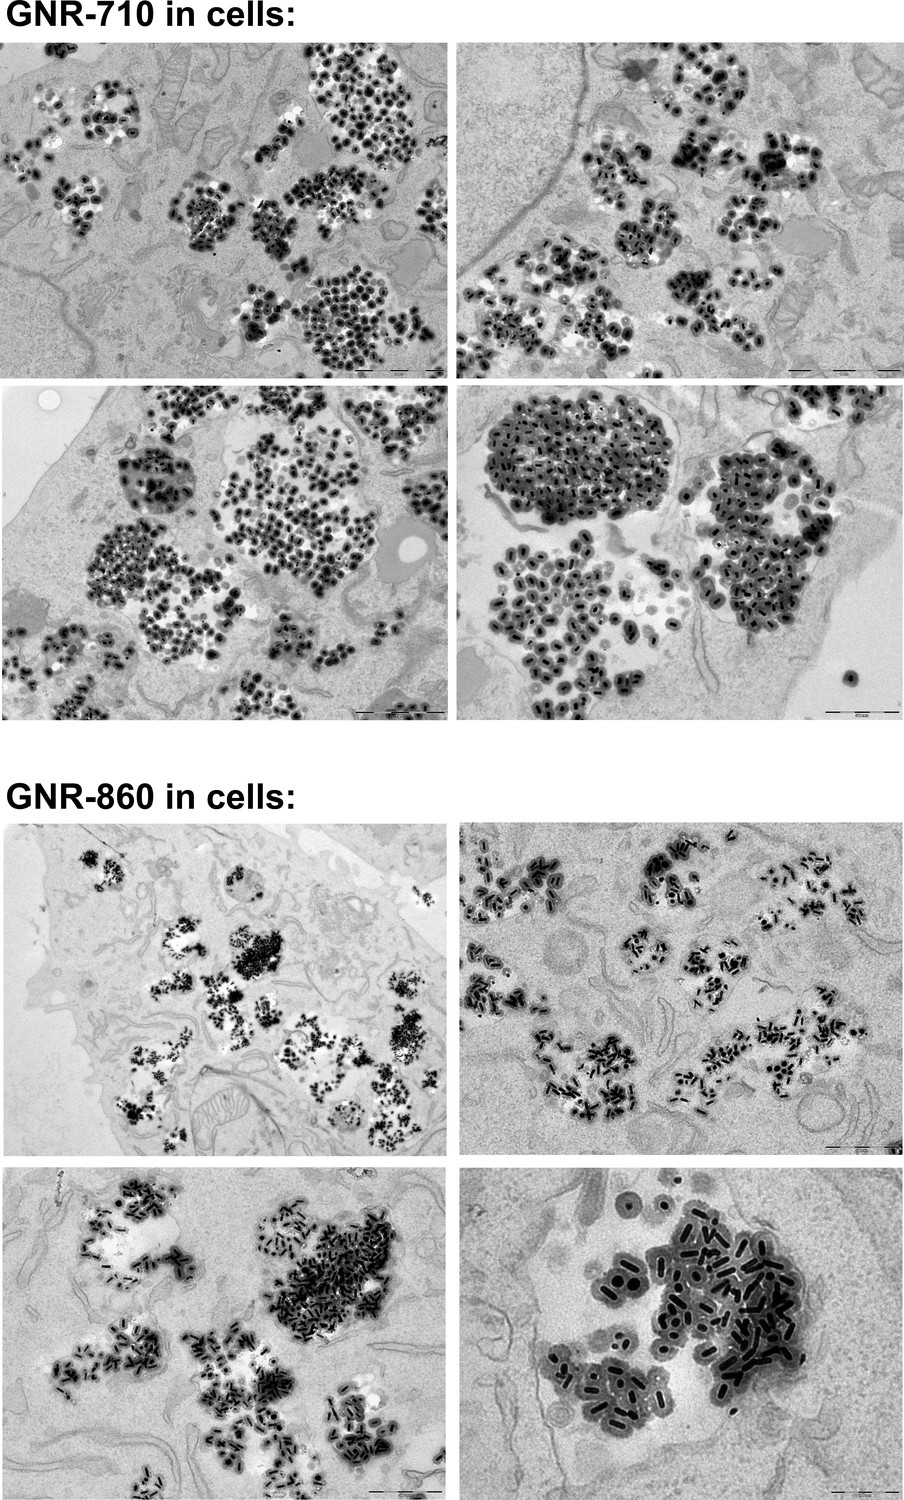
Additional images of GNR-710 and GNR-860 uptake by MSCs.
Silica shell provided steric hindrance to minimise plasmon coupling effects.
Figure 2 with 1 supplement
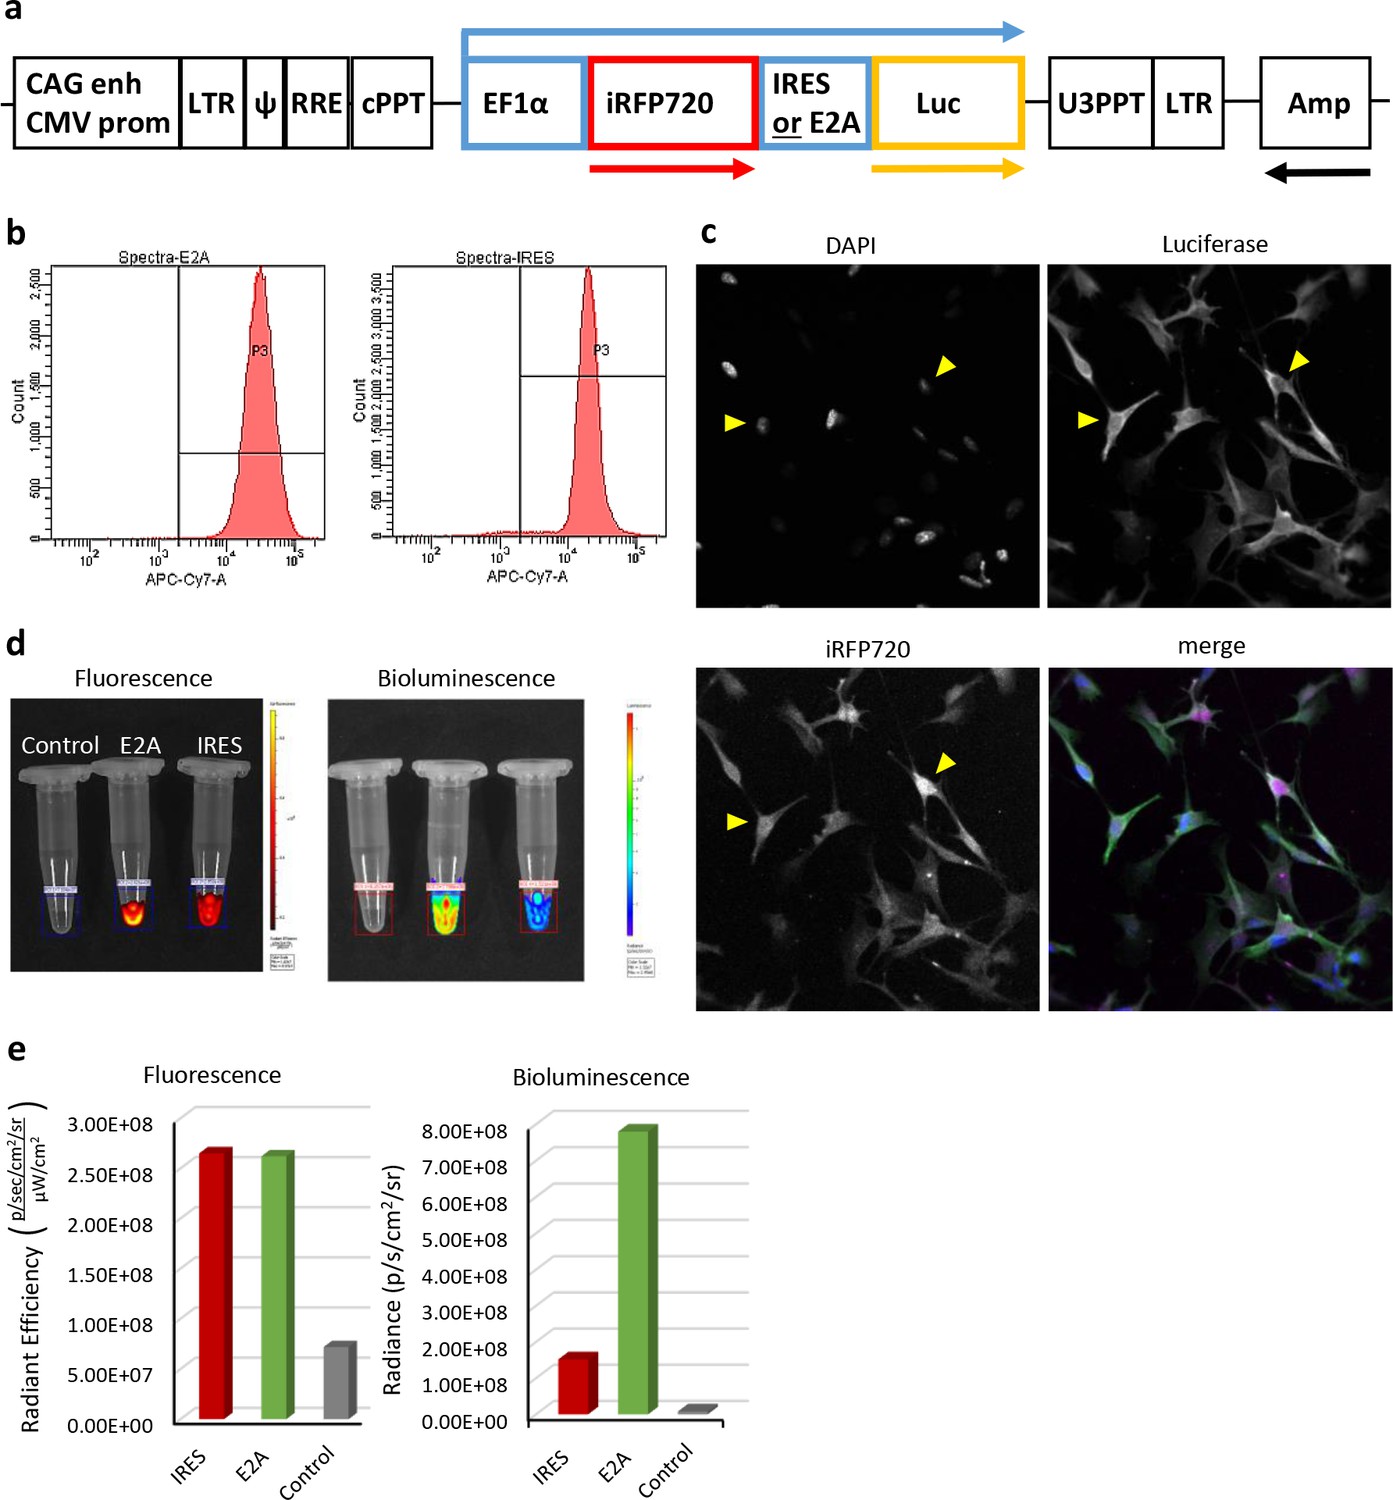
Characterisation of iRFP720-Luciferase bi-cistronic lentivirus reporter gene vectors and transfected cells in vitro.
(a) Scheme of the vectors that mediate co-expression of iRFP720 and firefly luciferase either via IRES- or E2A-mediated mechanisms (not drawn to scale). Arrows above and below the scheme indicate the reporter gene transcript and open reading frames, respectively. (b) FACS analyses of iRFP720 fluorescent signal intensity in purified mMSC populations, which had been transfected with either the IRES or E2A vector, respectively, indicated similar levels of expression of the first ORF. (c) Confocal fluorescence microscopy of transfected cells for co-expression of iRFP720 and luciferase (immunofluorescence). In contrast to Luc, iRFP720 tends to accumulate in the nucleus (yellow triangles). (d, e) Comparison of fluorescent and bioluminescent signal intensities from IRES and E2A vector-transfected cell populations using IVIS Spectrum imaging. Although both cell suspensions provided very similar levels of fluorescence from the first reporter ORF (iRFP720) in the region of interest (ROI), bioluminescence levels were 5-fold higher in the E2A vector-transfected cell population, indicating a more efficient translation of the second ORF (luciferase) from the E2A element than from the IRES. Fluorescence was measured first, followed by addition of CycLuc1 to the same cell suspensions and bioluminescence imaging.
Figure 2—figure supplement 1
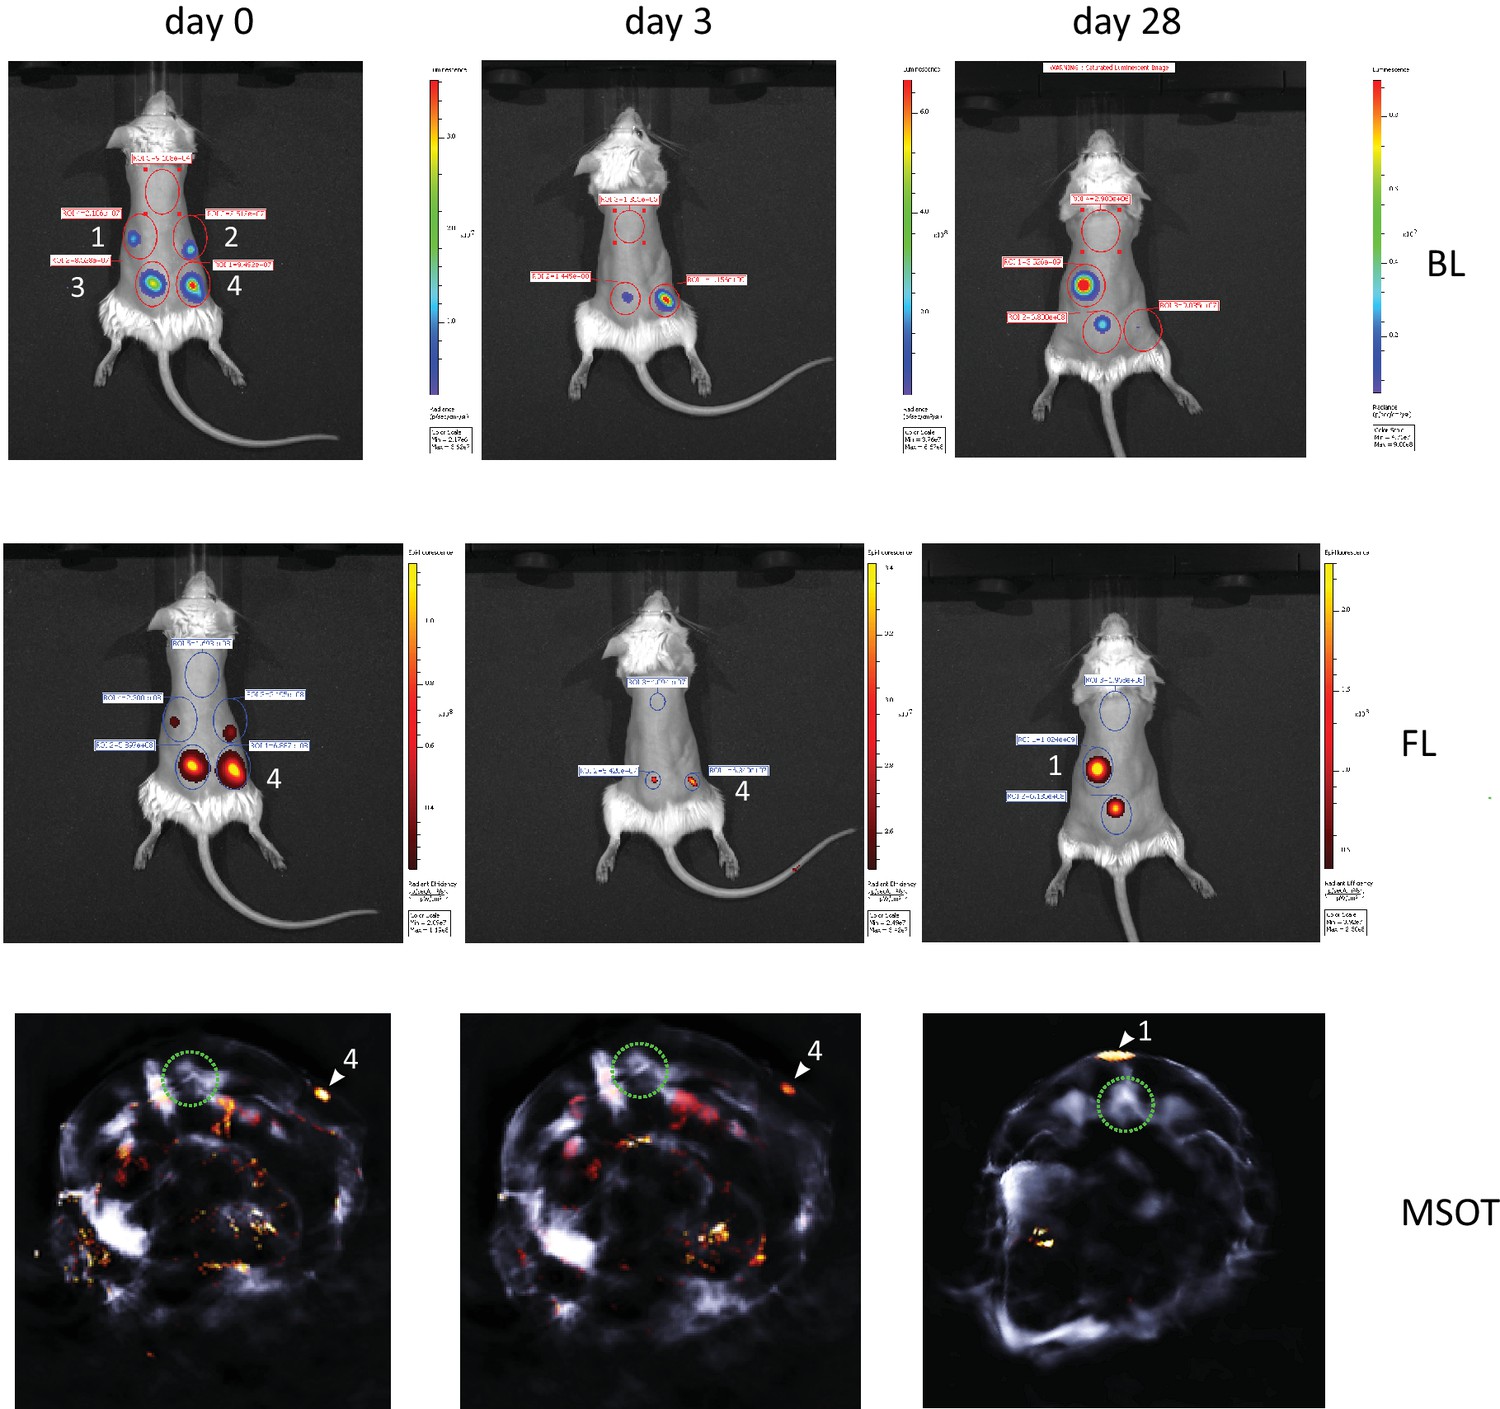
Longitudinal multi-modal imaging of iRFP720-E2A-Luc labelled cells after subcutaneous injection of mMSCs shows proportionality of bioluminescent, fluorescent and photoacoustic signals of the reporter genes.
1.25 × 10⁵ (1), 2.5 × 10⁵ (2), 5 × 10⁵ (3) and 1 × 10⁶ (4) cells were injected at the indicated regions and imaged immediately and over a period of one month after injection. A substantial loss of signal intensity over the first few days post-injection, which can be attributed to cell death, resulted in undetectability of the 1.25 × 10⁵ (1) and 2.5 × 10⁵ (2) cell injection clusters on day 3. However, survival of a small number of cells and subsequent tumour formation in the region of the lowest injected cell number (1) is evident after four weeks. Photoacoustic (MSOT) detection of iRFP720 is shown in tomographic transverse body sections at the site of highest cell concentration (1 × 10⁶, (4)) on the day of injection and on day 3, and for the larger tumour (1) on day 28. The photoacoustic signals are colour coded in arbitrary MSOT units and the green circle indicates the location of the spine for orientation. For iRFP720 fluorescence (FL) the 710/760 nm excitation/emission filter set was used. Exposure time was 1 s for both, FL and bioluminescence (BL). Multi-spectral data reconstruction for MSOT was performed employing a guided-ICA algorithm against the photoacoustic spectra of iRFP720-E2A-Luc cells in phantoms.
Figure 3 with 3 supplements
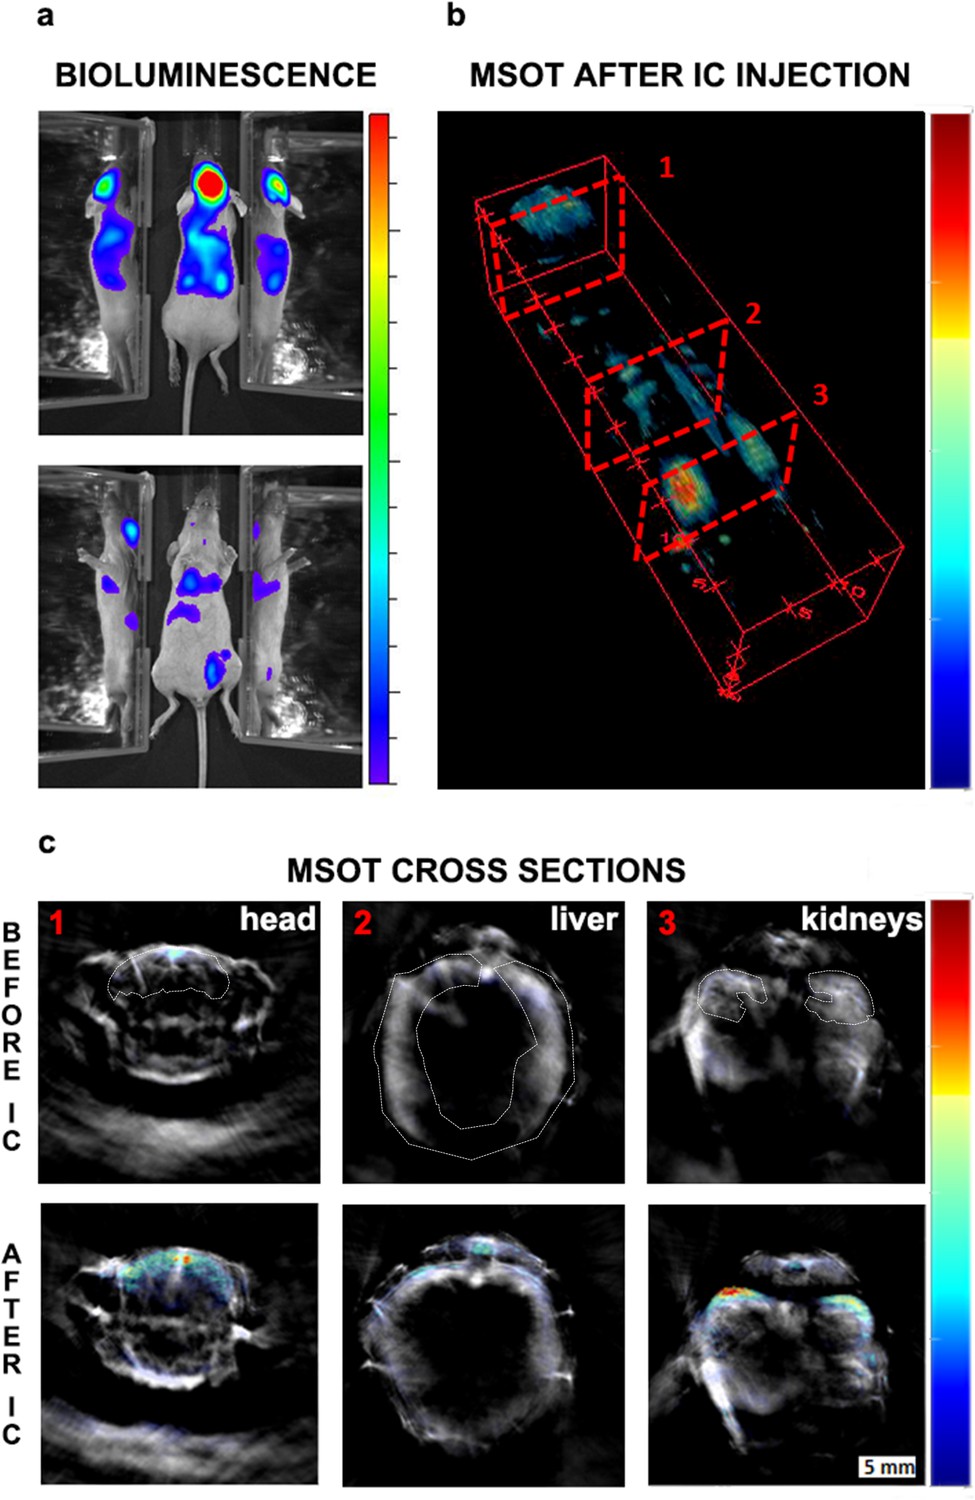
Initial biodistribution of GNR-860-labelled cells after intracardiac administration.
(a) Bioluminescence imaging in dorsal (top panel) and ventral (bottom panel) position after cell administration. Mirrors were placed on the side of the mouse to provide a lateral view. (b) MSOT imaging of the same animal: 3D reconstruction for the whole animal showed the correlation between GNR-860 signal with bioluminescence imaging (360° animation available in Figure 3—video 1). (c) Cross sections corresponding to the planes shown in (b) before and after the injection of cells. Sub-organ localisation of cells can be observed here (see main text for details and source data at Zenodo (https://zenodo.org/record/1021607) (doi: 10.5281/zenodo.1021607) for the whole set of cross section images). The brain, liver and kidney are outlined. Colour scales are 3.0 × 10⁵ to 1.8 × 10⁶ radiance units (ρ · s−1 · cm−2 · sr−1) in (a) and 0.9 to 21 MSOT intensity (a.u.) in (b) and (c).
Figure 3—figure supplement 1
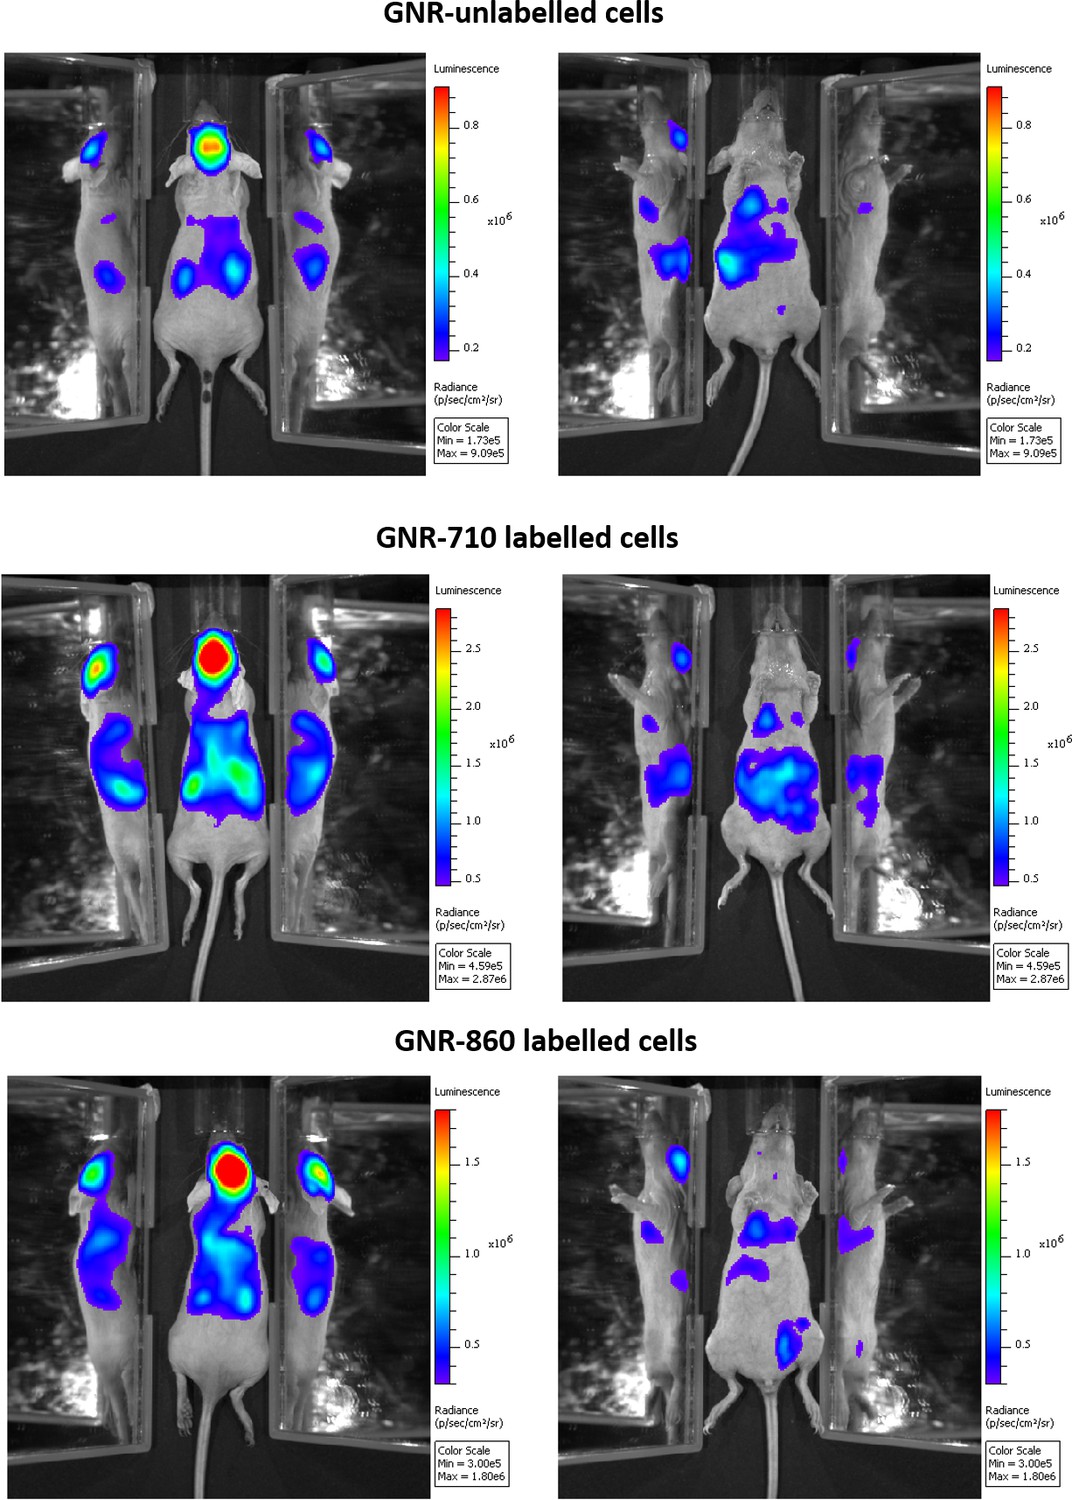
Biodistribution of cells not labelled with GNRs and cells labelled with GNR-710 and GNR-860, respectively, after intracardiac administration.
A similar pattern was observed in all three cases, showing that GNRs did not affect overall cell distribution.
Figure 3—figure supplement 2
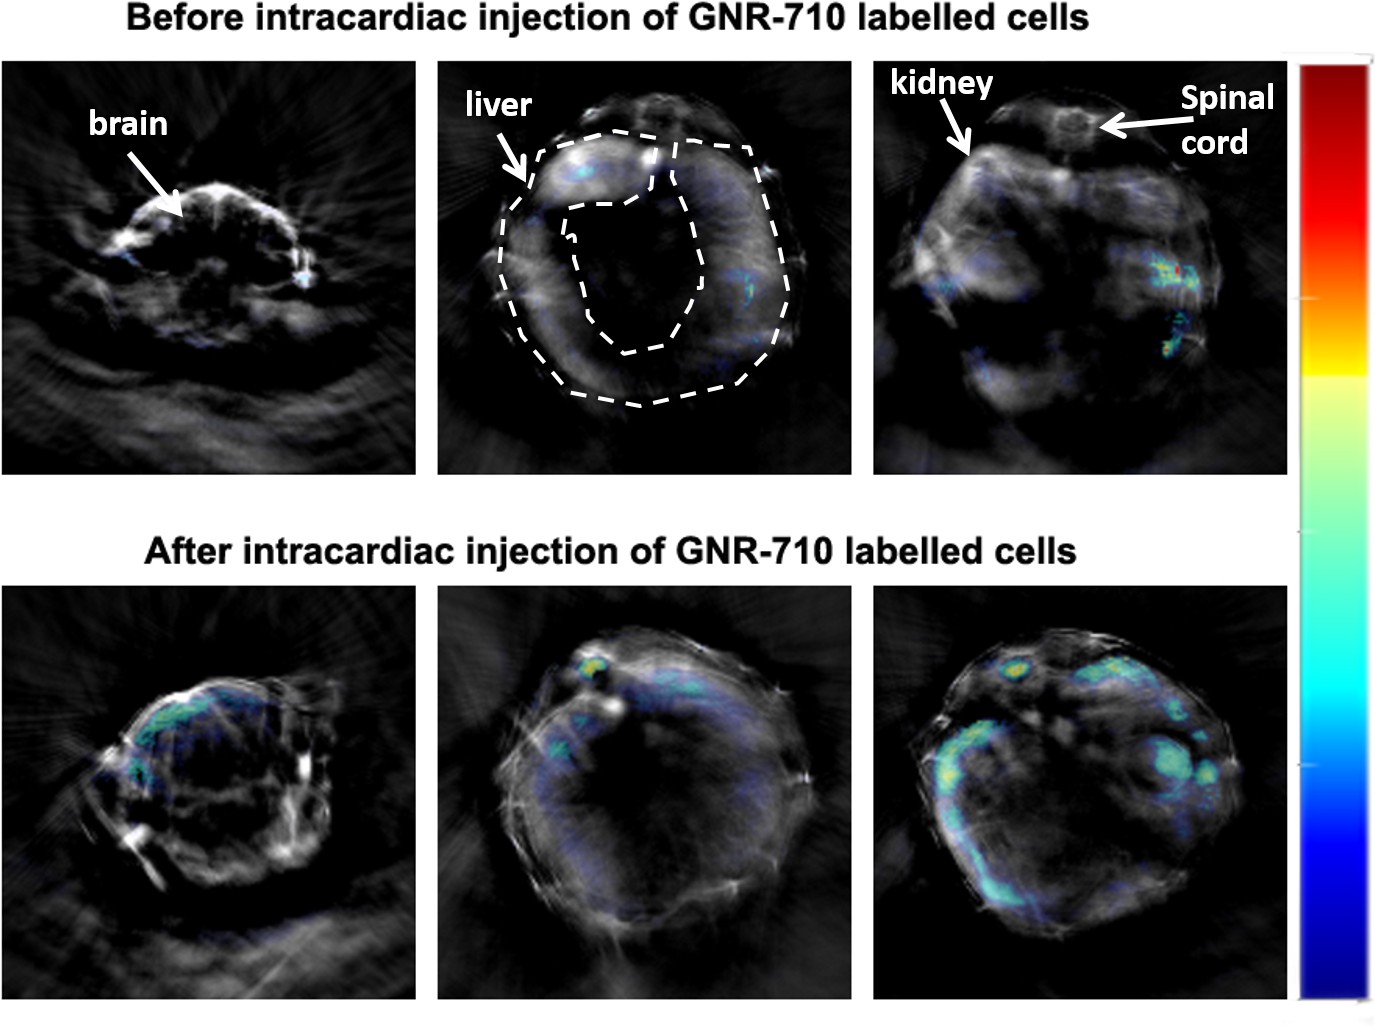
MSOT imaging of cell biodistribution of GNR-710 labelled cells – comparison before and after cell injection.
Transverse sections showing three regions of interest (brain, liver/spinal cord and kidneys) before and after the administration of cells. The results here are in agreement with the results for GNR-860 in the main text Figure 3. Colour scale is 0.8 to 25 MSOT intensity (a.u.). Note also that for GNR-710, we observed signal interferences in the intestines. This interference is likely due to a similar photoacoustic profile of food, since this signal appeared also before the administration of cells, which helped to discriminate between interference and actual signal originating from GNRs.
Figure 3—video 1
360° animation of the 3D reconstruction shown in Figure 3 of the main text.
mMSCs labelled with GNR860 and reporter genes were injected intracardiacally and mice scanned by multispectral optoacoustic tomography (MSOT) shortly after injection. The video shows the spatial distribution of the GNR signal from cells in the brain, liver and kidney regions.
Figure 4 with 1 supplement
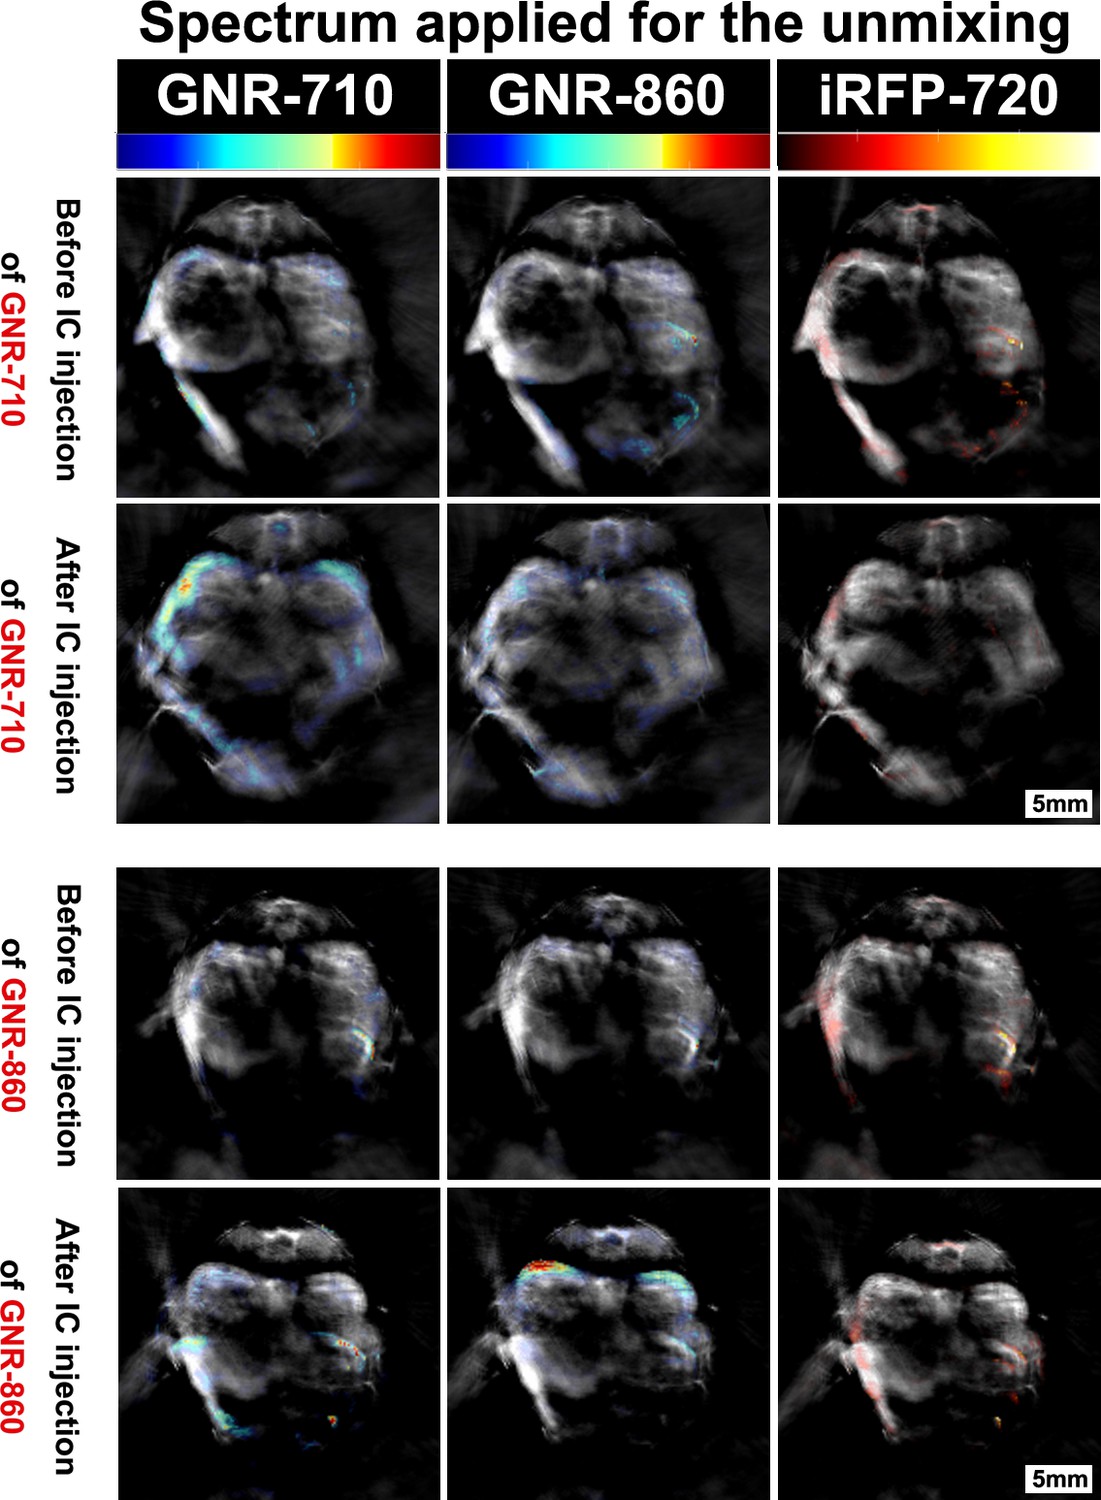
Specificity of the multispectral unmixing.
Signal before and after treatment with GNR-710-labelled cells (upper panel) and GNR-860-labelled cells (bottom panel) in transverse sections at the level of the kidney region of the corresponding mouse. Signals were observed in the kidney only when the spectra of the respective component (GNR-710 in upper panel and GNR-860 in bottom panel) was applied. Note also that iRFP720 unmixing did not result in a signal at this stage. Colour scales are 0.1 to 14, 0.9 to 21, and 0.0 to 15 MSOT intensity (a.u.) for GNR-710, GNR-860, and iRFP720, respectively.
Figure 4—figure supplement 1
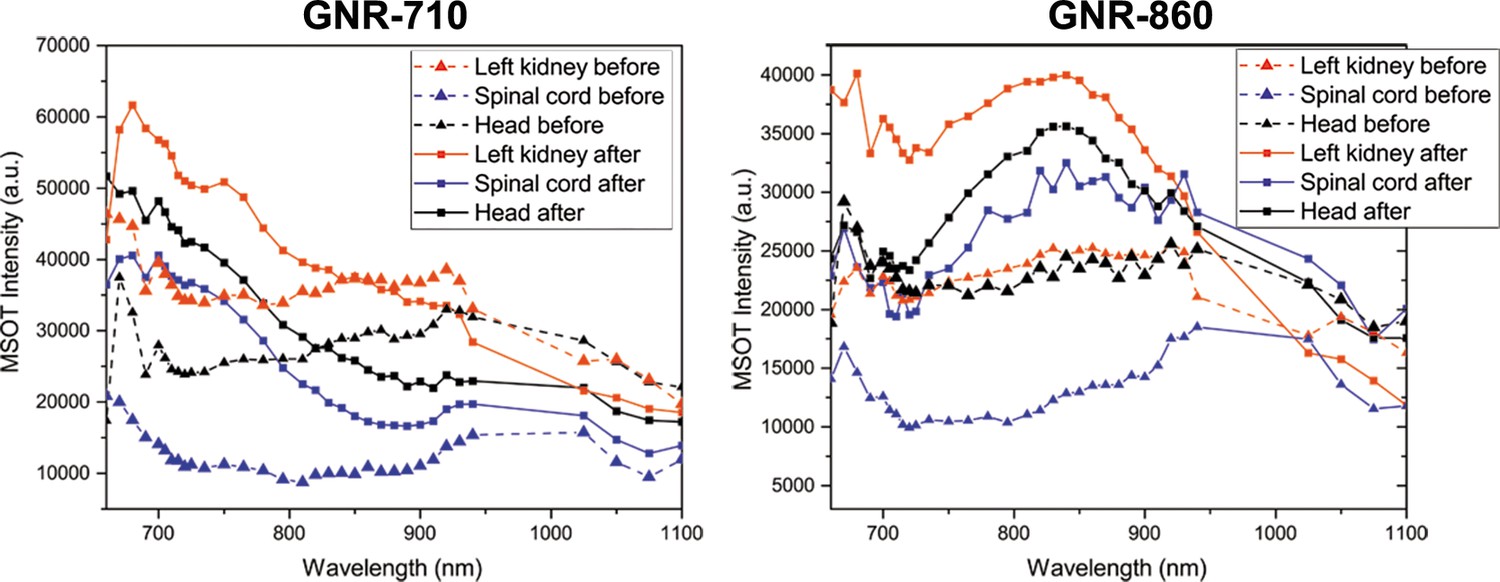
Photoacoustic spectra extracted from in vivo imaging.
Photoacoustic spectra of three regions of interest (left kidney, spinal cord and head) before and after administration of GNR-710-labeled cells (left) and GNR-860-labeled cells (right). Note that the spectra corresponding to the scans before cell administration are similar in both cases, whilst they acquire the characteristic profile of their corresponding GNRs after cell administration. No wavelengths between 940 and 1025 were selected to avoid absorption by water, which has one absorption band in this region.
Figure 5

Cell death and clearance of GNR-860 from day one after injection.
(a) MSOT signal in kidneys disappeared almost completely at day 1. (b) Total bioluminescence decreased by 78% at day one indicating a large amount of cell death. (c) In contrast to the kidneys, MSOT signal in the liver increased substantially at day 1, although bioluminescence had declined in this tissue at this stage as shown in (b), which suggests that GNRs accumulated in the liver. (d) After day 1, MSOT signal in liver decreased progressively. Colour scales in (a) and (c) are 0.5 to 8 MSOT intensity (a.u.). Colour scale in (b) is 7.0 × 10⁴ to 5.8 × 10⁵ radiance units (ρ · s−1 · cm−2 · sr−1).
-
Figure 5—source data 1
Loss in BLI signal intensity within 24 hr after injection.
A similar percentage of decrease in total BLI signal intensity was observed in mice treated with GNR-unlabelled cells as in mice treated with GNR-860-labelled cells, suggesting that GNRs did not affect cell death.
- https://doi.org/10.7554/eLife.33140.014
Figure 6 with 3 supplements
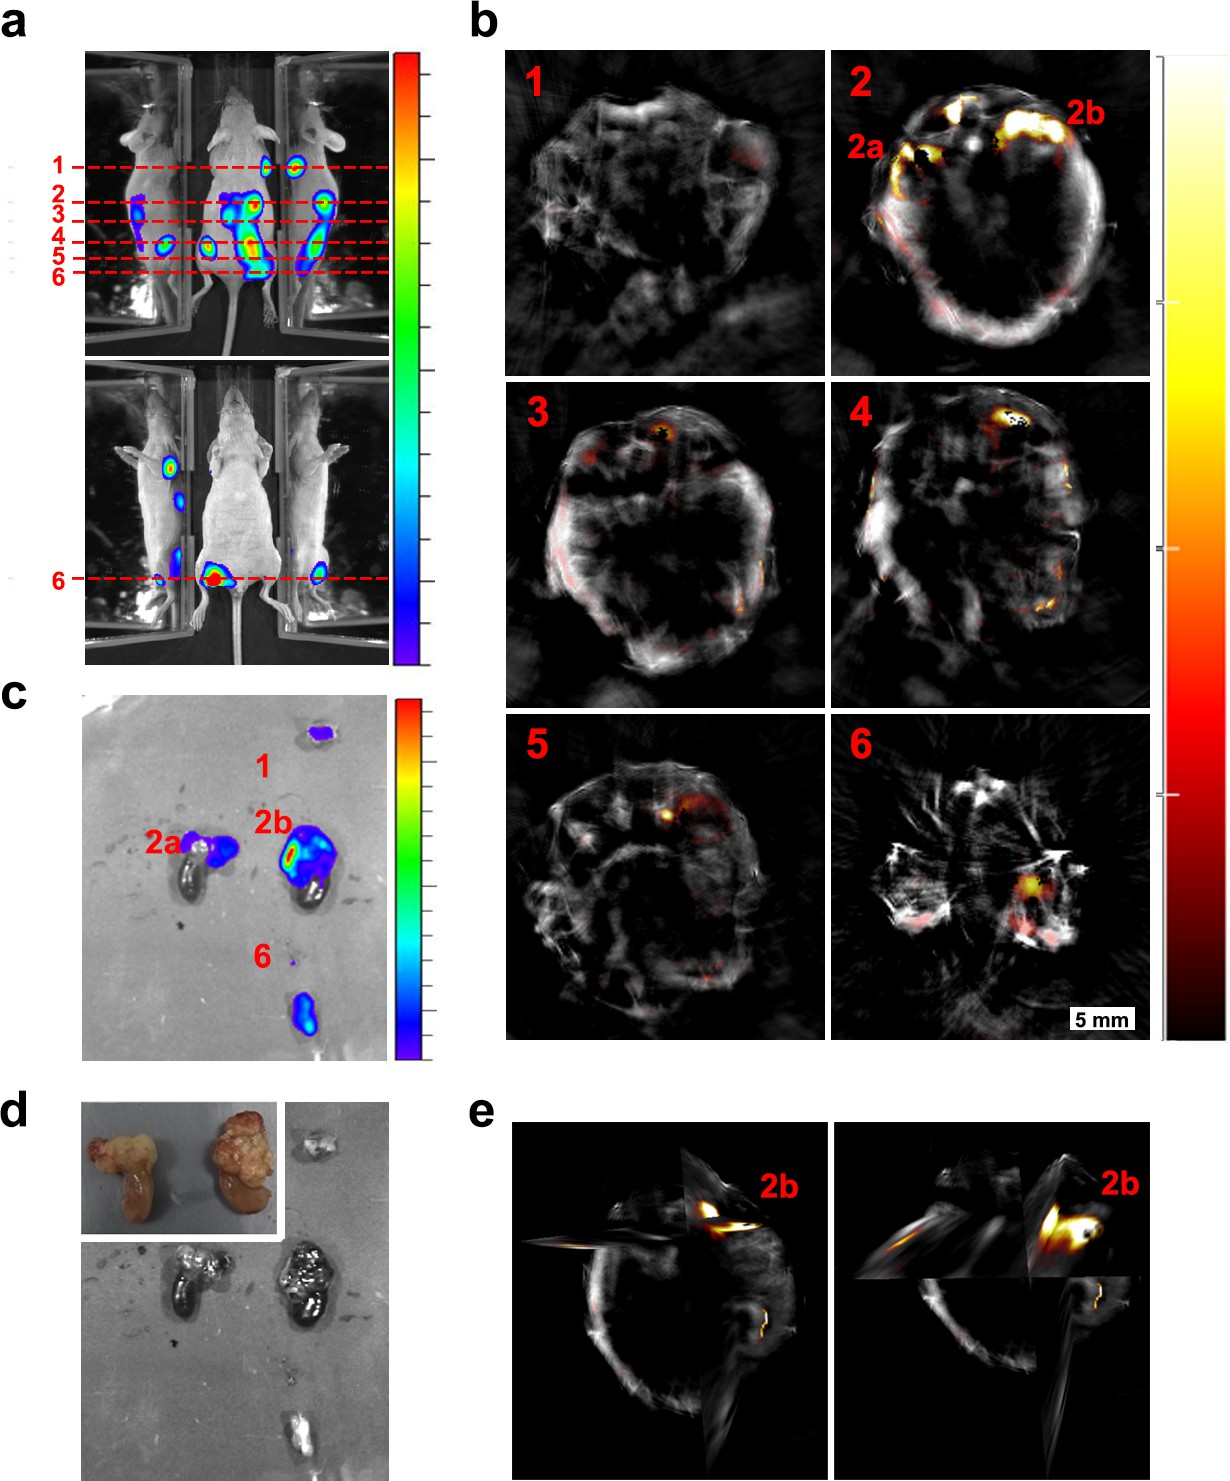
Localisation of tumours 30 days after injection of cells.
(a) Bioluminescence images showing different tumours spread along the mouse body. Dashed lines indicate the approximate region shown in the MSOT scans. (b) Corresponding MSOT transverse sections showing the precise localisation of different tumours after applying the multispectral processing for iRFP720. (c) Ex vivo bioluminescence imaging confirmed the localisation of relevant tumours imaged with MSOT. (d) Ex vivo picture of the tumours shown in (c) with a detail of kidneys in the inset. (e) Orthoslice images of tumour 2b in (b). Frontal view (left) and tilted view (right) provide a better spatial visualisation of the tumour´s precise localisation, extending anterior from the dorsal part of the right kidney. Colour scales are 1.4 × 10⁸ to 8.5 × 10⁸ radiance units (ρ · s−1 · cm−2 · sr−1) in (a) and 2.6 × 10⁸ to 5.3 × 10⁹ radiance units in (c). Colour scale in (b) is 0.4 to 15 MSOT intensity units (a.u.).
Figure 6—figure supplement 1
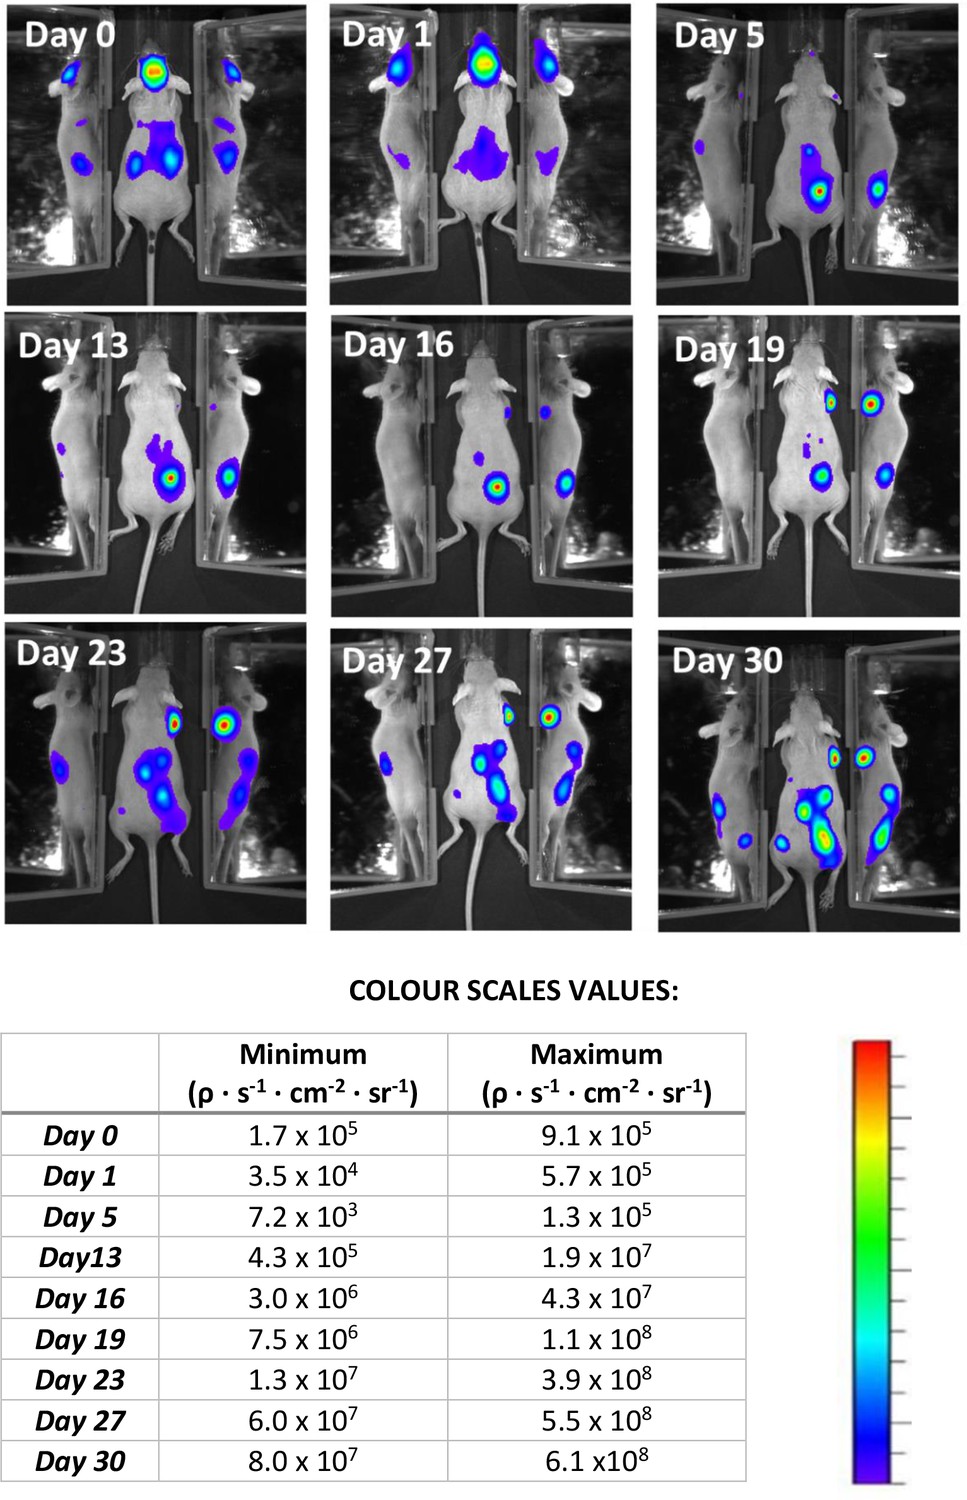
Bioluminescence monitoring of tumour growth of the mouse shown in Figures 6 and 7 of the main text.
Several tumours developed and became detectable from five days after cell injection. Colour scales have been adjusted to show tumour localisation. They cannot be standardized here due to the great increase of intensity after tumour growth.
Figure 6—figure supplement 2
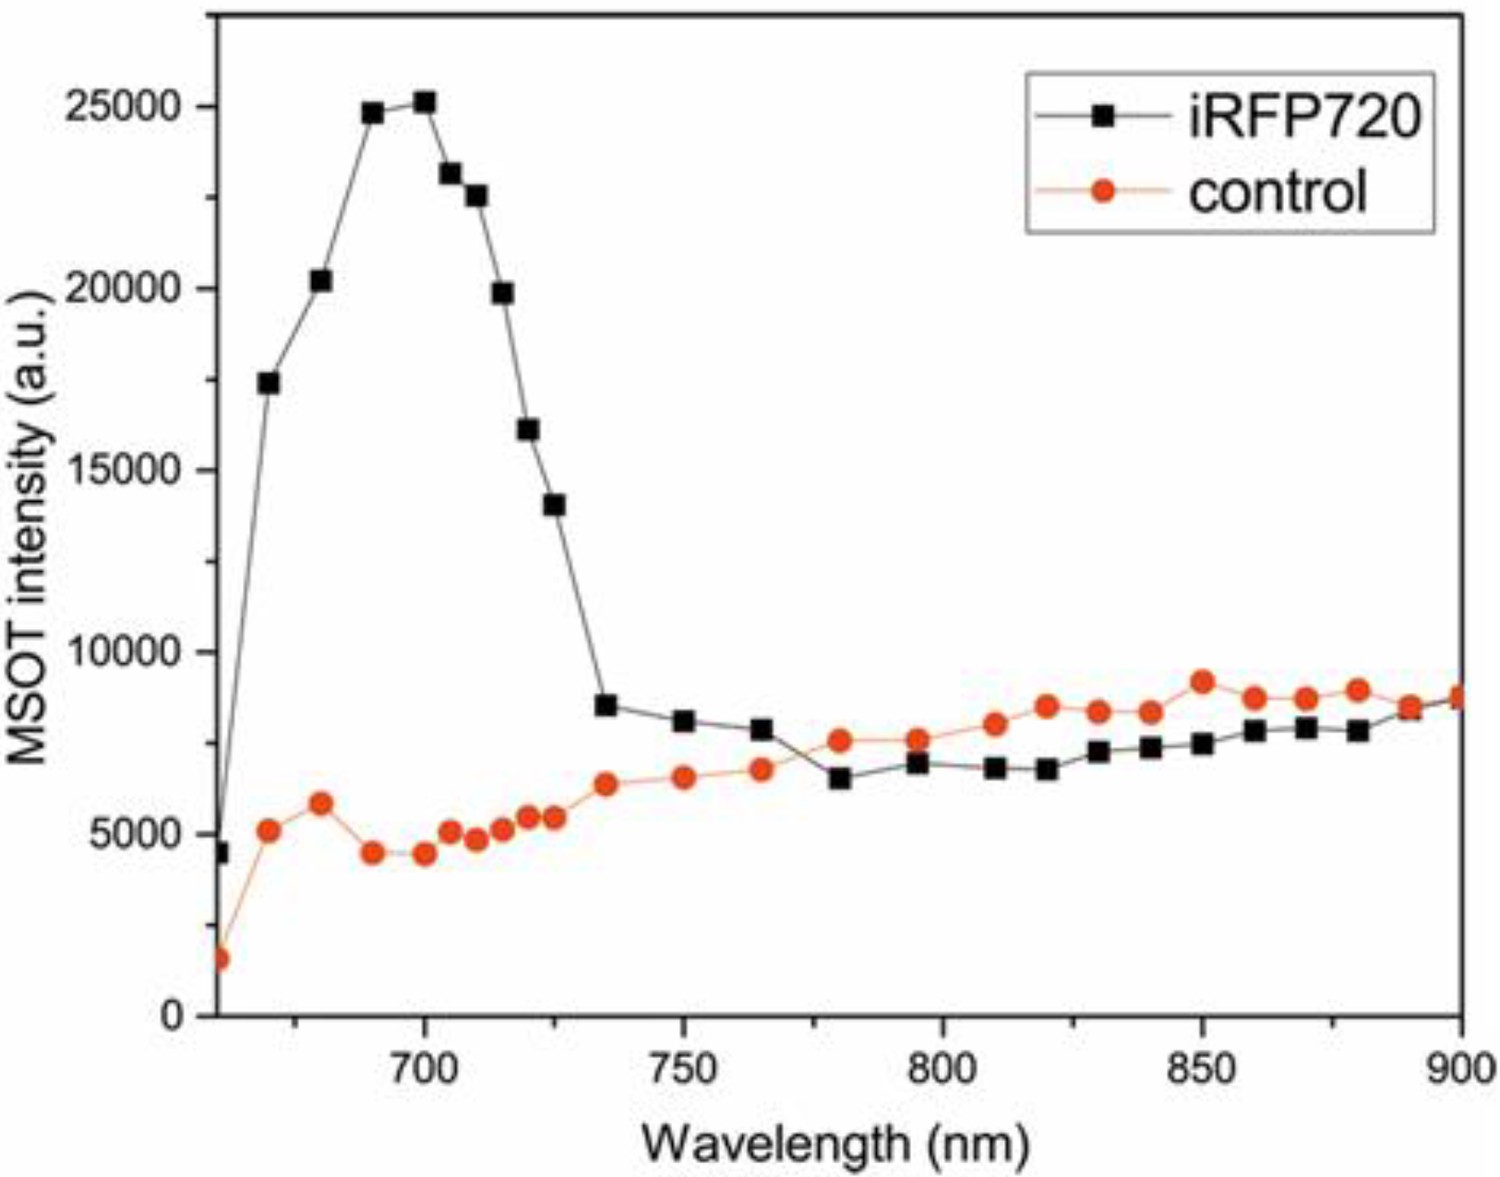
In vivo photoacoustic spectra of tumour 2b in Figure 6 of the main text.
The characteristic spectrum of iRFP720 is obtained after analysing the photoacoustic intensities at the working wavelengths. A random region below the tumour was chosen as a control region for comparison.
Figure 6—figure supplement 3
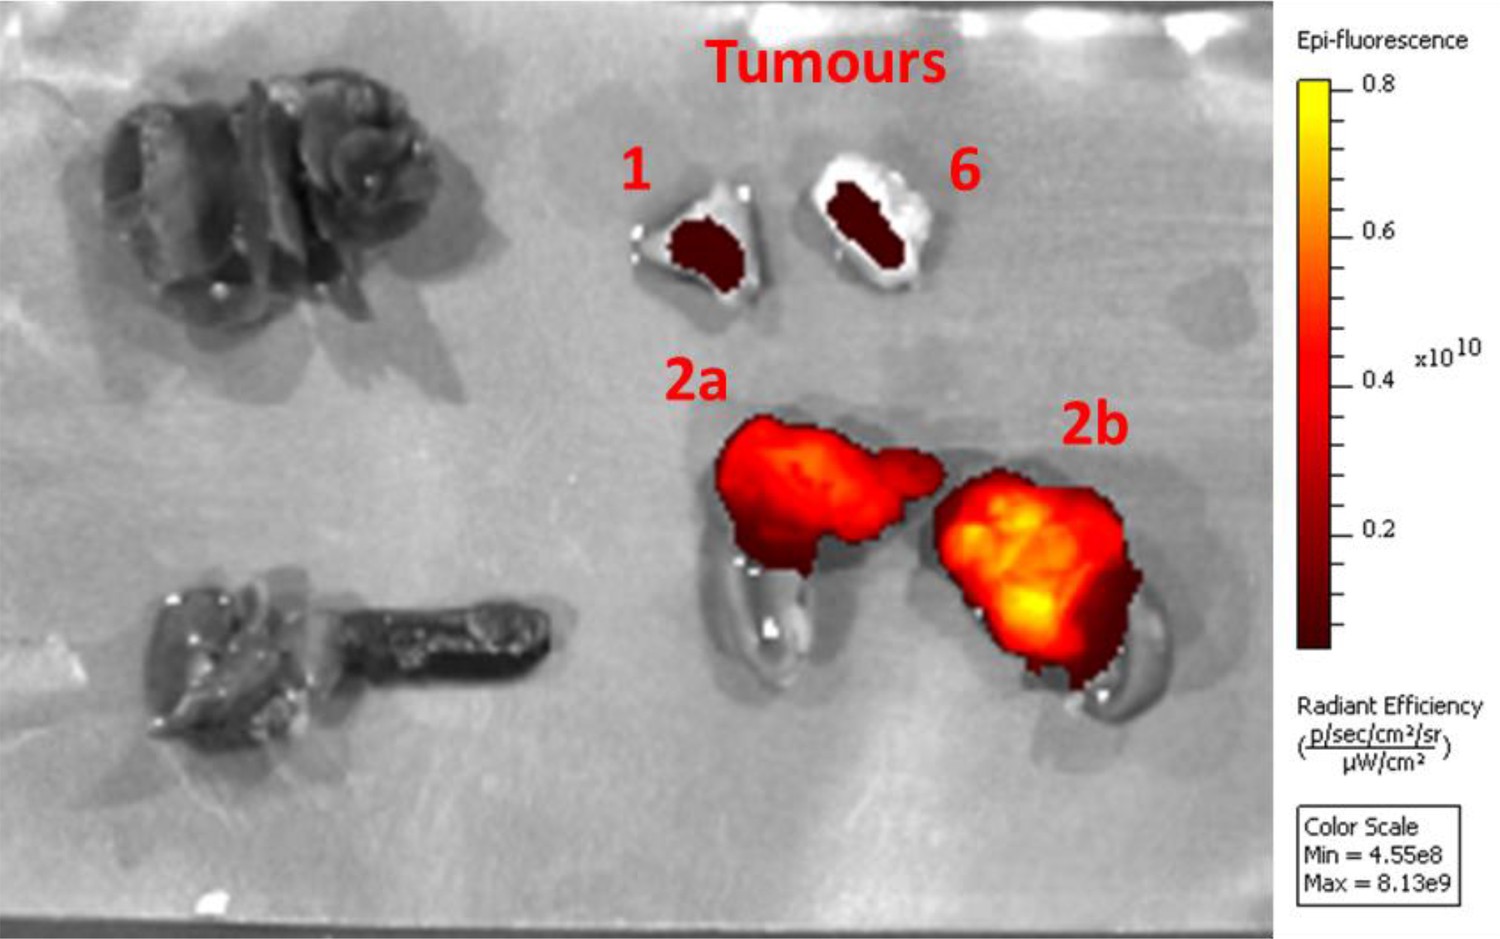
Ex vivo epi-fluorescence image (Ex = 675 nm, Em = 720 nm) of tumours shown in Figure 6, after fixation with 4% PFA for 24 hr.
No signal was observed in organs such as liver (top left), stomach and attached spleen (bottom left), and heart and lungs, indicating the specificity of the signal.
Figure 7 with 1 supplement
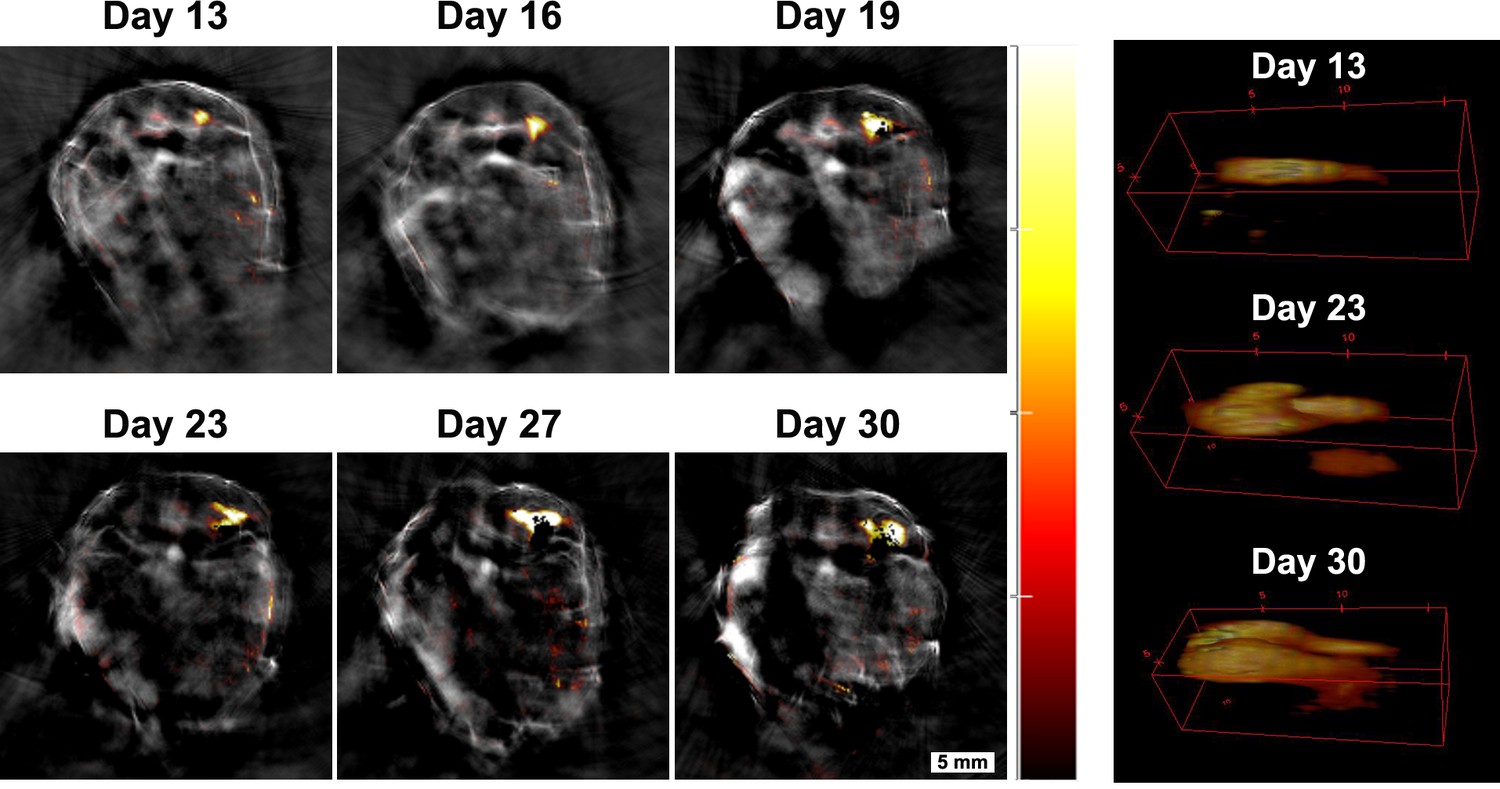
Monitoring tumour growth over time.
Tumour four in Figure 6 was chosen to demonstrate the potential of the MSOT approach in monitoring tumour growth longitudinally over time. A small tumour was localised in the pelvic ilium region at day 13 and its growth was monitored from day 13 to day 30. 3D reconstructions of the tumour are shown on the right panel (360° animations are available as Figure 7—video 1). Changes in size can be determined with this technique. Colour scale is 0.4 to 15 MSOT intensity units (a.u.).
Figure 7—video 1
360° animation of the 3D reconstructions shown in Figure 7 of the main text.
Long-term monitoring of mMSCs for tumour formation after i.c. injection using the reporter gene iRFP720. The video shows spatial reconstructions of multispectral optoacoustic tomography signals from iRFP720 expressing cells that formed a tumour in the region of the pelvic ilium. The tumour diameters determined by MSOT were 1.2 mm (day 13), 2.2 mm (day 23) and 3.3 mm (day 30), respectively.
Figure 8 with 1 supplement
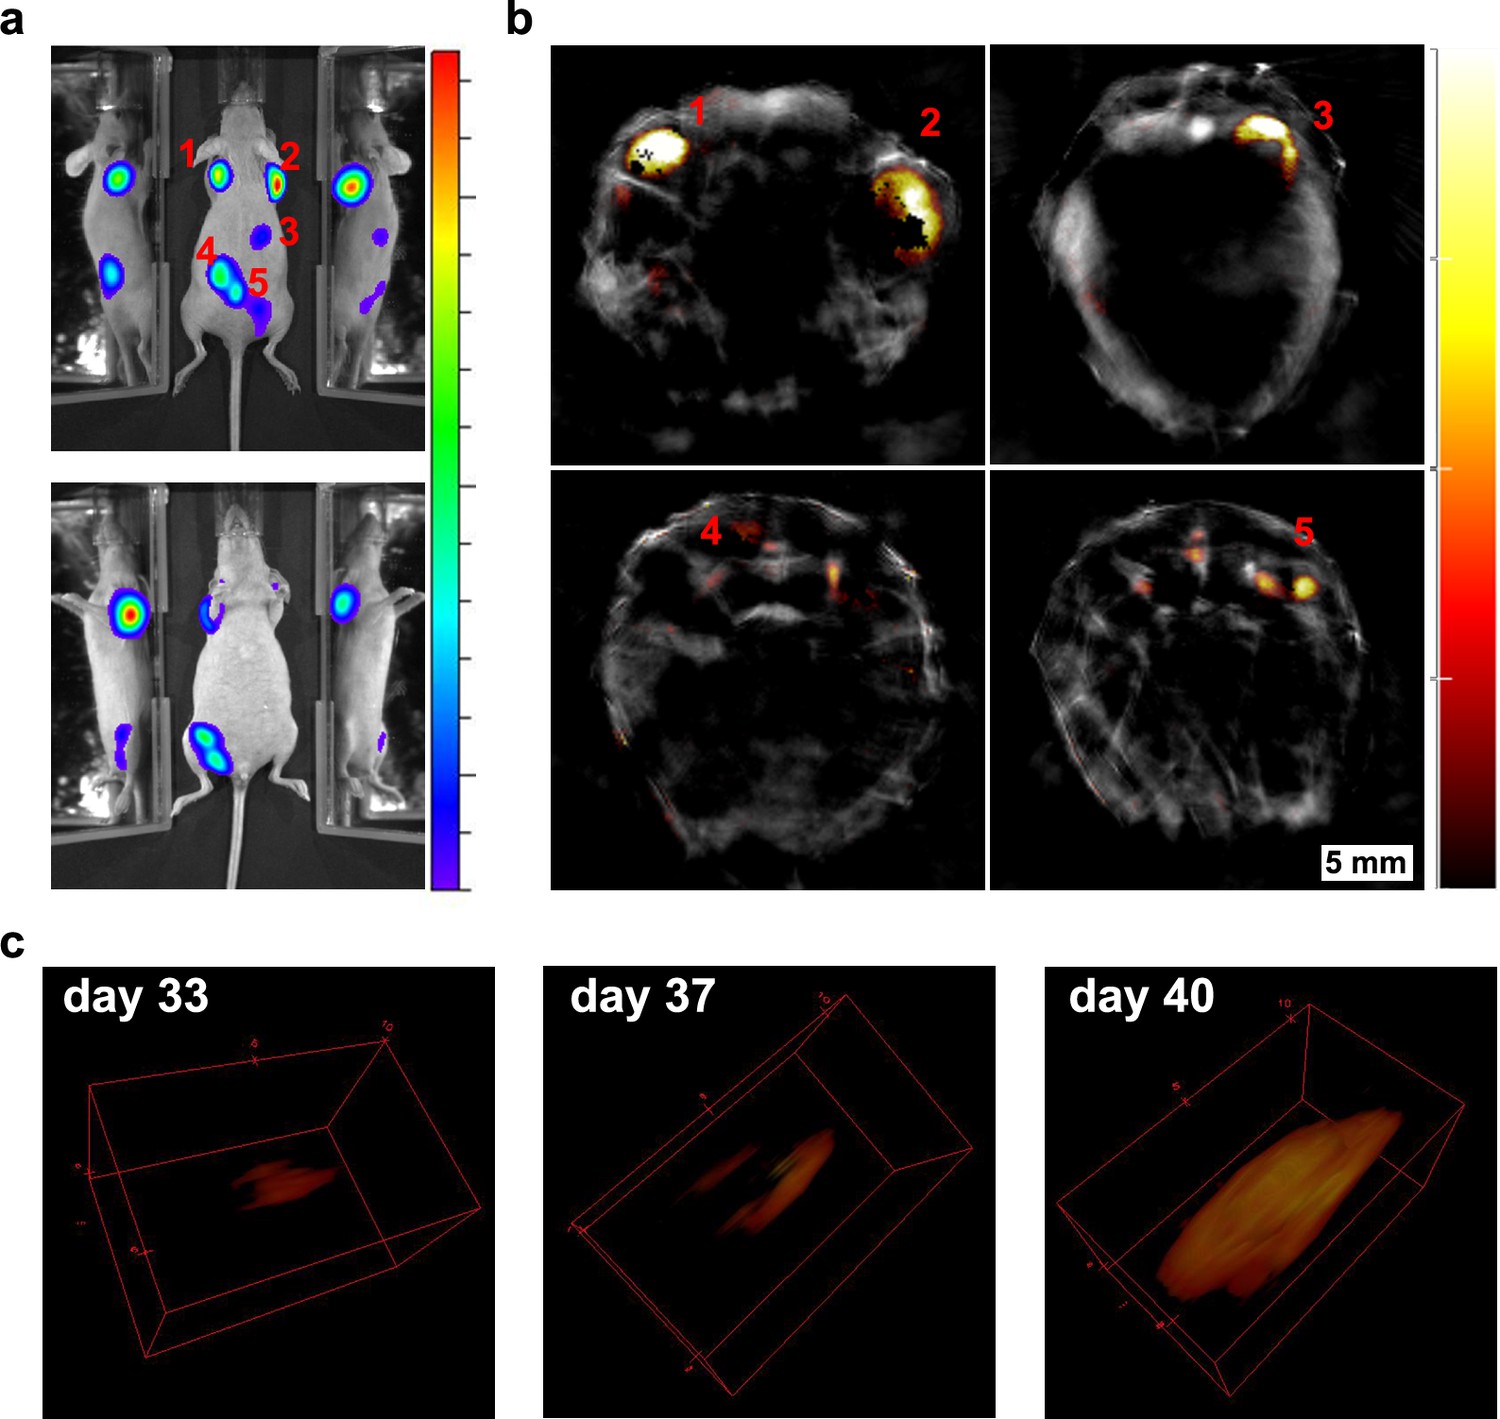
Longitudinal tumour monitoring in a mouse that was injected with GNR-860/reporter gene labelled cells.
Localisation of tumours 40 days after systemic injection of cells imaged by bioluminescence (a) and MSOT (b). (c) Growth of the tumour on the left shoulder was monitored from day 33 to day 40 and is shown in 3D reconstruction. Colour scale in (a) is 1.4 × 10⁸ to 1.3 × 10⁹ radiance units (ρ · s−1 · cm−2 · sr−1) and in (b) is 1.2 to 14 MSOT intensity units (a.u.). The black pixels visible within the tumour region in (b) are an experimental artefact (see Figure 8—figure supplement 1 for additional discussion).
Figure 8—figure supplement 1
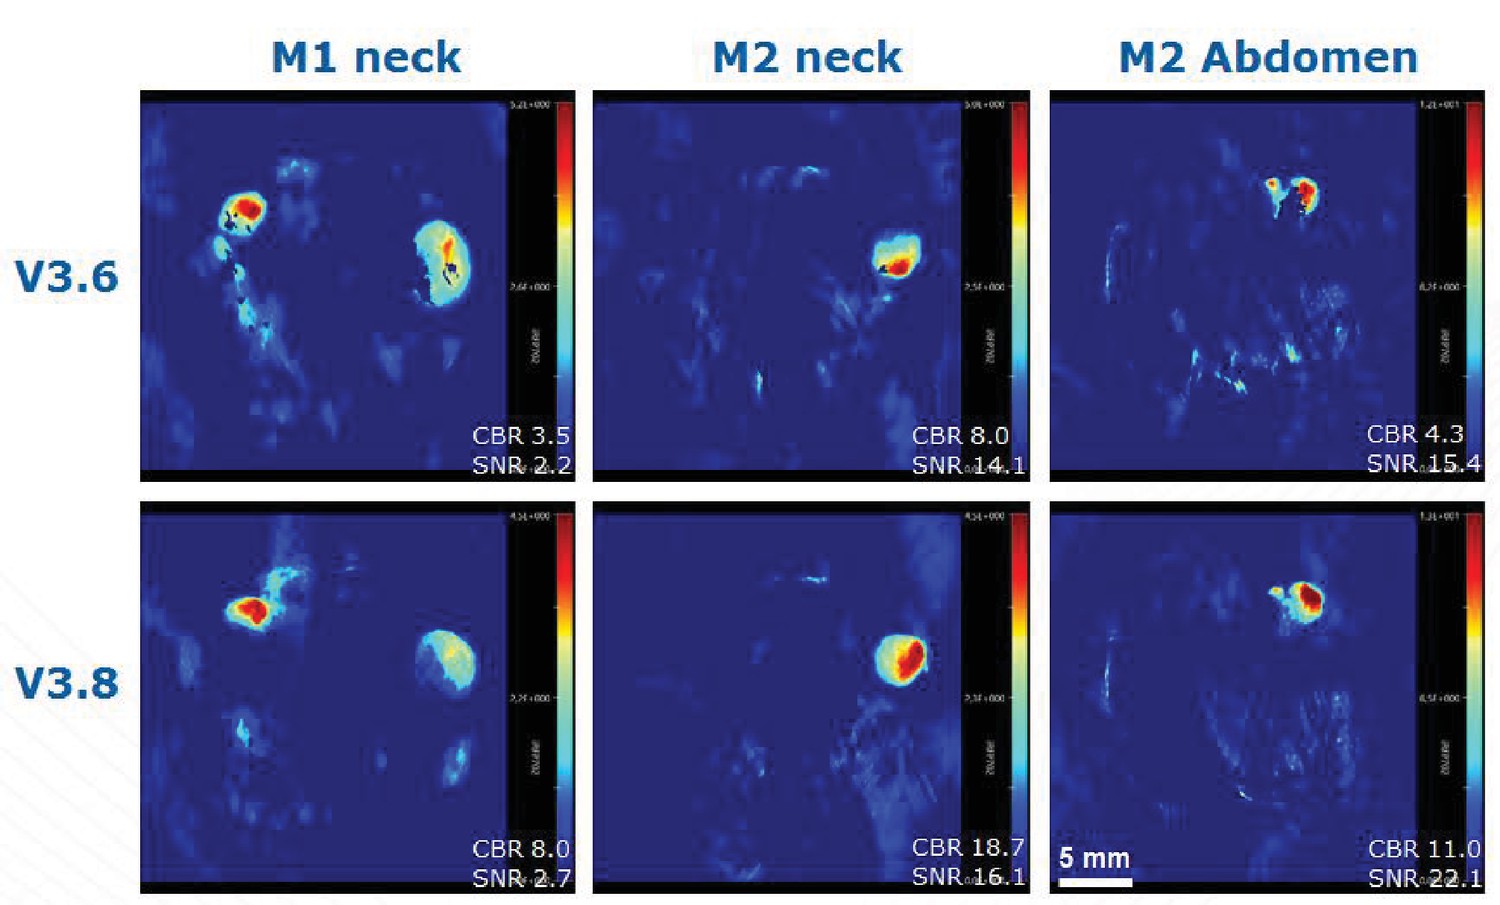
Comparison of MSOT image reconstruction using software version 3.6 and 3.8.
The negative areas in the reconstructed MSOT images (appearing as black pixels in some of our figures) have a variety of origins. For all of the figures of this article, v3.6 of the MSOT software was used. v3.8 has now been released. It includes a better model for the receive characteristics of the transducer that reduces the number of negative pixels as can be seen above. Thank you to Stefan Morscher and Thomas Sardella of iTheraMedical for helpful discussion and providing the figure below. M1 is mouse GNR-860 (group III in Table 1 of the Materials and methods section) and M2 is a control mouse (group I in Table 1 of the Materials and methods section).
Tables
Key resources table
| Reagent type (species) or resource | Designation | Source or reference | Identifiers | Additional information | |
|---|---|---|---|---|---|
| SCID hairless outbred (SHO) mice | mice | Charles River Laboratories | ID_Crl:SHO-PrkdcscidHrhr | ||
| Mouse mesenchymal stem cell line | mMSC | ATCC | ID_ATCC:CRL-12424 | ||
| Lentivirus vector | pHIV-iRFP720-E2A-Luc | this paper | ID_GenBank:MF693179; ID_Addgene:104587 | lentivirus vector for bi-cistronic expression of iRFP720 and firefly luciferase | |
| Gold nanorods | GNR | this paper | gold nanorods were produced at the Department of Chemistry, University of Liverpool | ||
Table 1
Summary of mice used and analysed for the experiment.
https://doi.org/10.7554/eLife.33140.023| Group | Transfected | GNR-710 | GNR-860 | Number of animals |
|---|---|---|---|---|
| I (control) | ✓ | 2 | ||
| II (GNR-710) | ✓ | ✓ | 3 | |
| III (GNR-860) | ✓ | ✓ | 4 |
Additional files
-
Transparent reporting form
- https://doi.org/10.7554/eLife.33140.024
Download links
A two-part list of links to download the article, or parts of the article, in various formats.
Downloads (link to download the article as PDF)
Open citations (links to open the citations from this article in various online reference manager services)
Cite this article (links to download the citations from this article in formats compatible with various reference manager tools)
Multimodal cell tracking from systemic administration to tumour growth by combining gold nanorods and reporter genes
eLife 7:e33140.
https://doi.org/10.7554/eLife.33140


