Piezo1 forms a slowly-inactivating mechanosensory channel in mouse embryonic stem cells
- Rockefeller University, Howard Hughes Medical Institute, United States
- Rockefeller University, United States
Figures
Figure 1
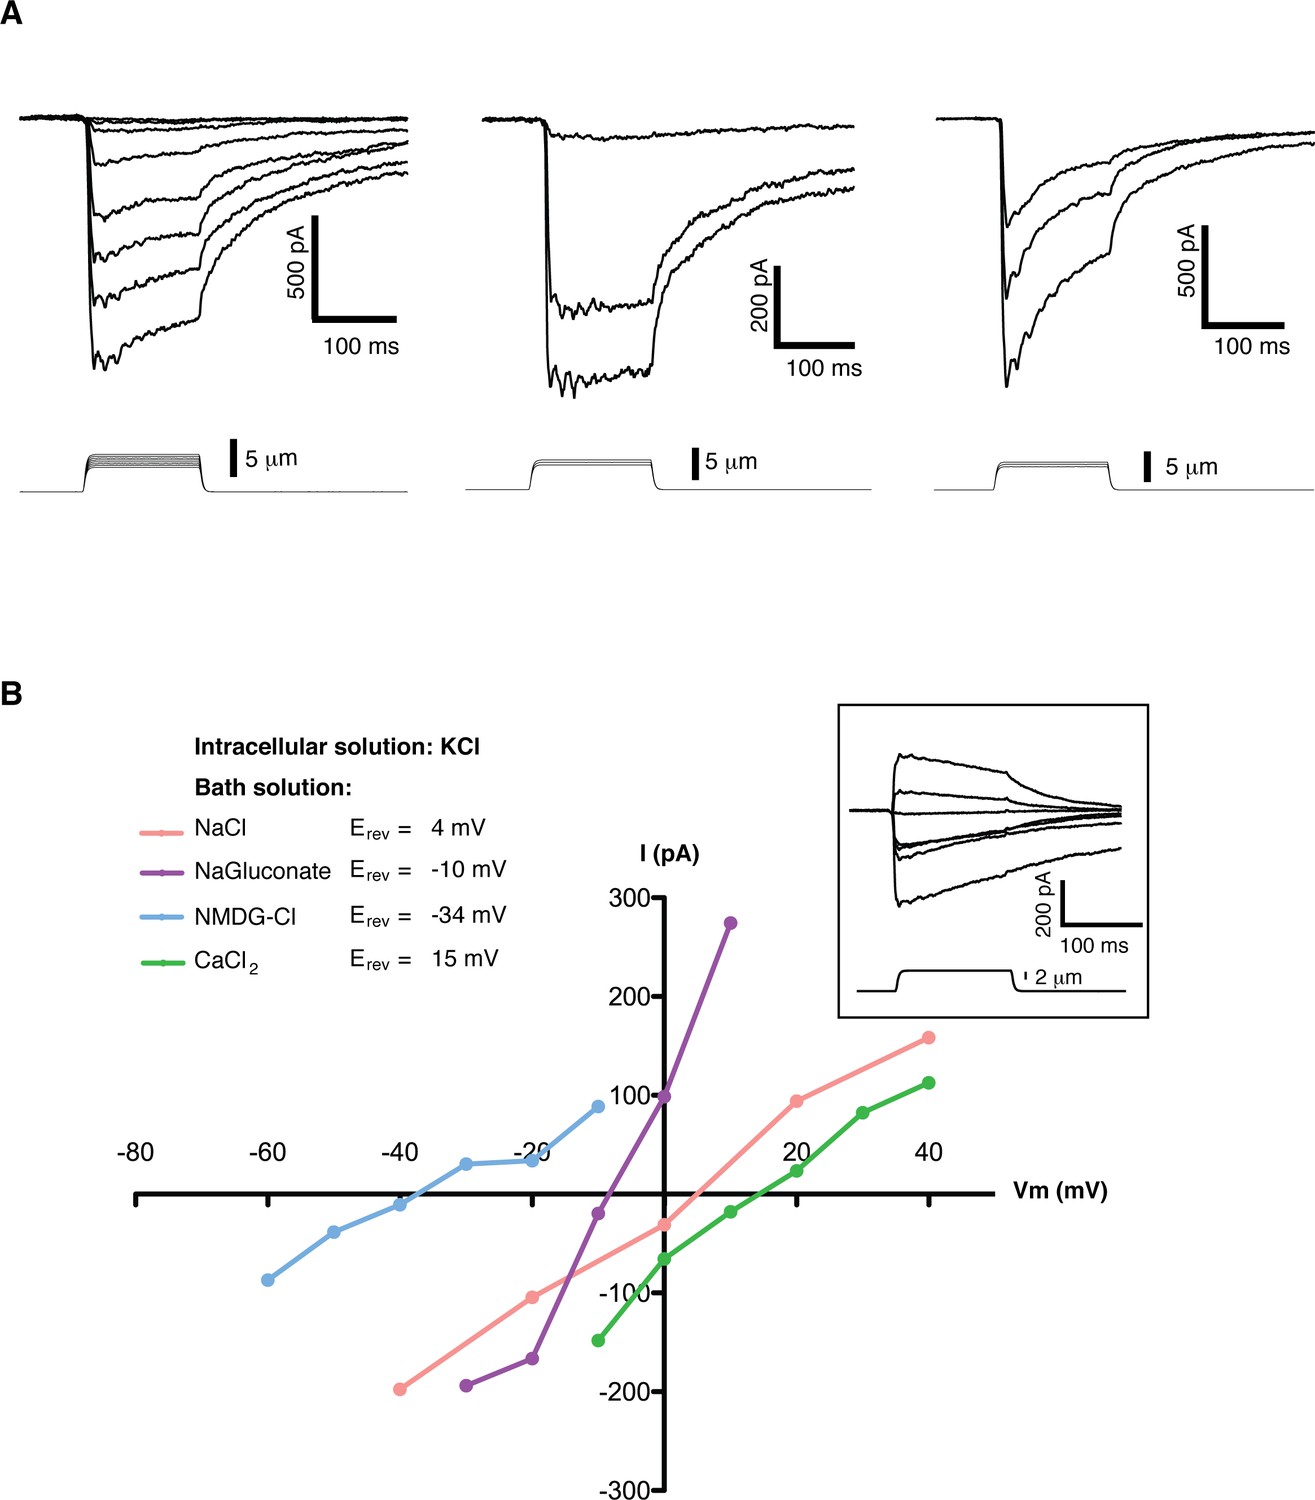
Mechanosensitive currents in mouse embryonic stem cells.
(A) Ionic currents recorded from mouse embryonic stem cells in response to mechanical stimulation. Cells were clamped at −80 mV in whole-cell mode and mechanosensitive currents were elicited by poking steps of increasing depth. Examples from three different cells are shown. (B) Mechanosensitive currents were recorded at different voltages under diverse bi-ionic conditions (inset) to establish ion selectivity. Briefly, the current’s reversal potential (Erev) will shift towards that of its permeant ion for each particular condition. The internal solution always contains KCl. The purple trace corresponds to NaGluconate in the bath, to analyze chloride permeation. If chloride were to permeate the pore, the Erev should move towards that of chloride, infinitely positive in these conditions. The fact that the Erev did not move in that direction at all indicates that chloride does not permeate the pore (the slight shift to negative values can be accounted for by the difference in motility of gluconate, a much slower ion than chloride). The pink curve is done using NaCl in the bath solution. The Erev sits at 4 mV, roughly in between the Erev for potassium and sodium in these conditions, indicating that both ions are equally likely to travel through the pore. The blue curve is in the presence of NMDG in the bath. The Erev moves towards that of potassium, indicating very low permeability for NMDG. Finally, the green curve taken with calcium as the only cation in the bath shifts the Erev to +15 mV, closer to the Erev of calcium than to that of potassium in these conditions, indicating a slightly higher permeability for calcium than for potassium. The observed permeability sequence is then: PCa > PK = PNa> PNMDG. Raw traces are shown with no voltage corrections. Liquid junction potentials are not corrected, they were estimated as: 4.3 mV for NaCl/KCl, 8.2 mV for CaCl2/KCl, −6.7 mV for NaGluconate/KCl, and 9.3 mV for NMDG-Cl/KCl.
Figure 2

Single channel analysis of the mechanosensitive channel in mouse emrbyonic stem cells in outside-out membrane patches.
(A) A membrane patch is clamped at −80 mV and channel activity is evoked by pressure steps; the opening of 3 channels can be seen. (B) The amplitude histogram of the recording shown in (A) shows the distribution of all observed states (closed, open1, open2, open3). (C) Single channel conductance estimation from amplitude histograms of multiple recordings at different voltages gives a value of 24.7 ± 2.5 pS. (D) The ensemble of multiple pressure-evoked single channel recordings at −80 mV gives an apparent macroscopic current whose kinetics resembles that of the whole-cell poking currents (whole-cell poking current is shown in an inset for comparison).
Figure 3
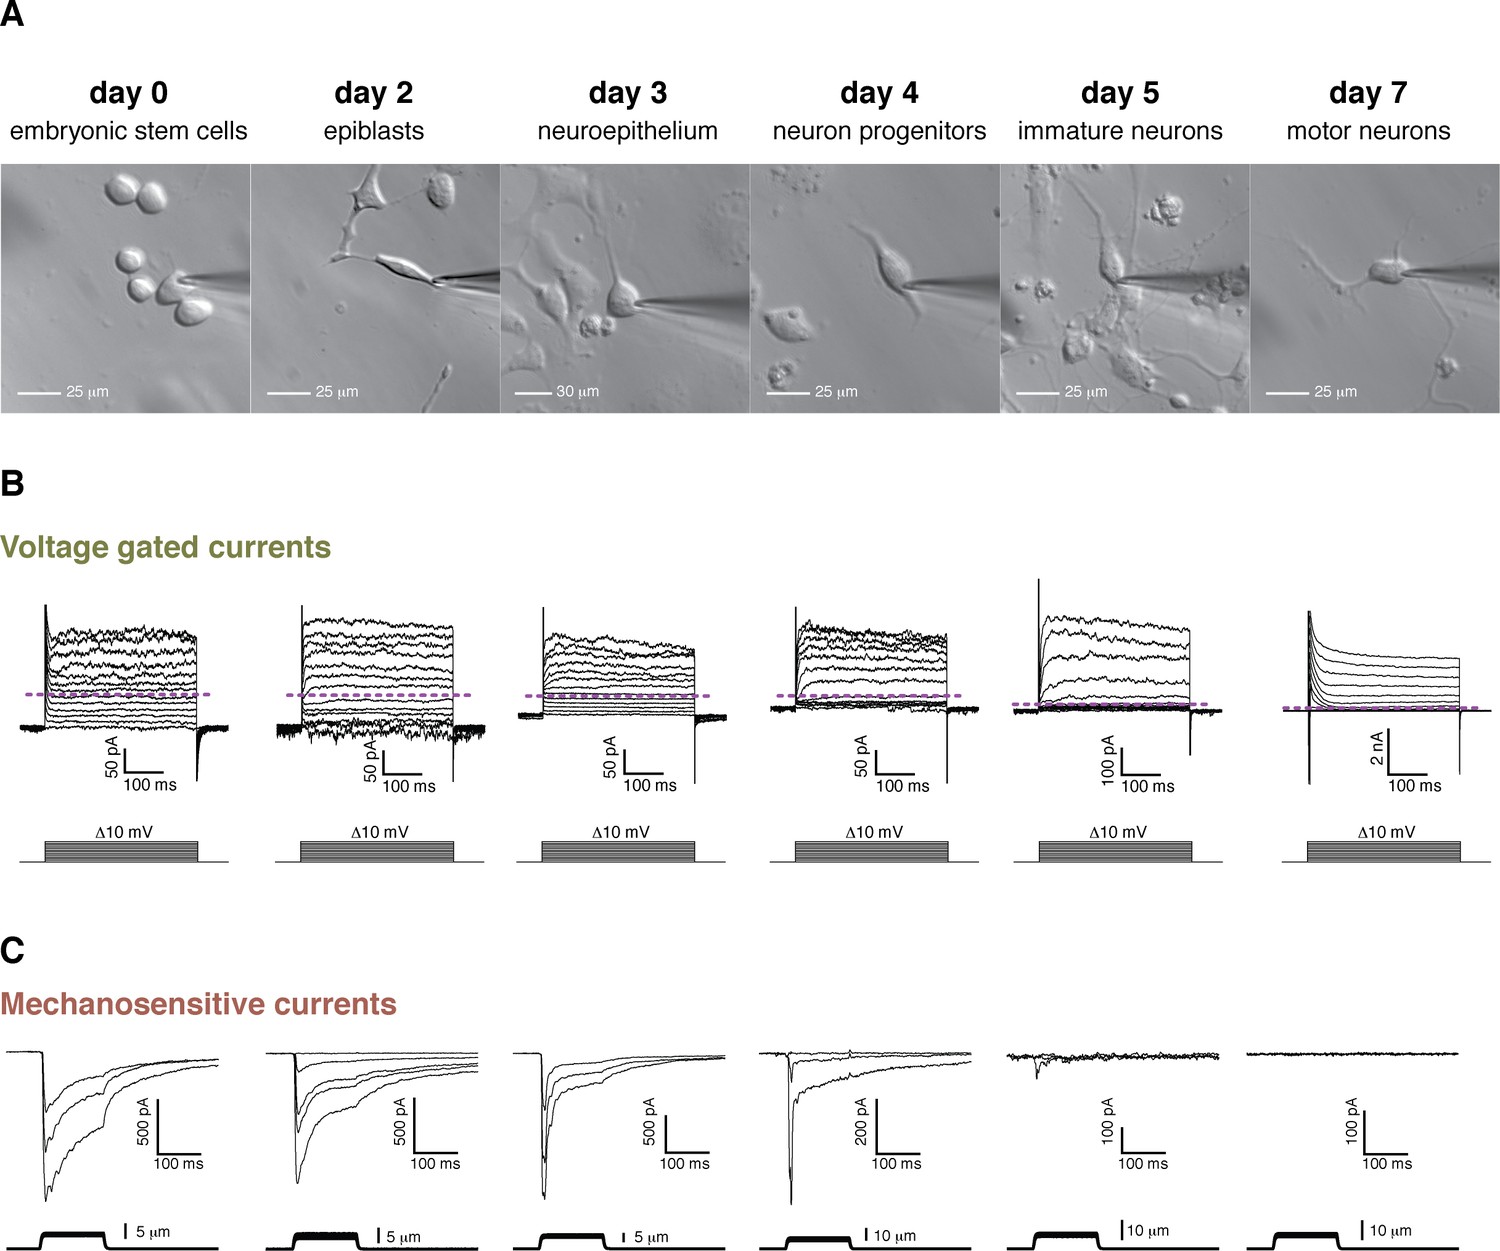
Cell morphology, voltage-gated currents, and mechanosensitive currents observed throughout the differentiation of mouse embryonic stem cells into motor neurons.
(A) Images of the six developmental stages studied under brightfield illumination. (B) Voltage-gated currents were obtained in whole-cell mode by clamping the cells at −80 mV and depolarizing in steps from −80 mV to +40 mV. Examples for each stage are shown. The purple dashed line indicates the zero current level. Voltage-gated currents are relatively small in embryonic stem cells and in the first stages of the differentiation. Voltage-gated currents increase substantially in the later stages (notice the 10-fold difference in scale), pointing at the developing neuronal phenotype. Note, in day 7, the presence of very large rapid inactivated sodium currents at the beginning of the stimulation, immediately following the capacitive transient. (C) Mechanosensitive currents were obtained in whole-cell mode by clamping at −80 mV and poking at increasing depths. Examples for each stage are shown. These currents are heterogeneous but overall diminish in amplitude and become faster as the differentiation progresses.
Figure 4

Quantification of mechanosensitive currents throughout the differentiation.
(A) The evolution of the peak- and slow- currents throughout the differentiations (three independent differentiations were performed, and data were pooled). Peak-current is the maximum mechanosensitive current achieved by the stimulation. Slow-current is the mechanosensitive current measured 75 ms after the beginning of the stimulation. (B) The evolution of the slow fraction, defined as the ratio between slow and peak current, throughout the differentiation. The mechanosensitive current becomes smaller and faster as the differentiation progresses. Below each dataset is the total number of cells assessed at each stage.
Figure 5

Piezo1 throughout the differentiation of embryonic stem cells into motor neurons.
(A) Peak- and slow- mechanosensitive currents throughout the differentiation are plotted together with the difference between them, which we called ‘fast component’. (B) Piezo1 expression throughout the differentiation as assessed by transcriptome analysis. The expression of Piezo1 throughout the differentiation strikingly resembles the evolution of the fast component of the mechanosensitive current. FPKM: fraction per kilobase per million reads. (C) Schematic of the Crispr design. The diagram shows the beginning of the Piezo1 mRNA in mES cells. The first three exons are shown, along with the coding sequence (CDS) and the first predicted transmembrane (TM) region. Two guide RNA sequences (sgRNAs) were chosen to generate a double strand break in the beginning of the first TM region. Below the diagram, a sequence reaction of a fragment of DNA extracted from one of the modified colonies is shown. In yellow is marked the targeted sgRNA sequence, and boxed in black is marked the region with a two base-pair deletion that generates a frame-shift mutation, and an early stop codon shortly after. Only one sequence for each colony was obtained after sequencing with no background, indicating a homozygous mutation. (D) Both Piezo1 knock-out colonies of mouse embryonic stem cells showed no mechanosensitive activity.
Figure 6
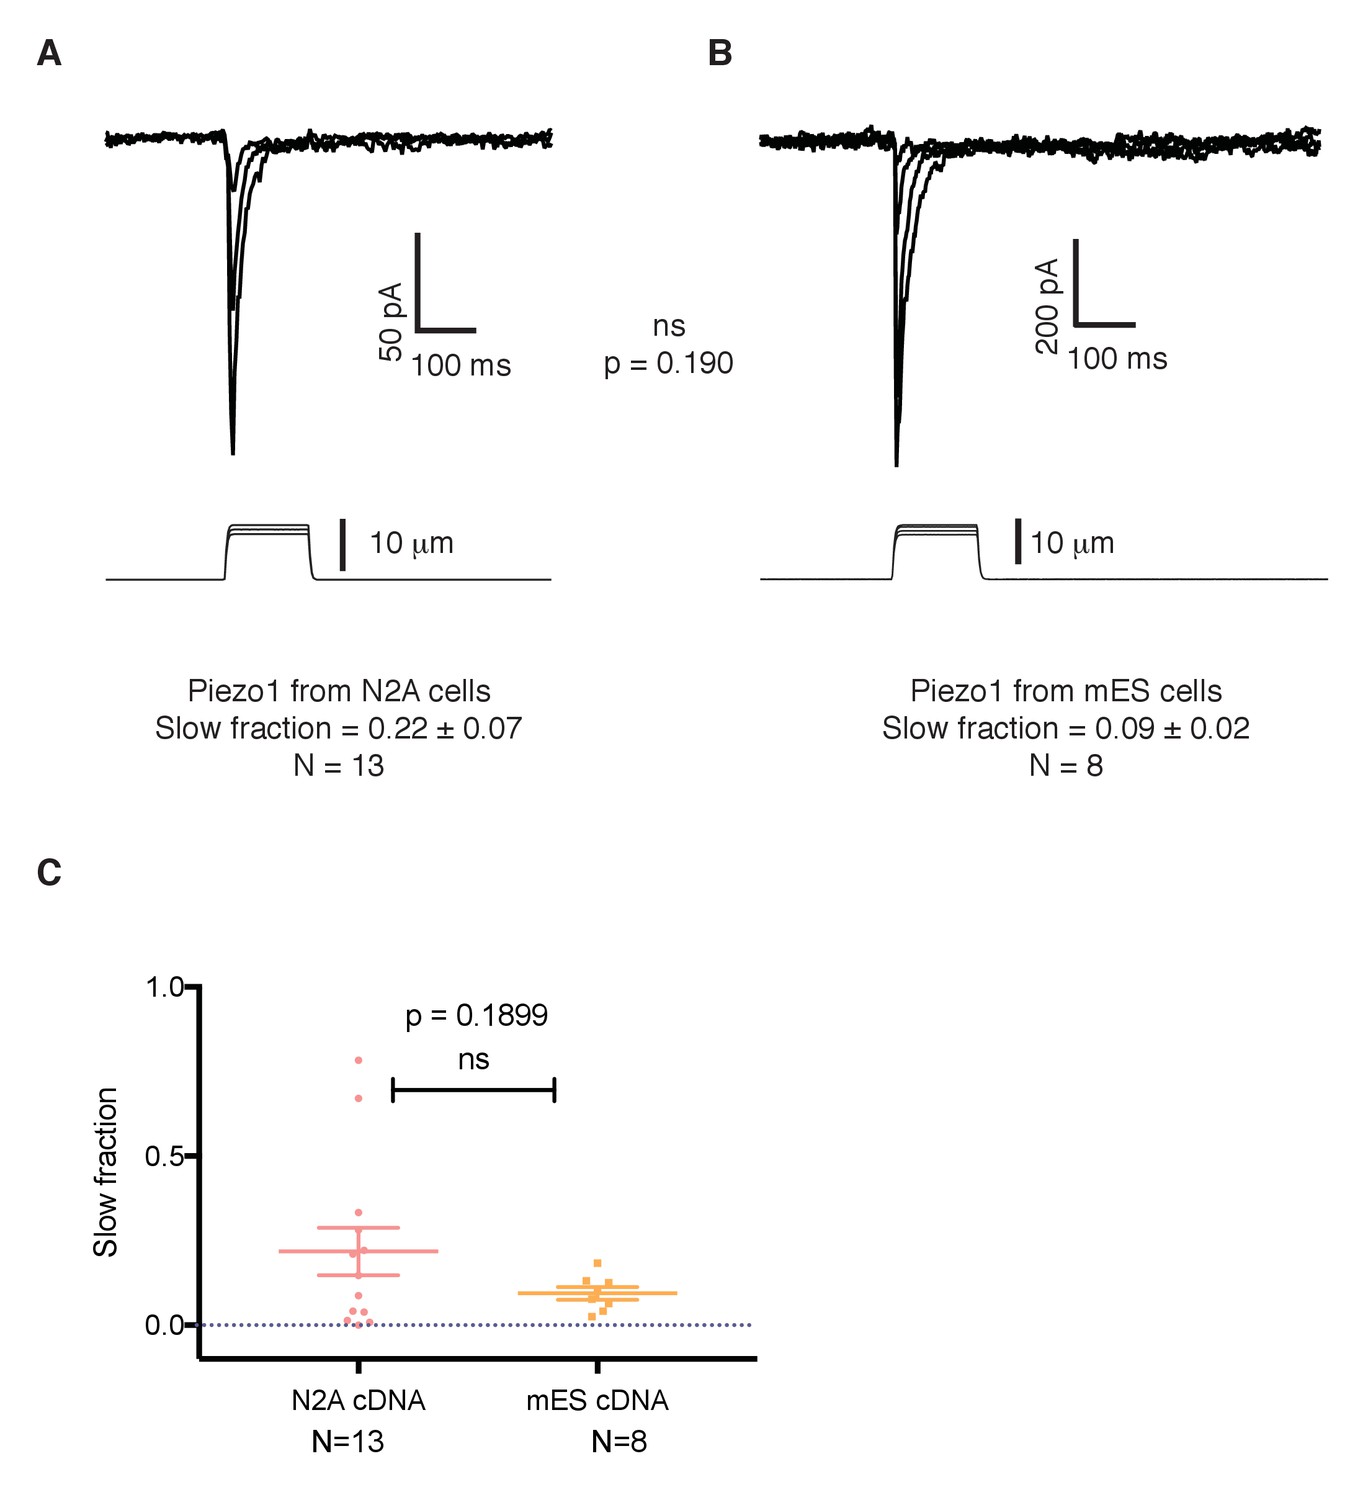
The slower kinetics of Piezo1 in mouse embryonic stem cells are not a result of mutations in its coding sequence.
(A) Mechanosensitive currents elicited by expression of Piezo1 cDNA from N2A cells in HEK293 cells. (B) Mechanosensitive currents elicited by expression of Piezo1 cDNA from mouse embryonic stem cells in HEK293. Both cDNAs differ in three aminoacids. (C) Slow fraction of mechanosensitive currents in HEK293 cells expressing either Piezo1 cDNA from N2A cells (left) or from mES cells (right). Expression of both cDNAs in HEK293 cells shows no significant difference in the kinetics, p=0.1899.
Figure 7
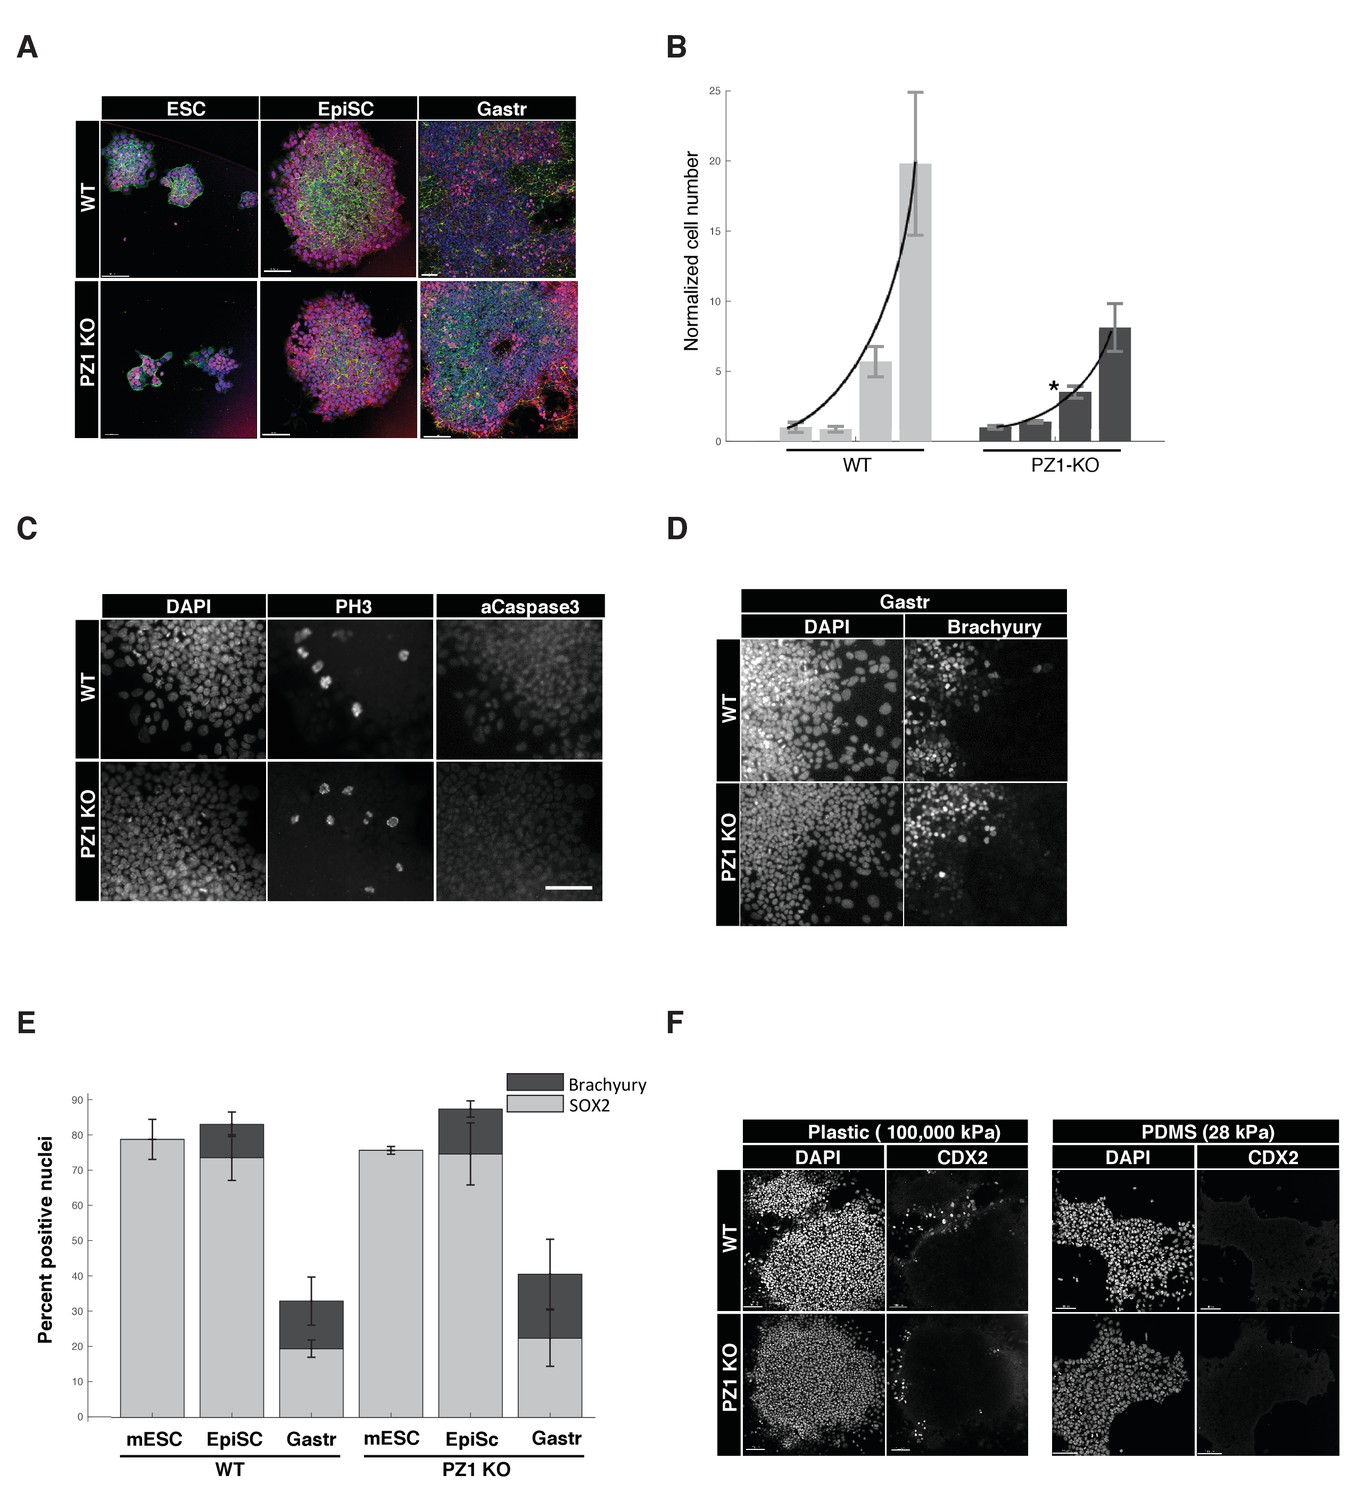
Piezo1 knockout affects the rate of proliferation but not pluripotency or gastrulation phenotypes in mouse ESCs.
(A) Immunostaining and confocal imaging of Piezo1 knockout (PZ1KO) pluripotent stem cells (bottom row) at naïve (ESC), primed (EpiSC), or gastrulation-model (Gastr) stages shows no differences in expression of pluripotency master regulator SOX2 (pink), typical pattern of cell to substrate (focal adhesions, at lower z, not shown) and intercellular adhesion by F-Actin (Phalloidin, green) and E-Cadherin (red), or general colony morphology. 1.6 μm Z section or oblique virtual section of representative colonies of WT and Piezo1 knockout (n = 2,3) ESC clones. 20x z stacks, scale bar 80 μm. (B) Growth curve of WT mESC stage cells showed PZ1KO lines were significantly slower (exponential curve fit). Mean number of cells per well per genotype ± sd (n = 2 WT, 3 KO lines per genotype) normalized to mean per genotype at day1. Exponential fit constant significantly different Students T-test p<0.05. (C) No significant difference in mitotic fraction or cell death. Immunostaining and epifluorescent imaging of WT (top) and PZ1KO for DAPI, M-phase cells (PH3), and dying cells (Caspase 3, pyknotic nuclei) showed no significant difference between genotypes in mitotic fraction (PH3 +nuclei) mean/genotype ± sd%, WT, n = 2, PZ1KO, n = 3 lines. Neither the cell death marker activated caspase3 or pyknotic nuclei were detectable in either genotype, confirming equivalently negligible levels of cell death. Scale bar is 80μm. (D) Epifluorescent imaging of transcription factor markers of pluripotency (SOX2, Figure 1A) and ectoderm (SOX2, Figure 1A) and Mesoderm (Brachyury) germ layer identities at naïve (mESC), primed (EpiSC) and gastrulation stage differentiation (Gastr, shown). Same scale bar as in C. (E) Quantitative cell scoring showed no significant difference between WT (n = 2) and PZ1KO (n = 3) clones, mean% of cells/line+/sd at each stage. Brachyury not tested at mESC stage since no differentiation was present. Decreased SOX2 percentage at Gastr stage indicated restriction of SOX2 expression to ectodermal lineage during gastrulation and was not different between genotypes. T-test p<0.05. (F) EpiSC stage cultures grown on standard tissue culture plastic substrate (100,000 k Pa) showed a small subpopulation of spontaneously differentiating cells (CDX2+, trophectoderm, embryonic endoderm, or paraxial mesoderm) whereas culture on a less stiff substrate (28 kPa PDMS) showed no spontaneous CDX2 differentiation. PZ1KO lines showed the same differential differentiation inhibiting response to substrate stiffness.
Tables
Table 1
Quantitative comparison of pluripotency and differentiation phenotypes.
Proliferation was measured by seeding 4 96well plate wells, imaging whole wells at day 0, 1, 3, and 6, and scoring images for total cells (DAPI+) and subtracting the number of Sytox orange+ (dead) cells = total live cells. Total growth: table shows mean cells/line/genotype/day and standard deviation; n = 2 and n = 3 lines per WT or KO genotype respectively. Total cells is the sum of cells in four replicate wells/line. Normalized growth: Each line was normalized to its own day 0 value. Curve Fit Parameters: each line was fit with an exponential growth curve and the mean growth constants were computed and found not significantly different. Colony Size: whole colonies were segmented using MultiWavelength Cell Scoring adjusting the size and intensity thresholds so that entire colonies were segmented by DAPI signal, rather than individual cells. Mean values for n colonies counted for each line at day 0 and day six are shown, unit is μm2. No significant differences were found between genotype at either day. Proliferation: Three randomly chosen 10x fields (mean 1473 cells/field) per line were scored for total DAPI +cells and cells positive for phosphohistone H3 (PH3) in Metamorph. No significant difference between genotypes was observed. No cells were positive for activated caspase-3 or showed pyknotic nuclei, indicating negligible levels of cell death across genotypes. All statistics Student’s t-test, 1 tail, 2 sample unequal variance.
| Total growth | ||||
|---|---|---|---|---|
| WT (n = 2) | SD | KO (n = 3) | SD | |
| Day 0 | 402.50 | 127.01 | 721.42 | 115.63 |
| Day 1 | 342.75 | 61.23 | 849.33 | 64.51 |
| Day 3 | 2289.50 | 334.41 | 2043.17 | 346.46 |
| Day 6 | 7919.38 | 1728.79 | 5234.17 | 1350.08 |
| Normalized growth | ||||
| WT (n = 2) | SD | KO (n = 3) | SD | |
| Day 0 | 1.000 | 0.356 | 1.000 | 0.133 |
| Day 1 | 0.864 | 0.206 | 1.388 | 0.077 |
| Day 3 | 5.689 | 1.076 | 3.518 | 0.427 |
| Day 6 | 19.802 | 5.096 | 8.124 | 1.708 |
| Curve Fit Parameters | ||||
| Growth Constant | Goodness of Fit | |||
| HB9 (wt) | 0.443 | 0.985 | ||
| WT13 | 0.489 | 0.996 | ||
| KO5 | 0.377 | 0.993 | ||
| KO6 | 0.287 | 0.994 | ||
| KO8 | 0.316 | 0.971 | ||
| Mean Growth Constant | SD | |||
| WT | 0.326 | 0.033 | ||
| KO | 0.466 | 0.046 | ||
| p-value | 0.316 | |||
| Colony size | ||||
| Day 0 | Day 6 | |||
| Mean | SD | Mean | SD | |
| HB9 (wt) (day 0, 6: n = 122, 30) | 45666.2 | 81641.1 | 133231.9 | 66024.3 |
| WT13 (day 0, 6: n = 74, 28) | 78107.7 | 94966.6 | 156237.9 | 90772.1 |
| KO5 (day 0, 6: n = 128, 24) | 40269.1 | 74822.2 | 129713.2 | 81019.6 |
| KO6 (day 0, 6: n = 69, 17) | 101383.7 | 120527.3 | 95029.8 | 42050.6 |
| KO8 (day 0, 6: n = 71, 19) | 84821.1 | 108565.5 | 145450.6 | 107648.8 |
| Day 0 | Day 6 | |||
| Mean | SD | Mean | SD | |
| WT | 61886.9 | 22939.7 | 144734.9 | 16267.7 |
| KO | 75491.3 | 31607.4 | 123397.8 | 25796.9 |
| p value | 0.618 | 0.170 | ||
| Proliferation | ||||
| % PH3+ of total DAPI | mean% PH3+ | SD | ||
| HB9 (wt) | 3.487 | WT | 3.224 | 0.372 |
| WT13 | 2.961 | PZ1KO | 3.424 | 0.218 |
| KO5 | 3.331 | T-test p value | 0.292 | |
| KO6 | 3.268 | |||
| KO8 | 3.673 | |||
Additional files
-
Transparent reporting form
- https://doi.org/10.7554/eLife.33149.010
Download links
A two-part list of links to download the article, or parts of the article, in various formats.
Downloads (link to download the article as PDF)
Open citations (links to open the citations from this article in various online reference manager services)
Cite this article (links to download the citations from this article in formats compatible with various reference manager tools)
Piezo1 forms a slowly-inactivating mechanosensory channel in mouse embryonic stem cells
eLife 7:e33149.
https://doi.org/10.7554/eLife.33149


