ICE1 promotes the link between splicing and nonsense-mediated mRNA decay
- National Heart, Lung, and Blood Institute, National Institutes of Health, United States
- National Institutes of Health, United States
Figures
Figure 1 with 4 supplements
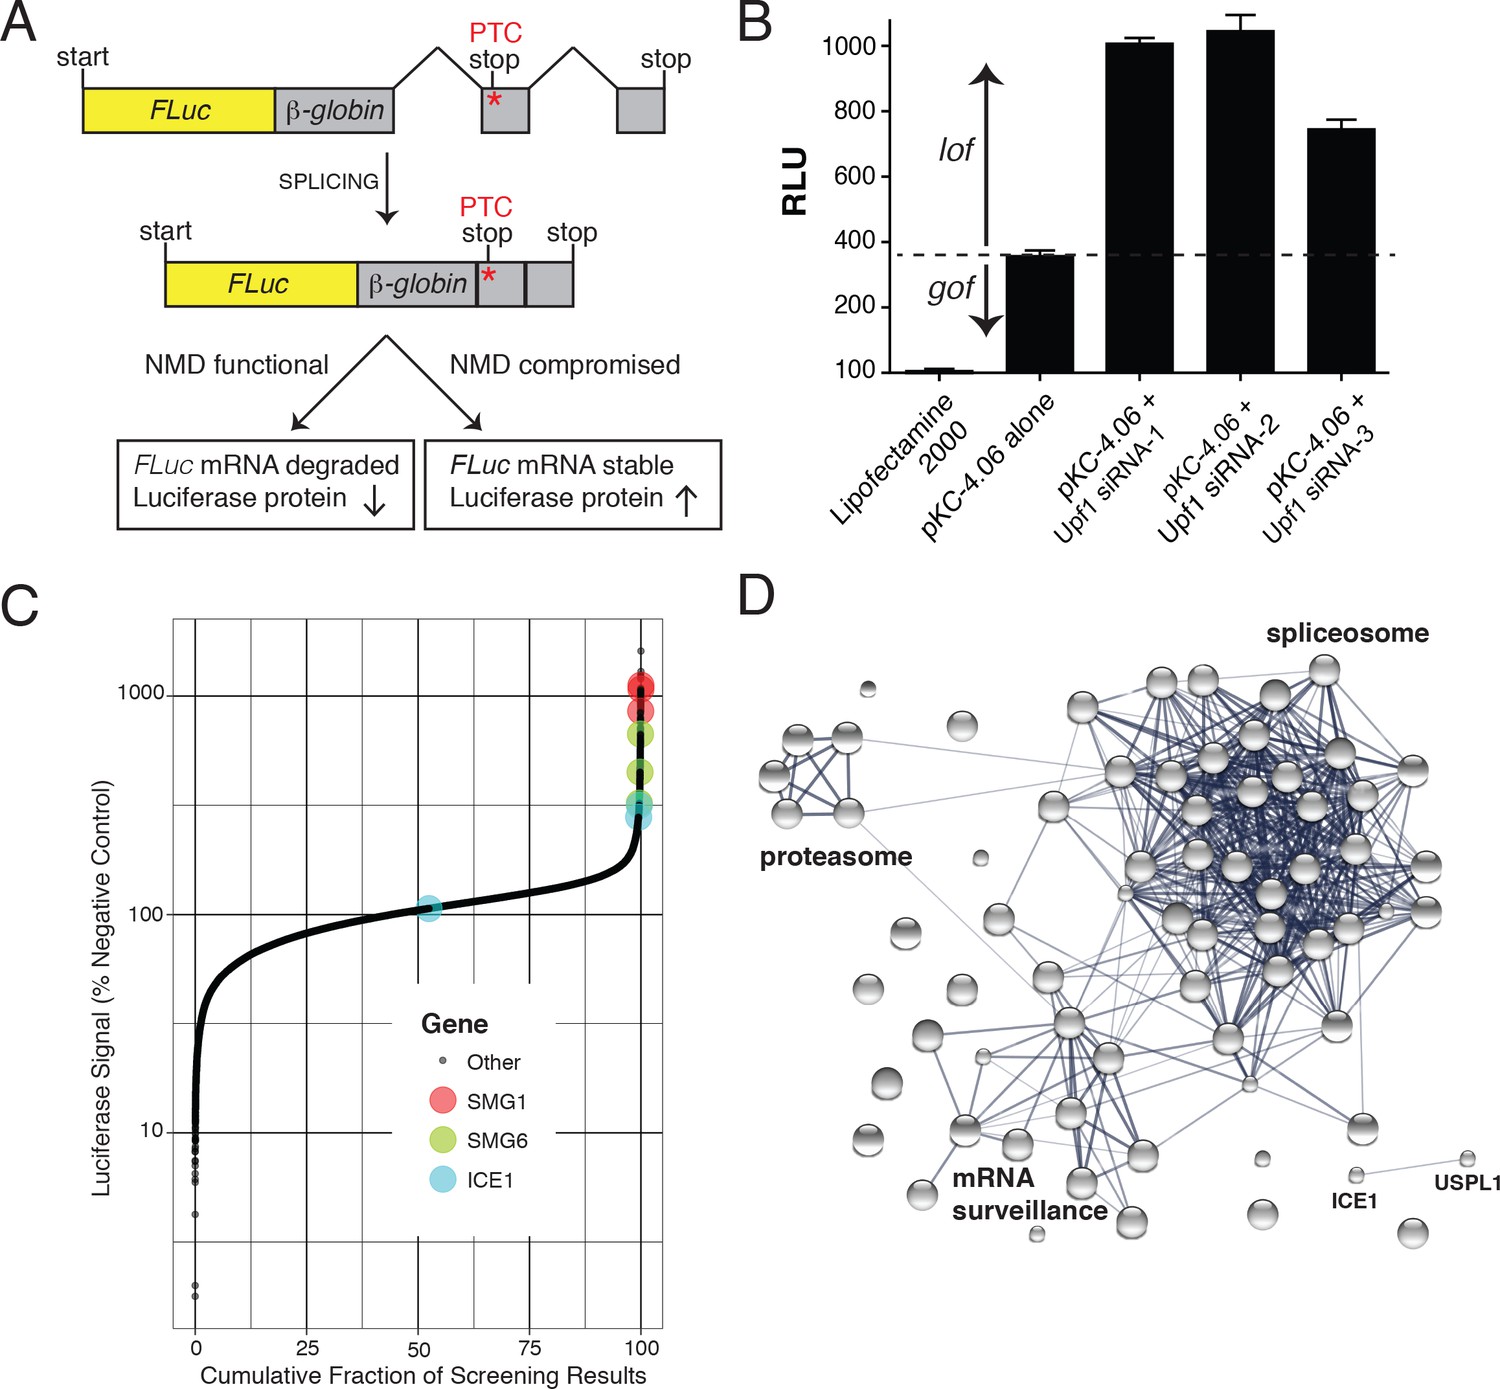
FLuc NMD-targeted assay for high-throughput RNAi screening.
(A) Fusion construct design of the NMD loss-of-function (lof) gain-of-signal (gos) reporter system (3XFLAG-FLuc-βglobinUGA) where a premature termination codon (PTC) within the second exon of the β-globin gene targets the mRNA for rapid NMD (FLuc, firefly luciferase). (B) Silencing of the NMD factor UPF1 using three different siRNAs increased expression of transiently expressed luciferase from the NMD 3XFLAG-FLuc-βglobinUGA construct. (C) Control normalized, log-transformed MAD Z-scores of genome-wide siRNA screen illustrating high-ranking genes from the NMD pathway. (D) STRING pathway analysis illustrating tight connectivity of highest ranking genes into RNA-associated processing pathways.
Figure 1—figure supplement 1
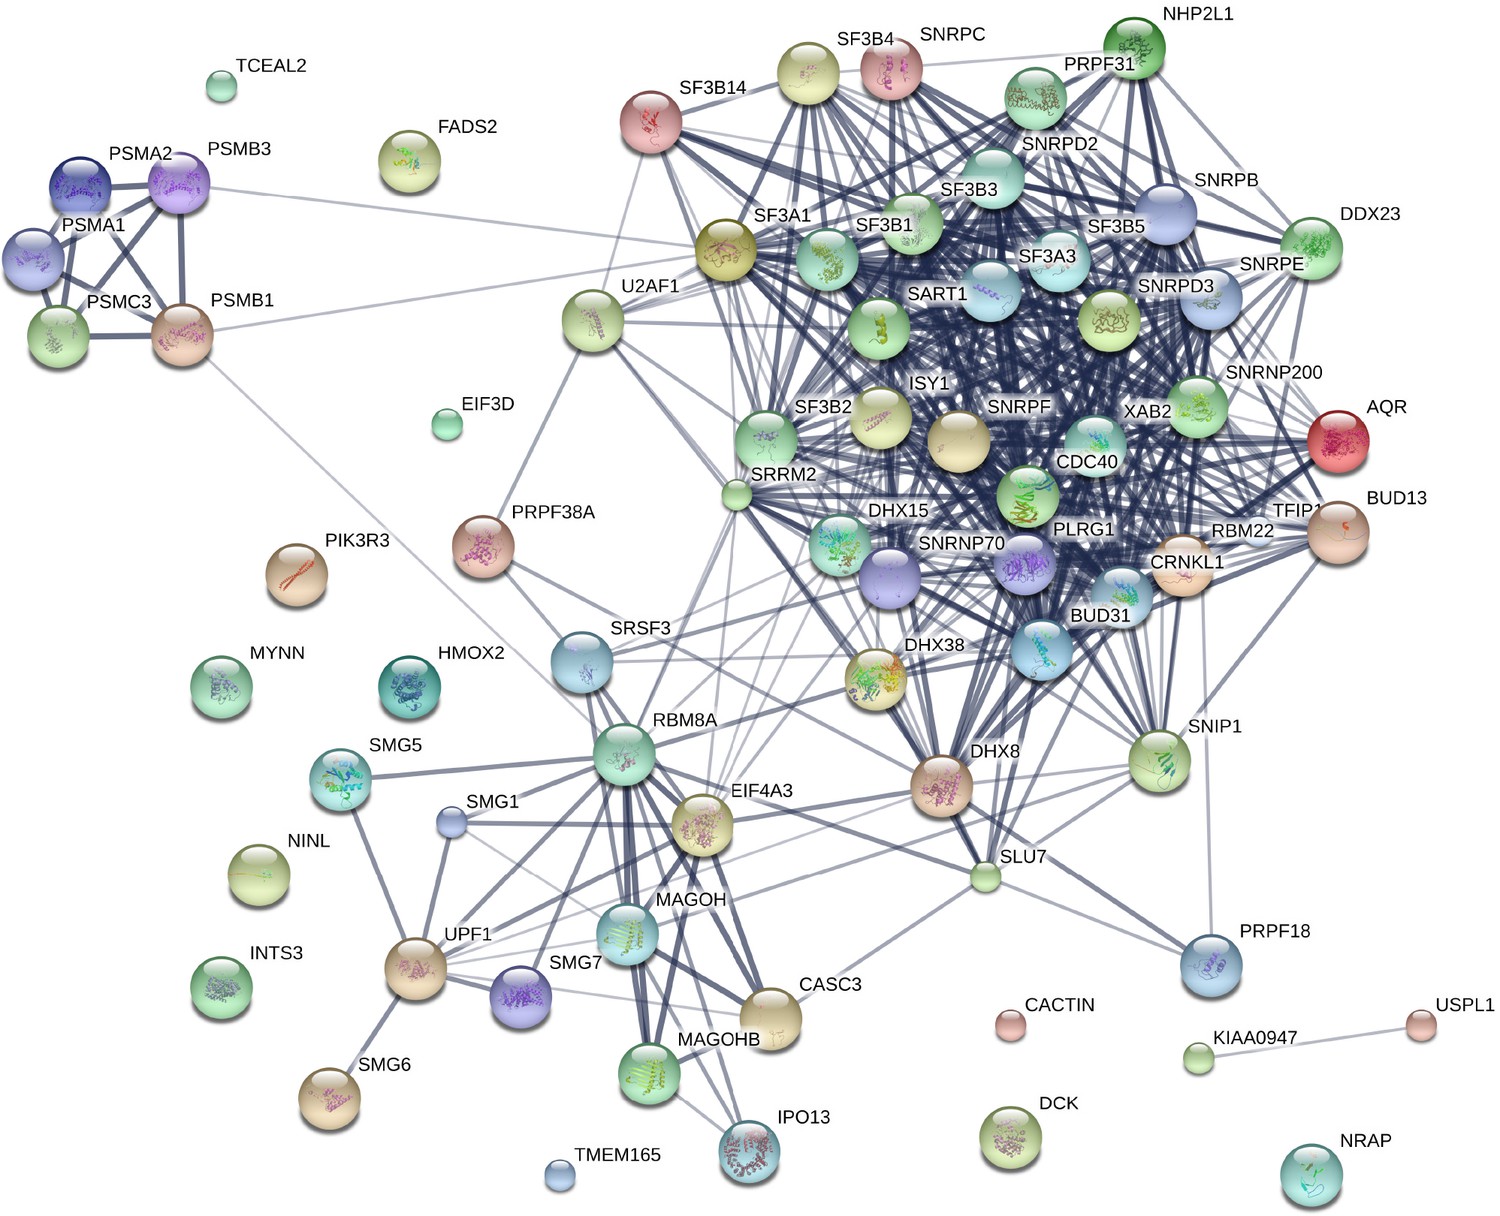
STRING network analysis of genes identified in RNAi screen.
STRING was used to identify any known interactions between the top screen hits (median seed corrected Z > 1.5). This analysis indicated a significant enrichment in known interactions, including many associated with NMD and the spliceosome.
Figure 1—figure supplement 2
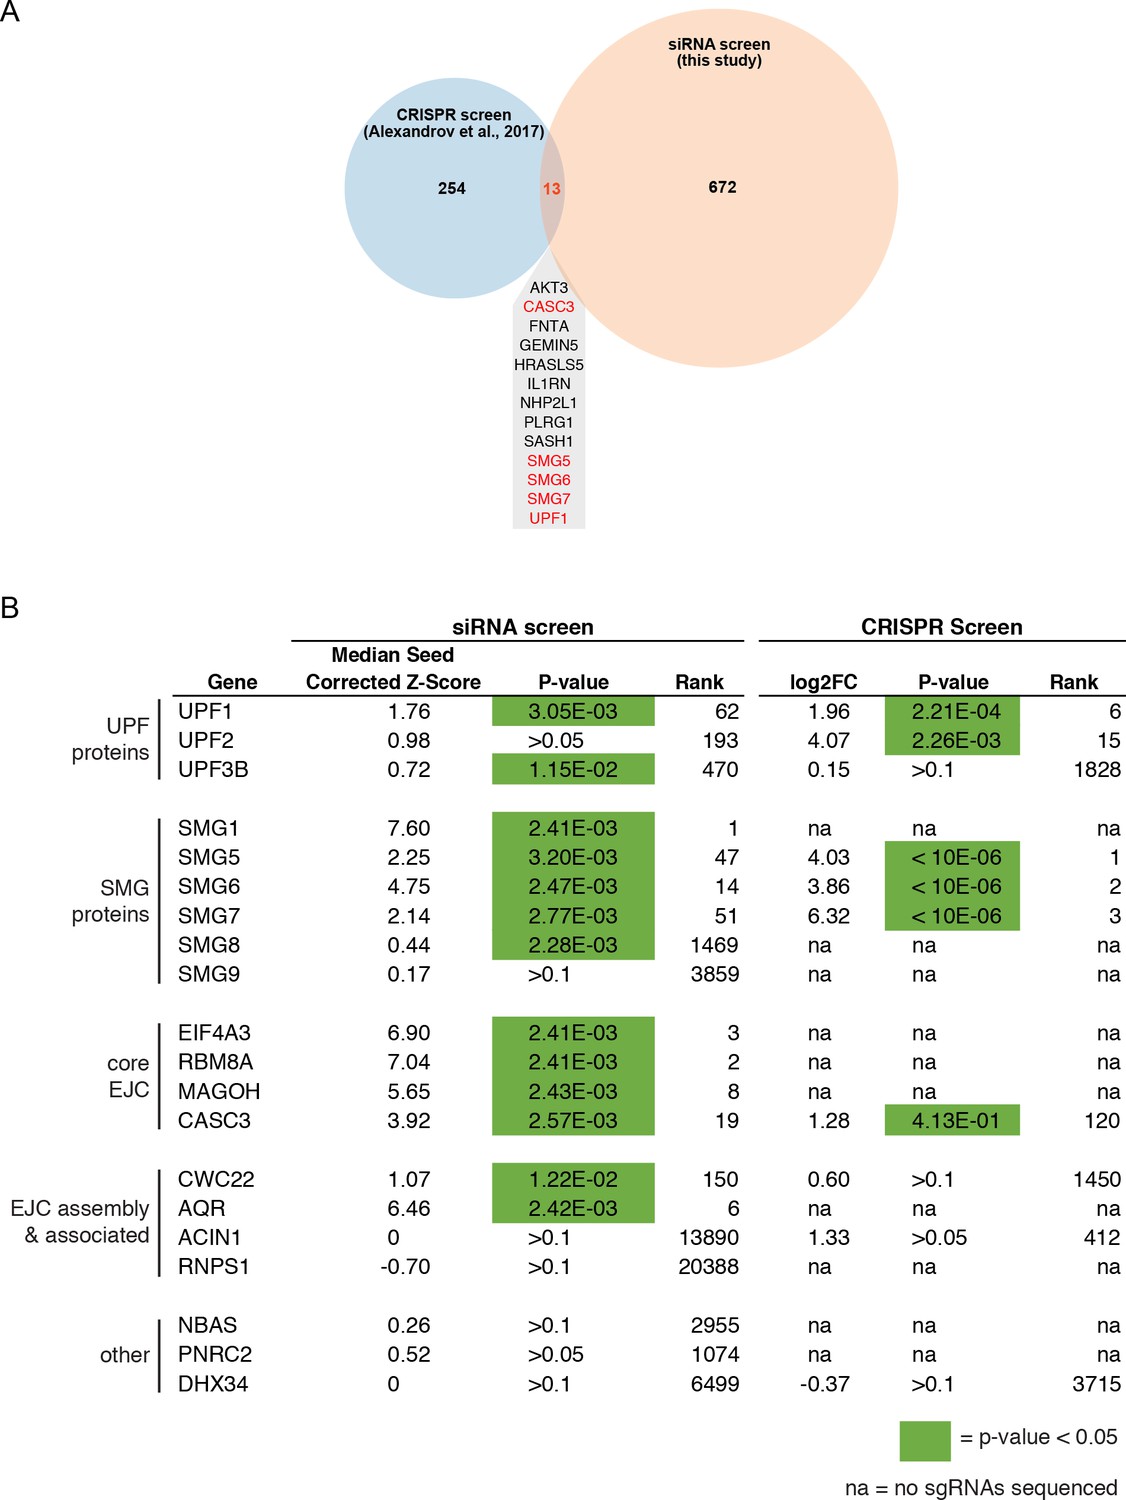
Comparison of siRNA and CRISPR screens.
(A) Venn diagram of genes identified as top hits in the RNAi screen and a published CRISPR screen for NMD factors. Shown are genes with positive seed-corrected Z-scores (siRNA) or fold change (CRISPR, with gene-level analysis using MAGeCK software) and P-values less than 0.05. Genes identified in both screens are listed, with known NMD factors highlighted in red. (B) Recovery of proteins previously implicated in NMD in the siRNA and CRISPR screens. Green indicates p-values less than 0.05. Rank Z-score (RNAi) or rank MAGeCK score (CRISPR) are shown. For CRISPR data, ‘na’ indicates that no sgRNA sequences were identified in the input pool.
Figure 1—figure supplement 3
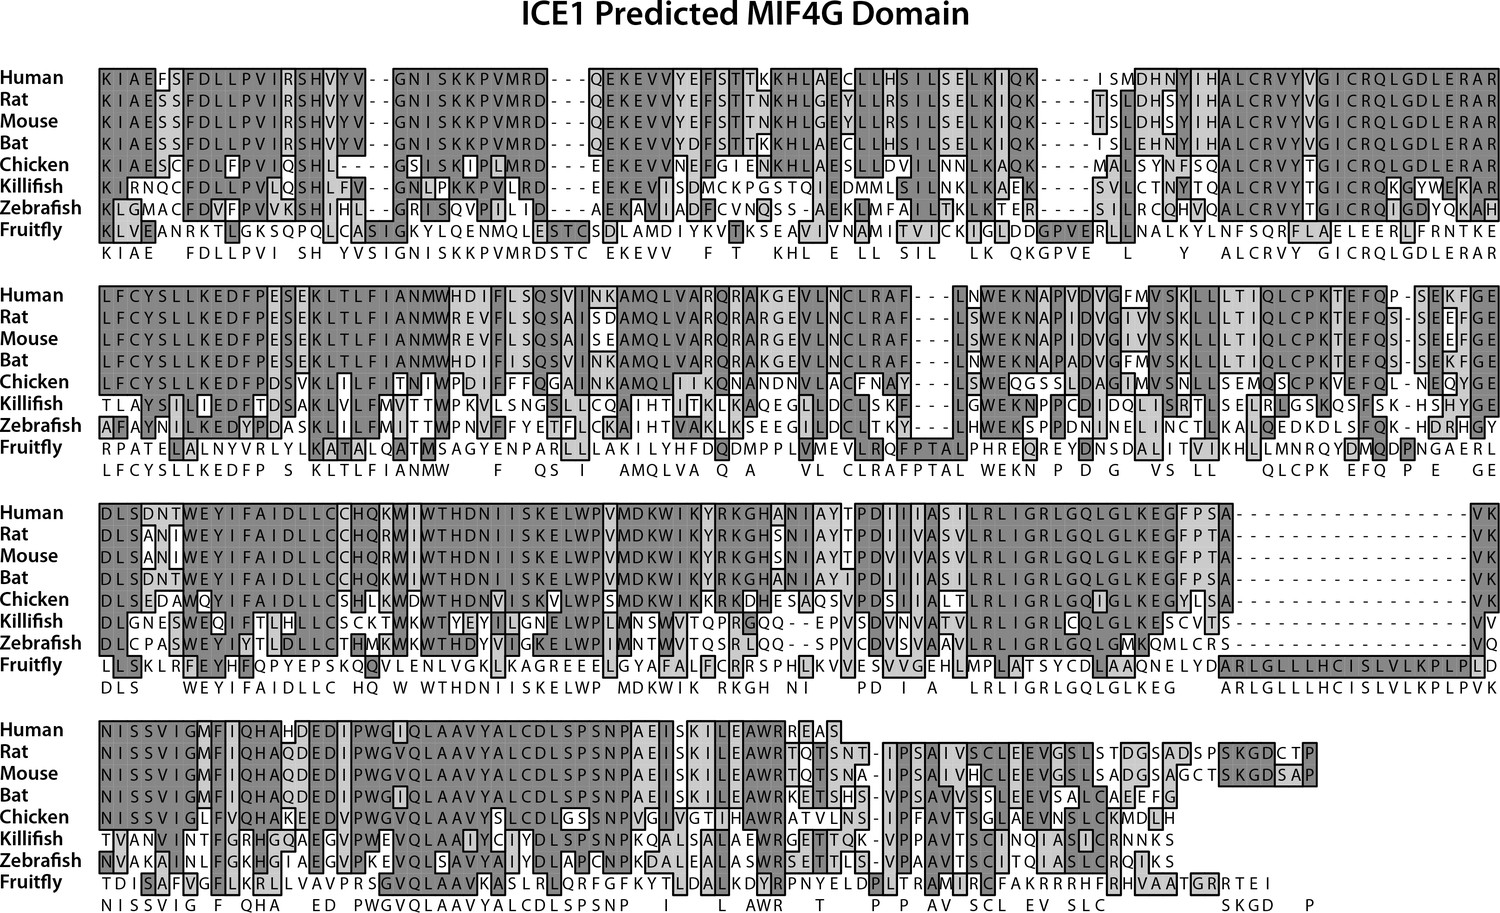
Phylogenetic alignment of the predicted ICE1 C-terminal MIF4G domain.
T-Coffee multiple sequence alignment of the ICE C-terminus from human (H. sapiens), rat (R. norvegicus), platypus (O. anatinus), chicken (G. gallus), zebrafish (D. rerio), coelacanth (L. chalumnae), and frog (X. tropicalis). Absolutely conserved residues are shaded in dark grey, while functionally conserved residues are shaded in light grey. Similarity scores with Human ICE1 are 90.9% (Rn), 85.8% (Oa), 75.4% (Gg), 67.2% (Dr), 77.7% (Lc), and 76.3 (Xt).
Figure 1—figure supplement 4

Predicted MIF4G domain of ICE1 modeled on third MIF4G domain of UPF2.
Protein Homology/analogY Recognition Engine V 2.0 (PHYRE2) software predicted a putative MIF4G domain in the C-terminus of ICE1 based on the known structure of the third MIF4G domain of UPF2 with 94% confidence.
Figure 2 with 2 supplements

ICE1 depletion results in increased abundance of NMD substrates.
(A) CDF plot of the effect of ICE1 depletion on mRNA isoforms containing and lacking PTCs as defined using the 50 nt rule. Only genes with detectable expression of both isoform types were considered. Statistical significance was determined by K-S test. (B) (Top) Schematic illustrating SRSF2 splicing isoforms with differential sensitivity to the NMD pathway. (Bottom) RT-qPCR analysis of NMD-insensitive and -sensitive SRSF2 transcript isoforms during ICE1 and UPF1 depletion. ICE1 knockdown efficiency shown on the left is for the cDNA libraries used in Figure 2B,D and F. (C) CDF plot of the effect of ICE1 depletion on expression of mRNAs previously determined to contain or lack actively translated uORFs. Statistical significance was determined by K-S test. (D) RT-qPCR analysis of uORF-containing mRNAs CHOP and GADD34 during ICE1 depletion. (E) Response to ICE1 depletion among genes (n = 11057) divided into quartiles according to the 3’UTR length of the most highly expressed isoform detected in Kallisto analyses. Statistical significance was determined by K-S test. (F) RT-qPCR analysis of NMD substrates with long 3’-UTRs during ICE1 and UPF1 depletion. 3’-UTR lengths are provided in nucleotides (nt) beneath the X-axis. Data represent mean values with error bars illustrating standard deviation. Asterisks indicate statistical significance (n = 3, Student’s t-test, p<0.05) between non-targeting and gene-specific siRNA knockdown values.
Figure 2—figure supplement 1
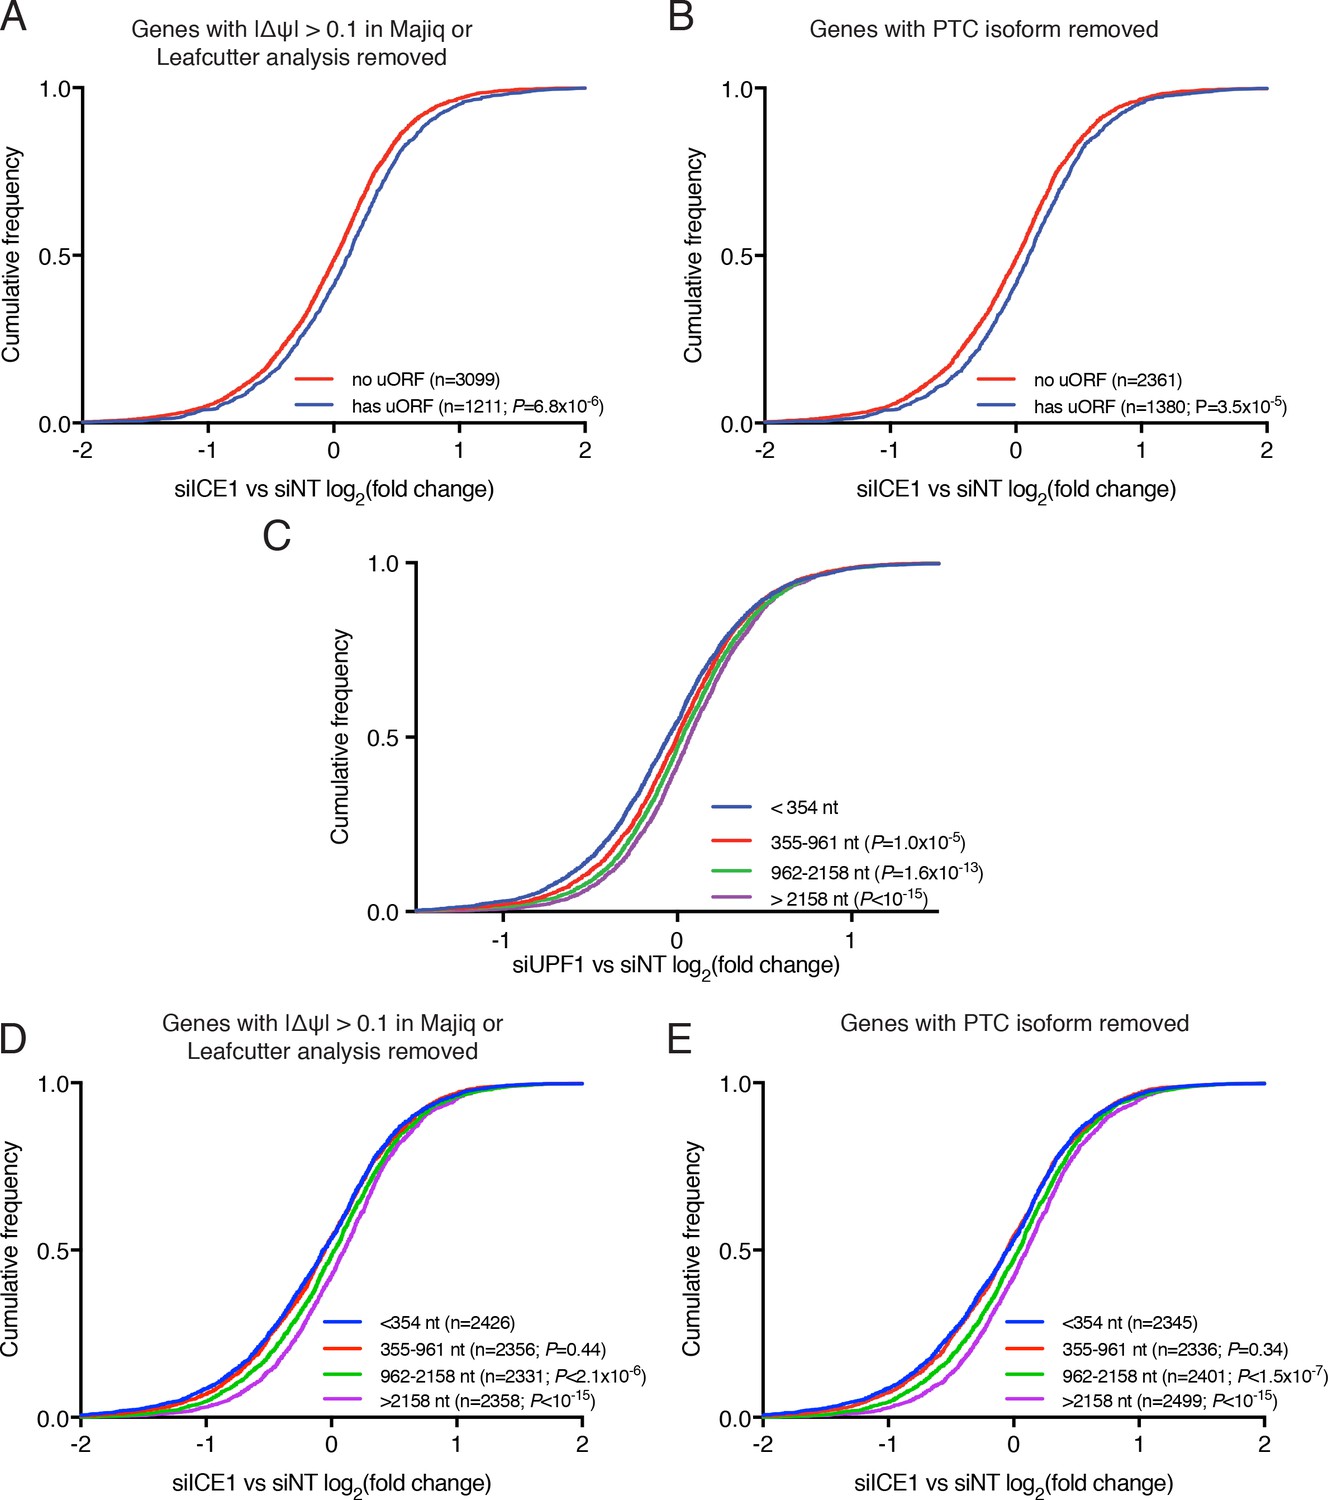
Analysis of the effect of ICE1 and UPF1 depletion on mRNAs with uORFs and long 3’UTRs.
(A) CDF plot of the response to ICE1 knockdown among genes with or without validated uORFs, as in Figure 2C. Genes with evidence of alternative splicing in either Majiq or Leafcutter analyses were removed. (B) CDF plot as in A, except that genes with PTC isoforms analyzed in Figure 2A were removed. (C) CDF plot illustrating the response to UPF1 knockdown among genes divided into quartiles according to the 3’UTR length of the most highly expressed isoform in Kallisto analyses. p-Values are derived from K-S tests relative to the shortest class of 3’UTR. (D) CDF plot as in A, except that genes were categorized according to 3’UTR length as in Figure 2E. (E) CDF plot as in B, except that genes were categorized according to 3’UTR length as in Figure 2E. Statistical significance was determined by K-S test in all panels.
Figure 2—figure supplement 2
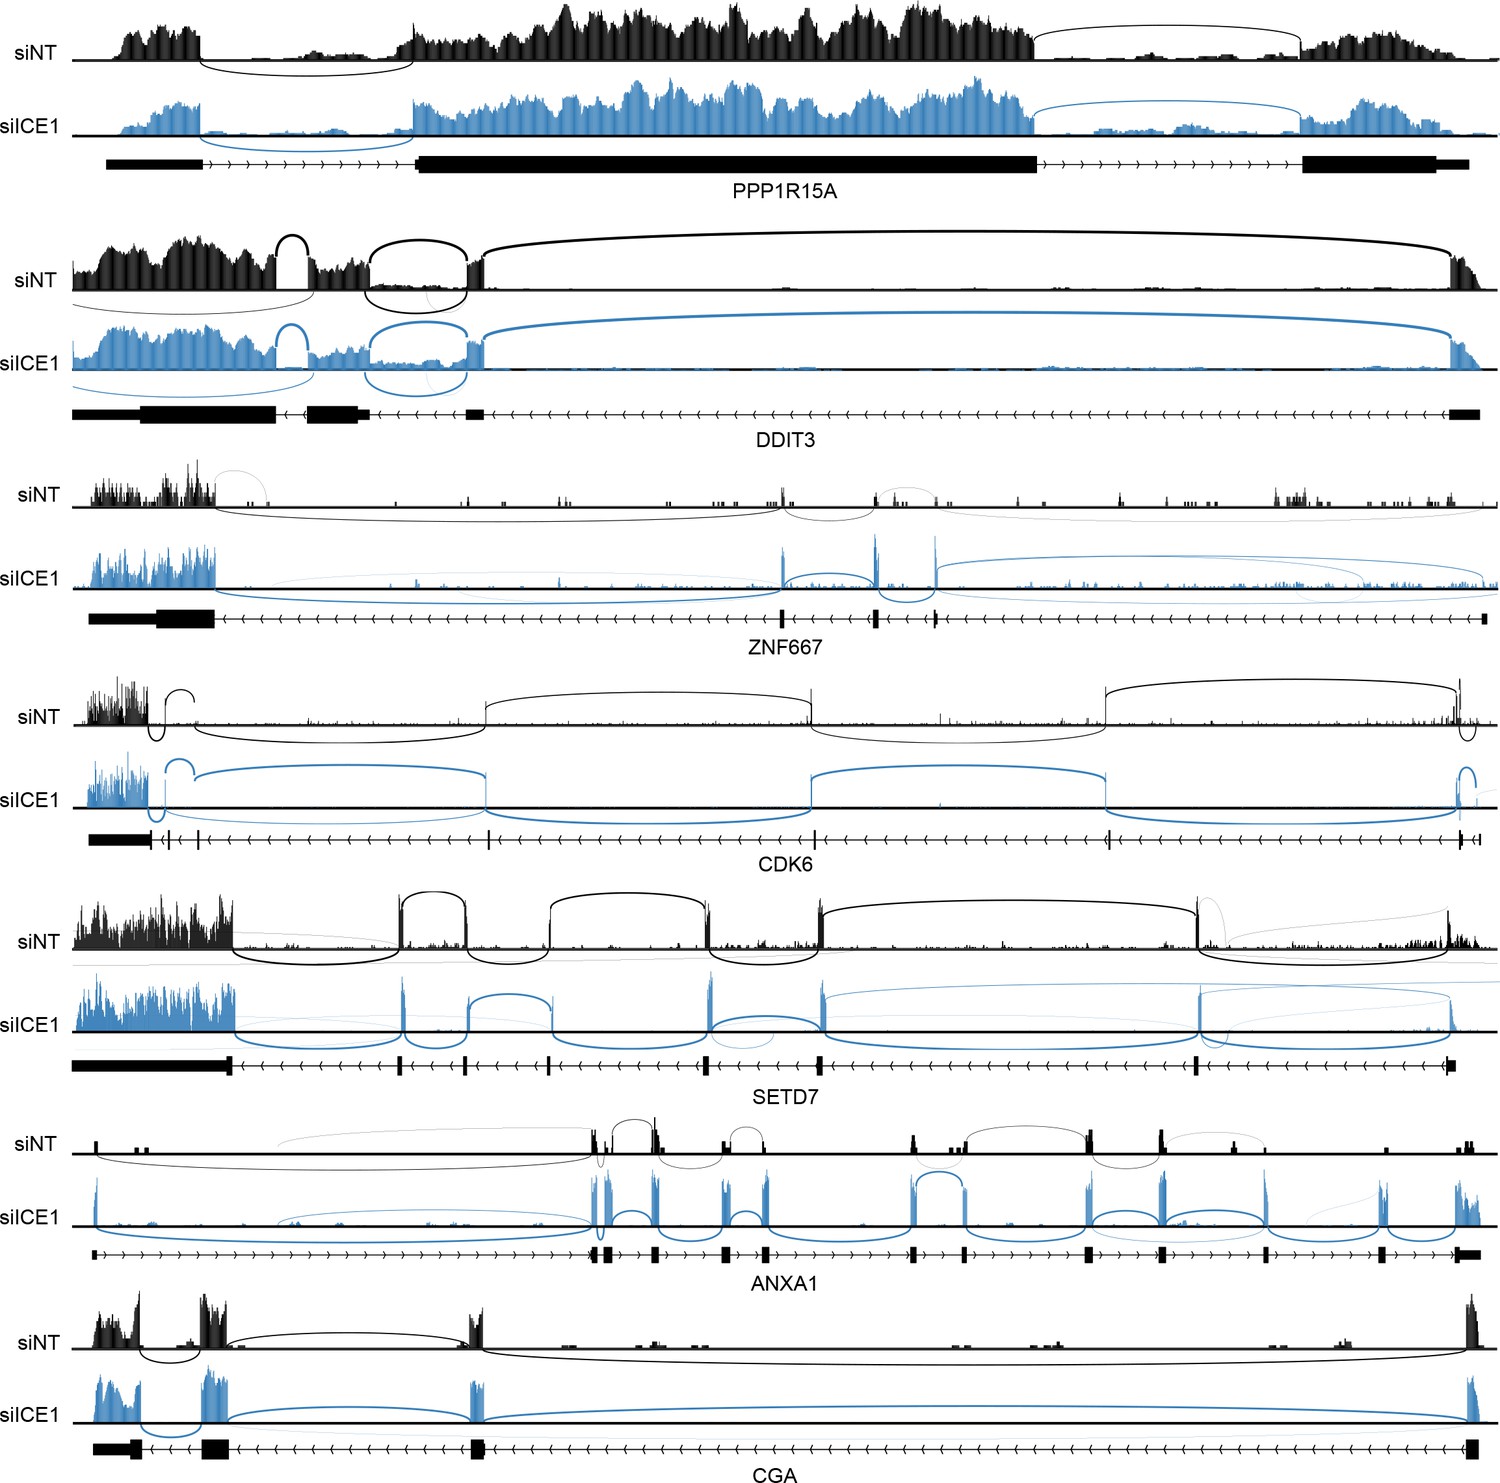
RNAseq traces for NMD targets during control and ICE1 depletion.
Representative RNAseq histograms from cells treated with non-silencing (siNT) or anti-ICE1 (siICE1) siRNAs for the indicated genes are shown. Reads were mapped with HISAT2 as described in Materials and methods. Sashimi plots were generated using Integrated Genomics Viewer Software. Each sample was auto-scaled according to the highest peak within the window shown.
Figure 3 with 2 supplements
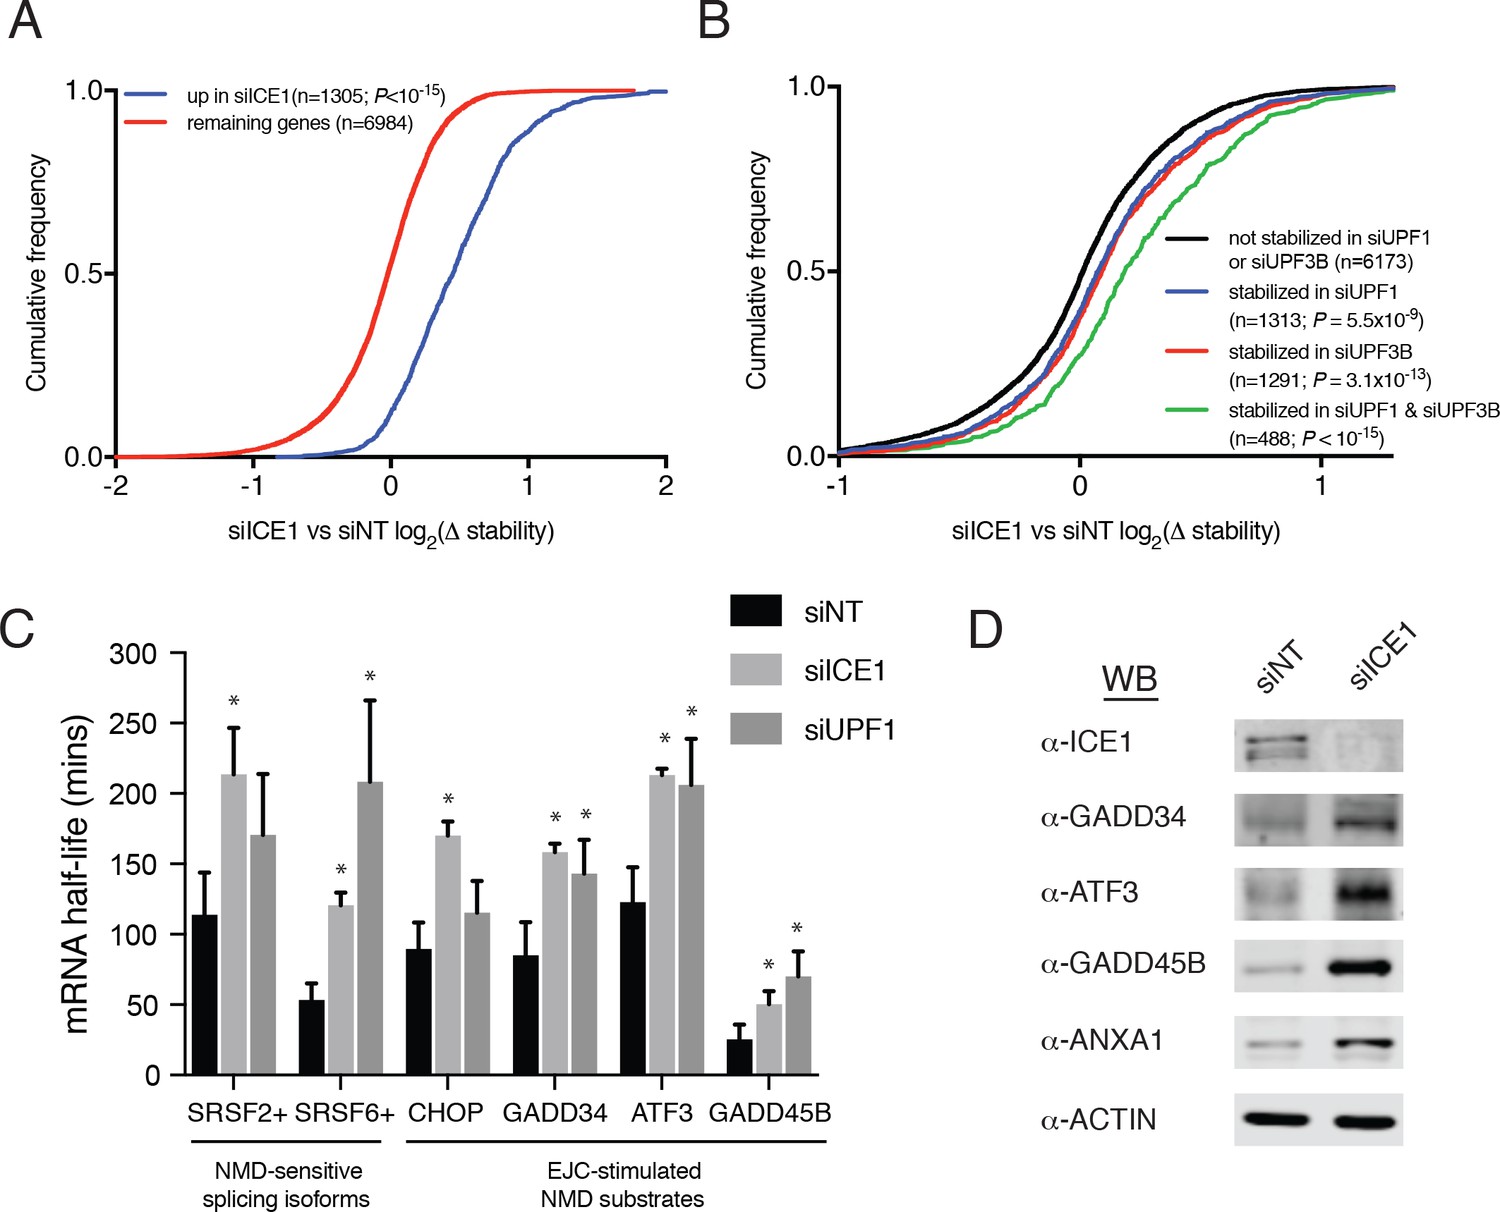
ICE1 depletion causes stabilization and translation of NMD target mRNAs.
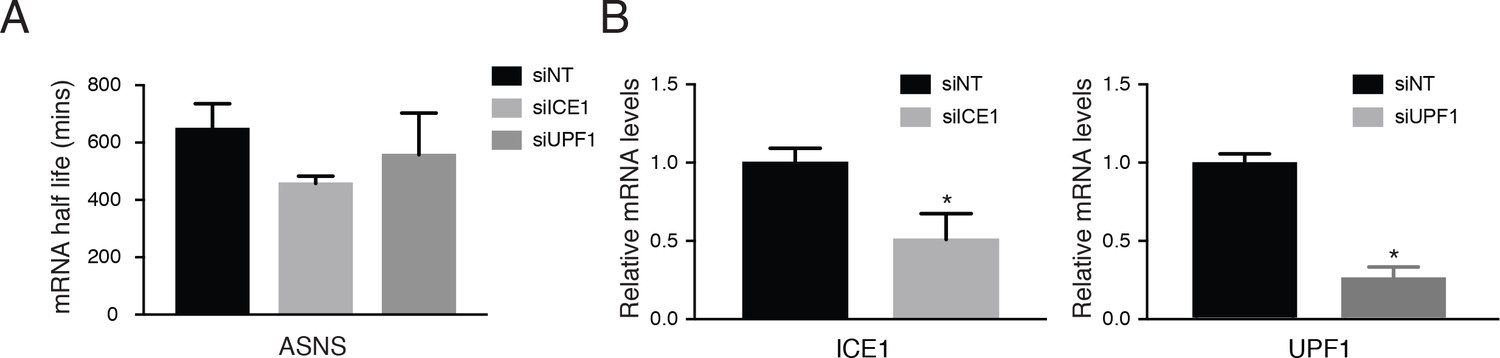
(A) CDF plot of relative mRNA stability as determined by REMBRANDTS analysis of RNAseq following siICE or siNT treatment, categorized according to the change in steady-state mRNA levels upon siICE1 treatment. Transcripts were classified as increased in siICE1 if they exhibited a log2(FC) >0.5 and a Sleuth q-value <0.05. Statistical significance was determined by K-S test. (B) CDF plot as in (A), with genes categorized according to their relative stability changes in response to UPF1 or UPF3B knockdown. Transcripts with log2(Δstablity)>0.2 and p-value<0.05 were classified as stabilized. Statistical significance was determined by K-S test. (C) Gene-specific mRNA half-lives during siRNA depletion as determined by 5-EU metabolic labeling. Bars represent mean half-life values from three biological replicates, error bars indicate standard deviation, and asterisks mark significant differences between treatments (Student’s t-test; p<0.05). (D) Western blot of protein levels from HEK-293 lysates depleted of ICE1 (siICE1) or a non-targeting control (siNT).
Figure 3—figure supplement 1
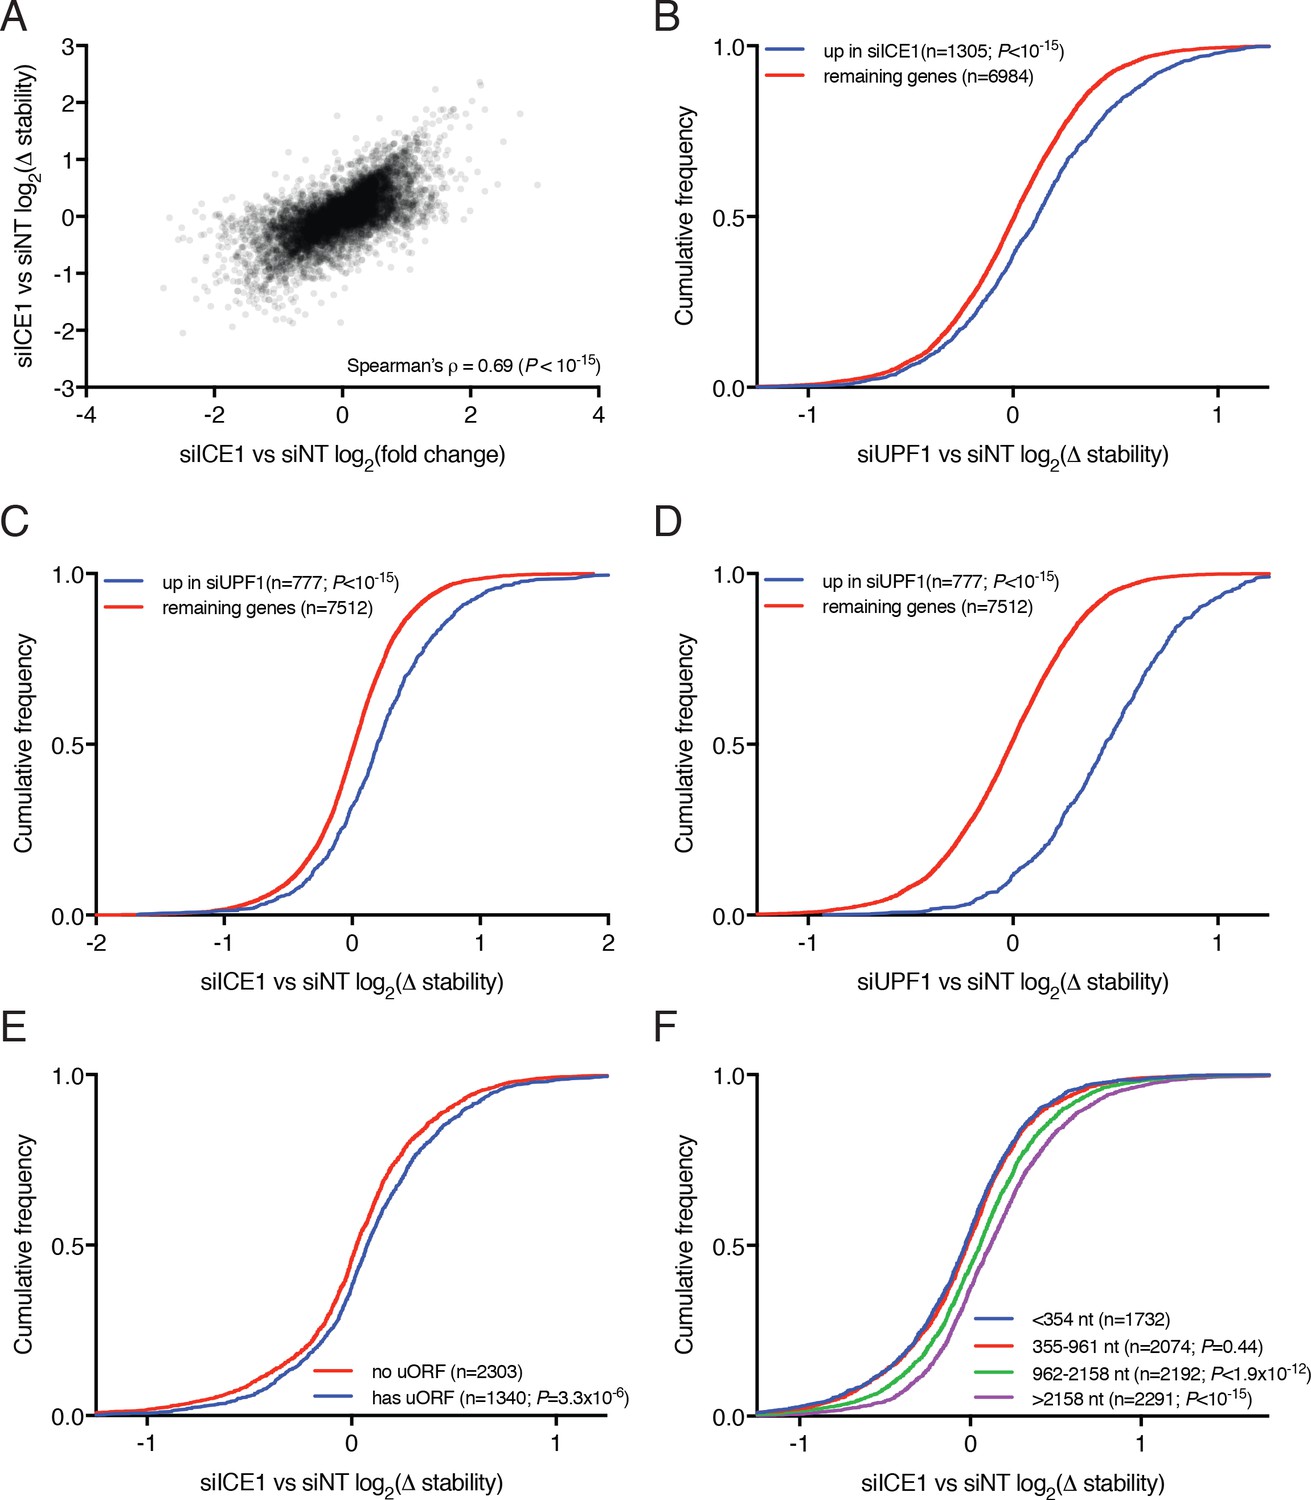
Analysis of mRNA stability changes upon UPF1 and ICE1 depletion.
(A) Scatterplot of changes in mRNA relative stability as determined by REMBRANDTS and relative abundance as determined by Kallisto, comparing siICE1 to siNT treatment. (B) CDF plot of relative mRNA stability as determined by REMBRANDTS analysis of RNAseq following siUPF1 or siNT treatment, categorized according to the change in steady-state mRNA levels upon siICE1 treatment. Transcripts were classified as increased in siICE1 if they exhibited a log2(FC) >0.5 and a Sleuth q-value <0.05. Statistical significance was determined by K-S test. (C) CDF plot as in B, with relative stability measurements of siICE1 vs. siNT treatment, categorized by changes in steady-state mRNA levels in siUPF1 treatment. (D) CDF plot as in C, except illustrating relative stability measurements of siUPF1 vs. siNT treatment. (E) CDF plot of changes in relative mRNA stability upon ICE1 depletion, with genes categorized by the presence or absence of a validated uORF as in Figure 2C. Statistical significance was determined by K-S test. (F) CDF plot as in E, with genes categorized by 3’UTR length as in Figure 2E.
Figure 3—figure supplement 2
ICE1 and UPF1 depletion controls and knockdown efficiencies in metabolic labeling studies.
(A) mRNA half-life measurements of ASNS during ICE1 and UPF1 gene depletion. ASNS serves as a control member of the ISR pathway that is not subject to EJC-enhanced NMD. (B) qPCR illustrating mRNA values of ICE1 and UPF1 levels from ‘total’ cDNA libraries. Bars represent mean mRNA abundance, error bars indicate standard deviation, and asterisks denote statistical significance as compared to the non-targeting control (n = 3, Student’s t-test; p<0.05).
Figure 4 with 1 supplement
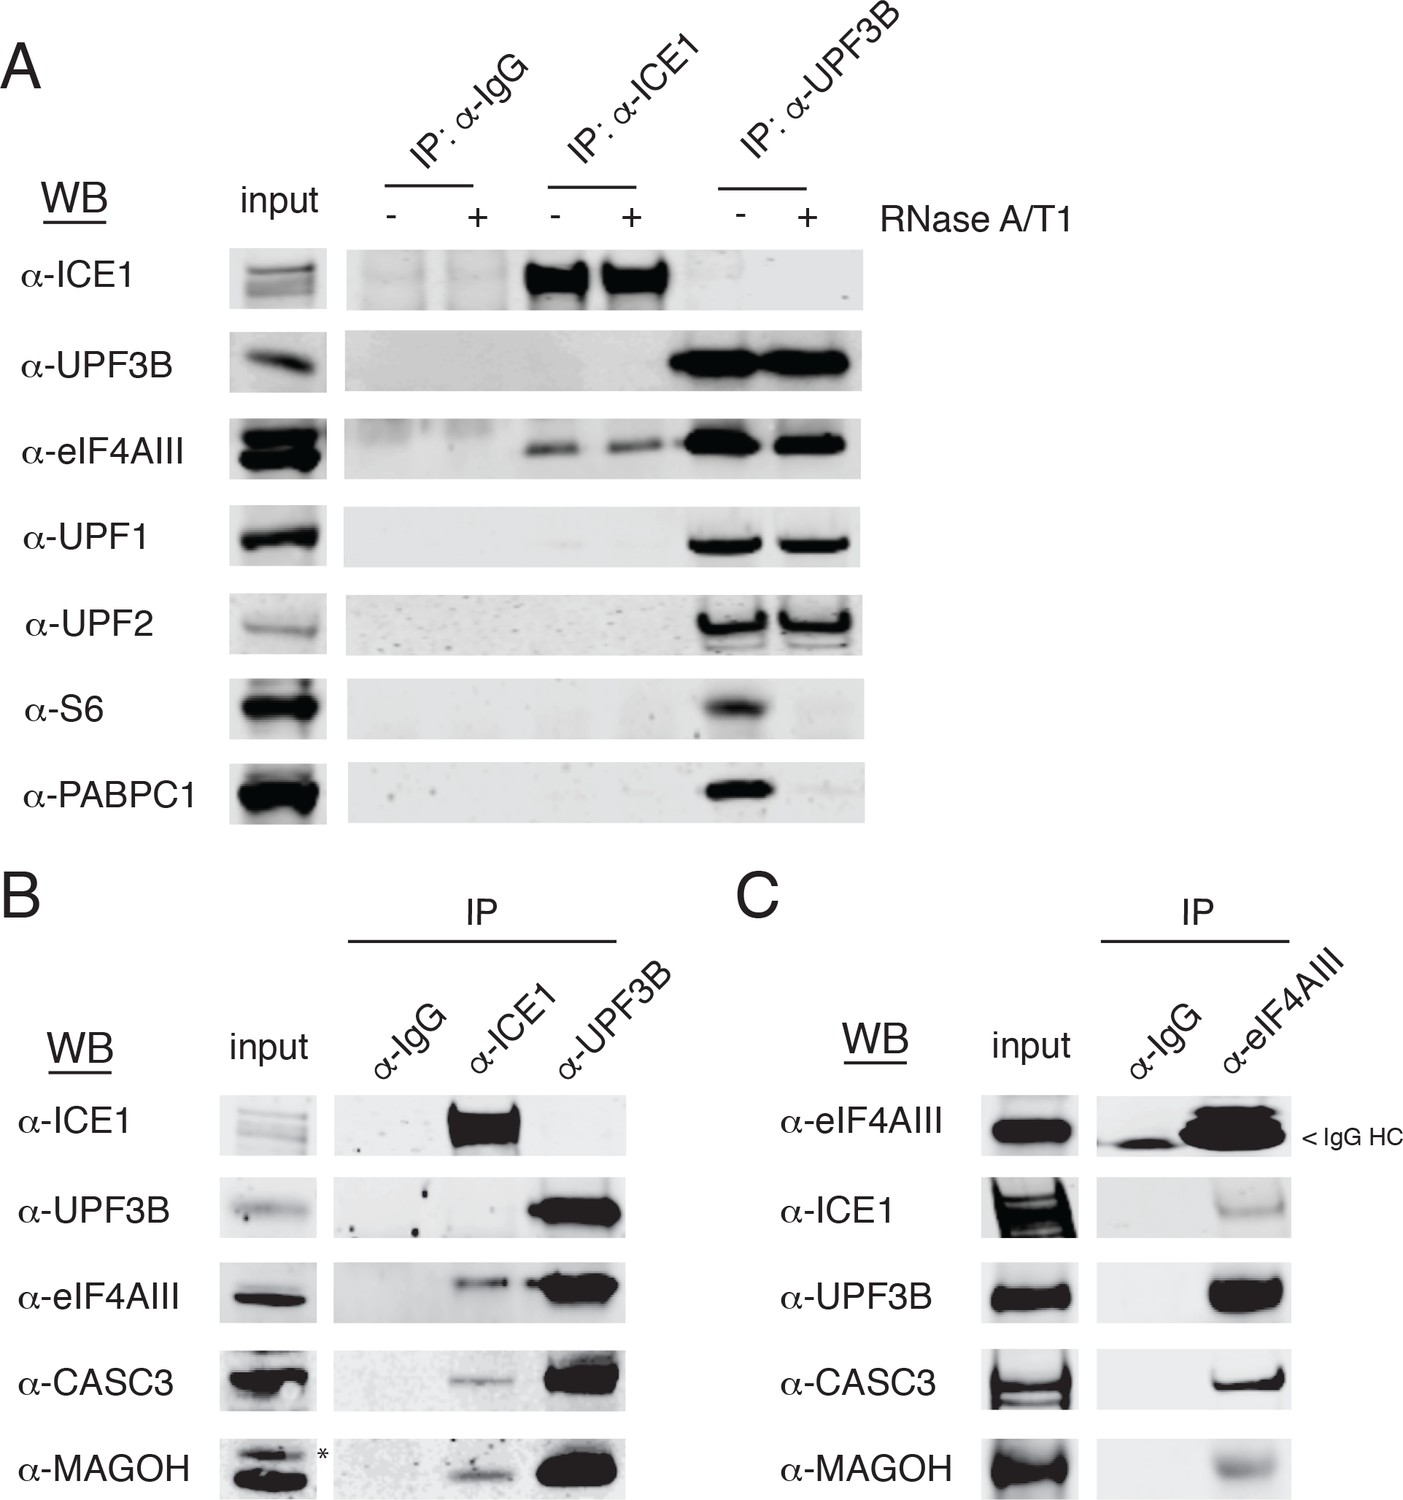
ICE1 co-immunopurifies with the core EJC in HEK-293 cells.
(A) Western blot showing lysates subject to co-immunoprecipitation with control IgG, ICE1 or UPF3B antibodies. Lysates were treated with RNase A/T1 cocktail during the copurification (+) or untreated (-), and antibodies against the indicated proteins were used for detection. (B) Western blot of cell lysates subject to co-immunoprecipitation with control IgG, ICE1 or UPF3B antibodies. Antibodies against the core EJC members used for detection are indicated at the left, and asterisk indicates non-specific band. (C) Western blot of lysates subject to co-immunoprecipitation with control IgG or monoclonal eIF4AIII antibody. Antibodies used for detection of the core and peripheral EJC components are indicated. Input lanes represent 3% of the total immunoprecipitated material.
Figure 4—figure supplement 1
ICE1 copurifies with overexpressed UPF3B in an EJC-dependent manner.
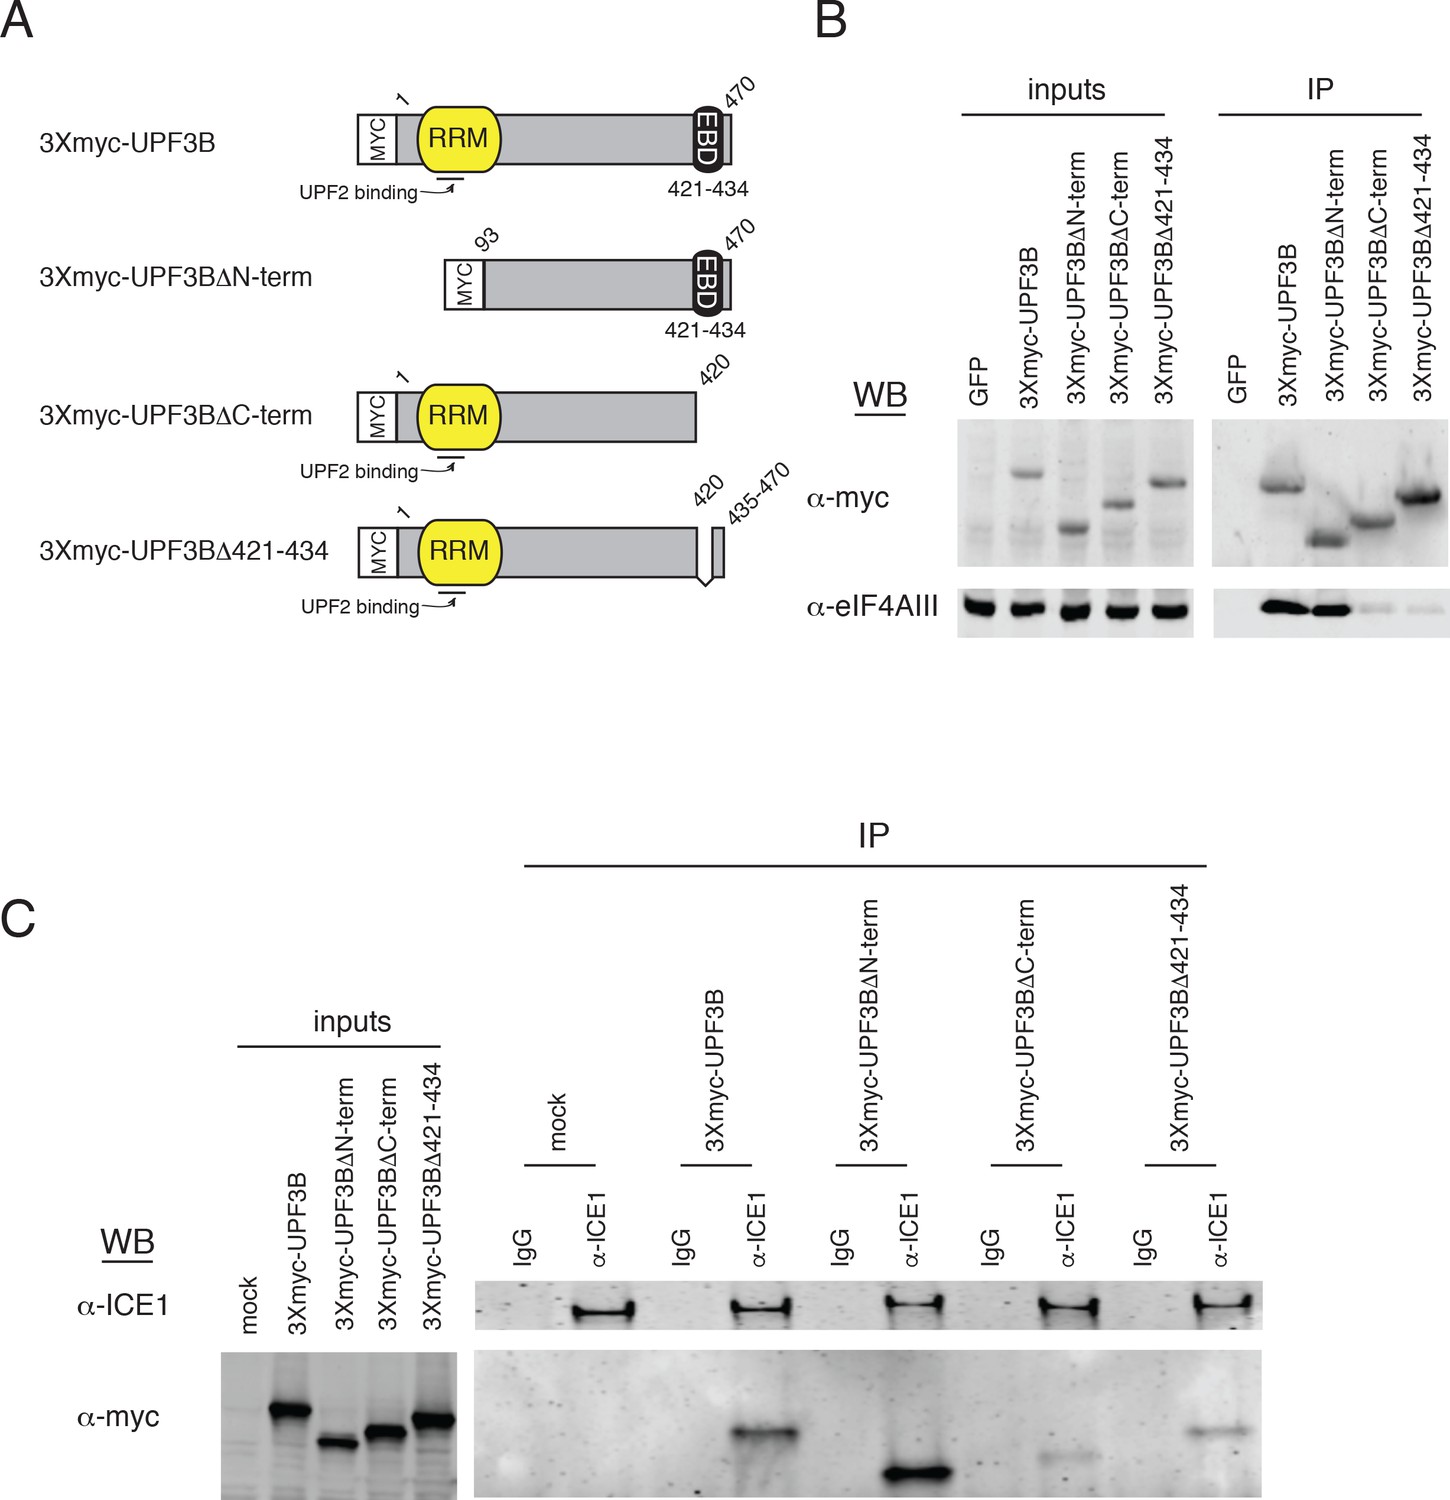
(A) Schematic of reporter constructs expressed in HEK-293 cells for immunoprecipitation studies. RRM = RNA recognition motif; EBD = exon junction binding domain. (B) Immunoblot of HEK-293 cell lysates transiently overexpressing 3Xmyc-tagged version of the reporters in panel A subjected to immunoprecipitation with anti-myc antibody. Antibodies for probing are indicated on the left, and input lanes represent 3% of the total immunoprecipitated material. (C) Immunoblot of HEK-293 cell lysates transiently overexpressing 3Xmyc-tagged versions of the reporters in panel A subjected to immunoprecipitation with an anti-ICE1 antibody. Antibodies for probing are indicated on the left, and input lanes represent 3% of the total immunoprecipitated material.
Figure 5 with 1 supplement
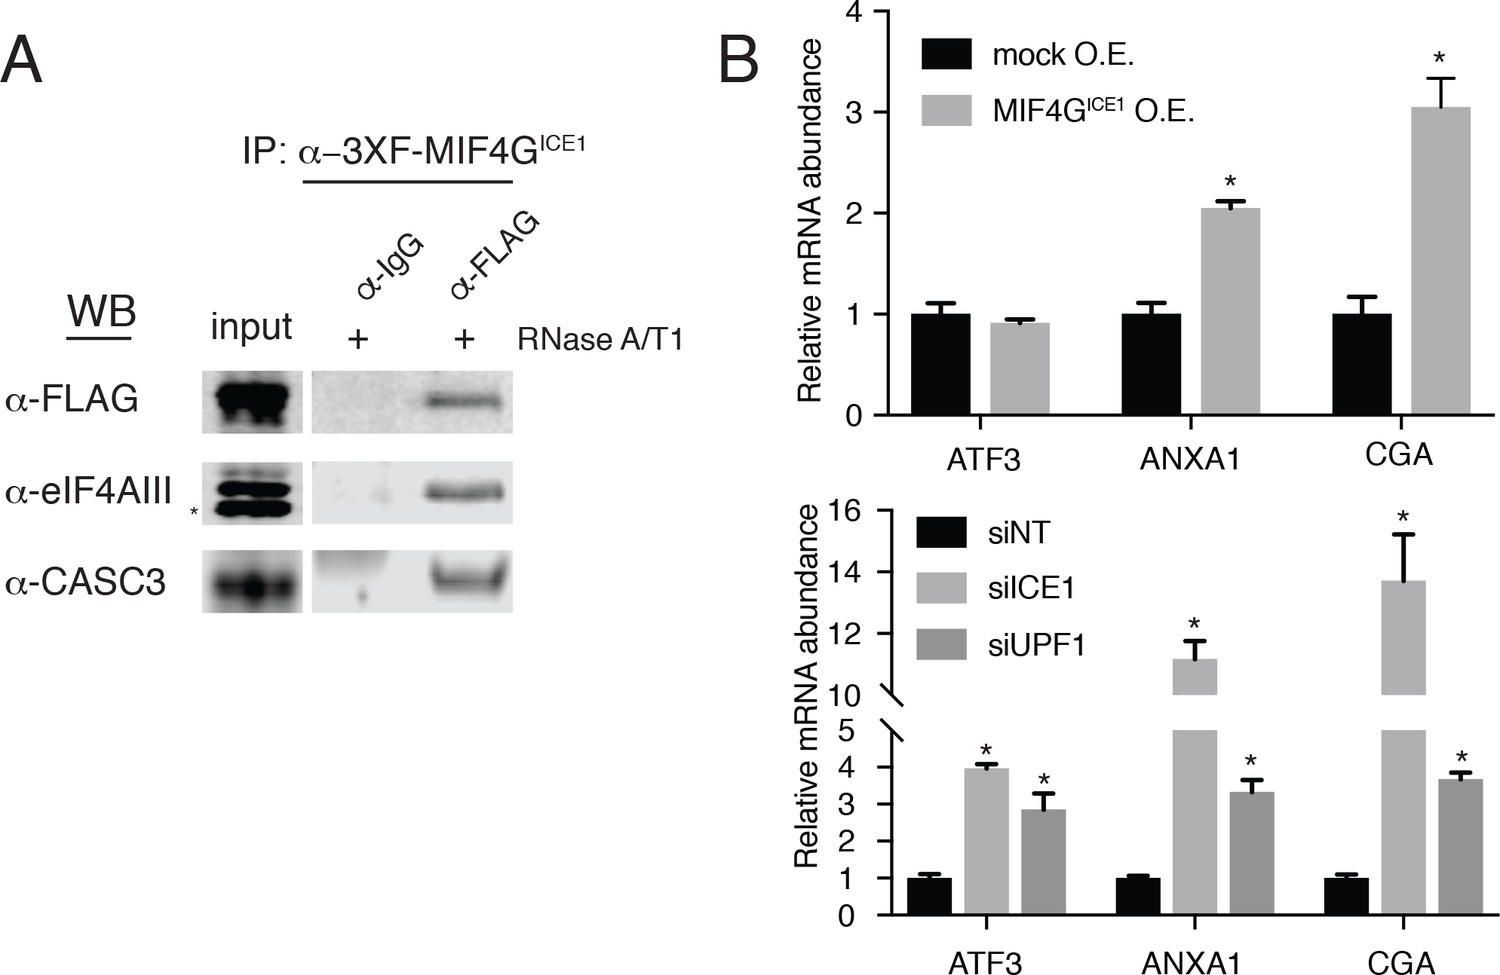
The putative MIF4G domain of ICE1 is sufficient to interact with eIF4AIII.
(A) Western blot of cell lysates stably expressing mock or 3XFLAG-tagged putative ICE1 MIF4G domain (3XFLAG-MIF4GICE1) were subjected to coimmunoprecipitation with a FLAG antibody. Lysates were treated with RNase A/T1 cocktail during the copurification (+), and antibodies used for detection are indicated at the left. Input lanes represent 3% of the total immunoprecipitated material. (B) (Top) RT-qPCR analysis of the NMD targets ATF3, ANXA1 and CGA in HEK-293 cells expressing a mock plasmid or vector expressing 3XFLAG-tagged putative ICE1 MIF4G domain. (Bottom) RT-qPCR analysis of ATF3, ANXA1 and CGA levels in cells depleted of ICE1 or UPF1. ICE1 knockdown efficiency is represented in Figure 2B. Data represent mean values with error bars illustrating standard deviation. Asterisks indicate statistical significance between control and ‘treatment’ values for each experiment (n = 3, Student’s t-test, p<0.05).
Figure 5—figure supplement 1
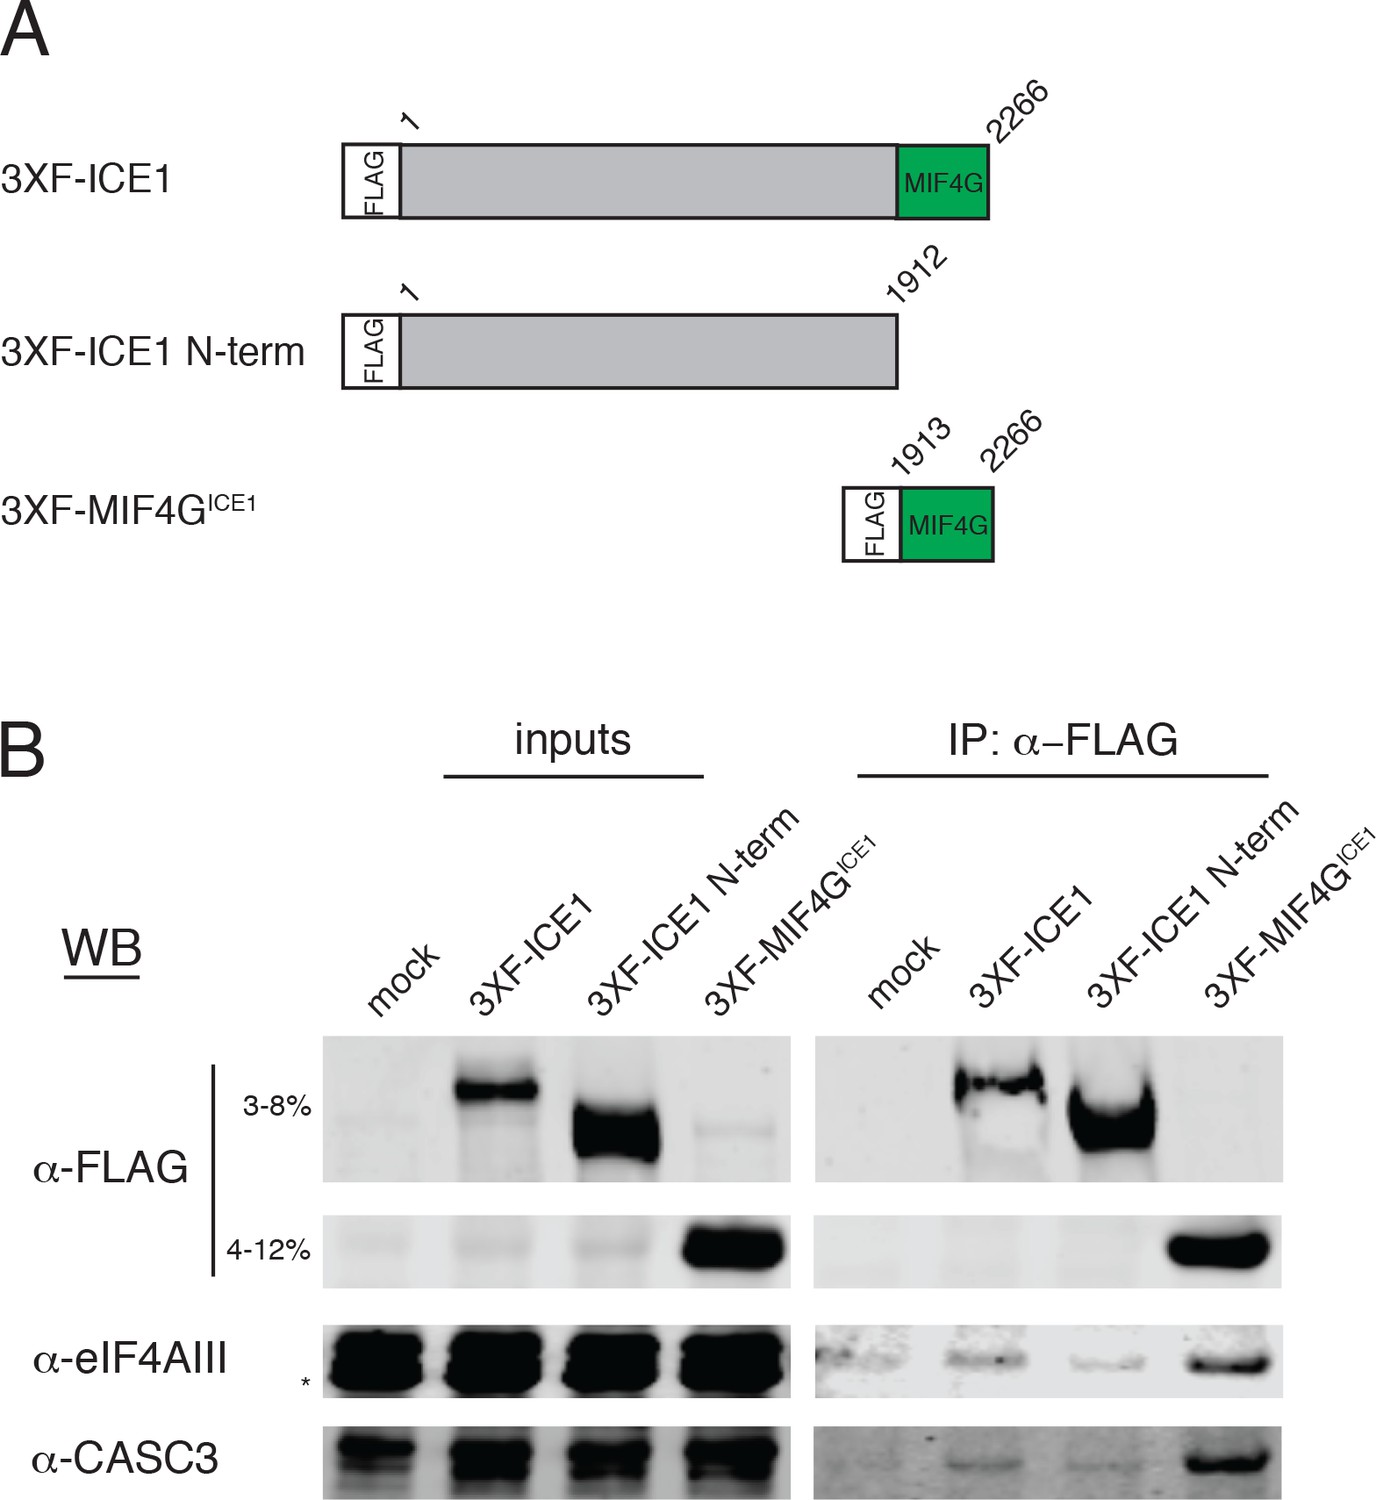
The C-terminus of ICE1 is sufficient to recover eIF4AIII.
(A) Schematic of reporter constructs expressed in HEK-293 cells for immunoprecipitation studies. MIF4G = middle domain of eukaryotic initiation factor 4G. (B) Immunoblot of HEK-293 cell lysates transiently overexpressing 3XFLAG-tagged version of the reporters in panel A subjected to immunoprecipitation with anti-FLAG antibody. Antibodies for probing are indicated on the left, and input lanes represent 3% of the total immunoprecipitated material.
Figure 6 with 2 supplements

ICE1 is required for UPF3B association with the EJC.
(A) (Left) Western blot of cell lysates depleted with negative control or ICE1 siRNAs were subjected to co-immunoprecipitation with IgG or CASC3 antibodies. Antibodies against UPF and EJC proteins were used for detection, as indicated on the left. (Right) Quantification of three independent experiments showing densitometry values of UPF3B or eIF4AIII recovery during CASC3 i.p. with or without ICE1 depletion. Error bars represent standard deviation, and the asterisk indicates statistical significance compared to control (Student’s t-test, p<0.05). (B) (Left) Imaging flow cytometry of 293 cells stably expressing GFP-UPF3B fusion protein during ICE1 or control depletion. Images presented represent unbiased collection events generated by IDEAS software from each treatment group’s median bin. (Top right) Quantification of nuclear/cytosolic GFP-UPF3B fusion protein ratios during ICE1 depletion or control. Bars represent 25th, 50th, and 75th quartile for each treatment group, and asterisks indicate statistical significance (n = 1588 (siNT); n = 2167 (siICE1); Mann Whitney test, p<10–15). (Bottom right) Western blot of total GFP-UPF3B protein levels during ICE1 depletion.
Figure 6—figure supplement 1

Overexpression of the ICE1 MIF4G domain disrupts interaction of UPF3B with eIF4AIII.
Western blot of HEK-293 cell lysates transiently overexpressing 3Xmyc-ICE1 MIF4G (a.a. 1921–2266) subjected to immunoprecipitation with an anti-UPF3B antibody. Antibodies for probing are indicated on the left, and input lanes represent 3% of the total immunoprecipitated material.
Figure 6—figure supplement 2
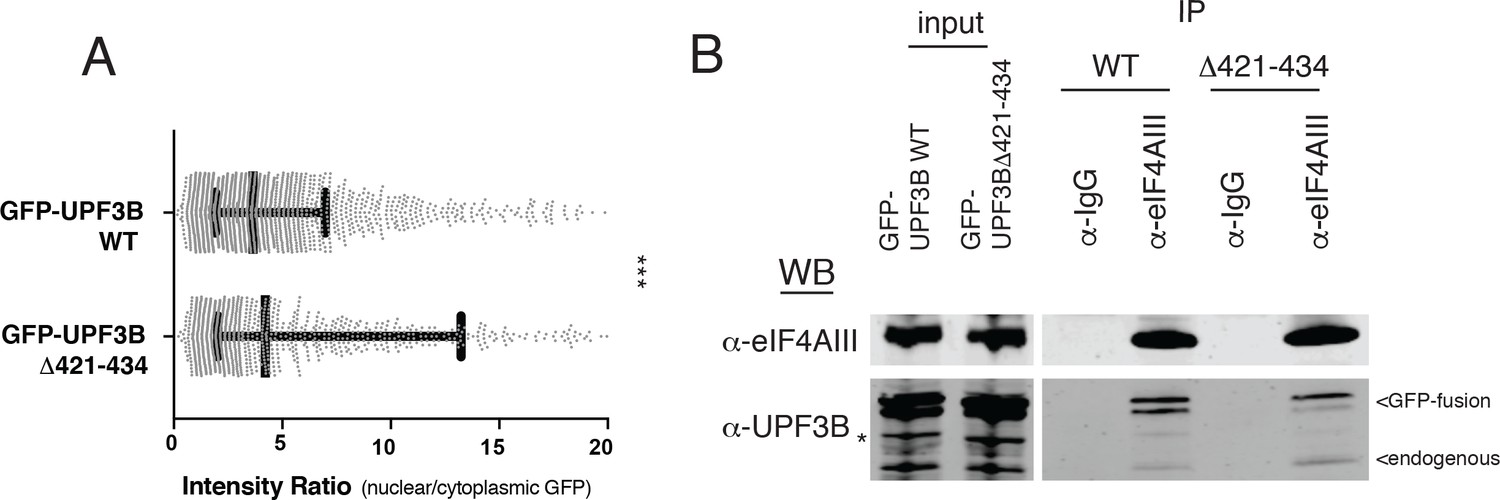
An EJC-binding mutant of GFP-UPF3B is enriched in the nucleus.
(A) Imaging flow cytometry comparing nuclear/cytoplasmic eGFP ratios between UPF3B WT and UPF3B lacking amino acid residues 421–434. Whiskers represent the 25th, 50th, and 75th percentiles, while asterisks indicate statistical significance between groups (n = 1980; n = 1234; Mann Whitney test, p<0.0001). (B) Immunoblot of lysates from stable cell lines expressing GFP-UPF3B or GFP-UPF3B∆421–434 (deletion of EJC-interacting a.a. 412–434) subjected to immunoprecipitation with anti-eIF4AIII antibody and probed with the antibodies indicated on the left. Input lanes represent 3% of the total immunoprecipitated material, and asterisk denotes non-specific band.
Figure 7

UPF3B overexpression ameliorates NMD defect during ICE1 depletion.
(A) Western blot of cell lysates engineered to stably overexpress 3XFLAG-UPF3B or parental vector treated with ICE1 or non-targeting control siRNAs. Co-immunoprecipitation of the EJC was performed using anti-CASC3 antibodies. Input lanes represent 3% of the total immunoprecipitated material. (B) RT-qPCR analysis of EJC-stimulated targets in parental or UPF3B overexpression cell lines depleted of ICE1 or a non-targeting control. Asterisks indicate statistical significance in fold change between parental and UPF3B overexpression lines during ICE1 depletion (n = 3, Student’s t-test, *p<0.05; **p<0.01). (C) Model illustrating the requirement of ICE1 to facilitate UPF3B association with the EJC and subsequently target EJC-stimulated NMD substrates for decay.
Tables
Table 1
Known NMD factors are enriched among top hits of siRNA screen.
Whole-genome siRNA screen median seed corrected Z-scores. Wilcoxon test p-values, and rank Z-scores for selected genes known to be involved in NMD are shown.
| Gene | Median seed corrected Z-score | p-Value | Rank | |
|---|---|---|---|---|
| UPF | UPF1 | 1.76 | 3.05E-03 | 62 |
| Proteins | UPF2 | 0.98 | >0.05 | 193 |
| UPF3B | 0.72 | 1.15E-02 | 470 | |
| SMG | SMG1 | 7.60 | 2.41E-03 | 1 |
| Proteins | SMG5 | 2.25 | 3.20E-03 | 47 |
| SMG6 | 4.75 | 2.47E-03 | 14 | |
| SMG7 | 2.14 | 2.77E-03 | 51 | |
| SMG8 | 0.44 | 2.28E-03 | 1469 | |
| SMG9 | 0.17 | >0.1 | 3859 | |
| EJC | EIF4A3 | 6.90 | 2.41E-03 | 3 |
| Proteins | RBM8A | 7.04 | 2.41E-03 | 2 |
| MAGOH | 5.65 | 2.43E-03 | 8 | |
| CASC3 | 3.92 | 2.57E-03 | 19 | |
| EJC | CWC22 | 1.07 | 1.22E-02 | 150 |
| Associated | AQR | 6.46 | 2.42E-03 | 6 |
| ACIN1 | 0 | >0.1 | 13890 | |
| RNPS1 | −0.70 | >0.1 | 20388 | |
| Other | NBAS | 0.26 | >0.1 | 2955 |
| PNRC2 | 0.52 | >0.05 | 1074 | |
| DHX34 | 0 | >0.1 | 6499 |
Key resources table
| Reagent type (species) or resource | Designation | Source or reference | Identifiers | Additional information |
|---|---|---|---|---|
| Gene (Homo sapiens) | ICE1 | Addgene plasmid # 49428 | NM_015325 | Originally KIAA0947 |
| Cell line (H. sapiens) | pKC-4.06 | This study | HEK-293 cell line stably expressing pCMV-3XFLAG-Fluc-B-globin (39PTC) | |
| Cell line (H. sapiens) | Flp-In T-Rex-293 cells | Invitrogen | Cat. No. R78007 | |
| Cell line (Drosophila melanogaster) | S2 cells | ThermoFisher Scientific | Cat. No. R690-07 | |
| Transfected construct (H. sapiens) | pCMV-3XFLAG-Fluc-B-globin (39PTC) | Professor Lynne Maquat | NA | |
| Transfected construct (H. sapiens) | pcDNA5-FRT-TO-3XF-ICE1 | This study | NA | Cloned using Addgene plasmid # 49428 |
| Transfected construct (H. sapiens) | pcDNA5-FRT-TO-3XF-ICE1-Nterm | This study | NA | |
| Transfected construct (H. sapiens) | pcDNA5-FRT-TO-3XF-ICE1-MIF4G | This study | NA | |
| Transfected construct (H. sapiens) | pcDNA5-FRT-TO-3XF-UPF3B | This study | NA | Cloned from HEK-293 cDNA library |
| Transfected construct (H. sapiens) | pcDNA5-FRT-TO-3XMYC-UPF3B | This study | NA | |
| Transfected construct (H. sapiens) | pcDNA5-FRT-TO-3XMYC-UPF3B(delN-term) | This study | NA | |
| Transfected construct (H. sapiens) | pcDNA5-FRT-TO-3XMYC-UPF3B(delC-term) | This study | NA | |
| Transfected construct (H. sapiens) | pcDNA5-FRT-TO-3XMYC-UPF3B(del421-434) | This study | NA | |
| Transfected construct (H. sapiens) | pcDNA5-FRT-TO-GFP-UPF3B | This study | NA | |
| Transfected construct (H. sapiens) | pcDNA5-FRT-TO-GFP-UPF3B(del421-434) | This study | NA | |
| Antibody | anti-ACTIN | Cell Signaling | Cat. No. 3700S, RRID:AB_2242334 | (1:5000) |
| Antibody | anti-ANXA1 | Bethyl Laboratories | Cat. No. A305-235A, RRID:AB_2631628 | (1:1000) |
| Antibody | anti-ATF3 | Abcam | Cat. No. Ab58668, RRID:AB_879578 | (1:500) |
| Antibody | anti-CASC3 | Bethyl Laboratories | Cat. No. A302-472A, RRID:AB_1944210 | (1:1000) |
| Antibody | anti-CASC3 | Bethyl Laboratories | Cat. No. A302-471A, RRID:AB_1944212 | For IP |
| Antibody | anti-eIF4AIII | Bethyl Laboratories | Cat. No. A302-981A, RRID:AB_10748369 | (1:1000) |
| Antibody | anti-eIF4AIII (mouse monoclonal) | Developmental Studies Hybridoma Bank | PCRP-EIF4A3-3A2 | For IP |
| Antibody | anti-FLAG | Sigma | Cat. No. F1804, RRID:AB_262044 | (1:1000) |
| Antibody | anti-GADD34 | Proteintech | Cat. No. 10449–1-AP, RRID:AB_2168724 | (1:500) |
| Antibody | anti-GADD45B | Abcam | Cat. No. Ab105060, RRID:AB_10714129 | (1:500) |
| Antibody | anti-KIAA0947 (ICE1) | Bethyl Laboratories | Cat. No. A304-276A, RRID:AB_2620472 | (1:1000) |
Additional files
-
Supplementary file 1
Results of whole-genome siRNA screen (xlsx).
- https://doi.org/10.7554/eLife.33178.023
-
Supplementary file 2
Spliceosomal proteins among top hits in siRNA screen (xlsx).
- https://doi.org/10.7554/eLife.33178.024
-
Supplementary file 3
Results of secondary siRNA screen of selected genes from primary screen (xlsx).
- https://doi.org/10.7554/eLife.33178.025
-
Supplementary file 4
Differential gene expression analysis of HEK-293 cells treated with siICE1, siUPF1, and siNT (xlsx).
- https://doi.org/10.7554/eLife.33178.026
-
Supplementary file 5
Differential splicing analysis of HEK-293 cells treated with siICE1 and siNT (xlsx).
- https://doi.org/10.7554/eLife.33178.027
-
Supplementary file 6
Relative mRNA stability analysis of HEK-293 cells treated with siICE1, siUPF1, siUPF3B, and siNT (xlsx).
- https://doi.org/10.7554/eLife.33178.028
-
Supplementary file 7
RT-qPCR primer sequences (xlsx)
- https://doi.org/10.7554/eLife.33178.029
-
Transparent reporting form
- https://doi.org/10.7554/eLife.33178.030
Download links
A two-part list of links to download the article, or parts of the article, in various formats.
Downloads (link to download the article as PDF)
Open citations (links to open the citations from this article in various online reference manager services)
Cite this article (links to download the citations from this article in formats compatible with various reference manager tools)
ICE1 promotes the link between splicing and nonsense-mediated mRNA decay
eLife 7:e33178.
https://doi.org/10.7554/eLife.33178


