The signaling lipid sphingosine 1-phosphate regulates mechanical pain
- University of California, Berkeley, United States
- Columbia University College of Physicians and Surgeons, United States
- Columbia University, United States
- Marine Biological Laboratory, United States
- Buck Institute for Research on Aging, United States
Figures
Figure 1 with 1 supplement
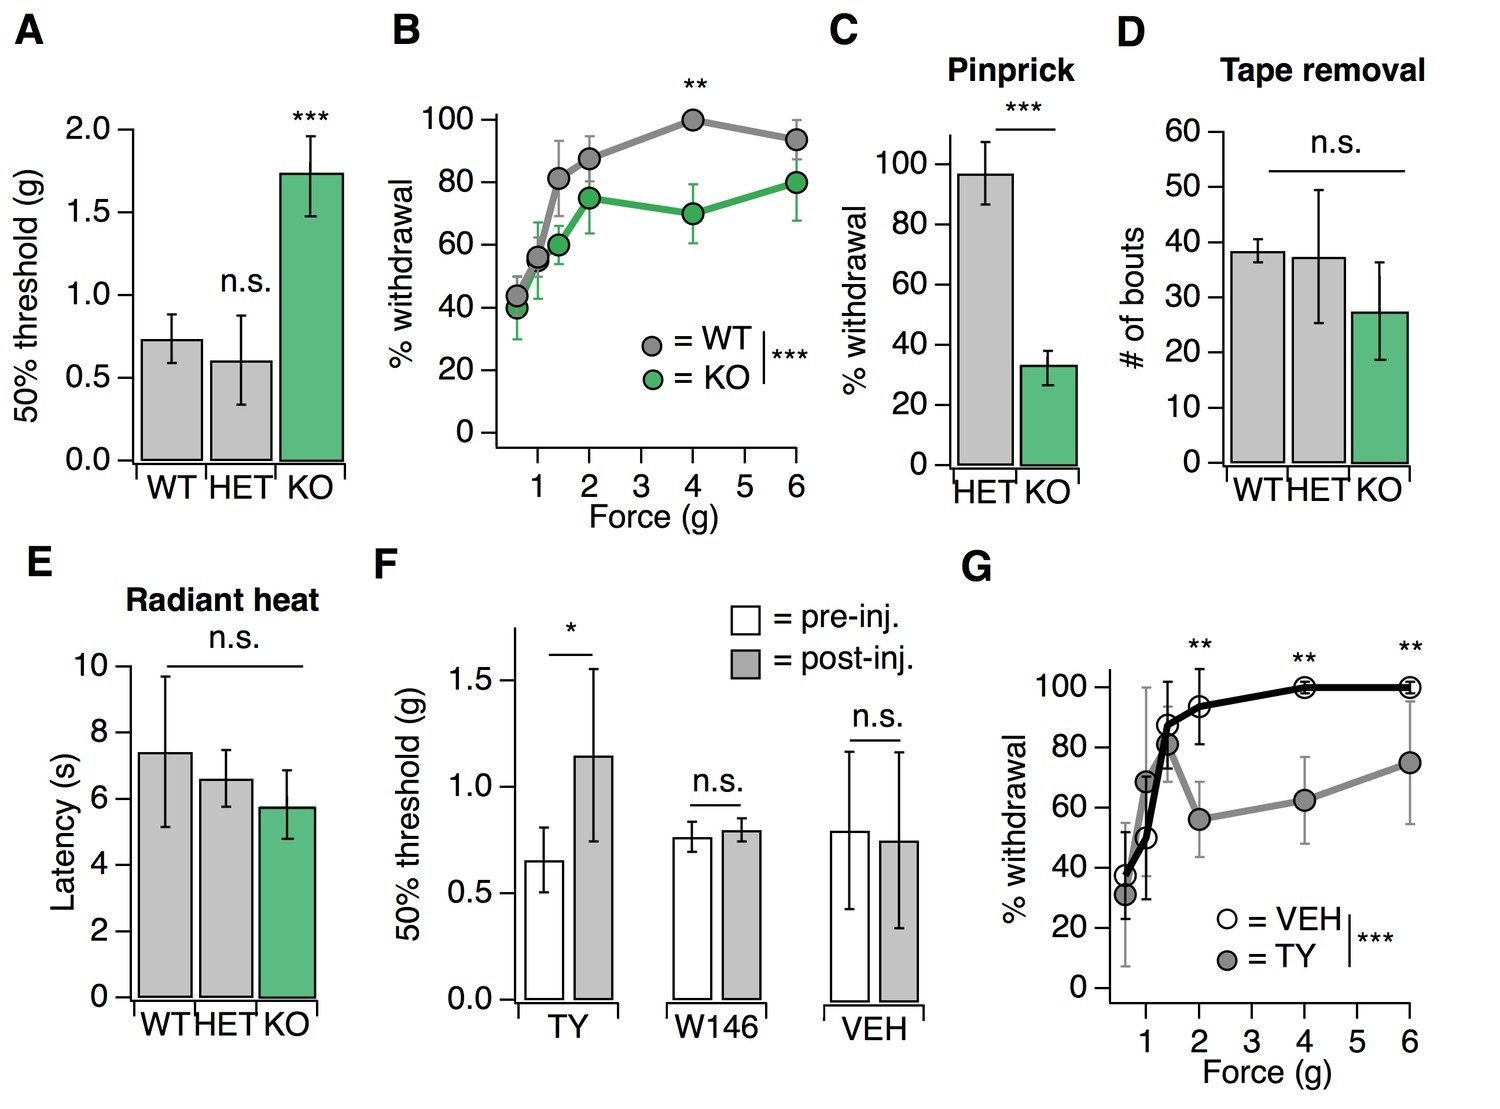
S1PR3 mediates acute mechanical pain.
(A) von Frey 50% withdrawal threshold measurements for S1pr3+/+ (WT, N = 8), S1pr3+/- (HET, N = 7) and S1pr3-/- (KO, N = 12) mice. p<0.0001 (one-way ANOVA). Tukey-Kramer post hoc comparisons for KO and HET to WT indicated on graph. (B) von Frey force-response graph for WT (N = 8) versus KO (N = 12) animals; pgenotype <0.0001 (two-way ANOVA). Tukey HSD comparisons between genotypes are indicated for given forces. (C) % withdrawal to pinprick stimulation of hindpaw for HET versus KO animals; p<0.0001 (unpaired t-test; N = 5–7 mice per group). (D) Number of attempted removal bouts in tape assay for WT (N = 2), HET (N = 2), and KO (N = 5) mice; p=0.172 (one-way ANOVA). (E) Baseline radiant heat measurements for WT (N = 8), HET (N = 3), and KO (N = 5) mice; p=0.444 (one-way ANOVA). (F) von Frey 50% withdrawal threshold measurements for mice pre- and post-injection of 500 µM TY 52156 (N = 10), 10 µM W146 (N = 6), or 1% DMSO-PBS vehicle (N = 17); p=0.016, 0.650 (two-tailed paired t-test comparing vehicle- vs. drug-injected paw). (G) von Frey force-response graph for mice injected with either 1% DMSO-PBS (N = 4) or 500 µM TY 52156 (N = 4); ptreatment <0.0001 (two-way ANOVA). Tukey HSD comparisons were made between treatment groups and significant differences at a given force are indicated on graph. Error bars represent mean ± SD.
-
Figure 1—source data 1
S1PR3 mediates acute mechanical pain.
Related to Figure 1.
- https://doi.org/10.7554/eLife.33285.004
Figure 1—figure supplement 1
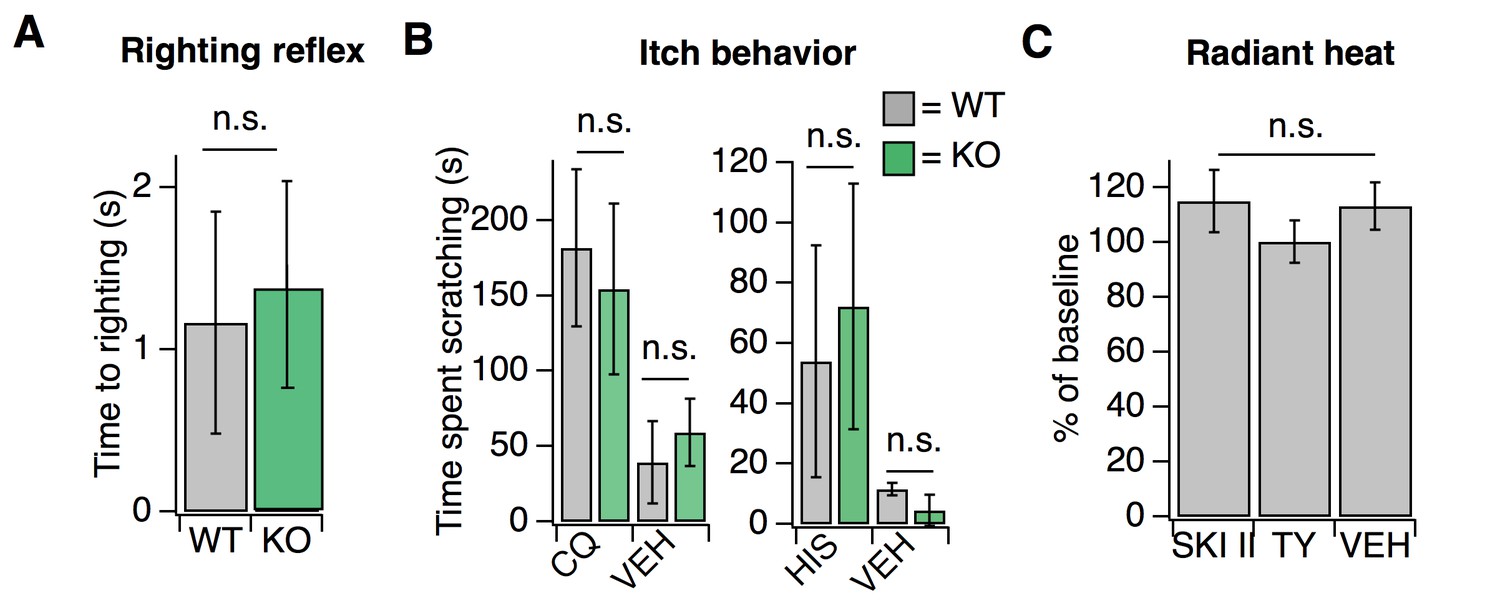
Loss of S1PR3 selectively impairs mechanonociception.
Related to Figure 1. (A) Time to righting in seconds for P7 pups per genotype for WT and KO mice; p=0.575 (two-tailed unpaired t-test; N = 7 mice per genotype). (B) (Left) Time spent scratching in response to injection of 50 mM chloroquine or PBS vehicle (VEH) in WT and KO mice; p=0.36, 0.98, (unpaired t-tests; N = 3–4 mice per group). (Right) Time spent scratching in response to injection of 27 mM Histamine or 0.1% DMSO-PBS in WT and KO mice; p=0.51, 0.06 (unpaired t-tests; N = 3–4 mice per group). (C) Normalized paw withdrawal latencies post-injection of SKI II, TY 52156, or 0.1% DMSO-PBS vehicle into the hind paw of wild-type animals; p=0.65 (one-way ANOVA; N = 5 mice per group). Unless otherwise indicated, error bars represent mean ± SD.
Figure 2
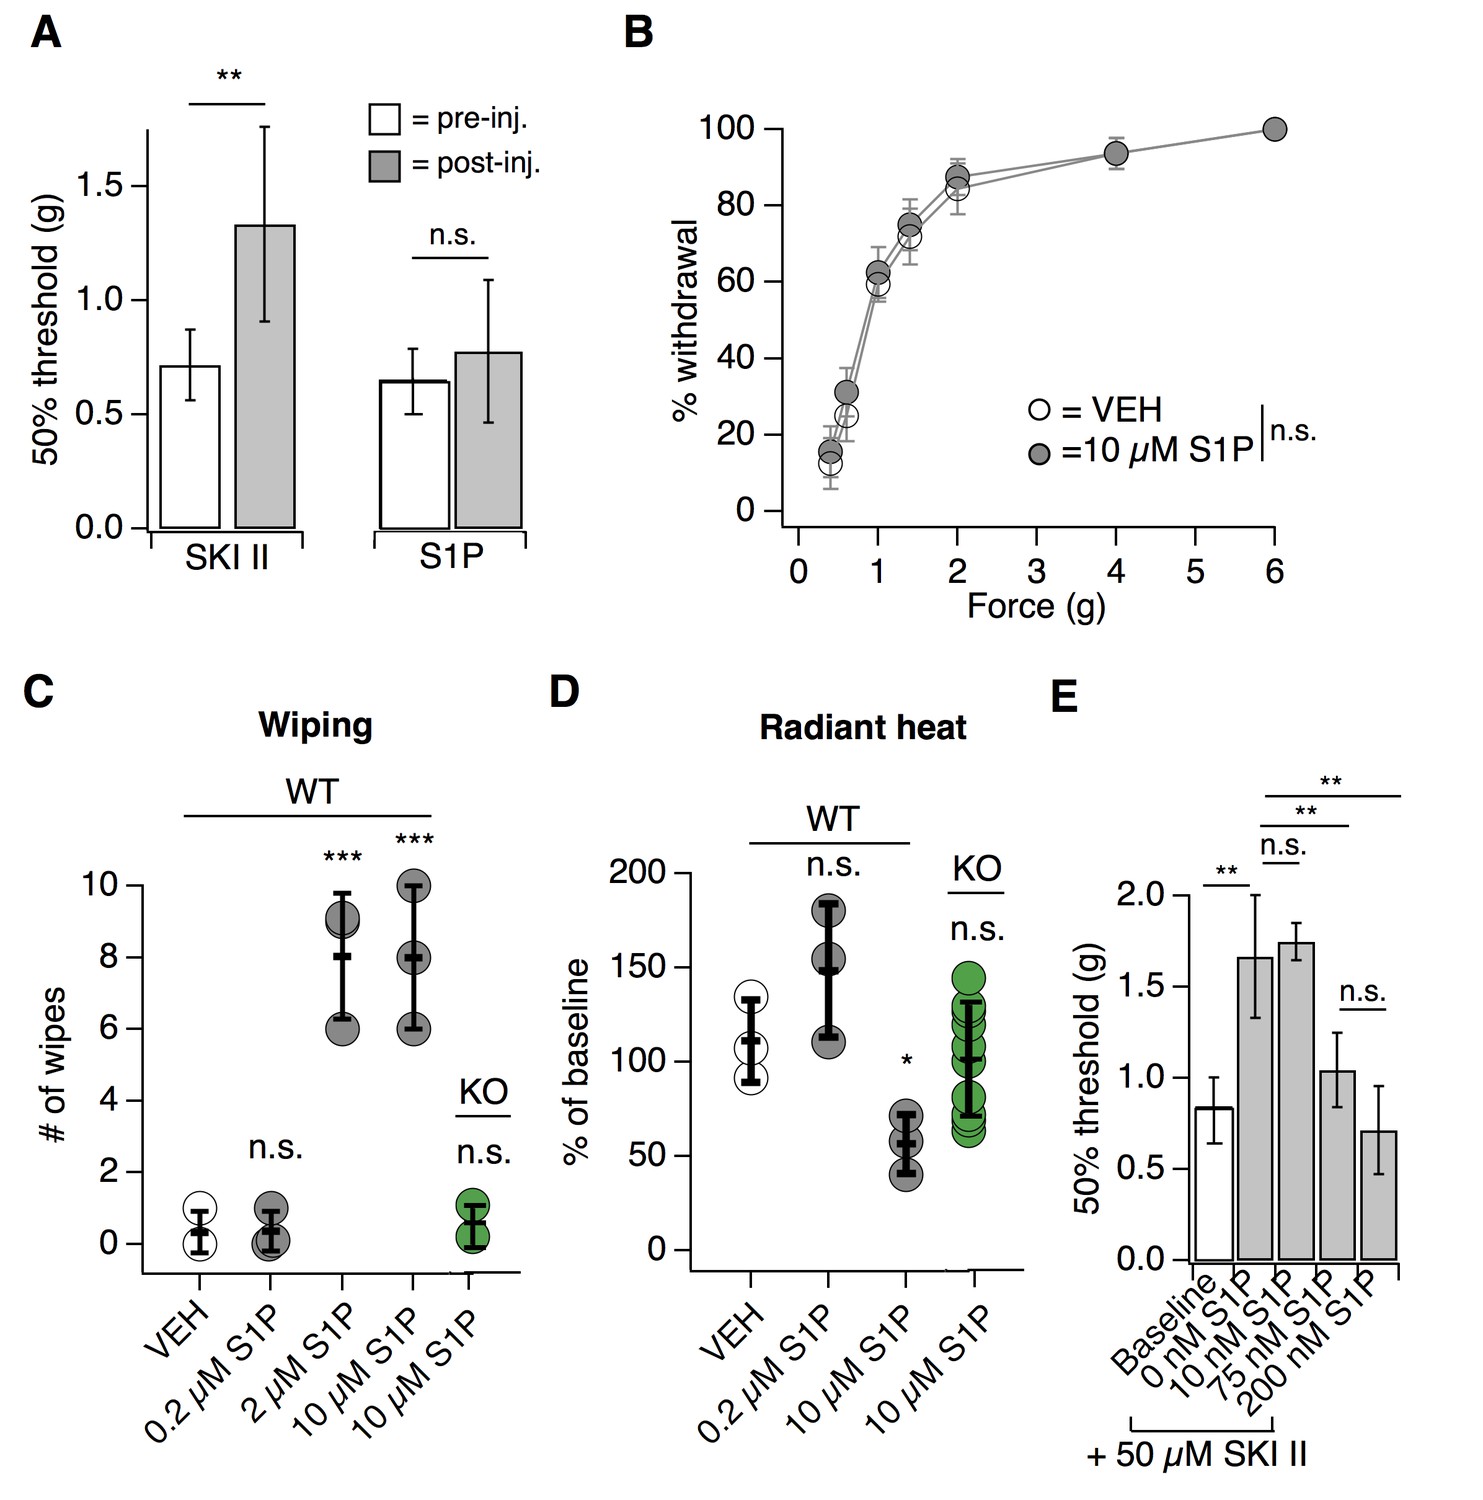
Endogenous S1P mediates acute mechanical pain.
(A) von Frey 50% withdrawal measurements for mice pre- and post-injection of 50 µM SKI II (N = 8) or 10 µM S1P (N = 7); p=0.003, 0.604 (two-tailed paired t-tests). (B) von Frey force-response graph for animals injected with 10 µM S1P or 0.1% MeOH-PBS; pgenotype >0.05 (two-way ANOVA; N = 8 mice per group). No Tukey HSD comparisons at any force between genotypes were significant. (C) Intradermal cheek injection of 10 µM S1P, 2 µM, 0.2 µM, and 20 µL 0.3% methanol PBS (vehicle), with quantification of number of forepaw wipes over the 5 min post-injection interval; p<0.0001 (one-way ANOVA; N = 3 mice per condition). Dunnett’s multiple comparisons p-values are represented on graph for comparisons made between treated and vehicle groups. (D) Radiant heat normalized paw withdrawal latencies 20–30 min post injection of 15 µL 10 µM S1P, 0.2 µM S1P. or 0.3% methanol-PBS vehicle (i.d.) into the hind paw of S1PR3 WT or KO mice; p=0.0129 (one-way ANOVA; N = 3–10 mice per condition). Dunnett’s multiple comparisons p-values are represented on graph for comparisons made between treated and vehicle groups. (E) von Frey 50% withdrawal measurements for mice pre- (baseline) and post-injection of 50 µM SKI II (N = 14) and 0 (N = 4), 10 (N = 3), 75 (N = 4), or 200 nM S1P (N = 3; one-way ANOVA; p=0.0001). Tukey Kramer comparisons are indicated on graph. Error bars represent mean ± SD.
-
Figure 2—source data 1
Endogenous S1P mediates acute mechanical pain.
Related to Figure 2.
- https://doi.org/10.7554/eLife.33285.006
Figure 3 with 1 supplement
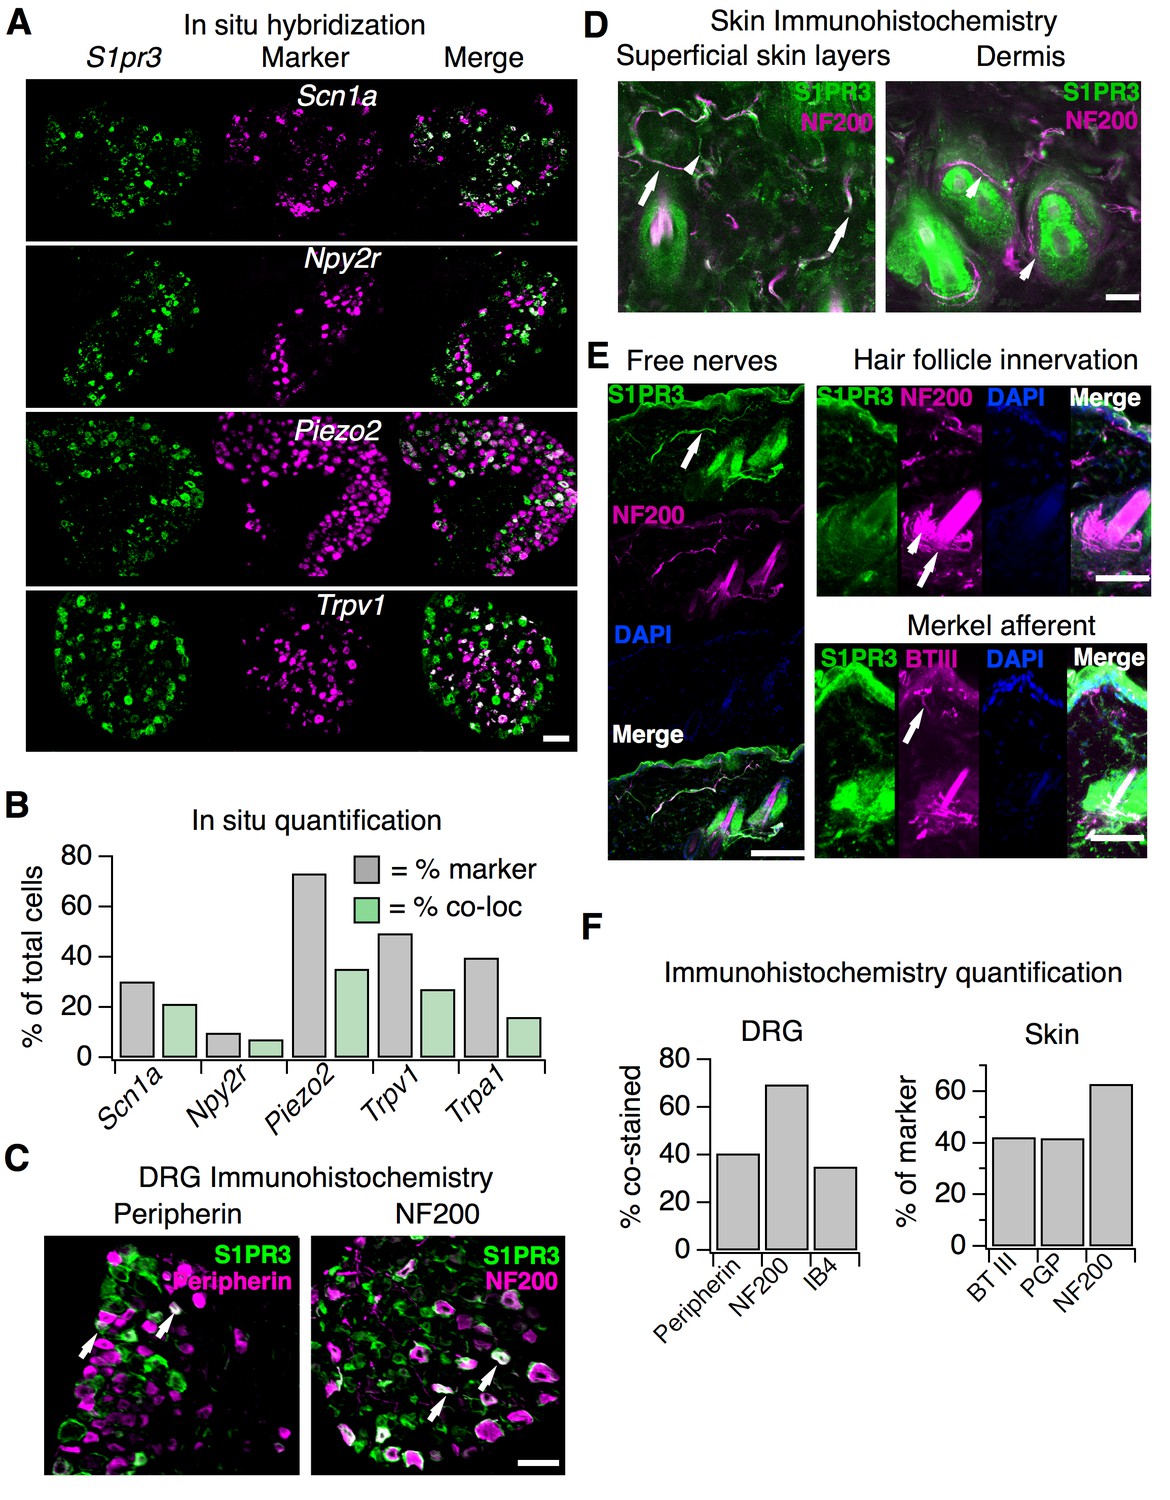
S1pr3 is expressed in A mechanonociceptors and C thermal nociceptors.
(A) (Top) Representative co-ISH of S1pr3 (green; left) with Scn1a, Npy2r, Piezo2, and Trpv1 (magenta; center) in sectioned DRG. Right column: overlay with co-localized regions colored white (10x air objective; scale = 100 µm). (B) Bar chart showing the % of total cells expressing the indicated marker (grey) and the % of total cells co-expressing both marker and S1pr3 (green). See Table S1 for quantification. (C) Representative IHC images of sectioned DRG from S1pr3mCherry/+ animals stained with anti-DsRed (green, S1PR3) and anti-Peripherin (left, magenta) or anti-NF200 (right, magenta). Arrows indicate co-stained cells. Images were acquired using a 10x air objective (scale = 100 µm). (D) Whole-mount skin IHC confocal images with anti-DsRed antibody (S1PR3, green) and anti-NefH antibody (NF200, magenta) in an S1pr3mCherry/+ animal (20x water objective; scale = 50 µm). Arrows indicate co-positive free nerves (left image). Arrowheads indicate NF200- free nerves (left) or S1PR3- circumferential fibers (right image). (E) Sectioned skin IHC with anti-DsRed (S1PR3) and anti-NefH (NF200, left, top right) or anti-DsRed (S1PR3) and anti-beta-tubulin III (BTIII, bottom right) antibody (magenta) in S1pr3mCherry/+ skin (20x air objective; scale = 50 µm). Arrows indicate co-positive free nerve endings (left), S1PR3-negative lanceolate/circumferential hair follicle endings (top right, arrow = circumferential, arrowhead = lanceolate), or S1PR3-negative putative Merkel afferent (bottom right). (F) (Left) Quantification of sectioned DRG IHC experiments showing % of S1PR3+ cells that co-stained with indicated markers (n > 250 cells per marker). (Right) Quantification of sectioned skin IHC experiments showing % of fibers positive for indicated marker that co-stained with S1PR3 (anti-DsRed; n = 10 images per marker from two animals).
Figure 3—figure supplement 1
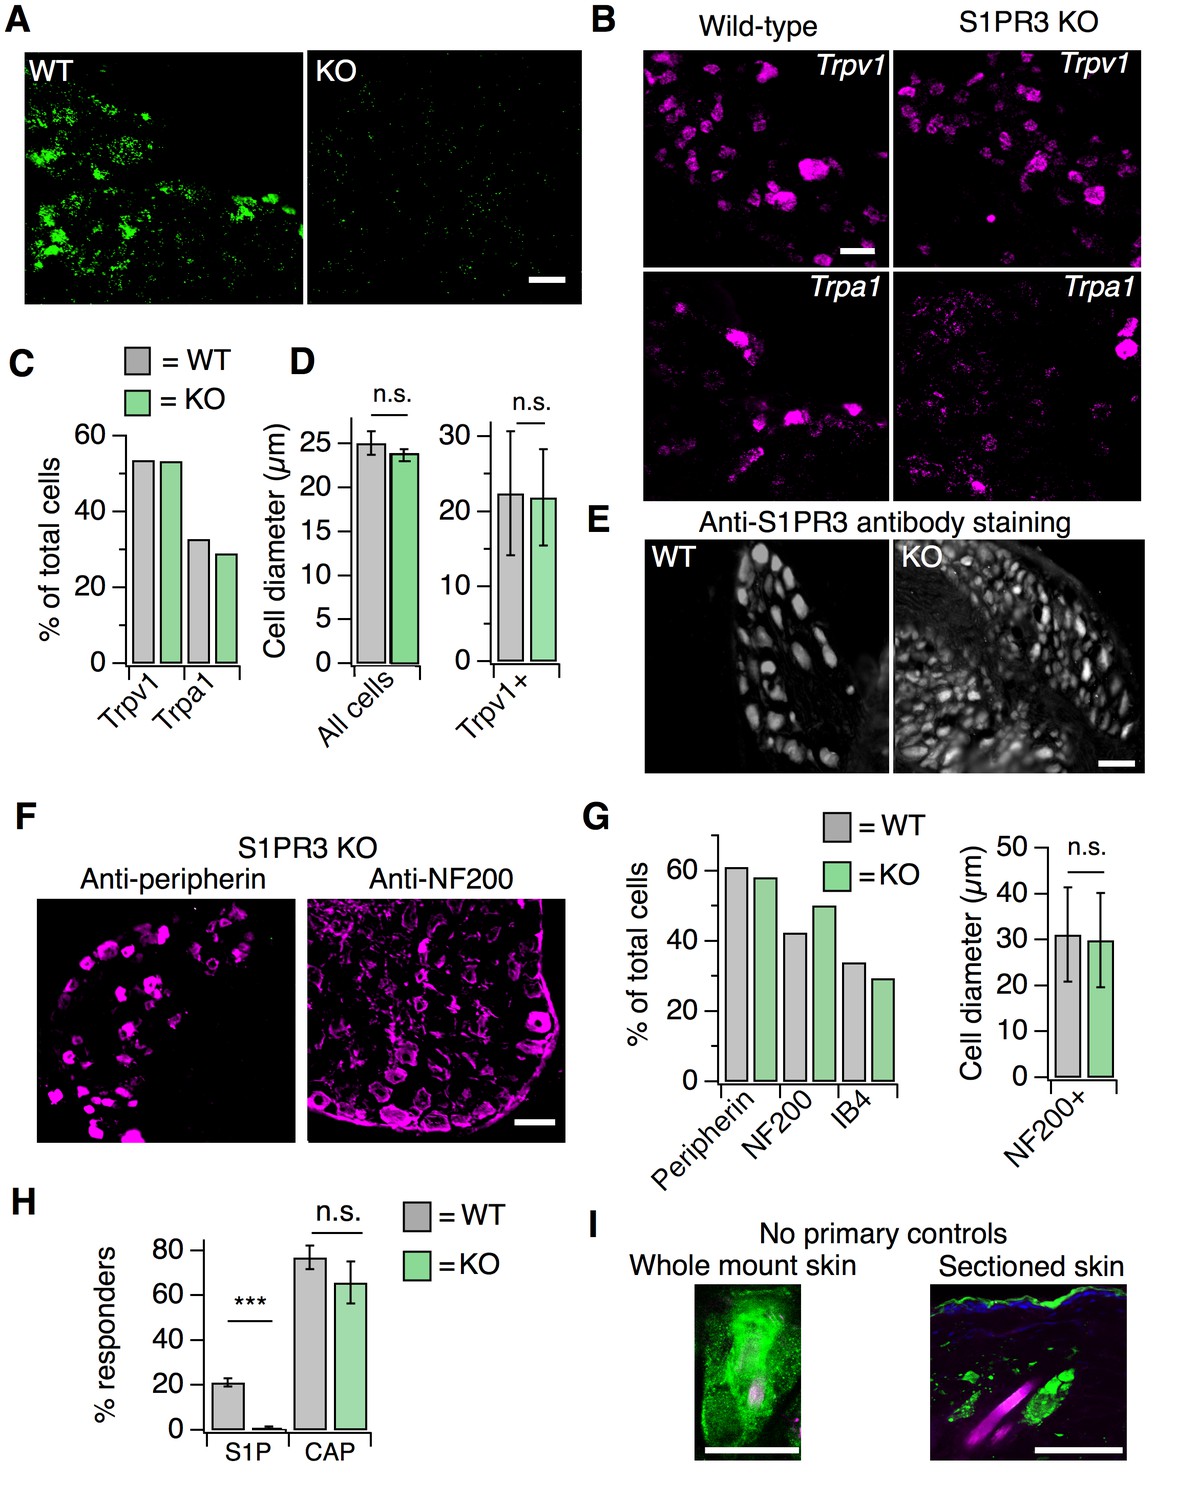
S1PR3 KO animals display normal representation of somatosensory neuronal subtypes.
Related to Figure 3. (A) ISH of sectioned adult DRG from WT and S1PR3 KO animals showing specificity of S1pr3 probes (20x air objective, scale = 50 µm). (B) (Image) Representative ISH Trpv1 (top) and Trpa1 (bottom) from sectioned DRG of wild-type (left) and S1PR3 KO animals (right; 20x air objective; scale = 50 µm). (C) % of total cells expressing Trpv1 and Trpa1 in sectioned DRG of wild-type and S1PR3 KO animals. (D) (Left) Average diameter ± SEM of all cells in sectioned DRG from WT and S1PR3 KO animals (p=0.36, two-tailed t-test; n = 437 and 679 cells from two animals each, respectively). (Right) Average diameter ±SD of Trpv1+ cells in WT and S1PR3 KO DRG (p=0.63, two-tailed t-test; n = 127 and 85 cells, respectively). (E) Representative staining with anti-S1PR3 antibody (1:2000) in sectioned adult DRG from WT and S1PR3 KO animals (10x air objective, scale = 100 µm). (F) Representative IHC images of sectioned DRG from S1PR3 KO animals stained with anti-DsRed (green) and anti-Peripherin (left, magenta) or anti-NF200 (right, magenta). Images were acquired using a 10x air objective (scale = 100 µm). (G) (Left) Quantification of total percentage of cells stained with indicated markers in sectioned DRG from S1pr3mCherry/+ and S1PR3 KO animals (n > 250 cells per condition). (Right) Average diameter of anti-NF200 +cells in S1pr3mCherry/+ and S1PR3 KO DRG (p=0.15, two-tailed t-test; n = 256 and 194 cells, respectively). (H) Percent responders to S1P and capsaicin in ratiometric calcium imaging of wild-type and S1PR3 KO cultured DRG and TG neurons; p<0.0001 (one-way ANOVA; N = 2 DRG and 2 TG preparations of 8 wells each). Sidak’s multiple comparisons p-values are represented on graph for comparisons made between genotypes. Error bars represent mean ± SEM. (I) (Left) No primary control showing robust staining of hair follicles in whole mount skin in contrast to specific neuronal staining shown in Figure 3D. (Right) No primary control showing staining around hair follicles and in epidermis in sectioned skin. Scale = 50 µm (20x water objective).
Figure 4
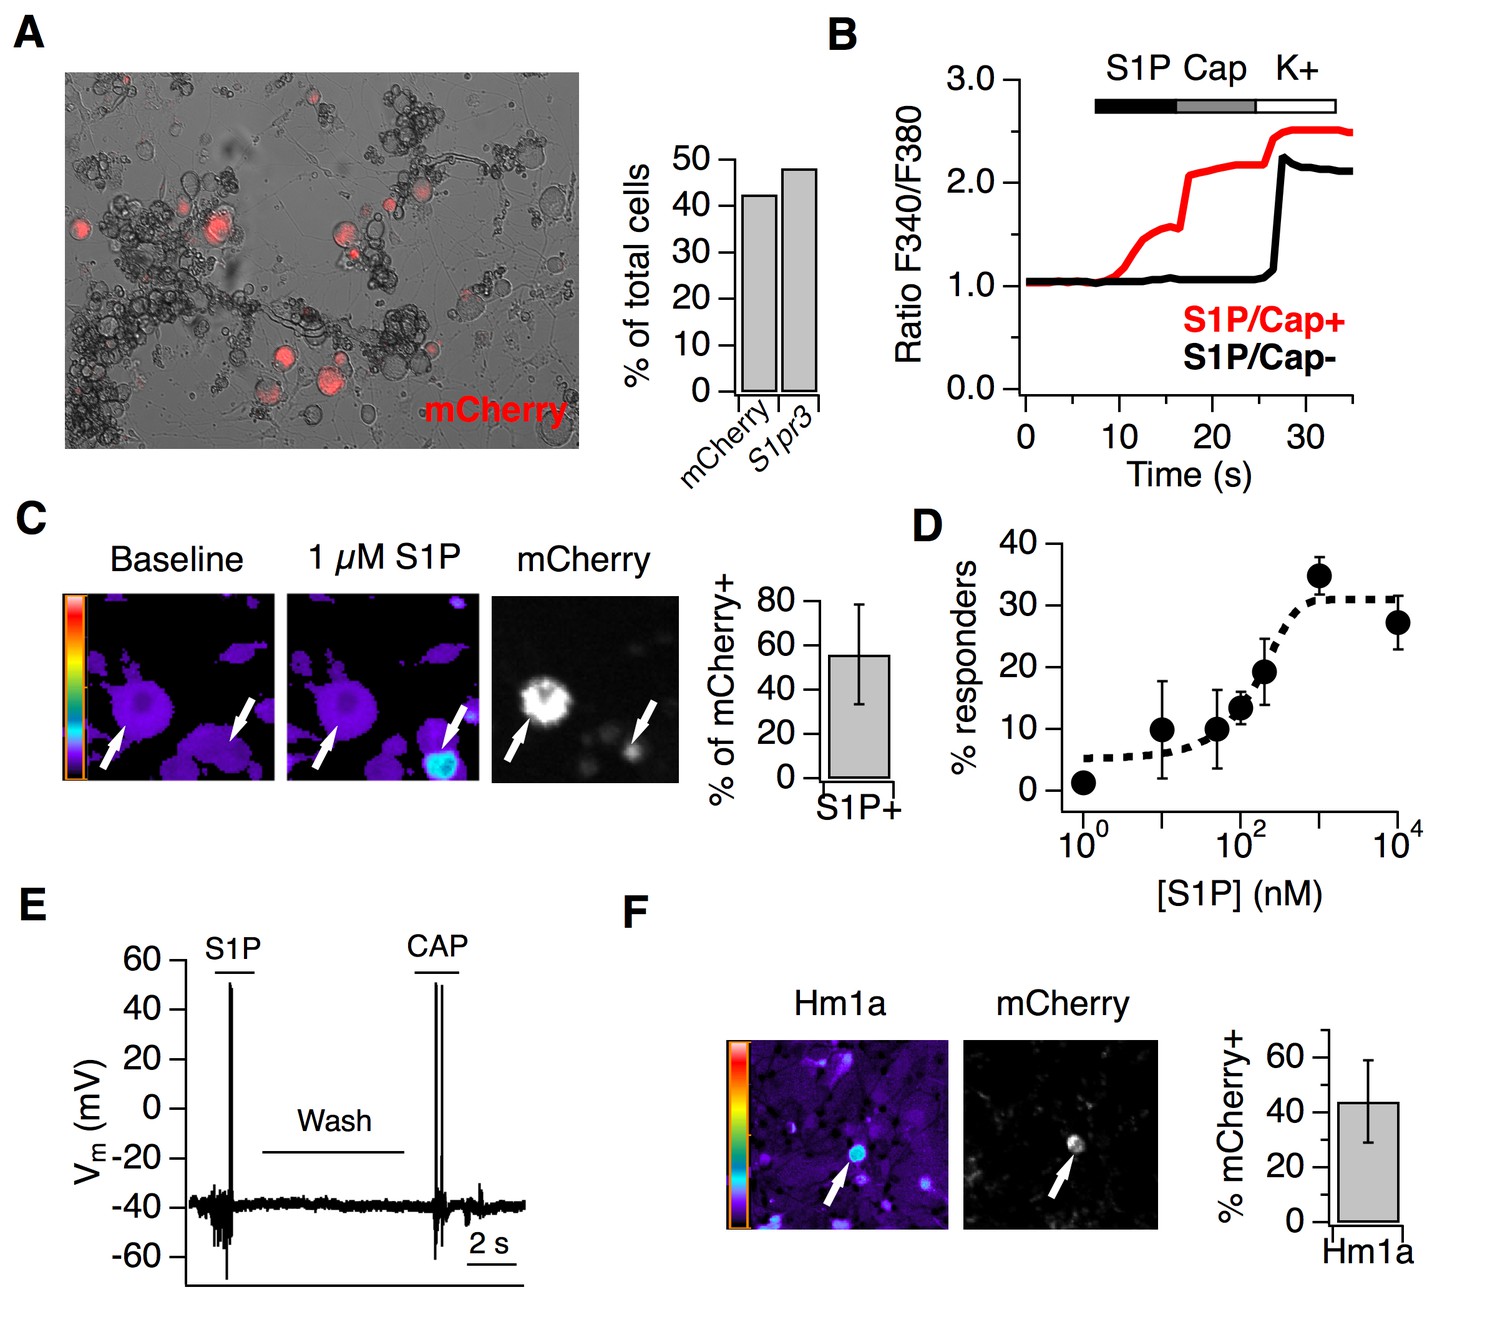
S1P activates thermal nociceptors but not mechanonociceptors.
(A) (Left) Representative image of mCherry signal in live, cultured adult DRG neurons from one S1pr3mCherry/+ animal. (Right) Quantification of % of total cells expressing S1pr3 from DRG ISH and mCherry from dissociated DRG cultures (N = 2 animals each experiment). (B) Representative traces depicting F340/F380 signal from Fura2-AM calcium imaging showing two neurons, one which responded to 1 µM S1P, 1 µM Capsaicin, and high K + Ringer’s (red) and one which only responded to high K+ (black). (C) (Left) Fura-2 AM calcium imaging before (left) and after (center) addition of 1 µM S1P in S1pr3 mCherry/+ cultured mouse DRG neurons. Bar indicates fluorescence ratio. Right-hand image indicates mCherry fluorescence. (Right) % of mCherry neurons that are responsive to 1 µM S1P in ratiometric calcium imaging (n > 1000 cells from 16 imaging wells from three animals). (D) Dose-response curve of mean neuronal calcium responders to varying concentrations of S1P. Concentrations used: 1, 10, 50, 100, 200, 1000, and 10,000 nanomolar (N = 2 animals). Error bars represent mean ± SD. Black dotted line indicates sigmoidal fit for all S1P responders from which EC50 was derived. All S1P responders were also capsaicin-responsive. (E) Current-clamp trace of a single wild-type neuron firing action potentials in response to bath addition of 1 µM S1P and 1 µM capsaicin, with Ringer’s wash in-between. Four of tenneurons responded to S1P and one of one S1P-responsive also responded to capsaicin. Bar = 2 s. (F) (Left) Fura-2 AM calcium imaging after addition of 500 nM Hm1a in S1pr3mCherry/+ P0 TG neurons, which were used instead of adult DRG neurons because they respond to Hm1a without prior PGE2 sensitization. Right-hand image indicates mCherry fluorescence. (Right) % of Hm1a-responsive P0 TG neurons that are mCherry+ (N = 1 animal, 1230 total neurons).
Figure 5 with 1 supplement
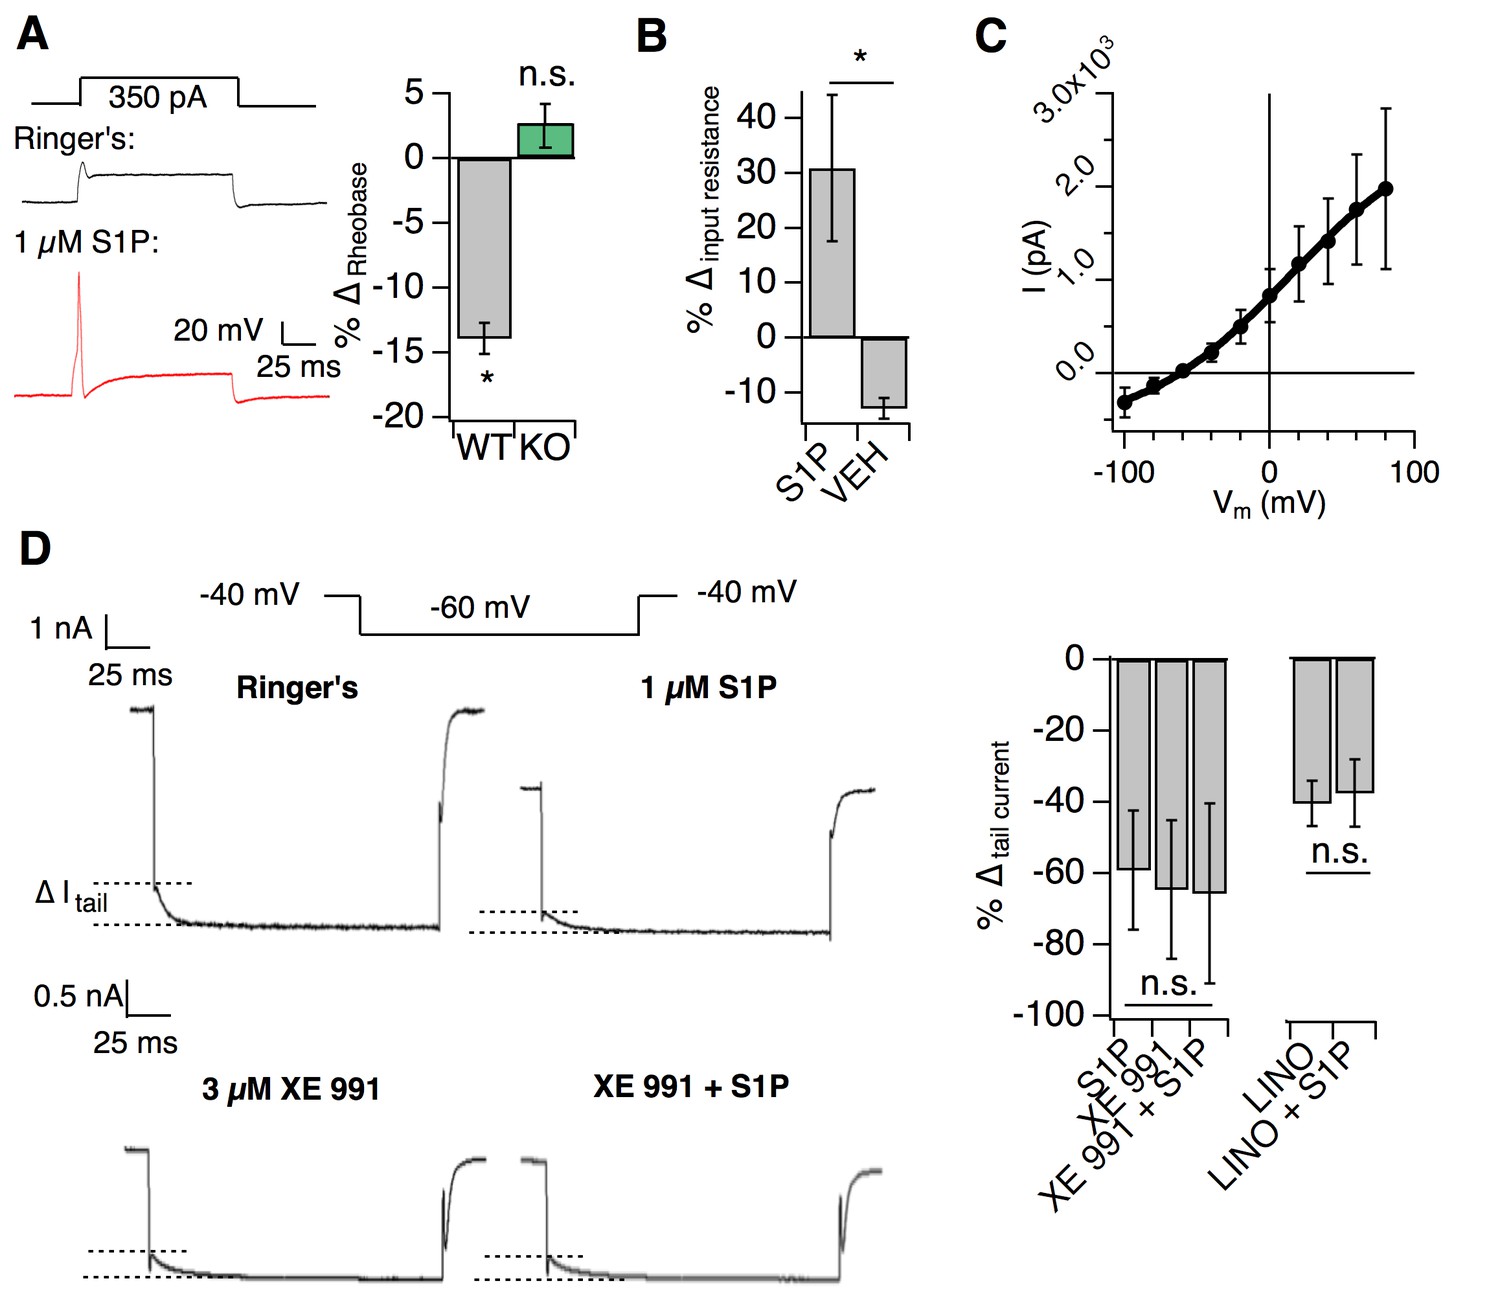
S1PR3 modulates KCNQ2/3 channels to regulate AM excitability.
All experiments were performed in S1pr3mCherry/+ or -/- DRG neurons. (A) (Left) Example traces of a single mCherry +neuron in whole cell current clamp before and after S1P application. (Right) % change in rheobase after S1P application for S1pr3mCherry/+ (left, n = 7) and KO (right, n = 12) neurons (pWT,KO = 0.012, 0.287; two-tailed paired t-tests). (B) % ∆ in input resistance after S1P or vehicle application (p=0.017; two-tailed paired t-test; n = 4 cells per group). (C) The S1P-sensitive current is carried by potassium. The current-voltage relationship was determined by subtraction of the post-S1P current from the pre-S1P current and reverses at −60.125 mV; n = 6 cells. Data were fitted with a Boltzmann equation. Pre- and post-S1P currents were measured at the indicated voltage (−100 mV to +80 mV, 20 mV increments) following a +100 mV step (100 ms). Current was quantified using the peak absolute value of the slowly-deactivating current 0–10 ms after stepping to indicated voltage. Unless indicated otherwise, all error bars represent mean ± SEM. (D) (Graphic, top) Averaged current traces of a single mCherry+ neuron in whole cell voltage clamp recording comparing tail currents (∆I tail) pre- and post-S1P using indicated voltage step protocol. (graphic, bottom) Averaged current traces of a single mCherry+ neuron in whole cell voltage clamp recording with XE991 treatment. Holding phase (−40 mV, 150 ms) was truncated in traces. (Left graph) % ∆ in outward tail current (average ±SD after indicated treatments (1 µM S1P, 3 µM XE 991, or both) for S1pr3mCherry/+ medium-diameter neurons; (p=0.58; one-way ANOVA; n = 6, 8, 14 cells) using protocol depicted at right. (Right graph) % ∆ in inward tail current after indicated treatments (LINO = 100 µM linopirdine) for S1pr3mCherry/+ medium-diameter neurons; (p=0.47; two-tailed paired t-test; n = 12 cells).
-
Figure 5—source data 1
S1PR3 modulates KCNQ2/3 channels to regulate AM excitability.
Related to Figure 5.
- https://doi.org/10.7554/eLife.33285.012
Figure 5—figure supplement 1

S1P selectively modulates potassium tail currents to increase DRG neuron excitability.
Related to Figure 5. (A) (Left) Example trace of a single mCherry+ neuron in S1P before and after current injection. (Right) Resting membrane potential (RMP) in millivolts before and after addition of S1P (p=0.23; two-tailed paired t-test; n = 6 cells). (B) Rheobase pre- and post-S1P application in DRG neurons; pWT = 0.011; pKO = 0.28 (two-tailed paired t-test). Same data are represented in Figure 5A. (C) Sodium I-V relationship for a representative S1pr3mCherry/+ medium-diameter neuron pre- and 5 min post- 1 µM S1P using voltage step from −100 to +80 mV (150 ms steps, −80 mV holding). (D) Steady-state I-V relationship for same neuron. (E) (Left) % ∆ in peak sodium current (Na+) after S1P or 1% DMSO vehicle application for medium-diameter mCherry+ neurons; p=0.39 (two-tailed paired t-test; n = 7 cells per group). (Right) % ∆ in peak steady-state current (S.S. K+) after S1P or 1% DMSO vehicle application for medium-diameter mCherry+ neurons; p=0.948 (two-tailed paired t-test; n = 7 cells per group). (F) % ∆ in inward tail current (∆I tail) after S1P or 1% DMSO vehicle application for S1pr3mCherry/+ and KO medium-diameter neurons using a pre-pulse stimulation of +80 mV followed by a step to −80 mV, where (∆I tail) was calculated by subtracting the steady-state current from the absolute peak of the slowly-deactivating current at −80 mV (p=0.014; one-way ANOVA; n = 10, 13, 10 cells). Tukey Kramer post hoc p-values indicated on graph. (G) Dose-response relationship between % ∆ in tail current and S1P concentration for 1 nM, 50 nM, 100 nM, and 1 µM S1P (n = 7 cells). EC50 (48.8 nM), marked by thin dotted lines, was estimated from sigmoidal fit (thick dotted line).
Figure 6 with 1 supplement
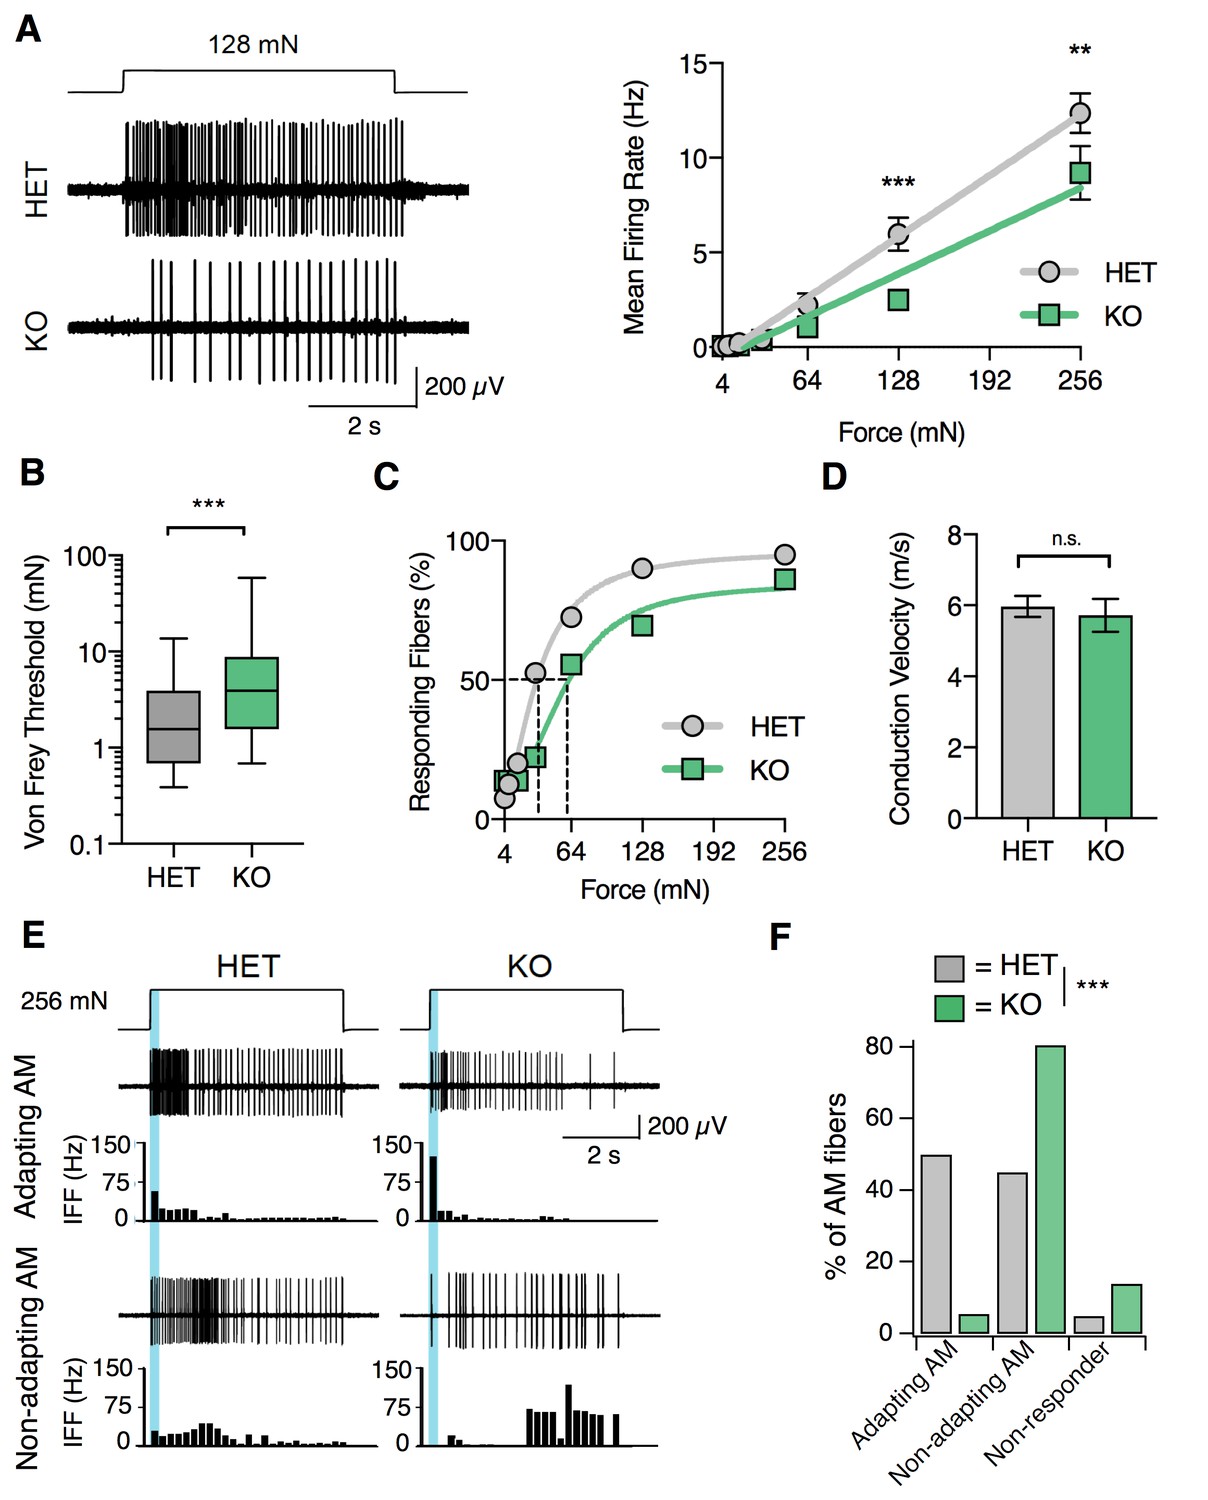
S1PR3 is required for nociceptive responses of high-threshold AM nociceptors.
(A) (Left) Representative traces of AM fiber activity over time in ex vivo skin-saphenous nerve recording in response to stimulation (128 mN, top) from HET (middle) and KO (bottom) mice. (Right) Mean firing rate of AM fibers in response to force controlled stimulation (4, 8, 16, 32, 64, 128, 256 mN). **p=0.001, ***p=0.0002 (two-way ANOVA, Sidak’s post-hoc); lines, linear regression (HET: slope = 50 Hz/N, R2 = 0.99; KO: slope = 35 Hz/N, R2 = 0.95). (B) von Frey threshold of AM fibers in S1PR3 HET and KO specimens. ***p<0.0001 (Mann-Whitney test); lines, median; boxes, 25–75 percentile; whiskers, min-max. (C) Cumulative response plot of AM fibers to force controlled stimulation (solid lines); four-parameter logistic fit from which half-maximal force was estimated for each genotype (dotted lines). (D) Conduction velocity (CV) of AM fibers in S1PR3 HET and KO mice. p=0.65 (two-tailed t-test); n = 40, 36 fibers; errors, mean ± SEM. (E) Representative traces and binned instantaneous firing frequencies (IFF; 200 ms bins) of Non-Adapting and Adapting AMs in response to force controlled stimulation (256 mN, top) for S1PR3 HET and KO mice; blue regions, dynamic phase of stimulation (200 ms). (F). Proportion of fibers classified by pattern of mechanically evoked responses to 256-mN stimuli: Non-Responder (HET, 2/40 fibers; KO 5/36), Non-Adapting AM (HET, 18/40; KO, 29/36), Adapting AM (HET, 20/40; KO, 2/36). Non-Responders fired action potentials to large magnitude von Frey monofilaments (<0.5 mm tip diameter), but not controlled mechanical stimulation (256 mN, 2 mm tip diameter). ***p<0.00001 (Chi-square test).
-
Figure 6—source data 1
S1PR3 is required for nociceptive responses of high-threshold AM nociceptors.
Related to Figure 6. Table provides properties of all S1PR3 HET and KO AM fibers that were recorded.
- https://doi.org/10.7554/eLife.33285.015
Figure 6—figure supplement 1
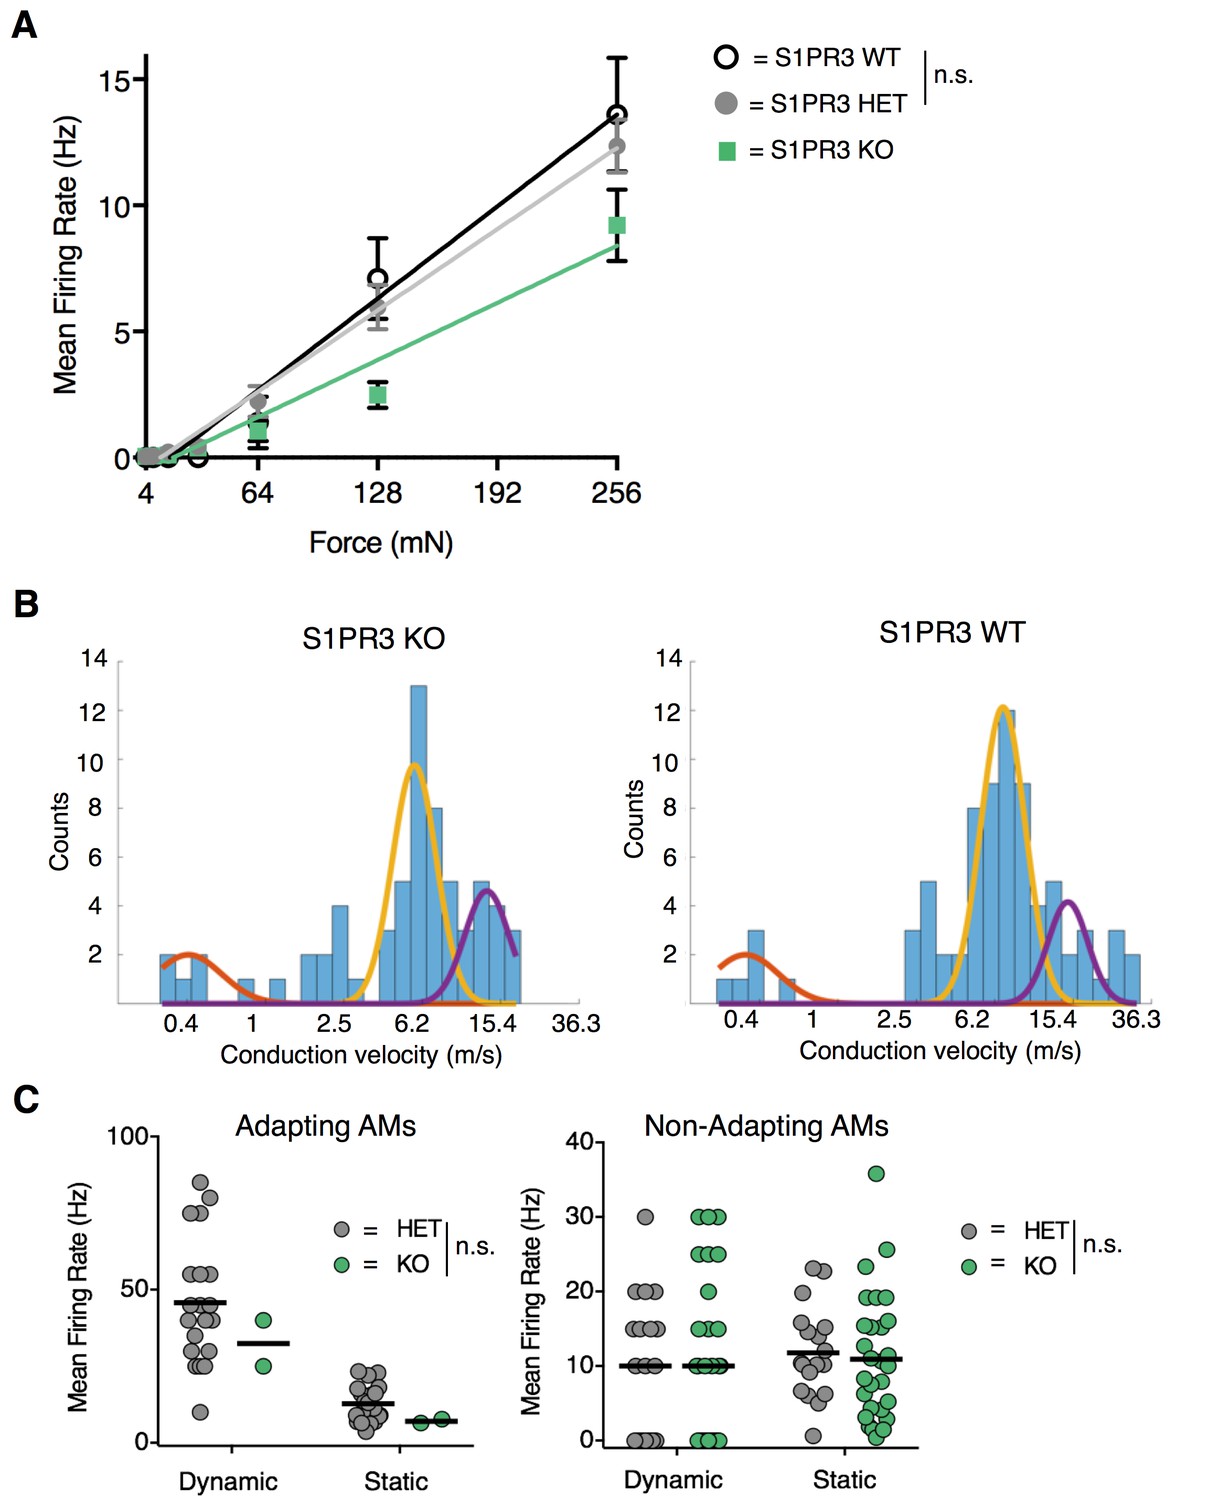
S1PR3 HET AM nociceptors display normal nociceptive responses.
Related to Figure 6. (A) Mean firing rate of AM fibers in response to force controlled stimulation (4, 8, 16, 32, 64, 128, 256 mN) from Figure 6A, with additional data from one wild-type animal (nWT = 4 fibers) (WT: slope, 57 Hz/N, R (Vriens et al., 2011), 0.98; p=0.90, two-way ANOVA comparing HET and WT). (B) (Left) Conduction velocities from teased fibers from 6 S1PR3 KO animals (purple, Aβ, centroid = 13.1 m/s; yellow, Aδ, centroid = 5.7 m/s; orange, C, centroid = 0.4 m/s; R2 = 0.69, N = 65 fibers). (Right) Conduction velocities from teased fibers from 1 S1PR3 HET and 6 C57BL/6 WT animals (purple, Aβ, centroid = 14.5 m/s; yellow, Aδ, centroid = 6.8 m/s; orange, C, centroid = 0.3 m/s; R2 = 0.82, N = 76 fibers). Three-term Gaussian model. X-axis plotted on a log 1.2 scale. (C) Mean firing rates during dynamic (ramp) and static (hold) stimulation for S1PR3 HET and S1PR3 KO recordings (left, Adapting AMs; right, Non-Adapting AMs; see Figure 6E–F for experimental details). No significant differences were found between genotypes (p=0.227, 0.490 (two-way ANOVA); bars, means). As shown in Figure 6F, the proportion of Adapting AMs was significantly lower in S1PR3 KO recordings compared with littermate controls.
Figure 7 with 1 supplement
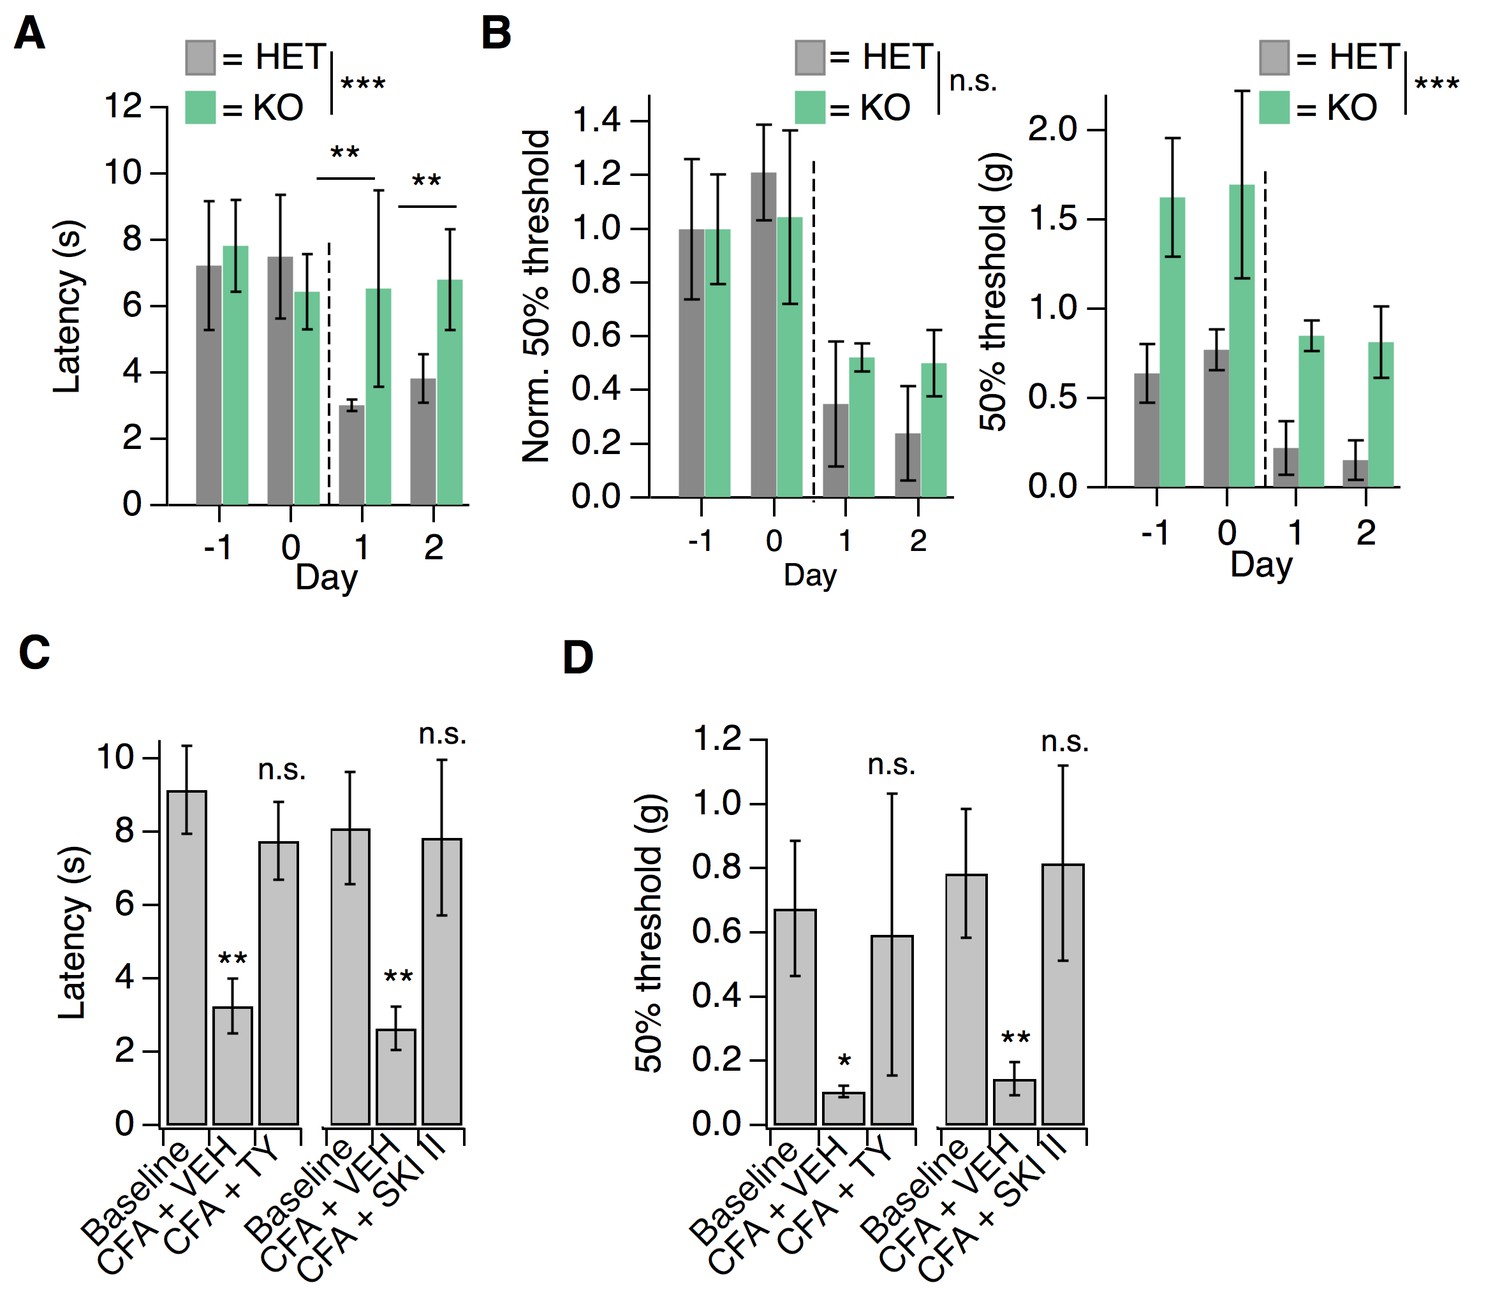
S1PR3 is dispensable for development of chronic mechanical hypersensitivity.
(A) Thermal latency before and after CFA treatment (indicated by dotted line); pgenotype = 0.0053 (two-way ANOVA; N = 5 mice per genotype). Sidak’s multiple comparison between genotypes for specific time points indicated on graph. Error bars represent mean ± SD. (B) (Left) Normalized 50% withdrawal threshold before and after CFA treatment (indicated by dotted line); p(genotype)<0.001 (two-way ANOVA). (Right) 50% withdrawal thresholds for same experiment (p(genotype)=0.1634; two-way ANOVA). (C) (Left) Thermal latency assessed before (‘Baseline’) and 24 hr post CFA injection with either vehicle (CFA + VEH) or TY 52156 (CFA + TY) acutely administered; p<0.0001 (one-way ANOVA N = 5 mice per treatment). (Right) Thermal latency assessed before and after CFA injection with either vehicle (CFA + VEH) or SKI II (CFA + SKI II) acutely administered on Day 1; p<0.0001 (one-way ANOVA; N = 5–7 mice per treatment). Dunnett’s test comparisons to baseline are indicated on graph. Error bars represent mean ± SD. (D) (Left) 50% withdrawal threshold assessed before and 24 hr post CFA injection with either vehicle (CFA + VEH) or TY 52156 (CFA + TY) acutely administered on Day 1; p<0.0001 (one-way ANOVA; N = 5 mice per treatment). Dunnett’s test comparisons to baseline are indicated on graph. (Right) 50% withdrawal threshold assessed before and 24 hr post CFA injection with either vehicle (CFA + VEH) or SKI II (CFA + SKI II) acutely administered; p-values indicated on graph (two-tailed unpaired t-test; N = 5 mice per group.
-
Figure 7—source data 1
S1PR3 is dispensable for development of chronic mechanical hypersensitivity.
Related to Figure 7.
- https://doi.org/10.7554/eLife.33285.018
Figure 7—figure supplement 1

S1PR3 KO animals display normal CFA-evoked immune cell recruitment.
Related to Figure 7. (A) Recruitment of neutrophils (Neut.) or inflammatory monocytes (IMs) to hindpaw skin 24 hr post-CFA administration in S1PR3 HET and KO mice, as a dot plot of CD11b + cells plotting Ly6G fluorescence intensity vs. Ly6C intensity (AFU). Boxes are for illustrative purposes. (B) Recruitment of immune cells, including neutrophils (Neut.) and inflammatory monocytes (IMs) to hindpaw skin 24 hr post-CFA administration in HET and KO mice, displayed as total number of cells; N = 8 mice per genotype. Sidak’s multiple comparisons were made between HET and KO for each cell type.
Figure 8
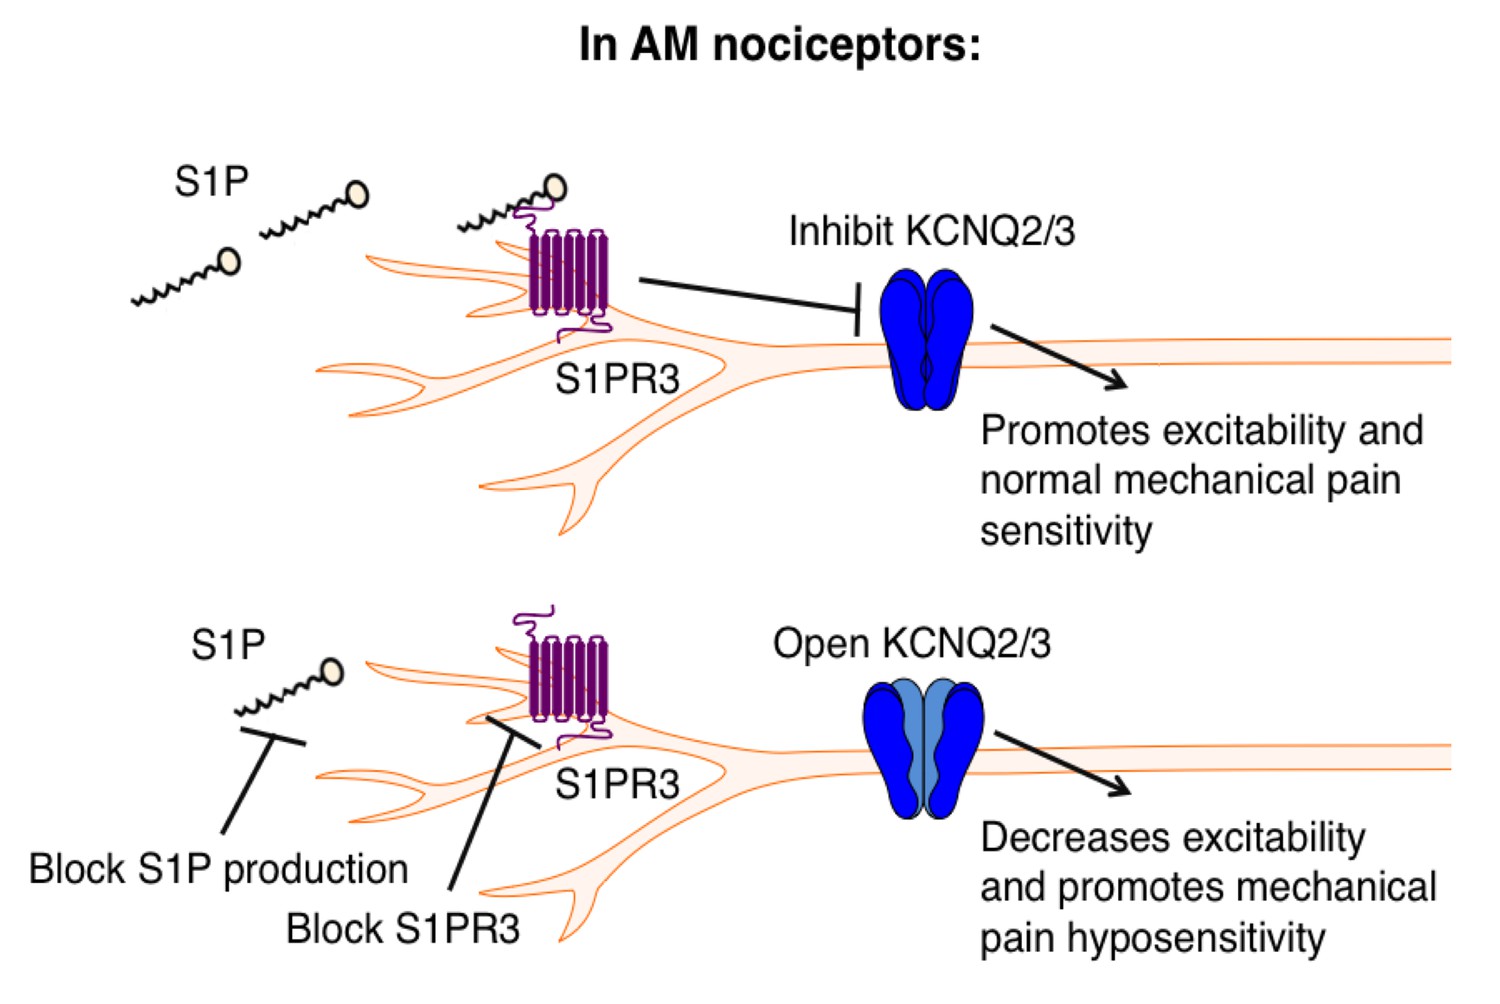
Proposed model illustrating a key role for S1PR3 in regulating mechanical pain in AM nociceptors.
(Top) S1P promotes activation of S1PR3, which leads to inhibition of KCNQ2/3 currents and promotes normal mechanical pain sensitivity. (Bottom) Diminished S1P or S1PR3 antagonism alleviates inhibition of KCNQ2/3, leading to mechanical pain hyposensitivity.
Tables
Key resources table
| Reagent type (species) or resource | Designation | Source or reference | Identifiers | Additional information |
|---|---|---|---|---|
| strain, strain background (C57BL/6J) | C57BL/6J; WT; wild-type | The Jackson Laboratory | Jackson Stock #: 000664; RRID:IMSR_JAX:000664 | |
| strain, strain background (B6.129S6- S1pr3tm1Rlp/Mmnc) | S1PR3 KO; S1pr3-/- | MMRRC Repository; https://www.ncbi.nlm.nih.gov/pubmed/15138255; PMID: 15138255 | B6.129S6-S1pr3tm1Rlp/ Mmnc; MMRRC Stock #: 012038-UNC; RRID: MMRRC_012038-UNC | |
| strain, strain background (B6.Cg- S1pr3tm1.1Hrose/J) | S1pr3-mCherry; S1pr3mcherry/+ | The Jackson Laboratory | B6.Cg-S1pr3tm1.1Hrose/J; Jackson Stock #: 028624; RRID:IMSR_JAX:028624 | |
| antibody (Living Colors DsRed Rabbit Polyclonal Antibody) | Rabbit anti-DsRed | Clontech | RRID:AB_10013483; Cat # 632496 | |
| antibody (Chicken polyclonal to Neurofilament heavy polypeptide) | Chicken anti-NefH | Abcam | RRID:AB_304560; Cat # ab4680 | |
| antibody (Chicken polyclonal to beta III Tubulin) | Chicken anti-β-tubulin III | Abcam | RRID:AB_10899689; Cat # ab107216 | |
| antibody (Mouse monoclonal [13C4/I3 C4] to PGP9.5) | Mouse anti-PGP9.5 | Abcam | RRID:AB_306343; Cat # ab8189 | |
| antibody (Rabbit polyclonal to EDG3) | Rabbit anti-S1PR3 | Abcam | RRID:AB_732070; Cat # ab38324 | |
| antibody (Mouse monoclonal to NF200) | Mouse anti-NF200 | Sigma-Aldrich | RRID:AB_260781; Cat # N5389 | |
| antibody (Chicken polyclonal to Peripherin) | Chicken anti-Peripherin | Abcam | RRID:AB_777207; Cat # ab39374 | |
| antibody (Goat Anti-Mouse IgG H and L Alexa Fluor 488) | Goat anti-Mouse Alexa 488 | Abcam | RRID:AB_2688012; Cat # ab150117 | |
| antibody (Goat anti-Chicken IgY (H + L) Secondary Antibody, Alexa Fluor 488) | Goat anti-Chicken Alexa 488 | ThermoFisher Scientific | RRID:AB_2534096; Cat # A-11039 | |
| antibody (Goat anti-Rabbit IgG (H + L) Secondary Antibody, Alexa Fluor 594) | Goat anti-Rabbit Alexa 594 | Invitrogen | RRID:AB_2556545; Cat # R37117 | |
| sequence-based reagent | S1pr3 Type I Probe | ThermoFisher Scientific; Affymetrix | Assay ID: VB1-19668-VC | |
| sequence-based reagent | Scn1a Type 6 Probe | ThermoFisher Scientific; Affymetrix | Assay ID: VB6-18173-VC | |
| sequence-based reagent | Npy2r Type 6 Probe | ThermoFisher Scientific; Affymetrix | Assay ID: VB6-3197254-VC | |
| sequence-based reagent | Piezo2 Type 6 Probe | ThermoFisher Scientific; Affymetrix | Assay ID: VB6-18046-VC | |
| sequence-based reagent | Trpv1 Type 6 Probe | ThermoFisher Scientific; Affymetrix | Assay ID: VB6-18246-VC | |
| sequence-based reagent | Trpa1 Type 6 Probe | ThermoFisher Scientific; Affymetrix | Assay ID: VB6-16610-VC | |
| commercial assay or kit (ViewRNA ISH Tissue Assay Kit (2-plex)) | ViewRNA ISH Tissue Assay Kit | ThermoFisher Scientific; Affymetrix | Cat # QVT0012 | |
| chemical compound, drug (Sphingosine-1-phosphate) | Sphingosine 1-phosphate; S1P | Tocris Bioscience; Avanti Polar Lipids | CAS 26993-30-6; Cat # 1370; Cat # 860641 | |
| chemical compound, drug (TY 521256) | TY 52156 | Tocris Bioscience | CAS 934369-14-9; Cat # 5328 | |
| chemical compound, drug (SKI II) | SKI II | Tocris Bioscience | CAS 312636-16-1; Cat # 2097 | |
| chemical compound, drug (Histamine dihydrochloride) | Histamine | Sigma-Aldrich | CAS 56-92-8; Cat # H7250 | |
| chemical compound, drug (Chloroquine diphosphate) | Chloroquine | Sigma-Aldrich | CAS 50-63-5; Cat # C6628 | |
| chemical compound, drug (E-Capsaicin) | Capsaicin | Tocris Bioscience | CAS 404-86-4; Cat # 0462 | |
| chemical compound, drug (Dimethyl sulfoxide) | DMSO | Sigma-Aldrich | Cat # 8418–100 mL | |
| chemical compound, drug (Methanol) | Methanol | Sigma-Aldrich | CAS 67-56-1; Cat # 34860 | |
| chemical compound, drug (Linopirdine dihydrochloride) | Linopirdine | Tocris Bioscience | CAS 113168-57-3; Cat # 1999 | |
| chemical compound, drug (XE 991 dihydrochloride) | XE 991 | Tocris Bioscience | CAS 122955-13-9; Cat # 2000 | |
| chemical compound, drug (W146) | W146 | Tocris Bioscience | CAS 909725-61-7; Cat # 3602 | |
| chemical compound, drug (Freund's Adjuvant, Complete) | Complete Freund's Adjuvant; CFA | Sigma-Aldrich | Cat # F5881 | |
| chemical compound, drug (Formaldehyde, 16%, methanol free, Ultra Pure) | Paraformaldehyde; PFA | Polysciences, Inc. | Cat # 18814–10 | |
| chemical compound, drug (Tissue Tek Optimal cutting temperature compound (OCT)) | OCT | Sakura Finetek USA | Cat # 4583 | |
| chemical compound, drug (Triton X-100 solution) | Triton X-100 | BioUltra | CAS 9002-93-1; Cat # 93443 | |
| chemical compound, drug (Phosphate-buffered saline (PBS), pH 7.4) | PBS | Gibco | Cat # 10010023 | |
| chemical compound, drug (Benzyl benzoate) | Benzyl benzoate | Sigma-Aldrich | CAS 120-51-4; Cat # B6630 | |
| chemical compound, drug (Benzyl alcohol) | Benzyl alcohol | Sigma-Aldrich | CAS 100-51-6; Cat # 305197 | |
| chemical compound, drug (Sucrose) | Sucrose | Sigma-Aldrich | CAS 57-50-1; Cat # S0389 | |
| chemical compound, drug (LIVE/DEAD Fixable Aqua Dead Cell Stain Kit, for 405 nm excitation) | Aqua | ThermoFisher Scientific | Cat # L34957 | |
| chemical compound, drug (Isoflurane, USP) | Isoflurane | Piramal | CAS 26675-46-7 | |
| chemical compound, drug (4',6-Diamidino-2- Phenylindole, Dihydrochloride) | DAPI | ThermoFisher Scientific | CAS 28718-90-3; Cat # 1306 | |
| chemical compound, drug (Fluoromount-G, with DAPI) | Fluoromount-G, with DAPI | ThermoFisher Scientific | Cat # 00-4959-52 | |
| antibody (CD117 (c-Kit) Monoclonal Antibody (2B8), Biotin) | c-Kit-Biotin | eBioscience | RRID:AB_466569; Cat # 13-1171-82 | |
| antibody (FceR1 alpha Monoclonal Antibody (AER-37 (CRA1)), PE, eBioscience) | FceRI-PE | eBioscience | RRID:AB_10804885; Cat # 12-5899-42 | |
| antibody (CD49b (Integrin alpha 2) Monoclonal Antibody (DX5), PE-Cyanine7, eBioscience) | CD49b-PECy7 | eBioscience | RRID:AB_469667; Cat # 25-5971-82 | |
| antibody (Anti-Siglec-F-APC, mouse (clone: REA798)) | SiglecF-APC | Miltenyi Biotech | RRID:AB_2653441; Cat # 130-112-333 | |
| antibody (Streptavidin FITC) | SA-FITC | eBioscience | RRID:AB_11431787; Cat # 11-4317-87 | |
| antibody (Ly-6C Monoclonal Antibody (HK1.4), PerCP- Cyanine5.5, eBioscience) | Ly6C-PerCP | eBioscience | RRID:AB_1518762; Cat # 45-5932-82 | |
| antibody (Pacific Blue anti- mouse/human CD11b Antibody) | CD11b-PB | BioLegend | RRID:AB_755985; Cat # 101223 | |
| antibody (Brilliant Violet 785 anti-mouse Ly-6G Antibody) | Ly6G-BV785 | BioLegend | RRID:AB_2566317; Cat # 127645 | |
| antibody (CD45.2 Monoclonal Antibody (104), Alexa Fluor 700, eBioscience) | CD45.2-AF700 | eBioscience | RRID:AB_657752; Cat # 56-0454-82 | |
| software, algorithm (Igor Pro version 6.3) | IgorPro | WaveMetrics | https://www.wavemetrics.com/order/order_igordownloads6.htm | |
| software, algorithm (Microsoft Excel 2011) | Microsoft Excel | Microsoft | https://www.microsoft.com/en-us/store/d/excel-2016-for-mac/ | |
| software, algorithm (pClamp 10) | pClamp | Axon | http://mdc.custhelp.com/app/answers/detail/a_id/18779/~/axon%E2%84%A2-pclamp%E2%84%A2-10-electrophysiology-data-acquisition-%26-analysis-software | |
| software, algorithm (MetaFluor 7.8) | MetaFluor | Molecular Devices | https://www.moleculardevices.com/systems/metamorph-research-imaging/metafluor-fluorescence-ratio-imaging-software | |
| software, algorithm (MATLAB) | MATLAB | MathWorks | https://www.mathworks.com/downloads/ | |
| software, algorithm (FIJI) | FIJI | NIH | https://imagej.net/Fiji/Downloads | |
| software, algorithm (LabChart Software) | LabChart Software | AD Instruments | https://www.adinstruments.com/products/labchart | |
| software, algorithm (Graphpad Prism 7) | Graphpad Prism | Graphpad | https://www.graphpad.com/scientific-software/prism/ | |
| software, algorithm (FlowJo 10.4.2) | FlowJo | FlowJo | https://www.flowjo.com/solutions/flowjo/downloads | |
| software, algorithm (custom) | custom-made software in MATLAB | this paper | NA | https://github.com/buh2003/SpikeSortingPCA_DBSCAN (Hoffman, 2018; copy archived at https://github.com/elifesciences-publications/SpikeSortingPCA_DBSCAN) |
| other (Bovine serum albumin, cold ethanol fraction, pH 5.2,≥96%) | BSA | Sigma-Aldrich | CAS 9048-46-8; Cat # A4503 | |
| other (Isolectin B4 (Bandeireia simplicifolia), FITC-conjugate) | IB4-FITC; IB4 | Enzo Life Sciences | Cat # ALX-650–001F- MC05 | |
| other (Normal Goat Serum) | NGS | Abcam | Cat # ab7481 | |
| peptide, recombinant protein (δ-theraphototoxin- Hm1a) | Hm1a | other; https://www.ncbi.nlm.nih.gov/pmc/articles/PMC4919188/; PMID: 4919188 | NA | obtained from the laboratory of David Julius (UCSF) |
Additional files
-
Supplementary file 1
Co-ISH quantification for sectioned DRG from adult wild-type mice.
Related to Figure 3.
- https://doi.org/10.7554/eLife.33285.020
-
Transparent reporting form
- https://doi.org/10.7554/eLife.33285.021
Download links
A two-part list of links to download the article, or parts of the article, in various formats.
Downloads (link to download the article as PDF)
Open citations (links to open the citations from this article in various online reference manager services)
Cite this article (links to download the citations from this article in formats compatible with various reference manager tools)
The signaling lipid sphingosine 1-phosphate regulates mechanical pain
eLife 7:e33285.
https://doi.org/10.7554/eLife.33285


