Early structural and functional plasticity alterations in a susceptibility period of DYT1 dystonia mouse striatum
- University of Rome Tor Vergata, Italy
- IRCCS Fondazione Santa Lucia, Italy
- University of Milan, Italy
Figures
Figure 1
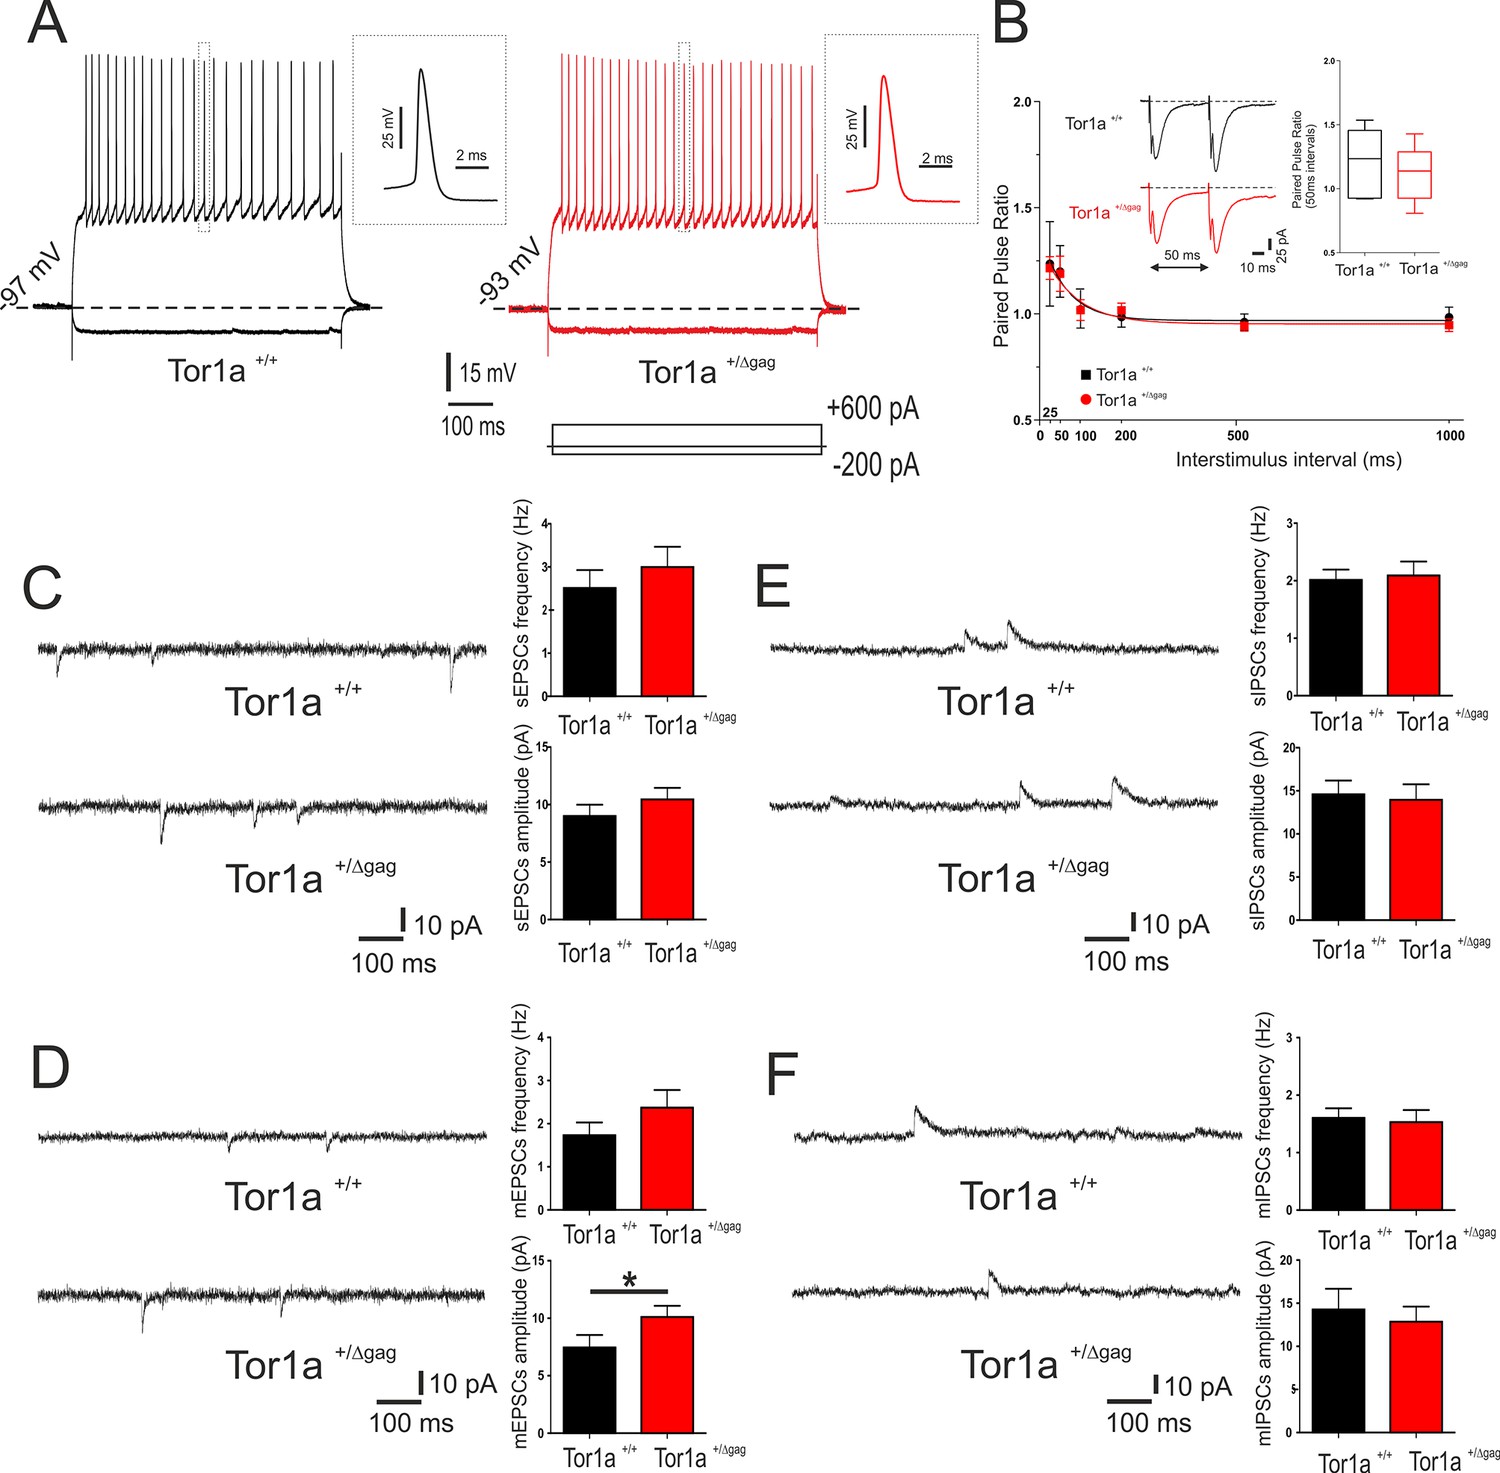
Electrophysiological and synaptic properties of striatal SPNs.
(A) Superimposed traces showing voltage responses to both depolarizing (+600 pA) and hyperpolarizing (−200 pA) current steps in SPNs recorded from P26 Tor1a+/+ (black) and Tor1a+/Δgag (red) mice. The insets display single action potentials (amplitude: Tor1a+/+69.62 ± 1.14 mV, N = 11, n = 11; Tor1a+/Δgag66.65 ± 1.68 mV, N = 8, n = 11; Student’s t test p>0.05). (B) Summary plot of paired-pulse ratio values showing similar facilitation in both genotypes. Each data point represents mean ± SEM. P26 Tor1a+/+ mice N = 3, 25 ms: 1.24 ± 0.20, n = 5; 50 ms: 1.20 ± 0.12, n = 5, Student’s t test p<0.05; P26 Tor1a+/Δgag mice N = 3, 25 ms: 1.22 ± 0.05, n = 5; 50 ms: 1.19 ± 0.08, n = 5; Student’s t test p<0.05. Insets represent sample traces showing facilitation at ISI = 50 ms in both genotypes. (C) Representative sEPSCs recordings in PTX from SPNs of P26 Tor1a+/+ and Tor1a+/Δgag mice. HP: −70 mV. The summary plots show no significant difference between genotypes in sEPSCs frequency and amplitude (Student’s t test p>0.05). (D) Representative whole-cell recordings in PTX plus TTX of mEPSC from P26 Tor1a+/+ and Tor1a+/Δgag SPNs. HP: −70 mV. Plots show a significant difference in the amplitude of mEPSCs recorded from Tor1a+/Δgag mice compared to wild-types (Tor1a+/+, 7.45 ± 1.09, N = 9, n = 9; Tor1a+/Δgag, 10.11 ± 0.97, N = 8, n = 9; Student’s t test *p<0.05). (E) Representative recordings in MK-801 and CNQX of sIPSCs from P26 Tor1a+/+ and Tor1a+/Δgag SPNs. HP:+10 mV. The summary plots show no significant difference in sIPSC frequency and amplitude (Student’s t test p>0.05). (F) Representative traces of mIPSCs recorded in MK-801, CNQX and TTX. HP:+10 mV. The summary plots show no difference in frequency and amplitude between genotypes (Student’s t test p>0.05). Data are presented as mean ± SEM.
-
Figure 1—source data 1
Electrophysiological and synaptic properties of striatal SPNs.
- https://doi.org/10.7554/eLife.33331.003
Figure 2
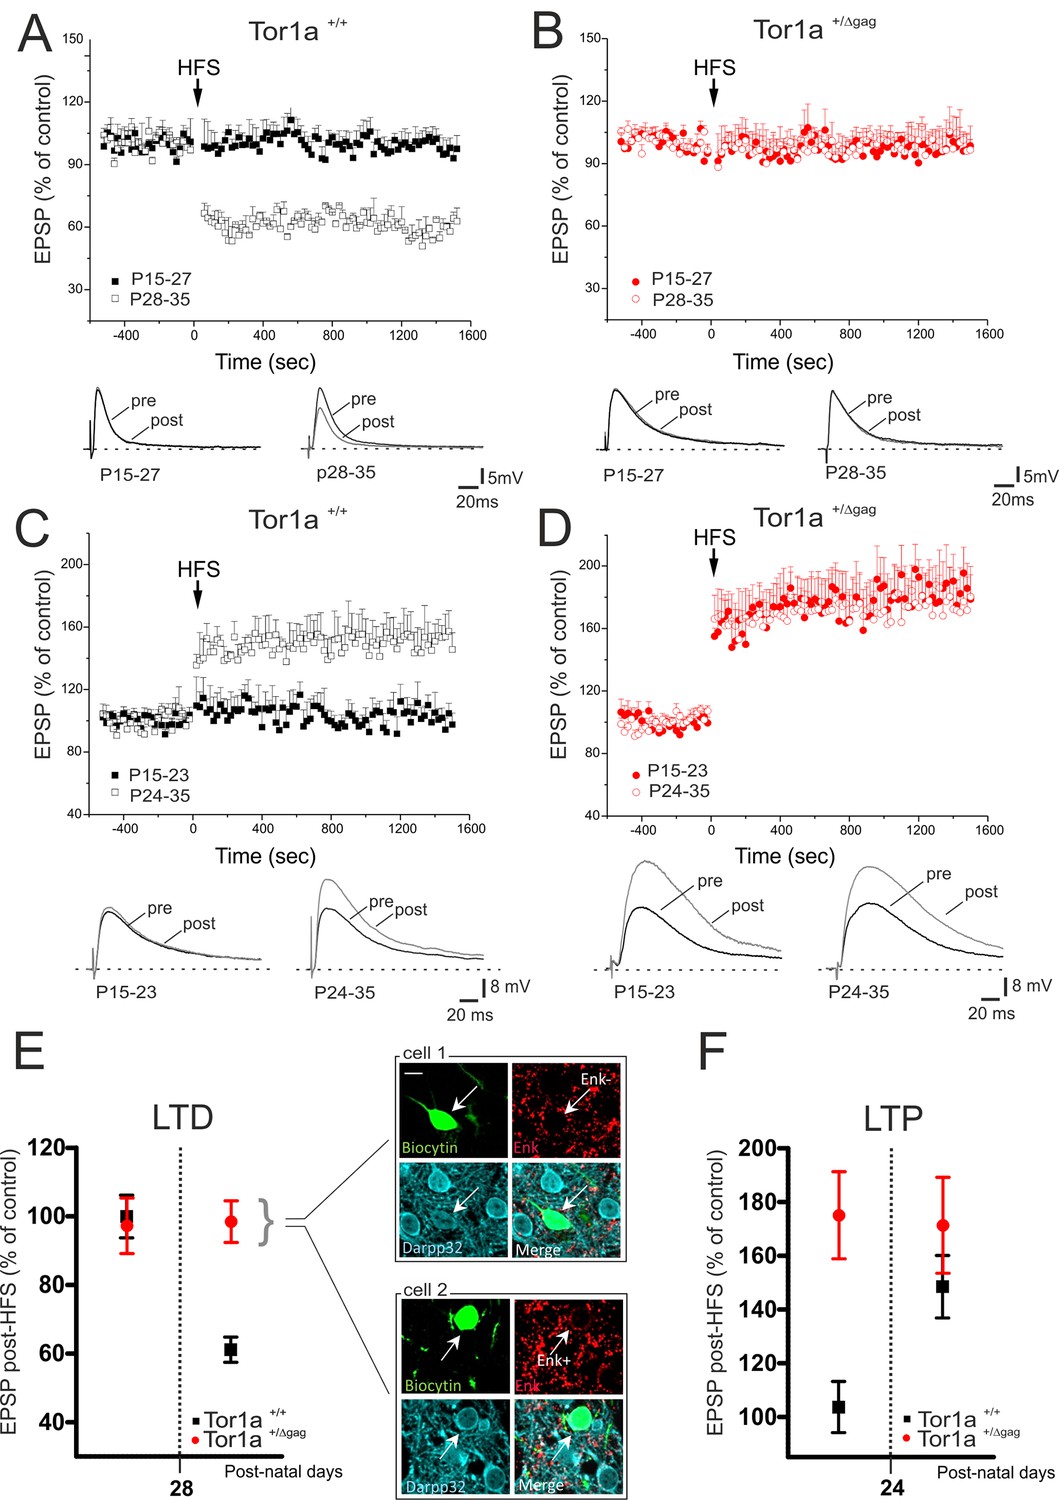
Altered developmental profile of corticostriatal long-term synaptic plasticity expression in Tor1a+/Δgag mice.
(A) (Top) Developmental time-course of LTD expression in Tor1a+/+ mice. HFS protocol (arrow) induces LTD in SPNs recorded from Tor1a+/+ mice after P28 (59.63 ± 2.63% of control; N = 8, n = 8; paired Student’s t test p<0.05), but not from P15 to P27 (99.46 ± 4.65, N = 9, n = 10; paired Student’s t test p>0.05). (Bottom) Representative EPSP traces recorded before (pre) and 20 min after (post) HFS protocol delivery. (B) (Top) In Tor1a+/Δgag mice, HFS protocol fails to induce any LTD, irrespective of the postnatal age (P15-27, 96.85 ± 11.35% of control; N = 8, n = 12; P28-35, 100.29 ± 4.16% of control, N = 8, n = 12; paired Student’s t test p>0.05). (Bottom) Representative traces of EPSPs recorded pre- and post-HFS. (C) (Top) Time-course of corticostriatal LTP expression during postnatal development in Tor1a+/+ mice. HFS of corticostriatal afferents (arrow) induces LTP expression in Tor1a+/+ mice after P24 (148.80 ± 15.39% of control; N = 6, n = 10; paired Student’s t test p<0.05), but not at P15-23 (104.68 ± 8.99% of control; N = 6, n = 10; paired Student’s t test p>0.05). (Bottom) Sample EPSPs recorded pre- and post-HFS protocol in Tor1a+/+ mice. (D) (Top) SPNs recorded from Tor1a+/Δgag mice exhibit a premature LTP (P15-23, 174.68 ± 22.59% of control; N = 6, n = 10; P24-35, 172.35 ± 11.06% of control; N = 9, n = 10; paired Student’s t test p<0.05). (Bottom) EPSP traces recorded pre- and post-LTP induction. (E) Mean plot comparing LTD expression at different postnatal days in Tor1a+/+ and Tor1a+/Δgag SPNs. (Inset) Confocal imaging of two SPNs recorded from Tor1a+/Δgag slices filled with biocytin (green) and immunolabelled for ENK (red) and DARPP-32 (cyano), marker of SPNs. Both ENK-positive and ENK-negative biocytin-labeled SPNs showed lack of LTD (scale bar: 10 µm). (F) Mean plot comparing LTP expression at different postnatal days in Tor1a+/+ and Tor1a+/Δgag SPNs. Values are presented as mean ± SEM.
-
Figure 2—source data 1
Altered developmental profile of corticostriatal long-term synaptic plasticity expression in Tor1a+/Δgag mice.
- https://doi.org/10.7554/eLife.33331.005
Figure 3

Electrophysiological characterization of AMPAR and NMDAR currents at corticostriatal synapses of SPNs in both Tor1a+/+ and Tor1a+/Δgag mice.
(A) (Left) Representative EPSCs traces recorded at HP=+40 mV from SPNs of juvenile Tor1a+/+ and Tor1a+/Δgag mice. The NMDAR antagonist MK-801 isolates the AMPAR-mediated EPSC component (black trace), while the NMDAR-EPSC (grey trace) is obtained by digital subtraction of the AMPAR EPSC from the dual-component EPSC (red). (Right) Summary plot of NMDA/AMPA current ratio calculated in SPNs from P26 Tor1a+/+ and Tor1a+/Δgag mice. A significant decrease of NMDA/AMPA ratio was detected in P26 Tor1a+/Δgag mice, compared to Tor1a+/+ (Tor1a+/+, 2.92 ± 0.38, N = 3, n = 8; Tor1a+/Δgag, 1.81 ± 0.25, N = 3, n = 6; Student’s t test, p<0.05). (B) (Left) Representative EPSCs traces recorded at HP =+40 mV from SPNs of adult Tor1a+/+ and Tor1a+/Δgag mice. (Right) Summary plot of NMDA/AMPA current ratio showing no significant difference between genotypes (Tor1a+/+, 1.75 ± 0.15, N = 3, n = 7; Tor1a+/Δgag, 2.01 ± 0.12, N = 3, n = 7; Student’s t test, p>0.05). (C) AMPAR-mediated currents recorded at different HP in P26 Tor1a+/+ and Tor1a+/Δgag SPNs. The IV relationship shows a significant increase in the current recorded at more hyperpolarized range from P26 Tor1a+/Δgag SPNs (HP=−70 mV: two-way ANOVA, *p<0.01). (Left) Summary plot of rectification index values of P26 Tor1a+/+ and Tor1a+/Δgag SPNs (Tor1a+/+, 0.50 ± 0.07, n = 7; Tor1a+/Δgag, 0.43 ± 0.04, n = 8; Student’s t test p>0.05). (D) AMPAR-mediated currents recorded in the presence of the GluA2-lacking AMPAR antagonist NASPM at P26. HP =−70 mV; to-way ANOVA, *p<0.01). (Left) Summary plots of the rectification index measured at P26 (Tor1a+/+, 0.53 ± 0.04, n = 5, N = 6; Tor1a+/Δgag, 0.46 ± 0.03, n = 7; Student’s t test, p>0.05). (E) Normalized IV relationships of NMDAR-mediated currents show no difference between genotypes at P26 (two-way ANOVA, p>0.05). (F) Representative NMDA-mediated EPSCs recorded at HP =+40 mV from P26 SPNs. (G) Summary plots display rise and decay time of NMDA-EPSCs recorded at HP =+40 mV in SPNs from P26 Tor1a+/+ and Tor1a+/Δgag mice (rise time: Tor1a+/+, 7.78 ± 0.42, n = 9; Tor1a+/Δgag, 9.23 ± 1.37, n = 7; Student’s t test p>0.05; decay time: Tor1a+/+, 502.50 ± 20.06, n = 9; Tor1a+/Δgag, 422.10 ± 30.15, n = 7, Student’s t test, *p<0.05). Values are presented as mean ± SEM.
-
Figure 3—source data 1
Electrophysiological characterization of AMPAR and NMDAR currents at corticostriatal synapses of SPNs in both Tor1a+/+ and Tor1a+/Δgag mice.
- https://doi.org/10.7554/eLife.33331.007
Figure 4

Molecular analysis of the SPNs postsynaptic compartment in P26 and P60 Tor1a+/Δgag compared to age-matched wild-type mice.
WB analyses were performed on the post-synaptic TIF fraction in a minimum of three different animals per genotype. (A) WB analysis for GluN2A, GluN2B, PSD-95 and tubulin in P26 (left panel) and P60 (right panel) Tor1a+/Δgag and age-matched Tor1a+/+ mice. (C) WB analysis for GluA1, GluA1p845, GluA2 and tubulin in P26 (left panel) and P60 (right panel) Tor1a+/Δgag and age-matched Tor1a+/+ mice. (B,D) The histogram shows the quantification of protein levels following normalization on tubulin (P26 Tor1a+/Δgag compared to Tor1a+/+, GluA1: 142.8 ± 9.8%, n = 5, p<0.05; GluA1-p845: 200.9 ± 36.6%, n = 5, p<0.05; GluA2: 175.1 ± 16.6%, n = 5, p<0.05; GluN2A: 197.3 ± 34.0%, n = 5, p<0.05; P60 Tor1a+/Δgag GluA1: 90.0 ± 23.4%, n = 5, p>0.05; GluA1-p845: 77.7 ± 14.2%, n = 5, p>0.05; GluA2: 103.2 ± 16.2%, n = 5, p>0.05; GluN2A: 88.8 ± 18.0%, n = 5,p>0.05). All values are mean ± SEM expressed as % of Tor1a+/+ mice.
Figure 5
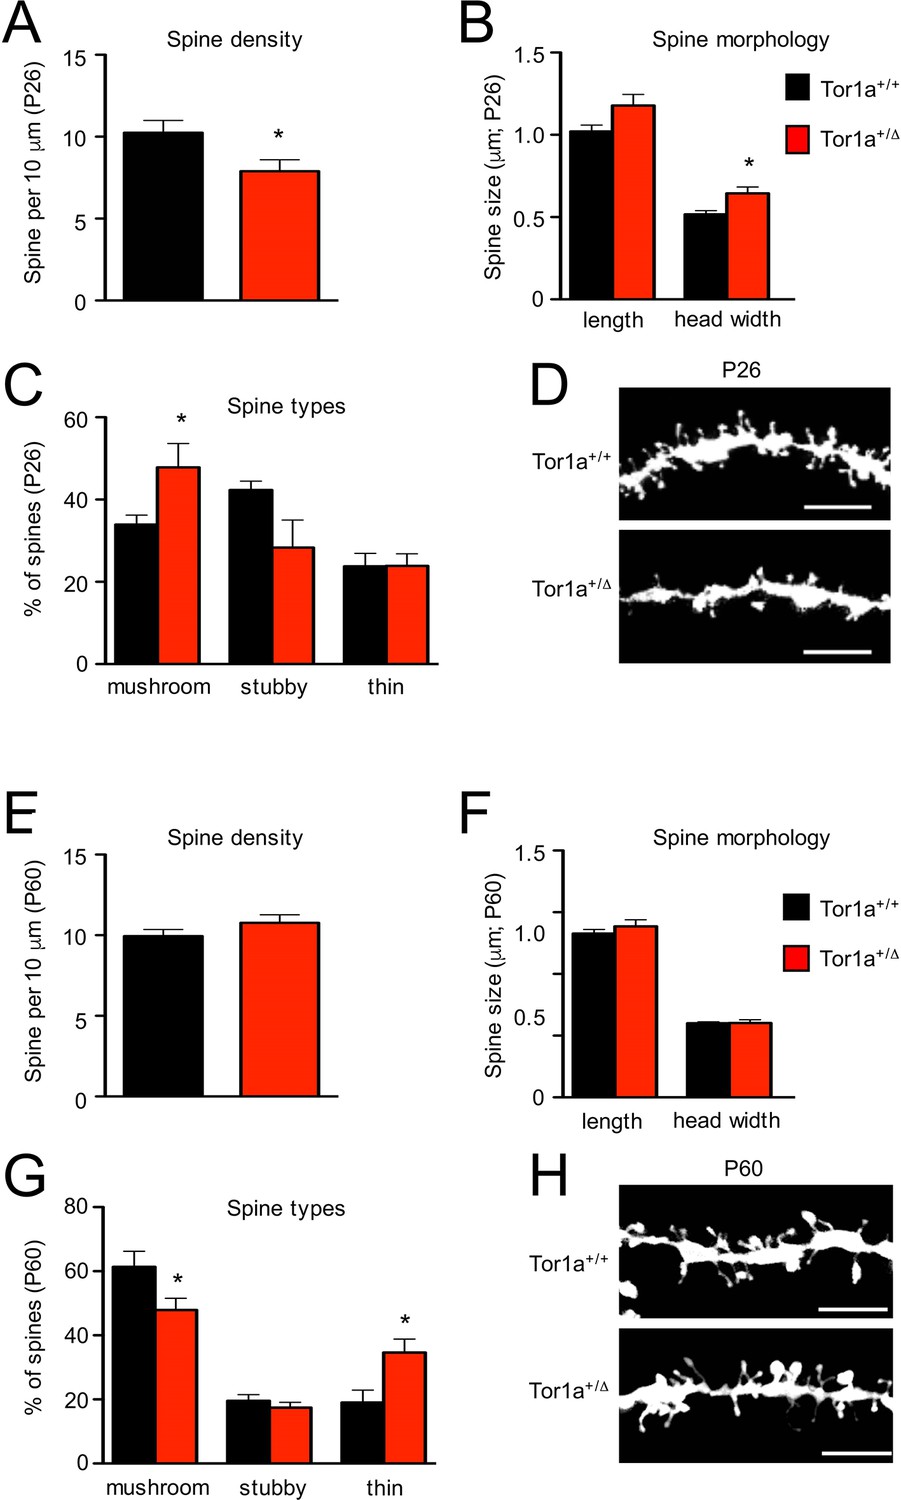
Analysis of dendritic spines morphology in P26 and P60 Tor1a+/Δgag compared to age-matched Tor1a+/+mice.
(A) Histogram representing dendritic spine density in P26 Tor1a+/Δgag and Tor1a+/+ mice (Tor1a+/+, 10.25 ± 0.75 spines/10 μm, n = 10; Tor1a+/Δgag, 7.89 ± 0.70 spines/10 μm, n = 10; unpaired Student’s t test *p<0.05). (B,C) Histograms showing the quantification of dendritic spine size (B, spine length and head width) and dendritic spine type (C, mushroom, stubby, thin) in P26 Tor1a+/Δgag compared to Tor1a+/+ mice (dendritic spine width Tor1a+/+, 0.51 ± 0.02 μm, n = 10; Tor1a+/ Δgag, 0.64 ± 0.04 μm, n = 10, unpaired Student’s t-test *p<0.05; mushroom-type spines Tor1a+/+, 33.92 ± 2.32%, n = 10; Tor1a+/Δgag, 47.81 ± 5.79%, n = 10, unpaired Student’s t-test *p<0.05). (D) Representative images show dendrites of P26 Tor1a+/Δgag and Tor1a+/+ mice. (E) Histogram representing dendritic spine density in P60 Tor1a+/Δgag and Tor1a+/+ mice (Tor1a+/+, 9.94 ± 0.41 spines/10 μm, n = 10; Tor1a+/ Δgag, 10.76 ± 0.50 spines/10 μm, n = 10; unpaired Student’s t-test p>0.05). (F,G) Histograms showing the quantification of dendritic spine size (F, spine length and head width) and dendritic spine type (G, mushroom, stubby, thin) in P60 Tor1a+/Δgag, compared to Tor1a+/+ mice (spine width Tor1a+/+, 0.600 ± 0.012 μm, n = 10; Tor1a+/Δgag, 0.602 ± 0.027 μm, n = 10; p>0.05; mushroom-type spines Tor1a+/+, 61.40 ± 4.81%, n = 10; Tor1a+/Δgag, 47.92 ± 3.67%, n = 10; *p<0.05; thin spines Tor1a+/+, 19.04 ± 3.85%, n = 10; Tor1a+/ Δgag, 34.64 ± 4.16%, n = 10; *p<0.05; unpaired Student’s t-test). (H) Representative images show dendrites of P60 Tor1a+/Δgag and Tor1a+/+ mice. Data were collected in a minimum of three different animals per genotype.
-
Figure 5—source data 1
Analysis of dendritic spines morphology in P26 Tor1a+/Δgag compared to age-matched Tor1a+/+ mice.
- https://doi.org/10.7554/eLife.33331.010
-
Figure 5—source data 2
Analysis of dendritic spines morphology in P60 Tor1a+/Δgag compared to age-matched Tor1a+/+ mice.
- https://doi.org/10.7554/eLife.33331.011
Figure 6
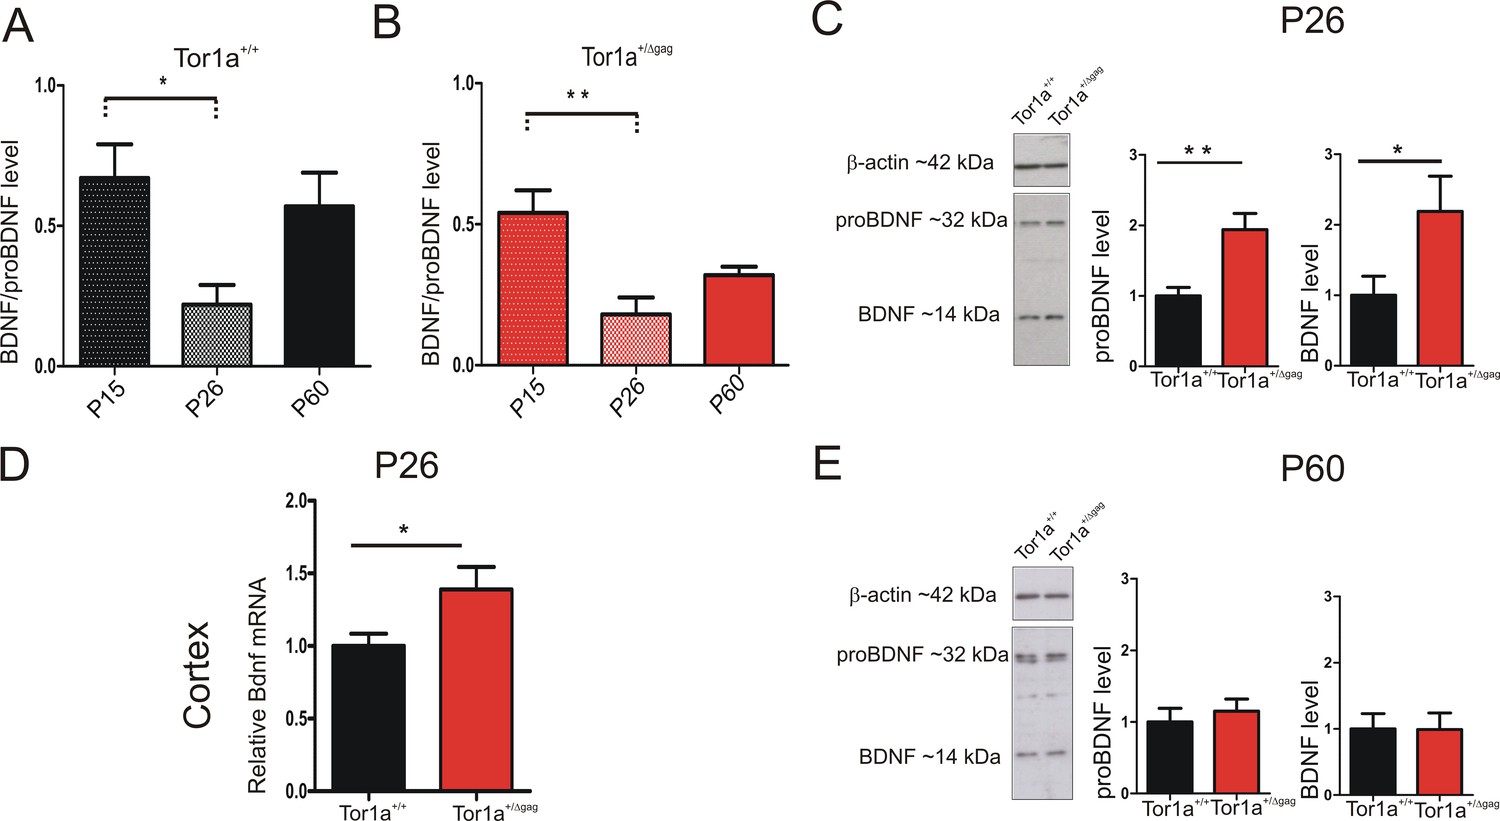
BDNF protein expression in the striatum of Tor1a+/+and Tor1a+/Δgag mice.
(A, B) Striatal BDNF protein expression in Tor1a+/+ and Tor1a+/Δgag mice at postnatal stages (P15, P26, P60). The graphs show the quantification of BDNF/proBDNF ratio at the various ages. Data are represented as mean ± SEM (Tor1a+/+ P15: 0.67 ± 0.12, N = 4; P26: 0.22 ± 0.08, N = 4; P60: 0.57 ± 0.14, N = 3; Tor1a+/Δgag P15: 0.54 ± 0.08, N = 4; P26: 0.18 ± 0.06, N = 4; P60: 0.32 ± 0.03, N = 4; one-way ANOVA, *p<0.05; **p<0.01). (C) (Left) Representative WB of proBDNF and BDNF protein levels relative to β-actin in striatal extracts (30 μg) derived from P26 Tor1a+/+ and Tor1a+/Δgag mice. (Right) The graphs show the quantitative analysis. The amount of proBDNF and BDNF was quantified relative to β-actin and normalized to wild-type mice. Data are represented as mean ± SEM (proBDNF Tor1a+/+ 1.00 ± 0.12, n = 10; Tor1a+/Δgag1.95 ± 0.29, n = 8; BDNF Tor1a+/+: 1.00 ± 0.28, n = 8, Tor1a+/Δgag2.19 ± 0.50, n = 8, Student’s t test: *p<0.05; **p<0.01). (D) Bdnf mRNA is upregulated in the cortex of Tor1a+/Δgag determined by qRT-PCR. The 2-ΔΔCt method was used to determine the relative expression, and all of the values are expressed relative to the levels of the wild-type mice as mean ± SEM (Tor1a+/+ 1.000 ± 0.084, n = 10; Tor1a+/Δgag1.399 ± 0.163, n = 8; Student’s t test: *p<0.05). (E) (Left) Representative Western blots of proBDNF and BDNF proteins relative to β-actin in striatal extracts (15 μg) derived from Tor1a+/+ and Tor1a+/Δgag adult mice. (Right) The graphs show the quantitative analysis. The amount of proBDNF and BDNF was quantified relative to β-actin and normalized to wild-type mice. Data are represented as mean ± SEM (proBDNF Tor1a+/+ 1.00 ± 0.19, n = 7, Tor1a+/Δgag1.15 ± 0.17, n = 7, p>0.05; BDNF Tor1a+/+: 1.00 ± 0.23 n = 7, Tor1a+/Δgag0.99 ± 0.25, n = 7, Student’s t test: p>0.05).
-
Figure 6—source data 1
BDNF protein expression in the striatum of Tor1a+/+ and Tor1a+/Δgag mice.
- https://doi.org/10.7554/eLife.33331.013
Figure 7
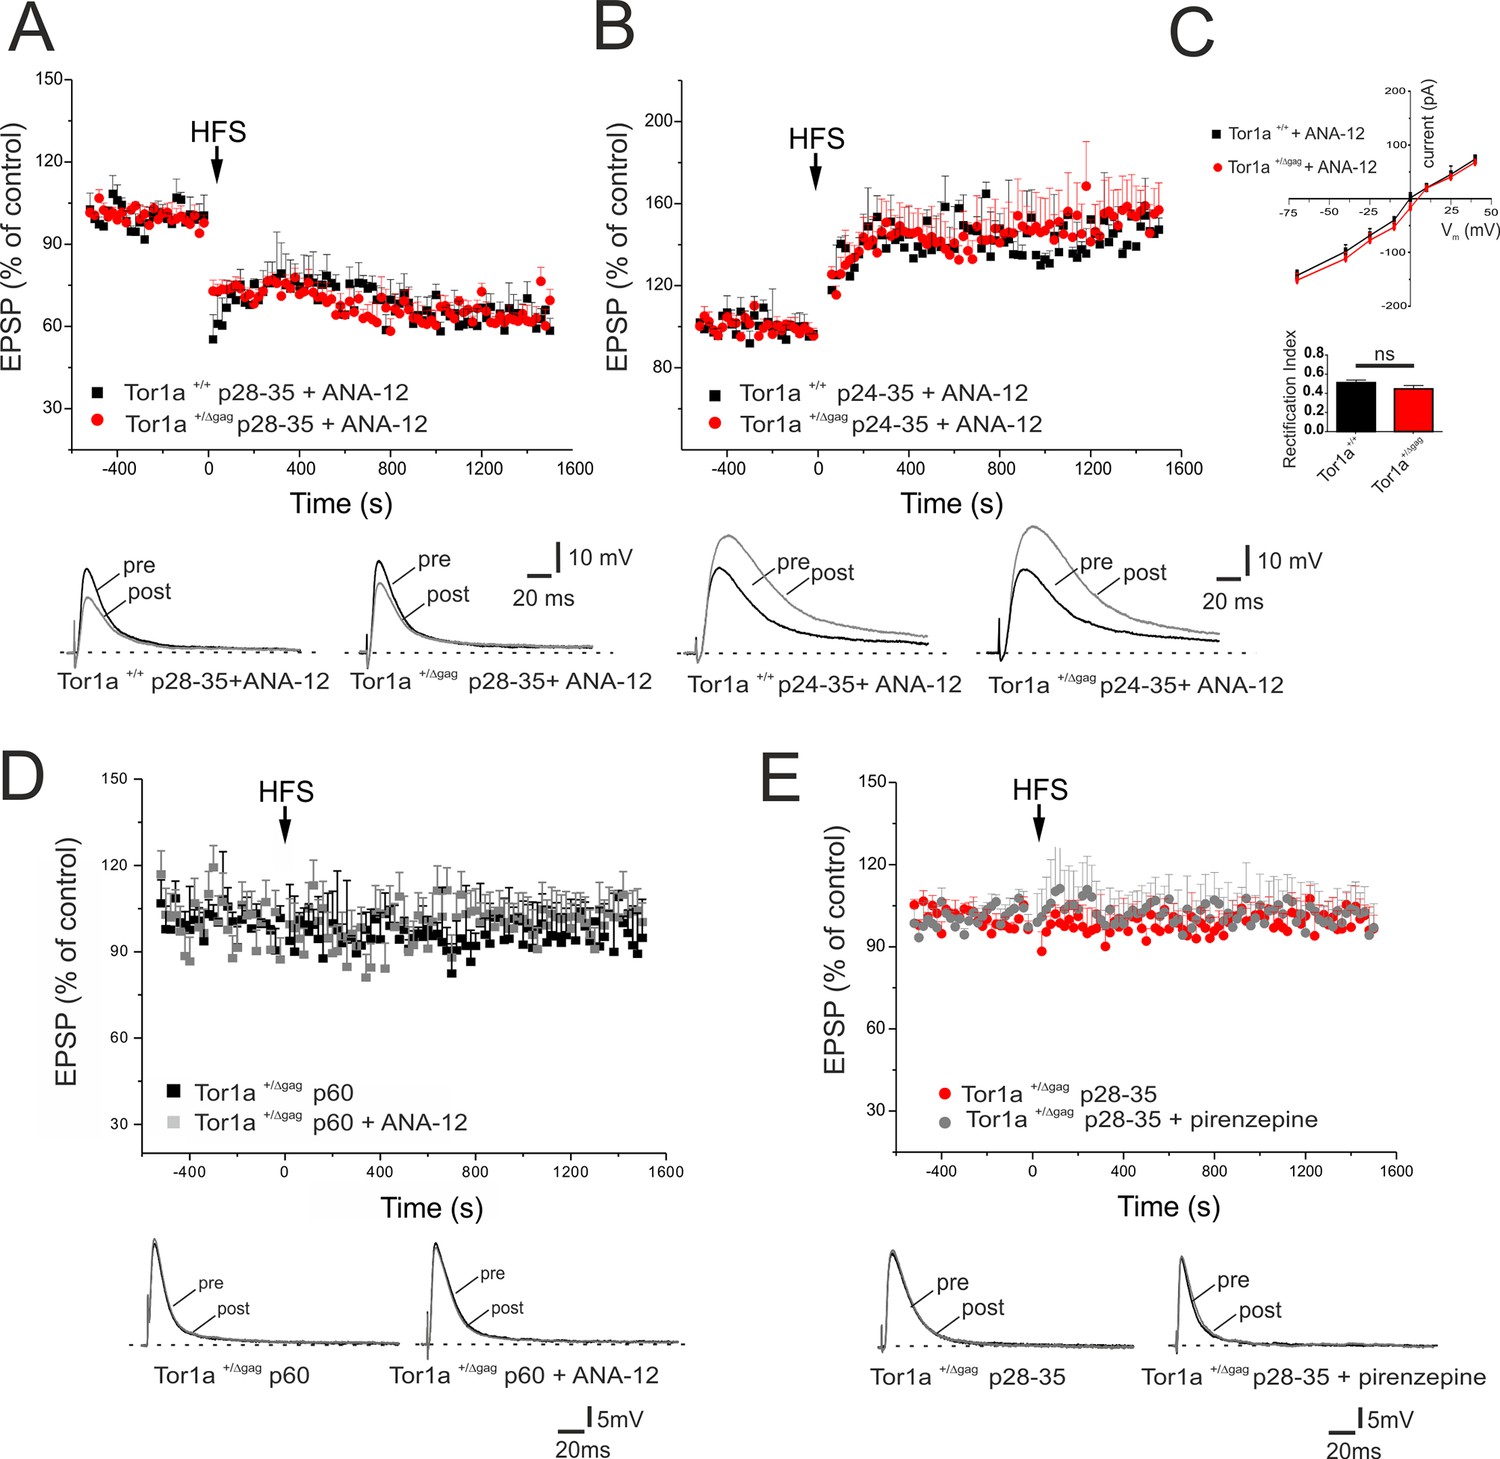
In vivo ANA-12 treatment rescues synaptic plasticity deficits in juvenile Tor1a+/Δgag mice.
(A) Time-course of corticostriatal LTD in juvenile Tor1a+/+ and Tor1a+/Δgag mice (P28-35): after in vivo treatment with the TrkB antagonist ANA-12, the HFS protocol (arrow) induces corticostriatal LTD expression in juvenile Tor1a+/Δgag mice (Tor1a+/+ P28-35, 65.31 ± 1.44% of control; N = 3, n = 12, p<0.05; Tor1a+/Δgag P28-35, 63.41 ± 4.39% of control; N = 3, n = 10; paired Student’s t test p<0.05). (Bottom) Representative EPSPs recorded before (pre) and 20 min after (post) HFS protocol. (B) Time-course of corticostriatal LTP after in vivo ANA-12 treatment: LTP displays a physiological amplitude in SPNs from in P24-35 Tor1a+/Δgag compared to wild-type littermates (Tor1a+/+ P24-35, 144.55 ± 2.67% of control; N = 3, n = 8; Tor1a+/Δgag P24-35, 148.11 ± 10.55% of control; N = 3, n = 9; Tor1a+/Δgag vs. Tor1a+/+ Student’s t test p>0.05). (Bottom) Sample traces recorded pre and post LTP induction. (C) AMPAR-mediated currents recorded from P26 SPNs at HP from −70 mV to + 40 mV after in vivo treatment of Tor1a+/+ and Tor1a+/Δgag mice with ANA-12. The treatment normalizes the current-voltage relationship in Tor1a+/Δgag neurons (HP=−70 mV: 2-way ANOVA p>0.05) and the rectification index (Tor1a+/+, 0.51 ± 0.03, N = 3, n = 3; Tor1a+/Δgag, 0.45 ± 0.04, N = 3, n = 5; Student’s t test p>0.05) (D) In vivo treatment with ANA-12 does not restore corticostriatal LTD in adult (P60) SPNs recorded from Tor1a+/Δgag mice (vehicle: 95.66 ± 9.09% of control, N = 3, n = 8; ANA-12: 98.75 ± 11% of control, N = 3, n = 4; paired Student’s t test p>0.05). (E) Slice pre-treatment with pirenzepine (100 nM) does not rescue LTD expression in P28-35 Tor1a+/Δgag SPNs (vehicle: 101.54 ± 1.07% of control, N = 3, n = 3; pirenzepine: 100.34 ± 8.96% of control; N = 3, n = 3; paired Student’s t test p>0.05). (Bottom) Superimposed traces of EPSPs recorded pre and 20 min post HFS delivery.
-
Figure 7—source data 1
In vivo ANA-12 treatment rescues synaptic plasticity deficits in juvenile Tor1a+/Δgag mice.
- https://doi.org/10.7554/eLife.33331.015
Tables
Key resources table
| Reagent type (species) or resource | Designation | Source or reference | Identifiers | Additional information |
|---|---|---|---|---|
| Gene (Mus musculus) | Tor1a | MGI:1353568 | Gene ID: 30931 | official full name: torsin family 1, member A (torsin A) |
| Strain, strain background (M. musculus) | C57BL/6J mice | Charles River | catalog number B6JSIFE10SZ - C57BL/6J SPF/VAF; RRID:IMSR_JAX:000664 | |
| Genetic reagent (M. musculus) | heterozygous knock-in Tor1a+/Δgag | Goodchild et al. (2005) | - | maintained on the C57BL/6J background |
| Antibody | monoclonal anti-PSD-95 | Neuromab | clone (k28/43) - catalog number 75–028; RRID:AB_2292909 | dilution 1:2000 in I-Block |
| Antibody | monoclonal anti-GluN2B | Neuromab | clone 59/20 - catalog number 75–097; RRID:AB_10673405 | dilution 1:1000 in I-Block |
| Antibody | polyclonal anti-GluA1 | Merck Millipore | catalog number AB1504; RRID:AB_2113602 | dilution 1:1000 in I-Block |
| Antibody | polyclonal anti-phospho-GluA1 (Ser845) | Merck Millipore | catalog number 04–1073; RRID:AB_1977219 | dilution 1:1000 in I-Block |
| Antibody | polyclonal anti-GluN2A | Sigma-Aldrich | catalog number M264 RRID:AB_260485 | dilution 1:1000 in I-Block |
| Antibody | monoclonal anti-GluA2 | Neuromab | clone L21/32 - catalog number 75–002; RRID:AB_2232661 | dilution 1:1000 in I-Block |
| Antibody | monoclonal anti-α-tubulin | Sigma-Aldrich | clone DM1A - catalog number T9026; RRID:AB_477593 | dilution 1:5000 in I-Block |
| Antibody | goat anti-DARPP-32 | R and D system | catalog number AF6259; RRID:AB_10641854 | dilution 1:500 in I-Block |
| Antibody | mouse anti-Enkephalin | Millipore | catalog number MAB350; RRID:AB_2268028 | dilution 1:1000 in I-Block |
| Antibody | mouse anti-β-actin | Sigma Aldrich | catalog number A5441; RRID:AB_476744 | dilution 1:20000 in I-Block |
| Commercial assay or kit | Clarity Western ECL Substrate | BioRad | - | reagent used to visualize protein bands with Chemidoc Imaging System |
| Commercial assay or kit | ECL reagent | GEHealthcare | catalog number GERPN2232 | reagent used to visualize protein bands with membranes were exposed to film |
| Commercial assay or kit | TRI-reagent | Sigma Aldrich | catalog number T9424 | reagent used to RNA extraction |
| Commercial assay or kit | DNAase I | Invitrogen | catalog number AMPD1-1KT | reagent used for elimination of DNA from RNA |
| Commercial assay or kit | Transcriptor First Strand cDNA Synthesis Kit | Roche | catalog number04379012001 | reagent used to reverse transcribe RNA |
| Commercial assay or kit | Extract-N-Amp™ Tissue PCR Kit | SIGMA | catalog number XNAT2 | genotyping primers UP- AGT CTG TGG CTG GCT CTC C; Low- CCT CAG GCTGCT CAC AAC C |
| Chemical compound, drug | ANA-12 | Sigma-Aldrich | catalog number SML0209 | in vivo administration |
| Chemical compound, drug | CNQX disodium salt | Tocris | catalog number 0190/10 | application in bath during electrophysiology analysis |
| Chemical compound, drug | (+)-MK 801 maleate | Tocris | catalog number 0924/10 | application in bath during electrophysiology analysis |
| Chemical compound, drug | Tetrodotoxin citrate (TTX) | Tocris | catalog number 1069/1 | application in bath during electrophysiology analysis |
| Chemical compound, drug | Picrotoxin | Tocris | catalog number 1128/1 | application in bath during electrophysiology analysis |
| Chemical compound, drug | Biocytin | Tocris | catalog number 3349/10 | electrodes filled with biocytin, versatile marker used for neuroanatomical investigations of neuron IHC |
| Chemical compound, drug | Naspm trihydrochloride | Tocris | catalog number 2766/10 | application in bath during electrophysiology analysis |
| Software, algorithm | ImageLab | BioRad | - | software used for quantification of protein bands in western blotting experiments |
| Software, algorithm | ImageJ software | NIH;Schneider et al. (2012) | RRID:SCR_003070 | software used for the quantification of protein bands in western blotting and confocal laser scanning microscope |
| Software, algorithm | ClampFit 9 | pClamp | Molecular Devices; RRID:SCR_011323 | data analysis |
| Software, algorithm | Origin 8.0 | Microcal | RRID:SCR_002815 | data analysis |
| Software, algorithm | Prism 5.3 | GraphPad | RRID:SCR_002798 | data analysis |
Additional files
-
Transparent reporting form
- https://doi.org/10.7554/eLife.33331.016
Download links
A two-part list of links to download the article, or parts of the article, in various formats.
Downloads (link to download the article as PDF)
Open citations (links to open the citations from this article in various online reference manager services)
Cite this article (links to download the citations from this article in formats compatible with various reference manager tools)
Early structural and functional plasticity alterations in a susceptibility period of DYT1 dystonia mouse striatum
eLife 7:e33331.
https://doi.org/10.7554/eLife.33331


