Zfp281 is essential for mouse epiblast maturation through transcriptional and epigenetic control of Nodal signaling
- Icahn School of Medicine at Mount Sinai, United States
- Memorial Sloan Kettering Cancer Center, United States
- College of Veterinary Medicine, Northwest A&F University, China
- Centro de Investigacion en Medicina Molecular e Enfermidades Cronicas, Universidade de Santiago de Compostela, Spain
Figures
Figure 1 with 3 supplements
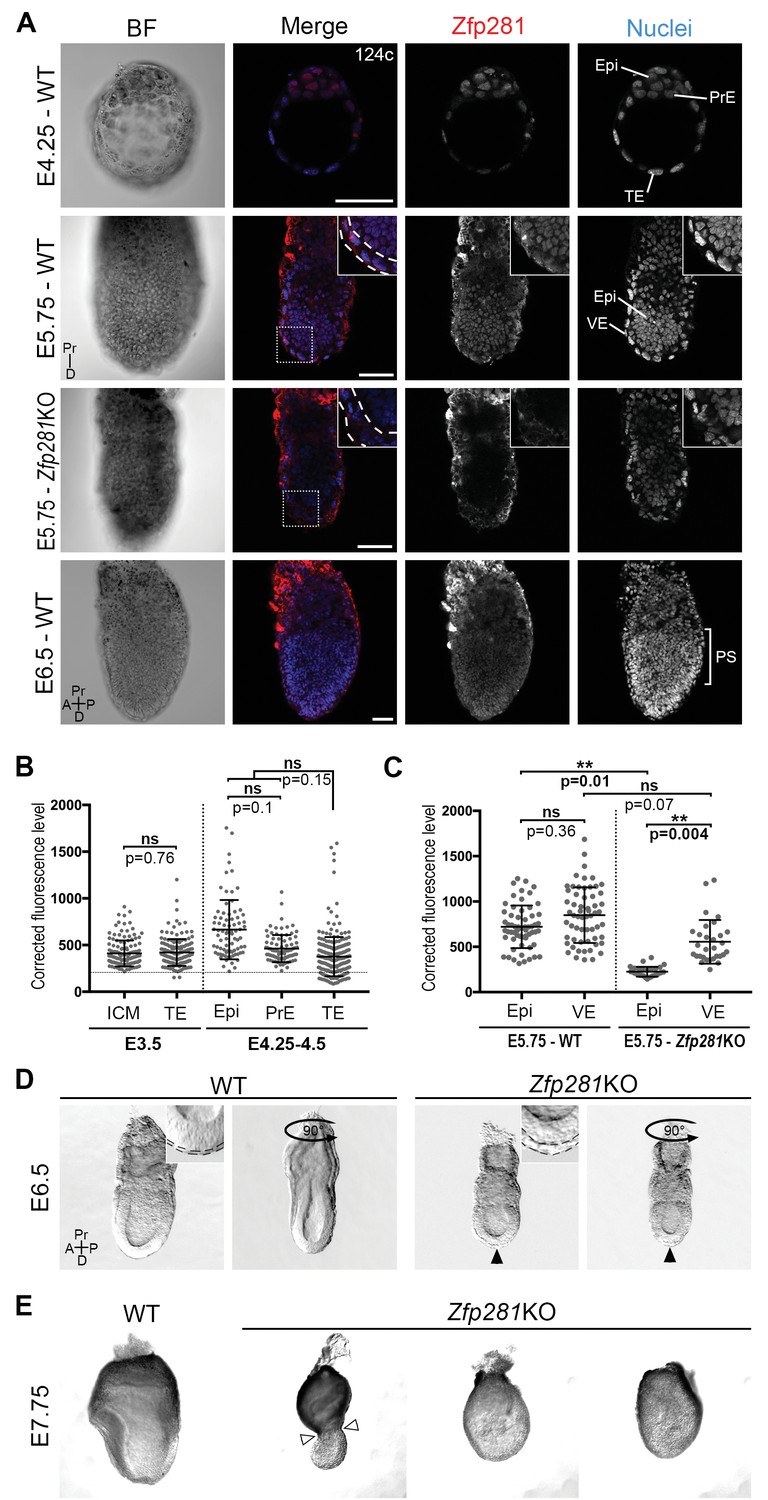
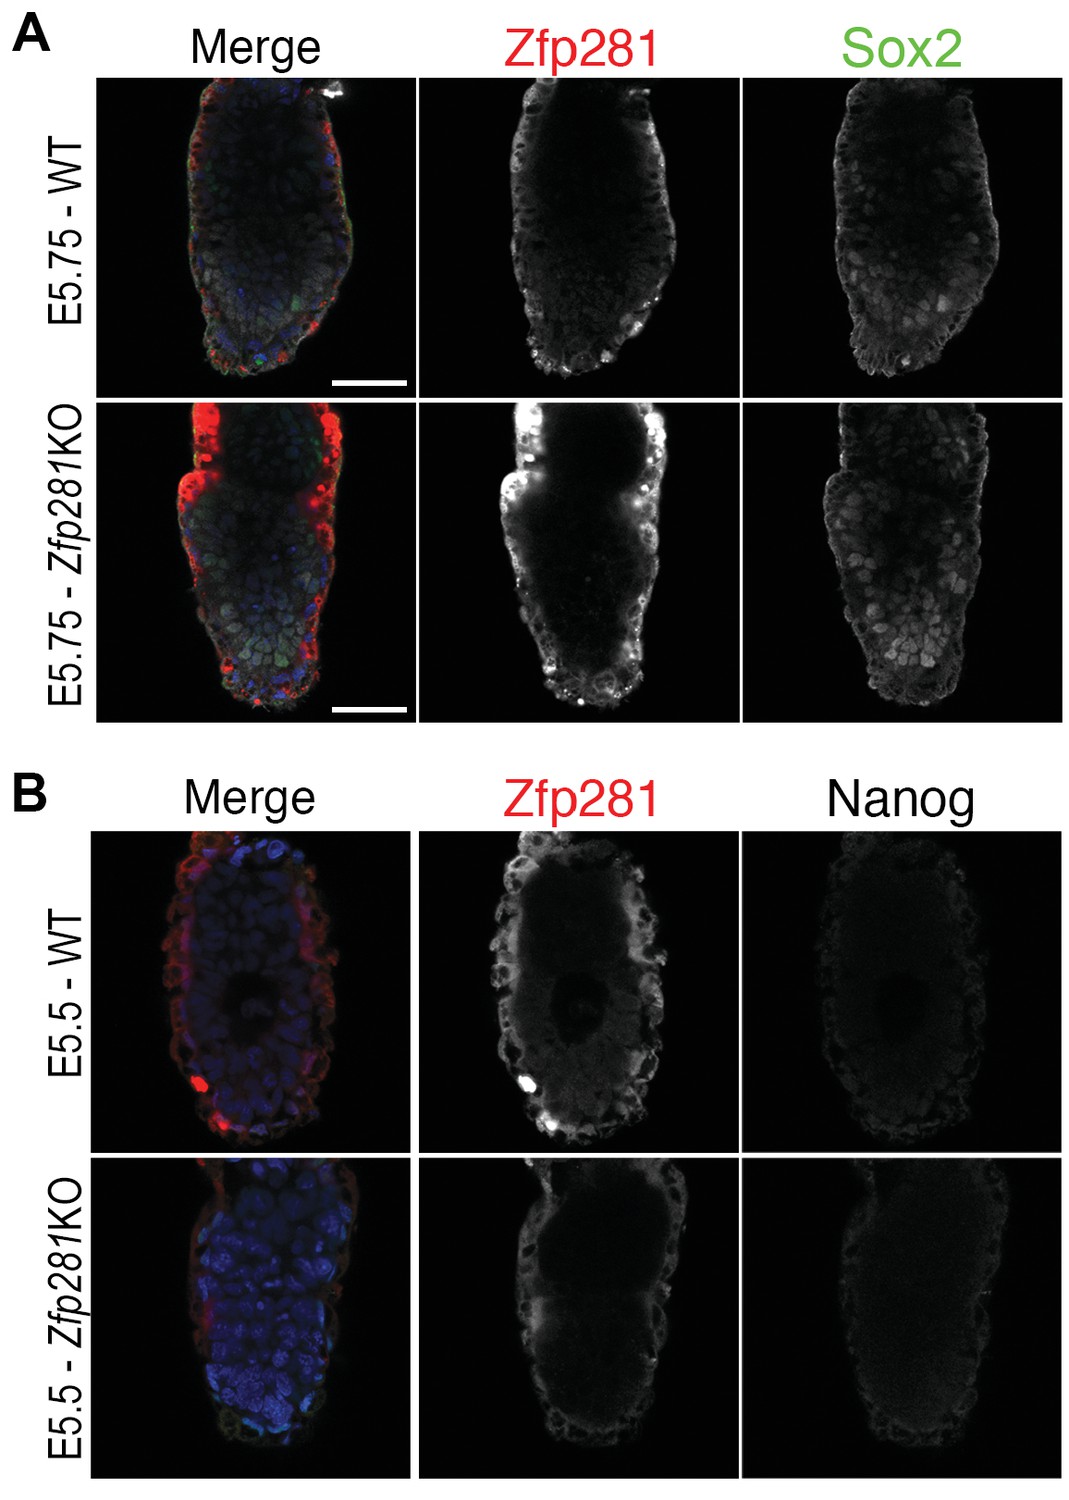
Zfp281 is expressed in the pluripotent epiblast and is required for early post-implantation embryo development.
(A) Single optical sections depicting Zfp281 protein expression in pre- and post-implantation. At pre-implantation, nuclear-localized Zfp281 protein is observed in epiblast (Epi), primitive endoderm (PrE) and trophectoderm (TE) cells, as quantified in (B). Zfp281 expression is specific to epiblast at post-implantation (E5.75), quantified in (B). Immunohistochemistry of Zfp281KO embryo at E5.75 shows that the protein is not expressed, confirming the mutant as a protein null. It also reveals VE-specific background. High-magnification insets (top-right) show protein distribution in regions highlighted, white dashed lines delimit the VE layer. At onset of gastrulation (E6.5), Zfp281 is expressed in all epiblast-derived cells. (B) Quantification of nuclear levels of Zfp281 using MINS software at mid- (E3.5) and late (E4.25–4.5) blastocyst stage, revealing protein expression in all three cell types. n = 5 embryos (308 cells) for mid-blastocyst stage and three embryos (448 cells) for late blastocyst stage. See Figure 1—figure supplement 1 for immunohistochemistry of additional stages. (C) Quantification of nuclear levels of Zfp281 in VE and Epi cells in WT and Zfp281KO embryos at E5.75 using Imaris software. n = 6 embryos for the WT (20 cells per genotype) and n = 3 embryos for Zfp281KO. The expression of Zfp281 in the VE was ruled out through quantitative fluorescence level comparisons of wild-type (WT) and Zfp281KO embryos, which lack Zfp281 protein. (D) At E6.5, the A-P axis is established and WT embryos initiate gastrulation at their posterior, while Zfp281KO embryos display a thickened visceral endoderm epithelium (black arrowhead) and no A-P polarity. Insets (top-right) depict thickened VE layer (delineated by black dashed lines) in Zfp281KO embryo compared to the WT. (E) Zfp281KO embryos die around E8.0 and exhibit aberrant gross morphology at E7.75 when compared to WT with either cells of the epiblast layer undergoing apoptosis and/or constriction at the embryonic/extra-embryonic junction (white arrowheads). A = Anterior, p=Posterior, Pr = proximal, D = Distal, BF = brightfield, Scale bars represent 50 µm. Statistical significance was calculated on the average level of corrected fluorescence per embryo using Student T-test.
Figure 1—figure supplement 1
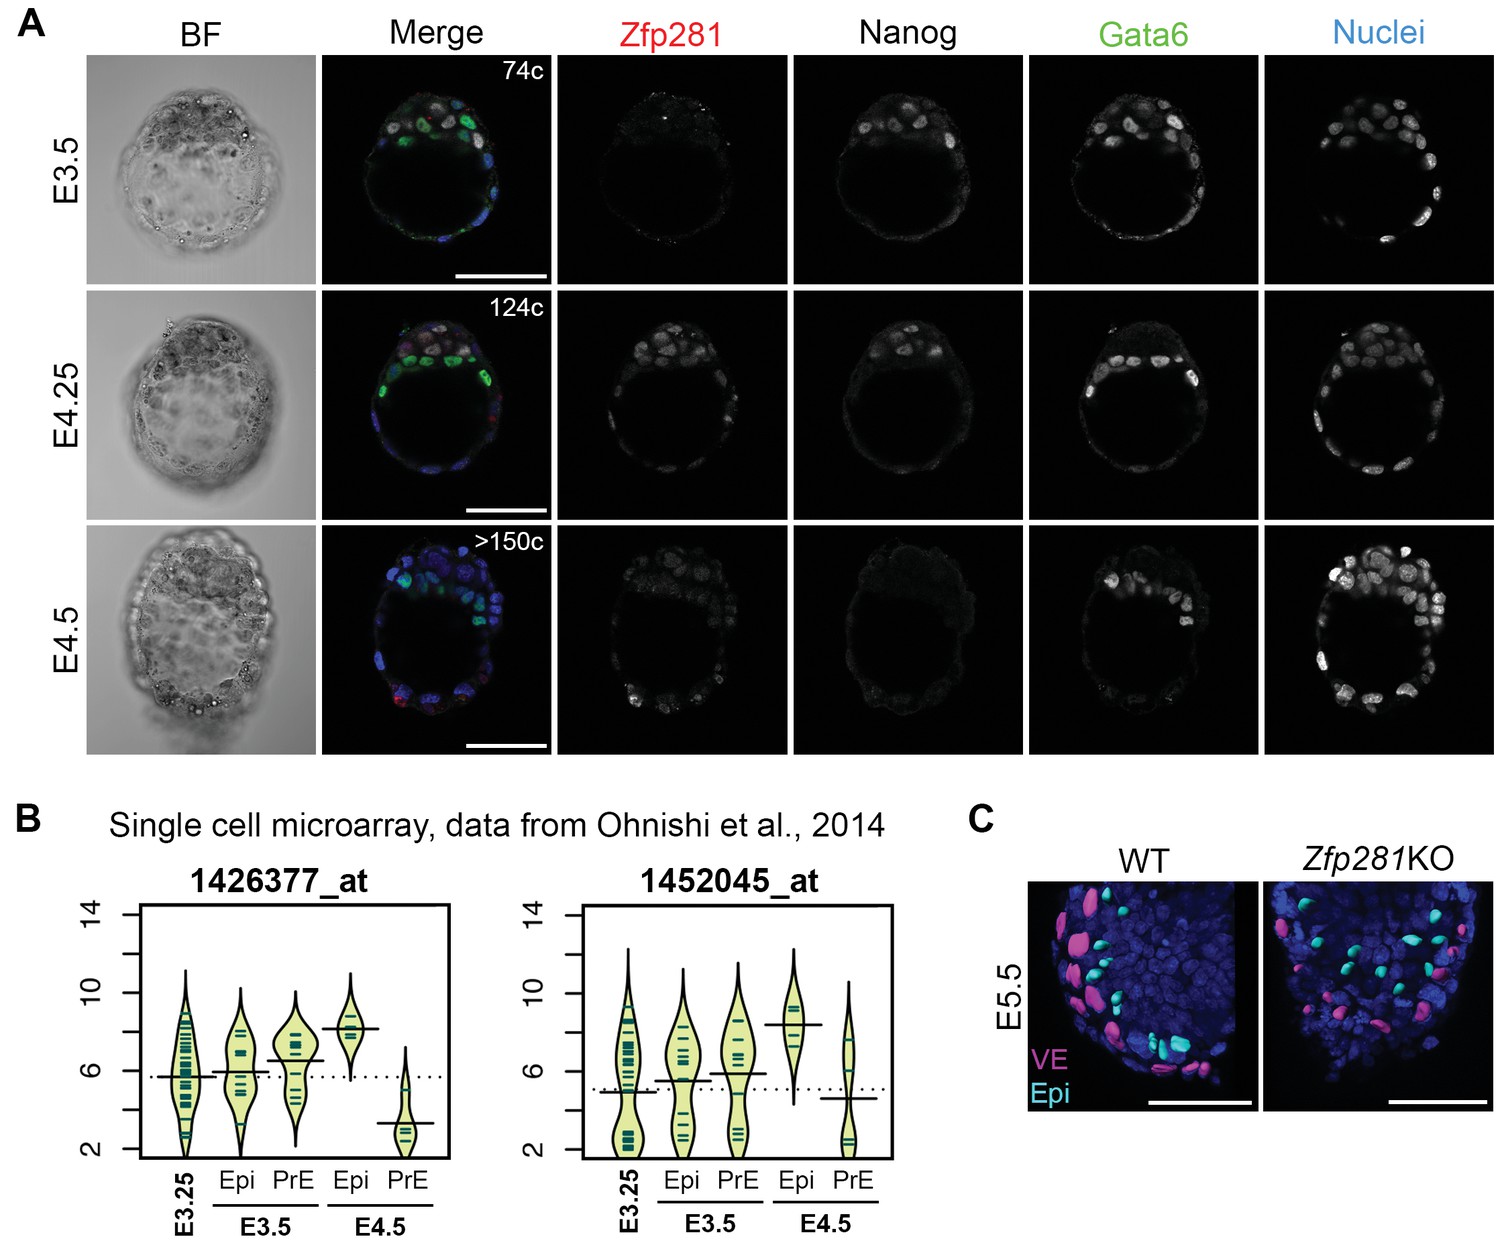
Expression and function of Zfp281 in early post-implantation embryo development.
(A) Expression of Zfp281 protein in pre-implantation stage mouse embryos. Zfp281 is detected at the mid-blastocyst stage when epiblast and primitive endoderm precursors exhibit a ‘salt-and-pepper’ distribution (E3.5) and at the late blastocyst stage (E4.25) when the pluripotent epiblast (Nanog positive cells) and the PrE cells (Gata6 positive cells) have sorted to two adjacent layers. Just before implantation (E4.5), when Nanog has become downregulated, Zfp281 is still expressed in both epiblast and PrE cells. (B) Violin plots of single cell mRNA expression of Zfp281 using two different probes from early blastocyst stage (E3.25) to late blastocyst stage (E4.5). Data are from (Ohnishi et al., 2014). (C) Example of 3D rendering of nuclei of WT and Zfp281KO E5.5 embryos used to quantify Zfp281 nuclear level in VE (magenta) and epiblast (cyan) cells using Imaris software.
Figure 1—figure supplement 2
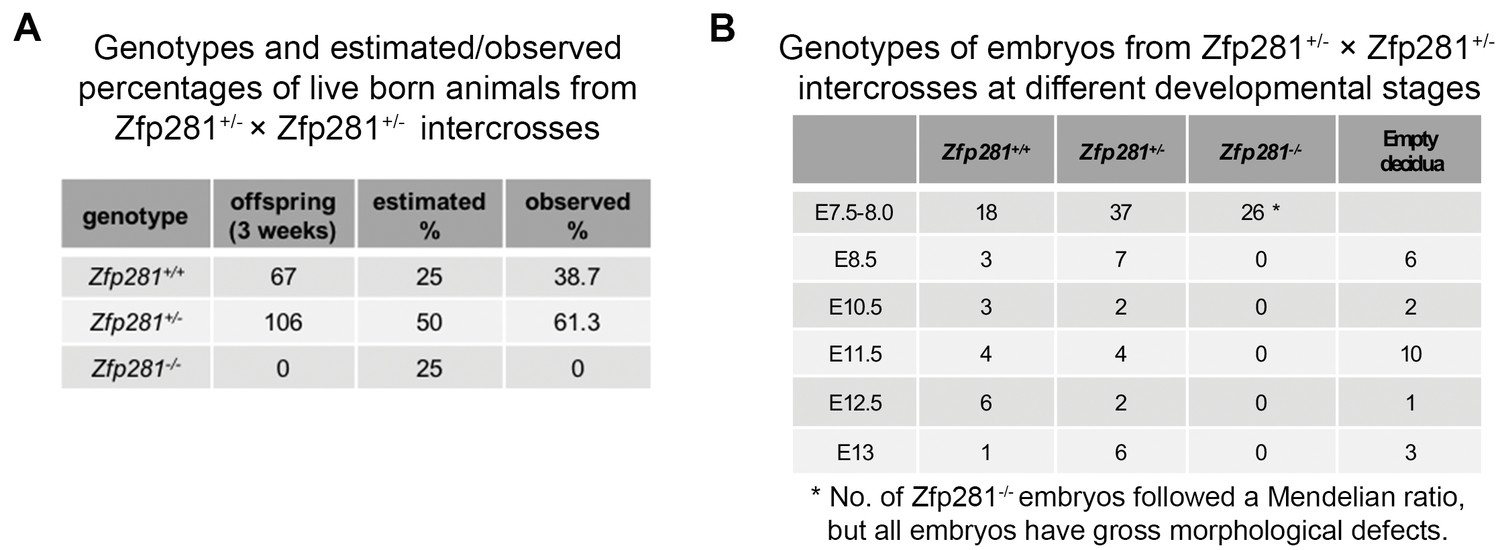
Summary of embryos recovered from intercrosses of heterozygous mice.
(A) Genotypes and estimated (Mendelian)/observed percentages of live born pups from intercrosses of Zfp281+/- × Zfp281 ± mice. (B) Genotypes of embryos from intercrosses of Zfp281+/- × Zfp281 ± mice at different developmental stages.
Figure 1—figure supplement 3
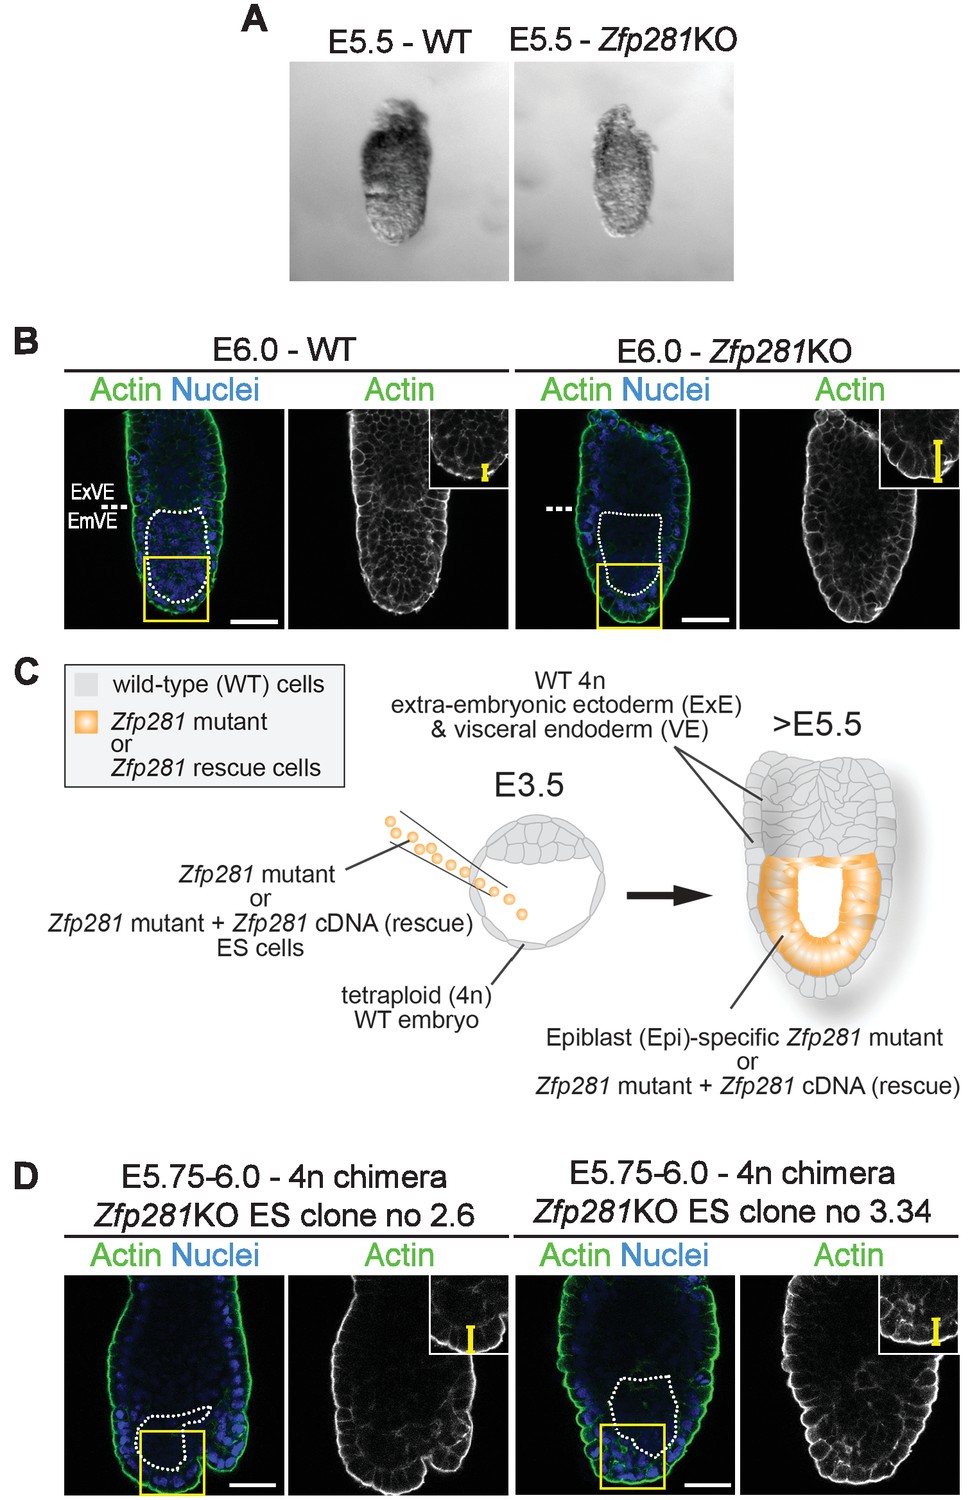
Zfp281KO phenotype at early post-implantation stages.
(A) Zfp281KO embryos cannot be distinguished from their WT littermates at early post-implantation stages (E5.5). (B) F-actin staining of Zfp281KO and WT embryos revealing thickening of the VE layer in the mutant (yellow bracket in the upper right corner insets indicates the height of the VE epithelium, dashed white line show the limit between extra-embryonic and embryonic parts of the embryo, dotted white line delimits the epiblast). EmVE = embryonic VE, ExVE = extraembryonic VE, scale bars represent 50 µm. (C) Schematic representation of tetraploid (4 n) chimera generation. (D) F-actin staining of tetraploid chimera generated with two independent ESC clones (no 3.34 and no 2.6) revealing thickening of the VE layer, similarly to Zfp281KO embryos (yellow bracket in the upper right corner insets indicates the height of the VE epithelium, dotted white line delimits the epiblast).
Figure 2 with 2 supplements
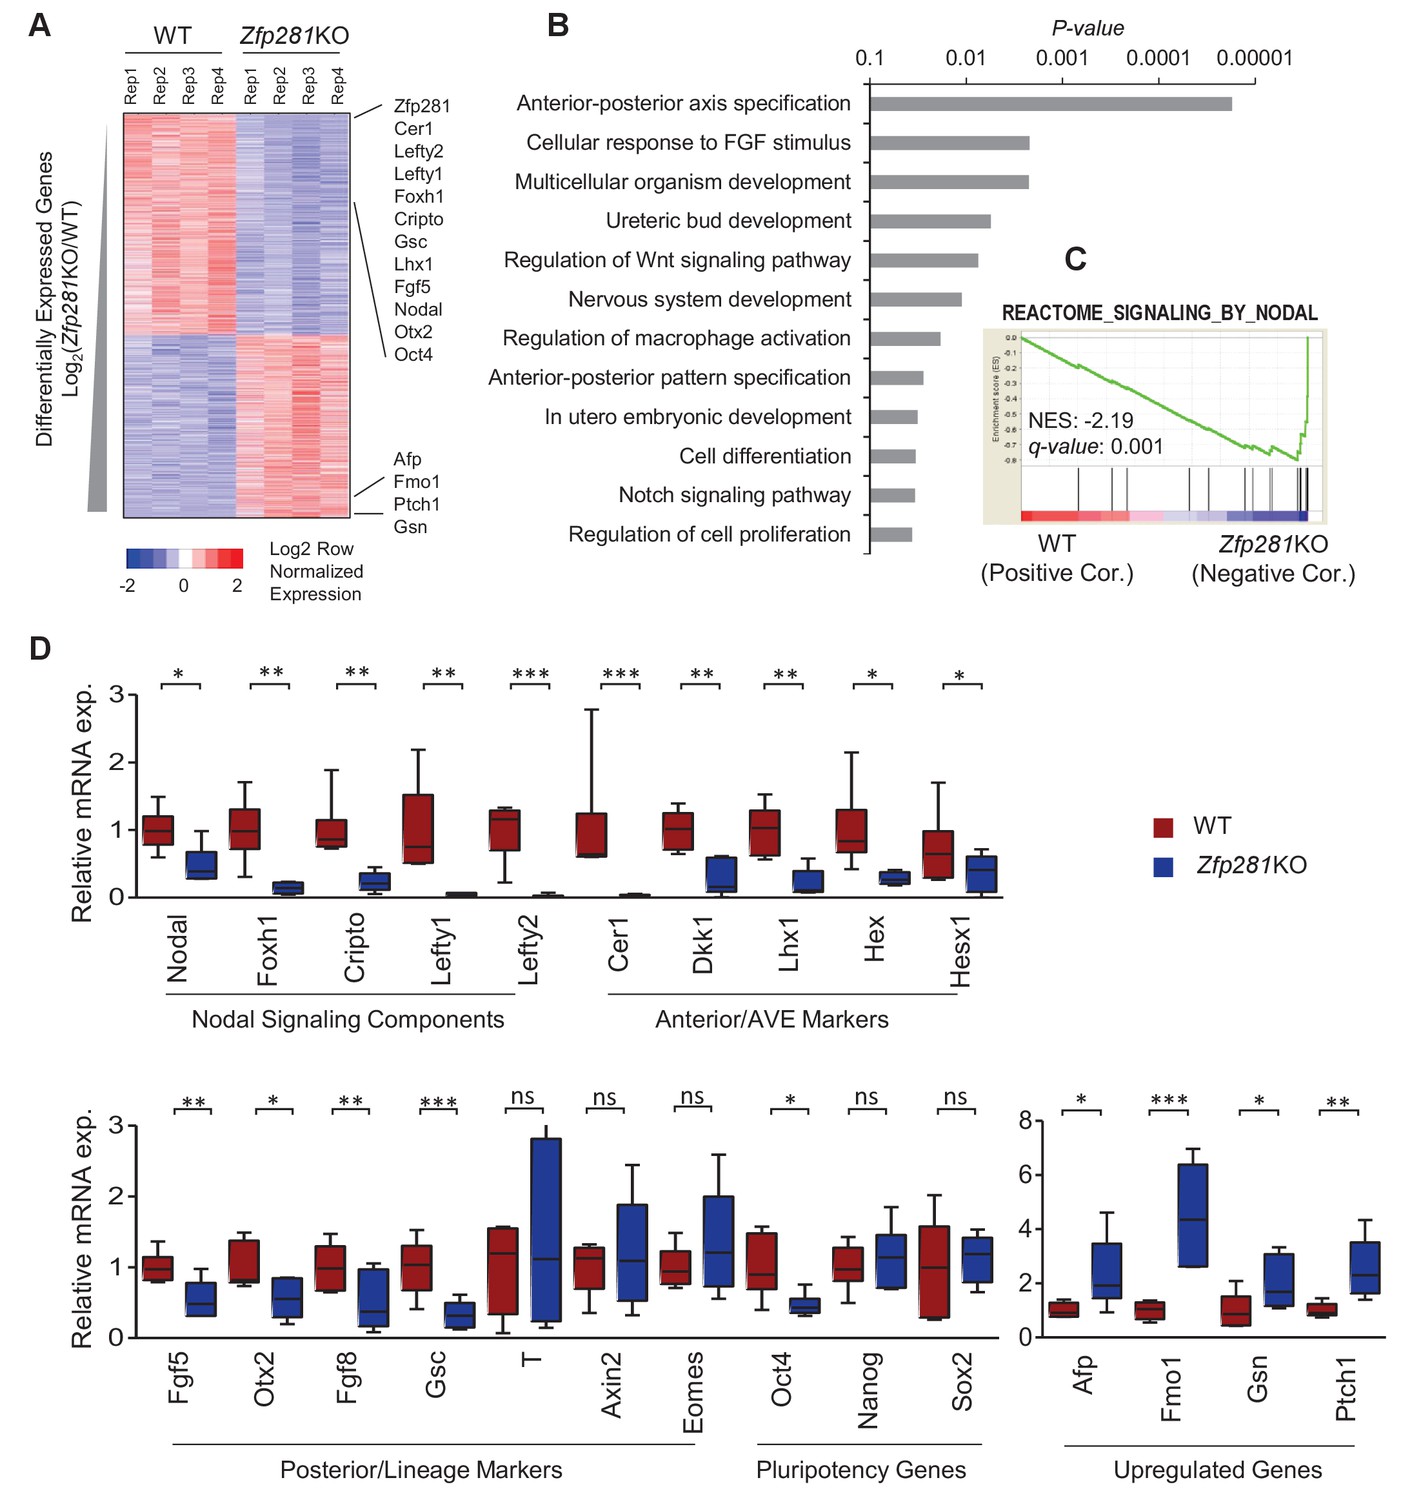
Zfp281KO embryos exhibit defects in Nodal signaling and expression of genes associated with anterior-posterior patterning.
(A) Heatmap of genes differentially regulated between WT and Zfp281KO embryos (E6.5). (B) Gene ontology (GO) analysis for significant downregulated genes (fold-change <4, p-value<0.05) in Zfp281KO embryos. (C) Gene set enrichment analysis (GSEA) shows Nodal signaling as top pathway in downregulated genes in Zfp281KO embryos. (D) RT-qPCR for expression of genes at E6.5. For each genotype, n = 6 embryos. mRNA levels of WT embryos were normalized to 1. Student T-test was used examine statistical significance: ns = non significant, *p<0.05, **p<0.01, ***p<0.001. RT-qPCR primer sequences are provided in Figure 2—source data 2.
-
Figure 2—source data 1
RPKM values of significantly up- and down-regulated genes in WT and Zpf281KO embryos RNA-seq data.
- https://doi.org/10.7554/eLife.33333.009
-
Figure 2—source data 2
RT-qPCR primer sequences.
- https://doi.org/10.7554/eLife.33333.010
Figure 2—figure supplement 1

Images of E6.5 WT and Zpf281KO embryos used for RNA-seq analysis.
For each genotype, n = 4 embryos.
Figure 2—figure supplement 2
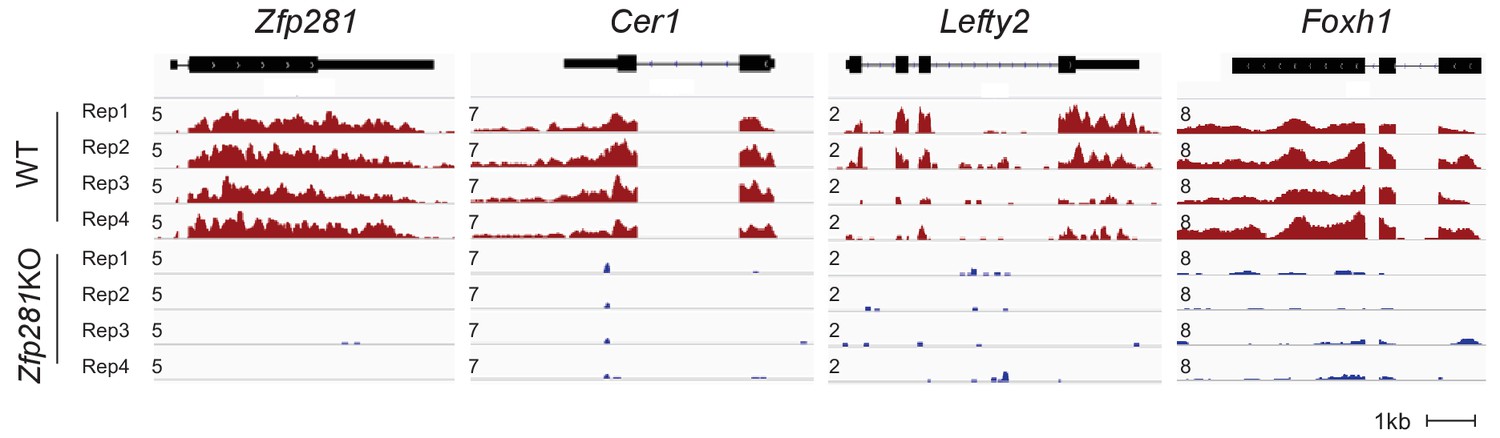
RNA-seq tracks of Zfp281 and Nodal signaling components.
RNA-seq tracks of Zfp281 and components of Nodal signaling (Cer1, Lefty2, and Foxh1) in WT and Zfp281KO embryos. Intensities from different embryos are shown as mapped reads per million total mapped reads (RPM).
Figure 3 with 3 supplements
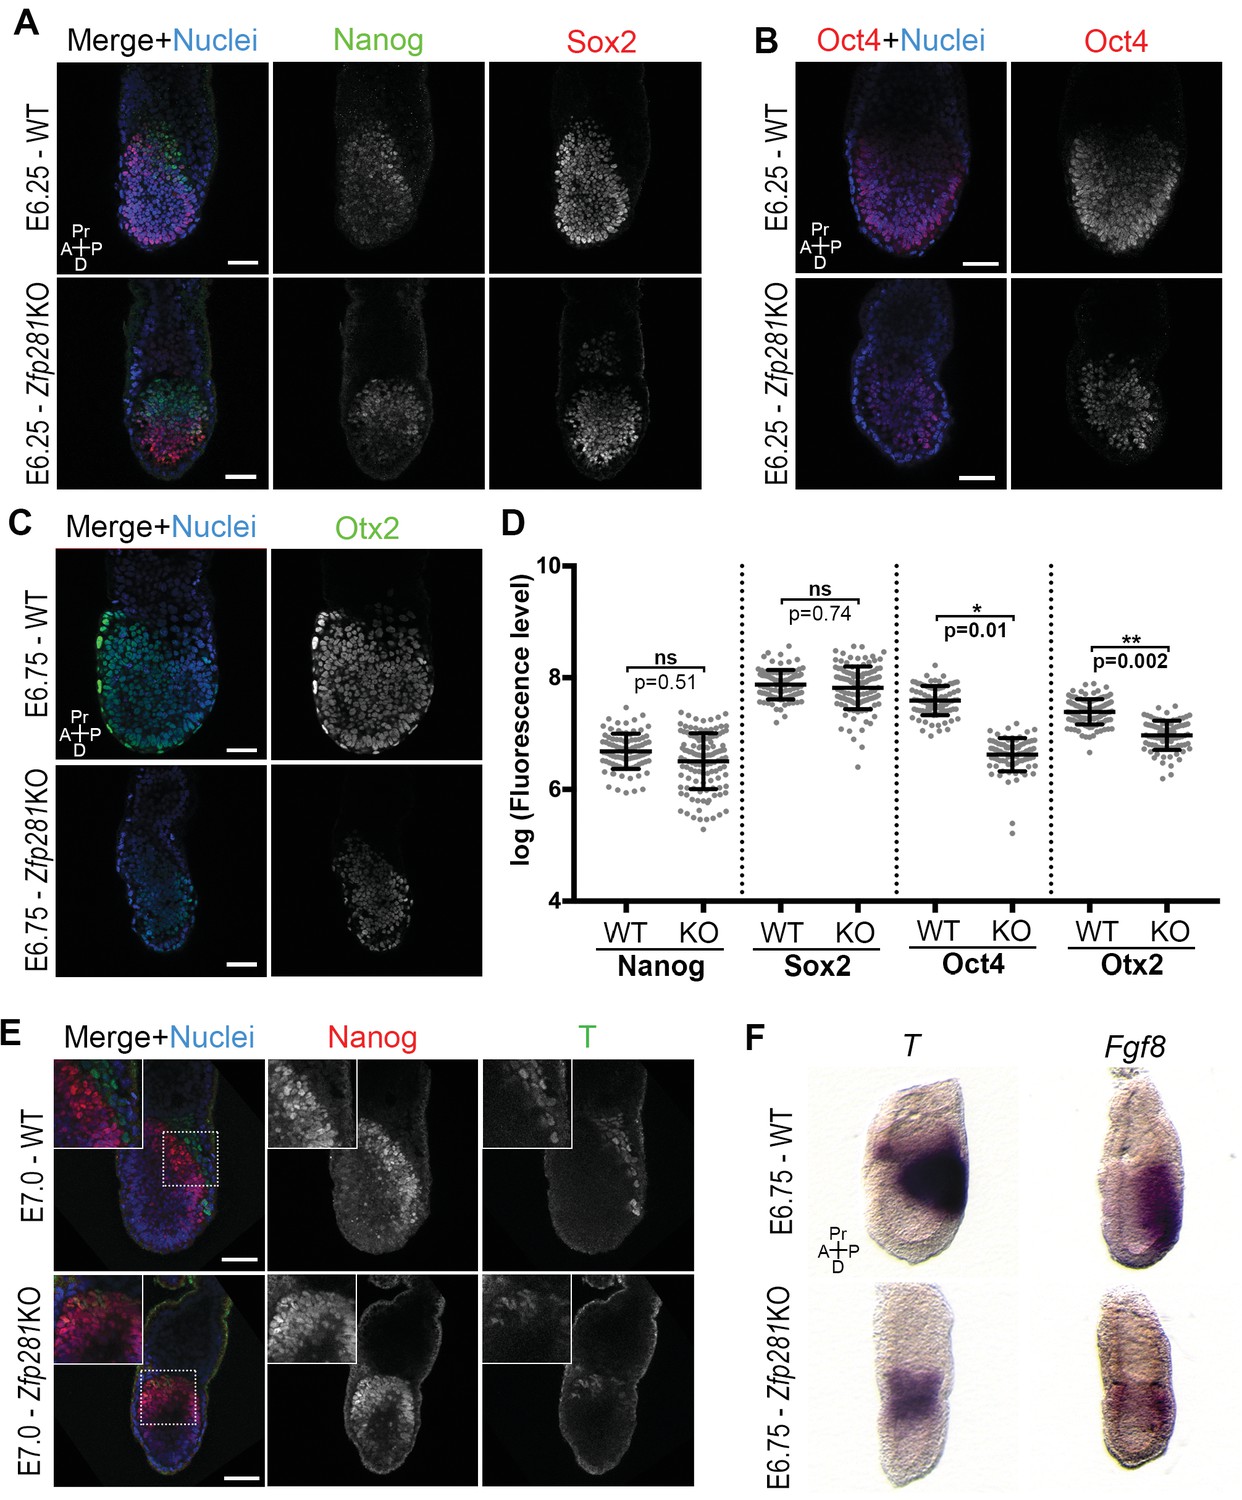
Zfp281 regulates pluripotency-associated factors and Otx2.
(A) Immunostaining of Nanog and Sox2 in WT and Zfp281KO embryos (E6.25). (B) Immunostaining of Oct4 in WT and Zfp281KO embryos (E6.25). (C) Immunostaining of Otx2 in WT and Zfp281KO embryos (E6.75). (D) Fluorescent intensity quantification of Nanog, Sox2, Oct4 and Otx2 proteins (each dot representing the mean corrected fluorescence level per epiblast cell) using Imaris software. For each genotype, n = 3 embryos (30 cells quantified per embryo). Statistical significance was calculated on the average level of corrected fluorescence per embryo using Student T-test. (E) Immunohistochemistry of pluripotency factor Nanog which is localized to posterior epiblast in WT embryos, and the primitive streak marker T, exhibit radialized expression in mutant compared to WT (E7.0). Additionally, in Zfp281KO, the mutually-exclusive pattern of Nanog and T observed in WT is lost and proteins colocalize in a subset of cells. High magnification insets (top-left) show distribution in regions highlighted. (F) WISH of E6.75 Zfp281KO and WT littermate embryos. Markers of the primitive streak T and Fgf8 are radialized in Zfp281KO embryos compared to WT. A = Anterior, p=Posterior, Pr = proximal, D = Distal, Scale bars represent 50 µm.
Figure 3—figure supplement 1
Sox2 and Nanog immunostaining in WT and Zfp281KO embryos.
(A) The pluripotency-associated factors Sox2 was expressed at normal levels in Zfp281KO embryos at E5.75. (B) Nanog was downregulated in both WT and Zfp281KO embryos at early post-implantation stage (E5.5). Scale bars represent 50 µm.
Figure 3—figure supplement 2

Expression of pluripotency markers in tetraploid chimera and early postimplantation WT and Zfp281KO embryos.
(A) Immunohistochemistry of pluripotency factors Oct4, Sox2, Nanog, Otx2 and Oct6 in tetraploid chimera where the epiblast contains Zfp281KO cells and VE cells are WT. Table summarizes the results for each stain of two independent ESC clones. Note that Nanog is not expressed at this stage. (B) Wholemount in situ hybridization (WISH) analysis of Otx2 reveals expression at the anterior of a WT embryo. In Zfp281KO embryos, Otx2 is expressed at the distal tip. A = Anterior, p=Posterior, Pr = Proximal, D = Distal. (C) Immunofluorescence of Otx2 and Oct6 proteins in WT and Zfp281KO embryos at early post-implantation stage (E5.5) and Fluorescent intensity quantification of Otx2 and Oct6 proteins nuclear levels (each dot representing the log-transformed mean corrected fluorescence level per epiblast cell) using Imaris software. For WT, n = 3 embryos and for Zfp281KO, n = 2 embryos (30 cells quantified per embryo). Statistical significance was calculated on the average level of corrected fluorescence per embryo using Student T-test. Scale bars represent 50 µm.
Figure 3—figure supplement 3
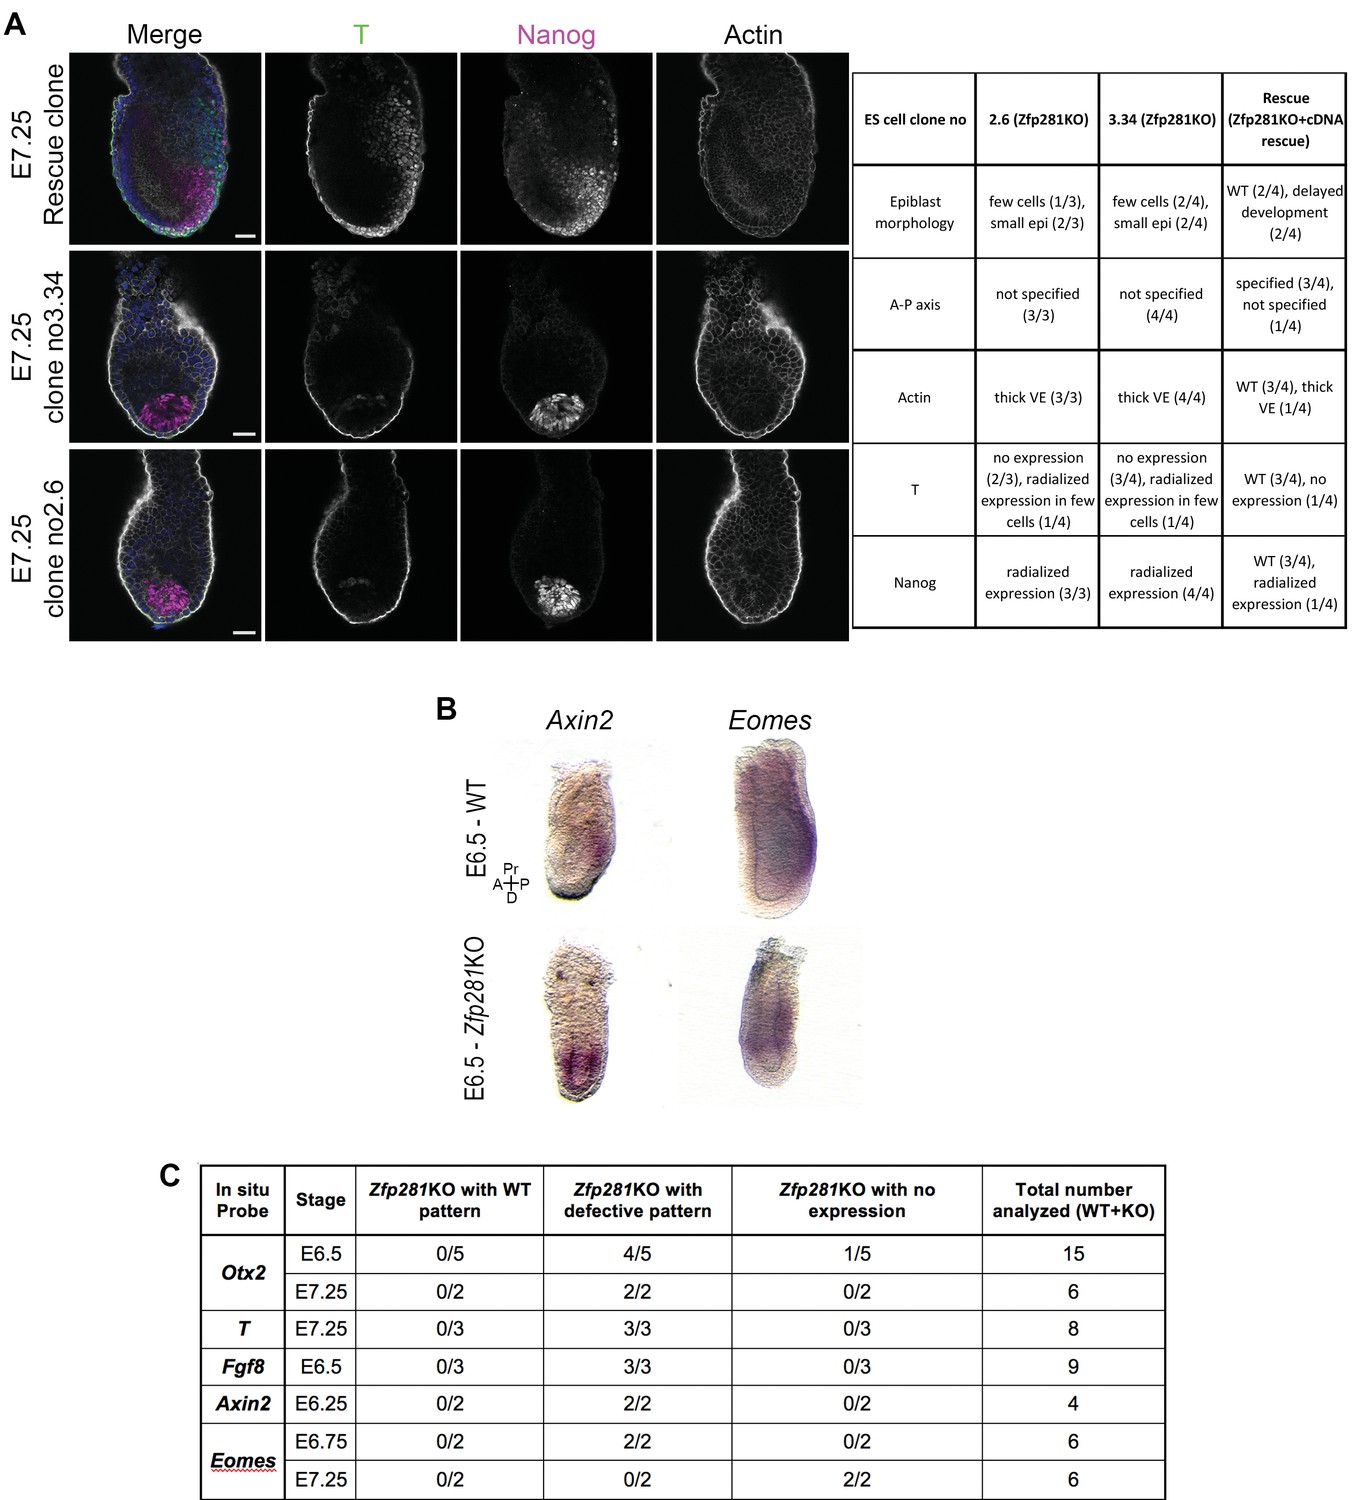
WISH analysis of Otx2, Axin2, and Eomes in WT and Zfp281KO embryos.
(A) Immunohistochemistry of pluripotency factor Nanog, the primitive streak marker T and Actin. Nanog and T exhibit radialized expression in tetraploid chimera containing Zfp281KO epiblast cells (similar to Zfp281KO embryos), whereas rescued chimera show a pattern similar to WT. (B) Wholemount in situ hybridization (WISH) analysis of Otx2 reveals expression at the anterior of a WT embryo. In Zfp281KO embryos, Otx2 is expressed at the distal tip. (C) Table recapitulating the markers and number of embryos analyzed by WISH. A = Anterior, p=Posterior, Pr = Proximal, D = Distal. Scale bars represent 50 µm.
Figure 4 with 2 supplements
Loss of Zfp281 affects pluripotent state progression and results in failure in anterior-posterior axis establishment.
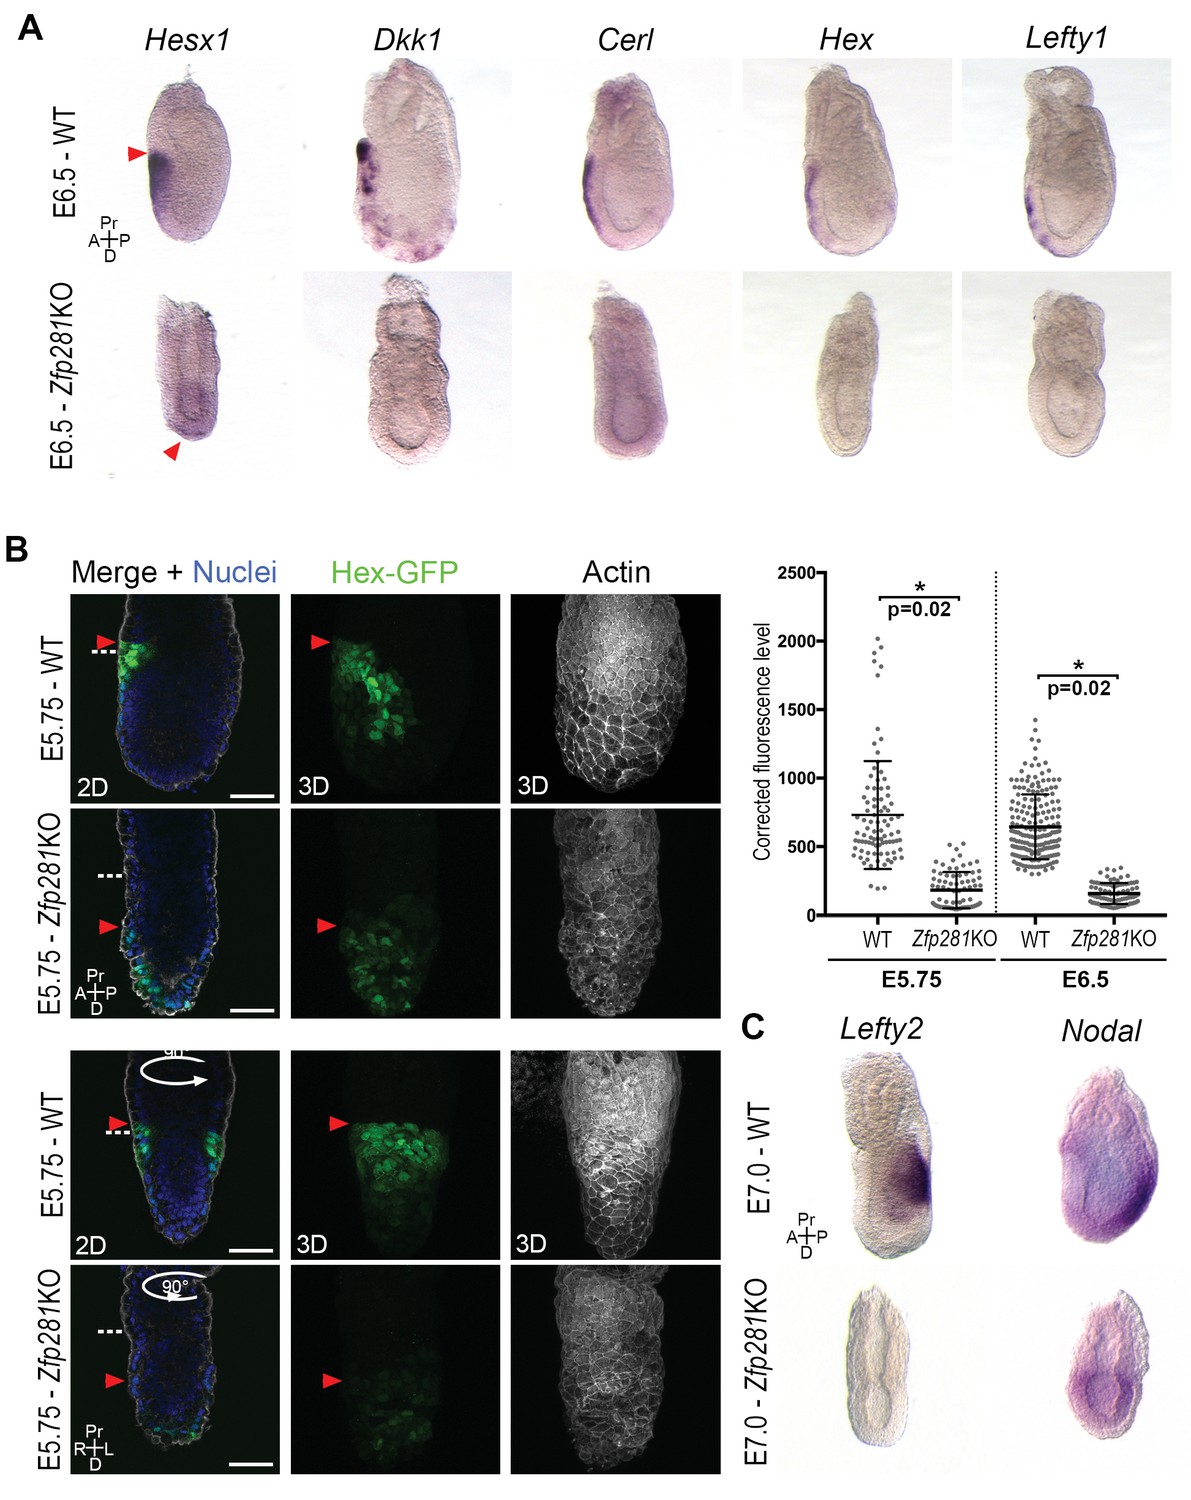
(A) WISH of E6.5 Zfp281KO and WT littermate embryos. Markers of DVE/AVE such as Hesx1, Dkk1, Cer1, Hex and Lefty1 are not expressed in Zfp281KO embryos compared to WT littermates, which exhibit distal-anterior domains of expression. Red arrowheads indicate the position of most anterior cells of the DVE/AVE. (B) Reduced expression and failure of anterior migration of Hex-GFP reporter in Zfp281KO embryos. Cell shape and organization within the VE layer is affected by absence of Zfp281 as indicated by distribution of F-Actin. White dashed line indicates the limit between extra-embryonic and embryonic regions. Quantification of nuclear levels of Hex-GFP at E5.75 (n = 2 embryos, 89 cells for WT and n = 3 embryos, 78 cells for Zfp281KO) and at E6.5 (n = 2 embryos, 193 cells for WT and n = 2 embryos, 89 cells for Zfp281KO) using Imaris software. Statistical significance was calculated on the average level of corrected fluorescence per embryo using Student’s T-test. *p<0.05. (C) WISH analysis of the Nodal target Lefty2 shows loss of expression in Zfp281KO embryos. Nodal is radialized in Zfp281KO embryos compared to WT due to lack of A-P axis. A = Anterior, p=Posterior, Pr = Proximal, D = Distal, 2D = single optical section, 3D = projection of several optical section. Scale bars represent 50 µm.
Figure 4—figure supplement 1
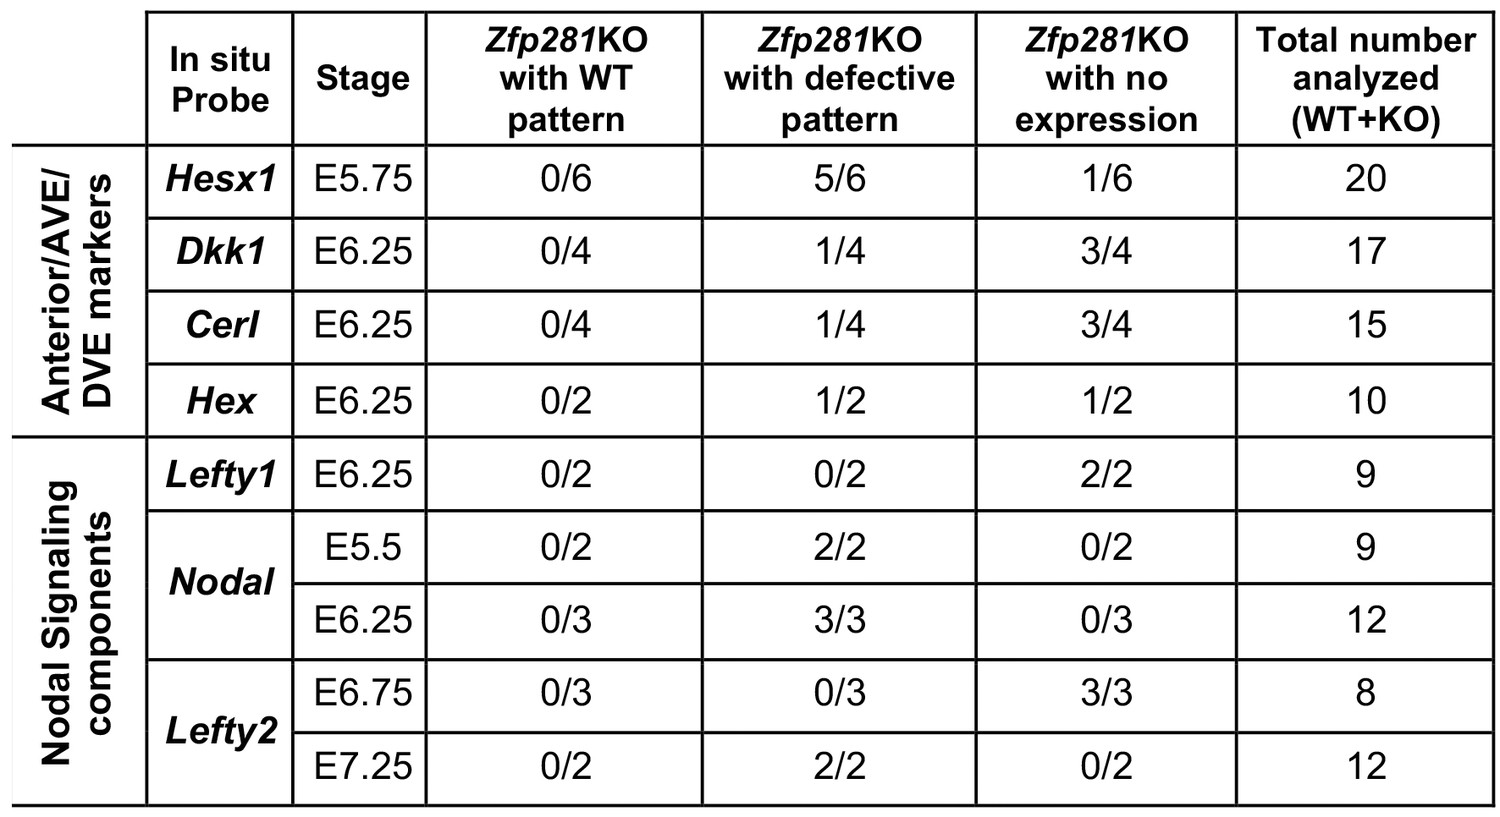
Table of markers and number of embryos analyzed by WISH.
https://doi.org/10.7554/eLife.33333.016
Figure 4—figure supplement 2
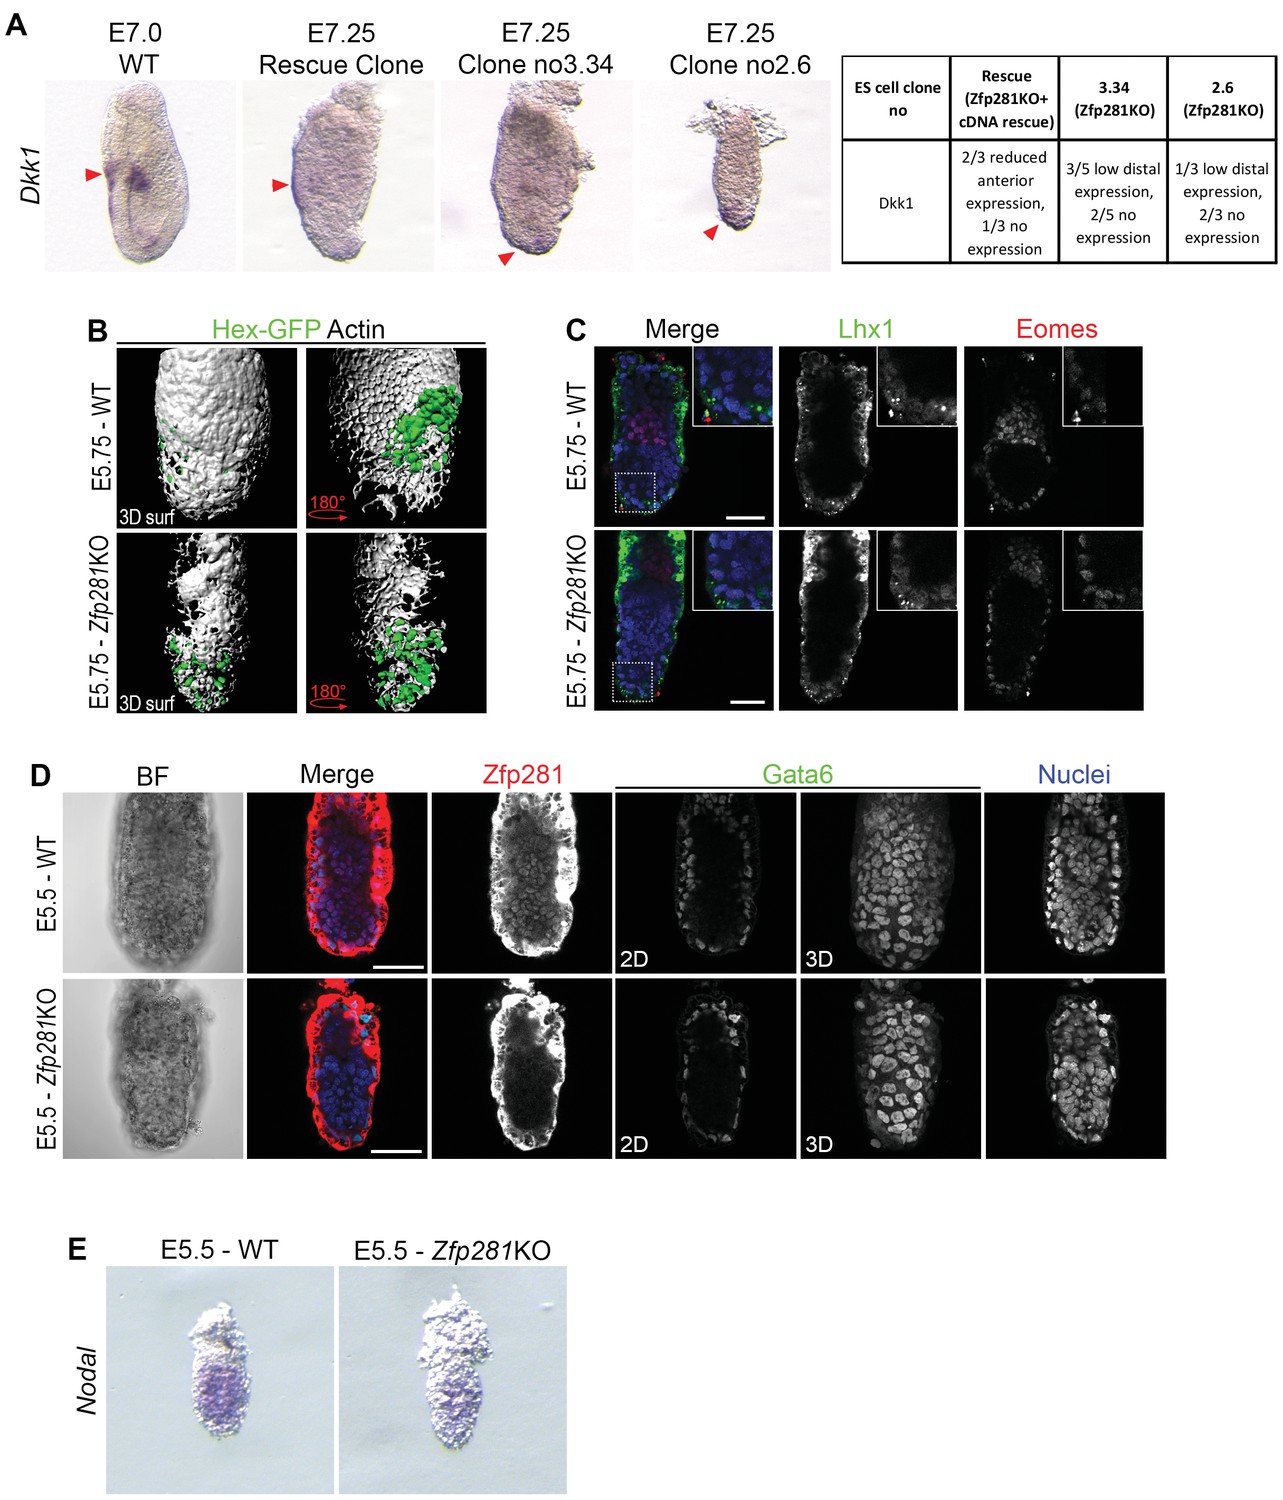
Additional characterization of Zfp281KO embryos.
(A) Dkk1 WISH in tetraploid Zfp281KO and rescue chimera. (B) 3D surface rendering of Actin immunostaining and HexGFP transgene expression in WT and Zfp281KO embryos at E5.75. (C) Expression of pan-VE markers Lhx1 and Eomes was unaffected in Zfp281 mutant embryo compared to WT at E5.75, namely before the onset of gastrulation. (D) Expression of Gata6 in the VE was not affected by the loss of Zfp281. (E) Nodal WISH at E5.5 in WT and Zfp281KO embryos. Scale bars represent 50 µm.
Figure 5 with 2 supplements
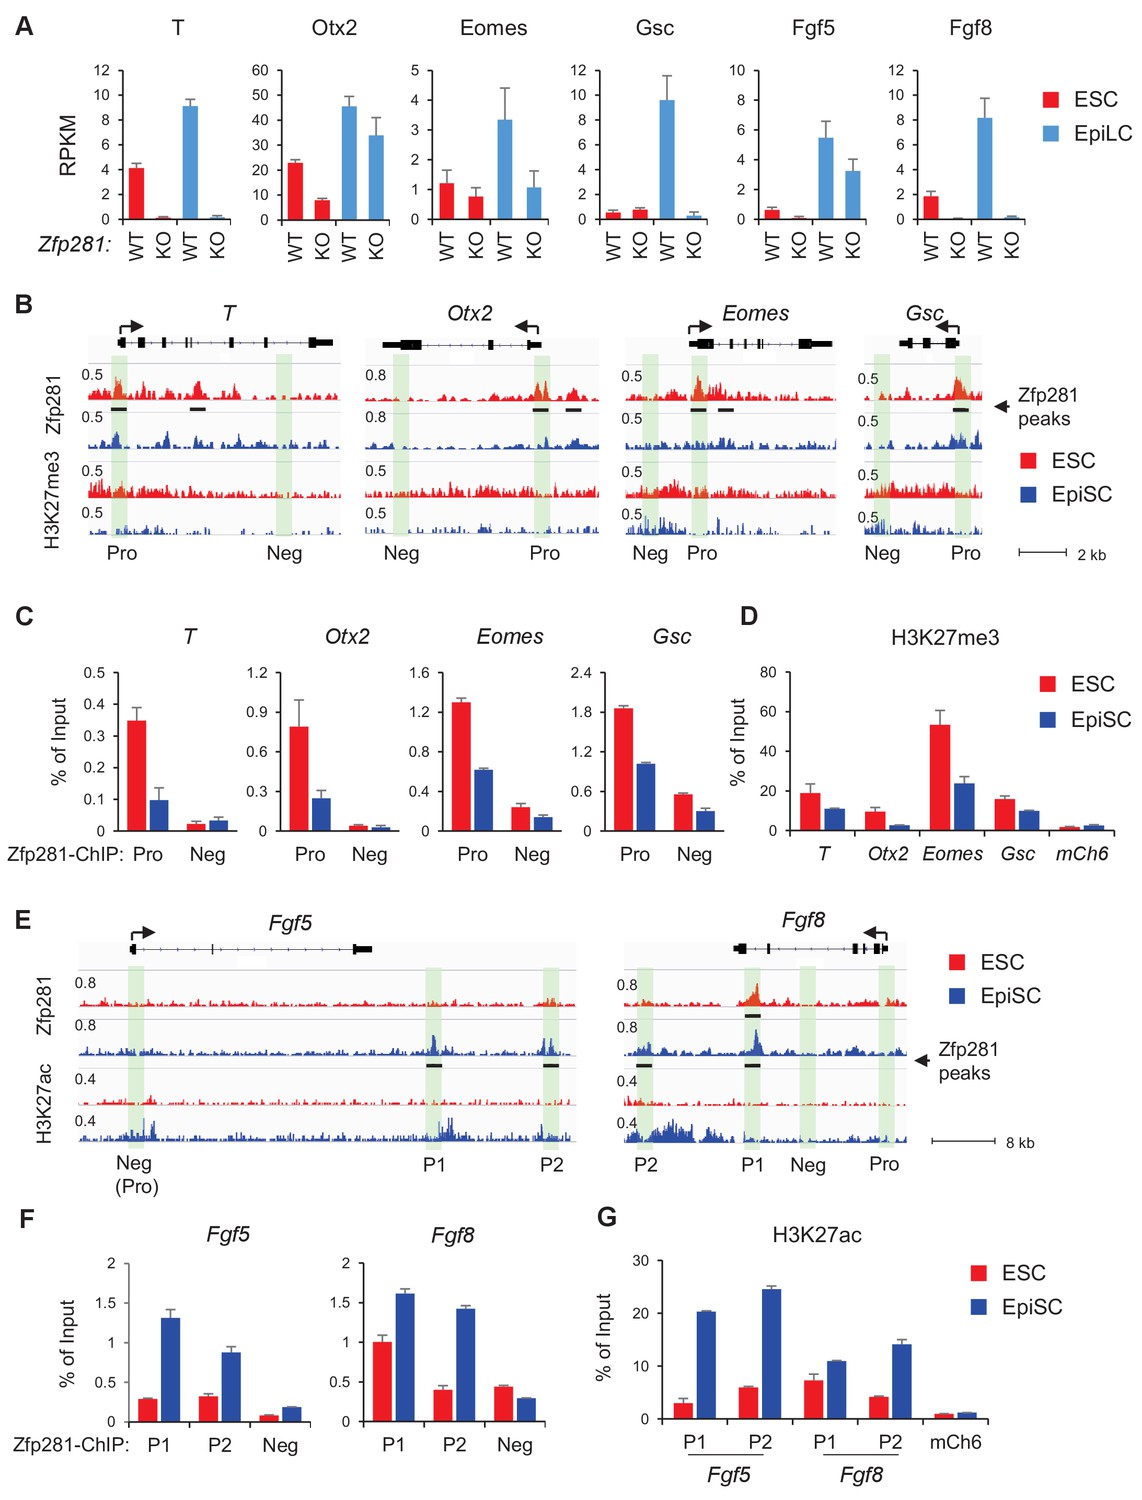
Zfp281 activates lineage-specific genes during epiblast maturation.
(A) Expressions of lineage-specific genes in WT and Zfp281KO ESCs and EpiLCs, from a previous published RNA-seq dataset (Fidalgo et al., 2016). mRNA expression level is mapped reads per million total mapped reads per kilobase (RPKM). (B) Zfp281 and H3K27me3 ChIP-seq tracks at loci of T, Otx2, Eomes, and Gsc. Black bar under track indicates region called as Zfp281 peak by MACS software. (C) ChIP-qPCR of Zfp281 at promoters (Pro) of T, Otx2, Eomes, and Gsc in ESCs and EpiSCs. Promoter and negative regions for PCR at each gene are shown in panel B. (D) ChIP-qPCR of H3K27me3 at promoters of T, Otx2, Eomes, and Gsc. mCh6 is a negative control mapping to a gene desert region on chromosome 6 (Boyer et al., 2006). (E) Zfp281 and H3K27ac ChIP-seq tracks at loci of Fgf5 and Fgf8. Black bar under track indicates region called as Zfp281 peak by MACS software. (F) ChIP-qPCR of Zfp281 at regulatory regions of Fgf5 and Fgf8 in ESCs and EpiSCs. Positions for PCR at each gene are shown in panel E. (G) ChIP-qPCR of H3K27me3 at regulatory regions of Fgf5 and Fgf8. mCh6 is a negative control mapping to a gene desert region on chromosome 6 (Boyer et al., 2006). ChIP-qPCR primer sequences are provided in Figure 5—source data 1.
-
Figure 5—source data 1
ChIP-qPCR primer sequences.
- https://doi.org/10.7554/eLife.33333.021
Figure 5—figure supplement 1

Expression of Nodal signaling component and pluripotency genes in WT and Zfp281KO cells.
Expression data are from a previous published RNA-seq dataset (Fidalgo et al., 2016). mRNA expression level is mapped reads per million total mapped reads per kilobase (RPKM).
Figure 5—figure supplement 2
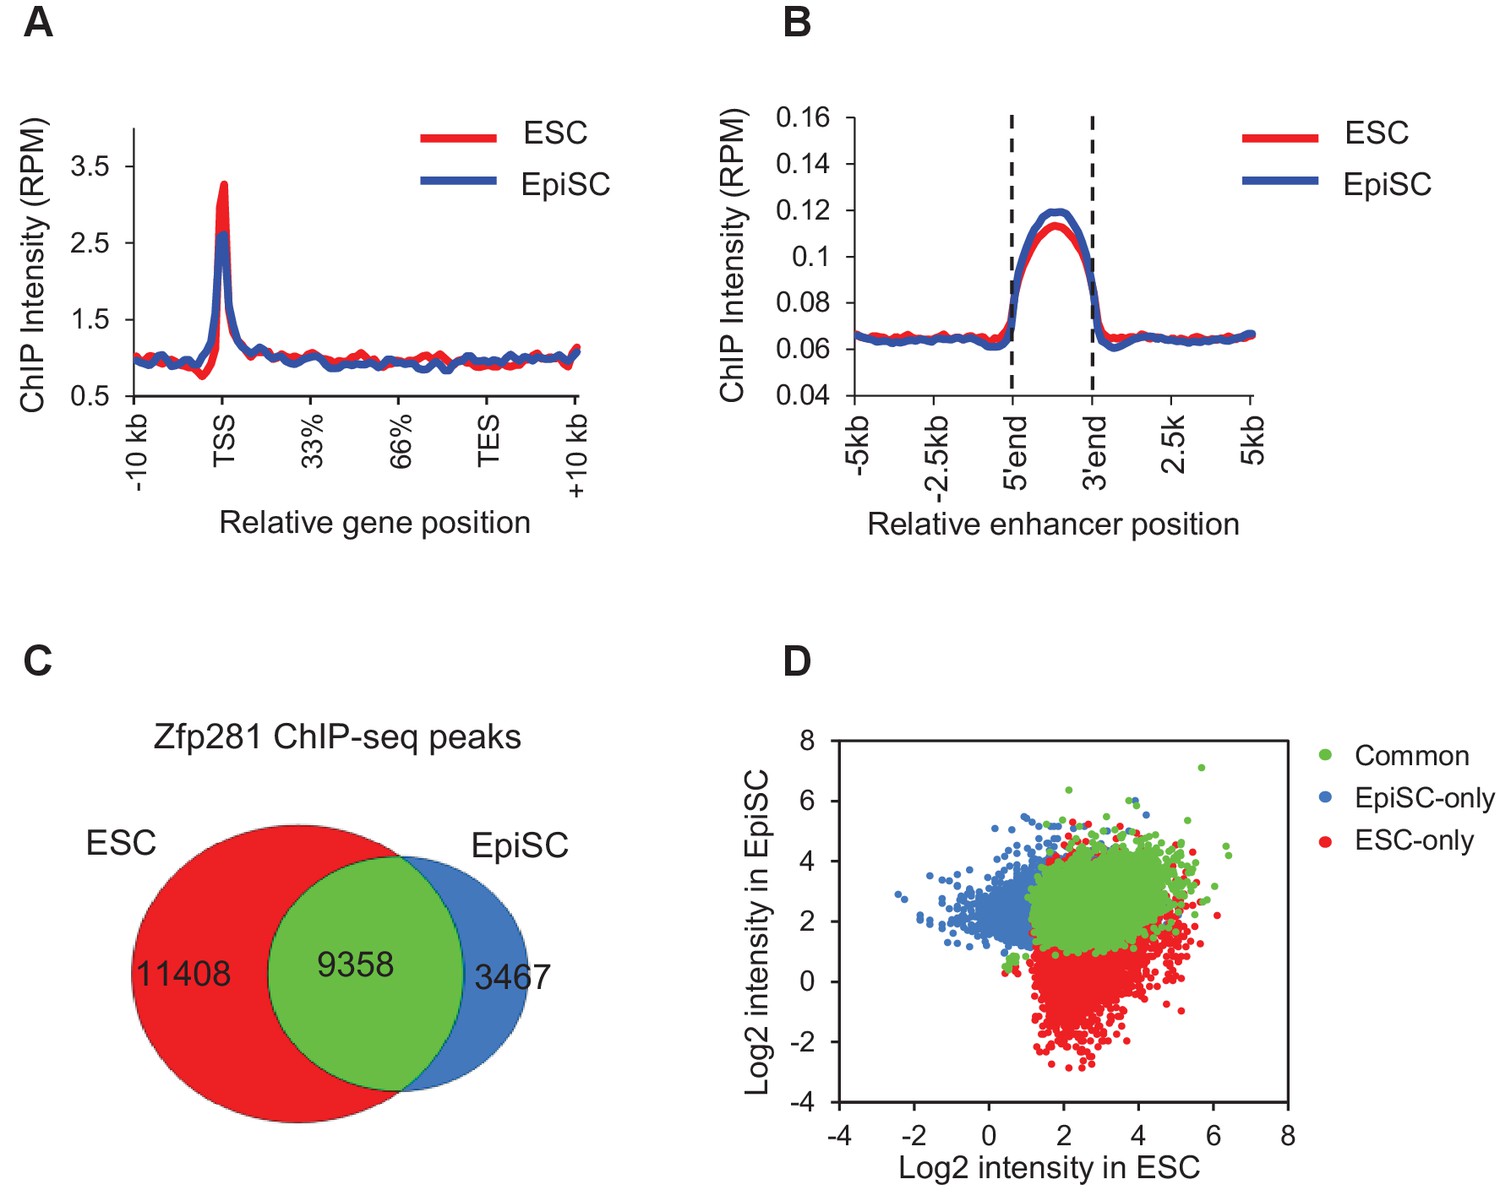
Characterization of Zfp281 ChIP-seq in ESCs and EpiSCs.
(A) Distribution of Zfp281 ChIP-seq intensity across gene bodies in ESCs and EpiSCs. Intensity is plotted within 10 kb of transcription start site (TSS) and transcription end site (TES). (B) Distribution of Zfp281 ChIP-seq intensity at enhancers in ESCs and EpiSCs. Enhancers were defined as the H3K4me1 and H3K27ac positive regions. (C) Overlap of Zfp281 ChIP-seq peaks between ESCs and EpiSCs. (D) Distribution of Zfp281 ChIP-seq intensities (RPM) at Common, ESC-only, and EpiSC-only Zfp281 peaks in ESCs and EpiSCs.
Figure 6 with 1 supplement
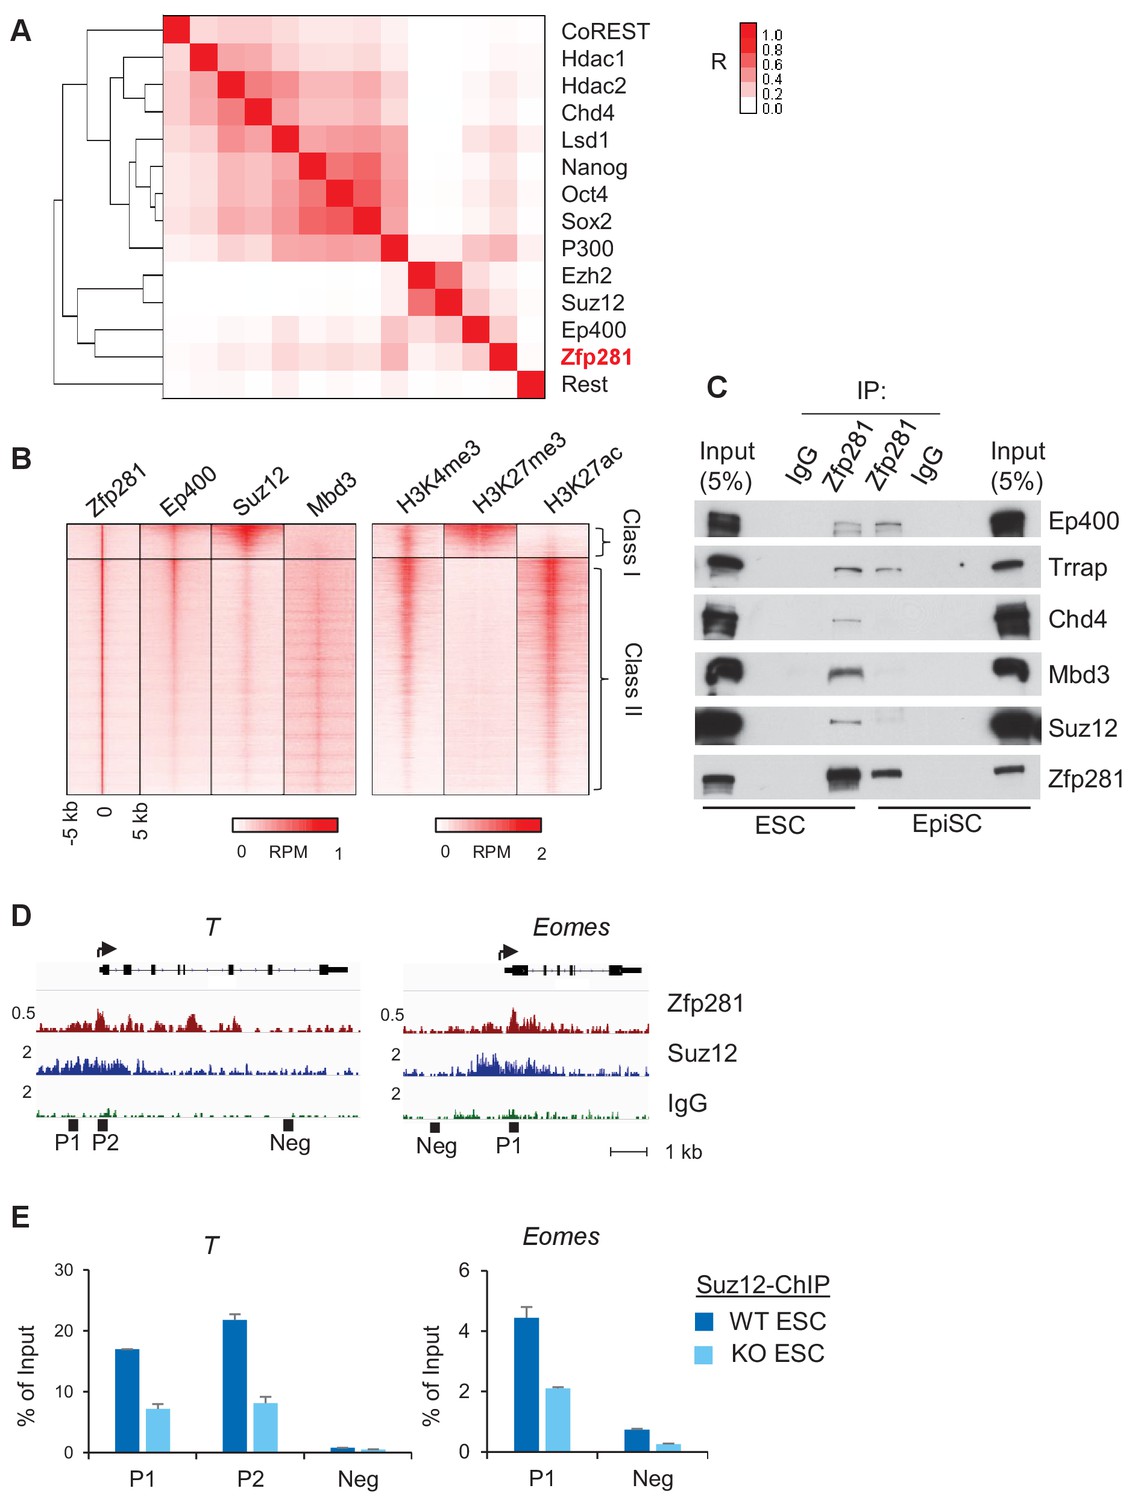
Zfp281 associates with PRC2 and Ep400 complexes for promoter regulation of bivalent lineage genes.
(A) Heatmap of ChIP-seq association analysis of Zfp281 with other transcription factors and epigenetic regulators in ESCs. The ChIP-seq datasets were compiled from published studies (see Figure 6—source data 1 for the accessions). The scale represents Phi correlation coefficient. (B) ChIP-seq profiles of Zfp281, Ep400, Suz12, Mbd3, and histone marks H3K4me3, H3K27me3, and H3K27ac at Zfp281 peak regions. Intensity is plotted within 5 kb around Zfp281 peak center. Two classes of Zfp281 peaks are shown: Class I, Zfp281-Mll2-Ep400-Suz12 co-bound; Class II, Zfp281-Mll2-Ep400-Mbd3 co-bound. (C) Co-immunoprecipitation (co-IP) of Zfp281 with other epigenetic regulators in ESCs and EpiSCs. (D) ChIP-seq tracks of Zfp281 and PRC2 complex (Suz12) at bivalent T and Eomes promoters. (E) ChIP-qPCR shows Suz12 binding at T and Eomes promoters decreases in Zfp281KO ESCs.
-
Figure 6—source data 1
Accession numbers of ChIP-seq data used in Figure 6A.
- https://doi.org/10.7554/eLife.33333.024
Figure 6—figure supplement 1
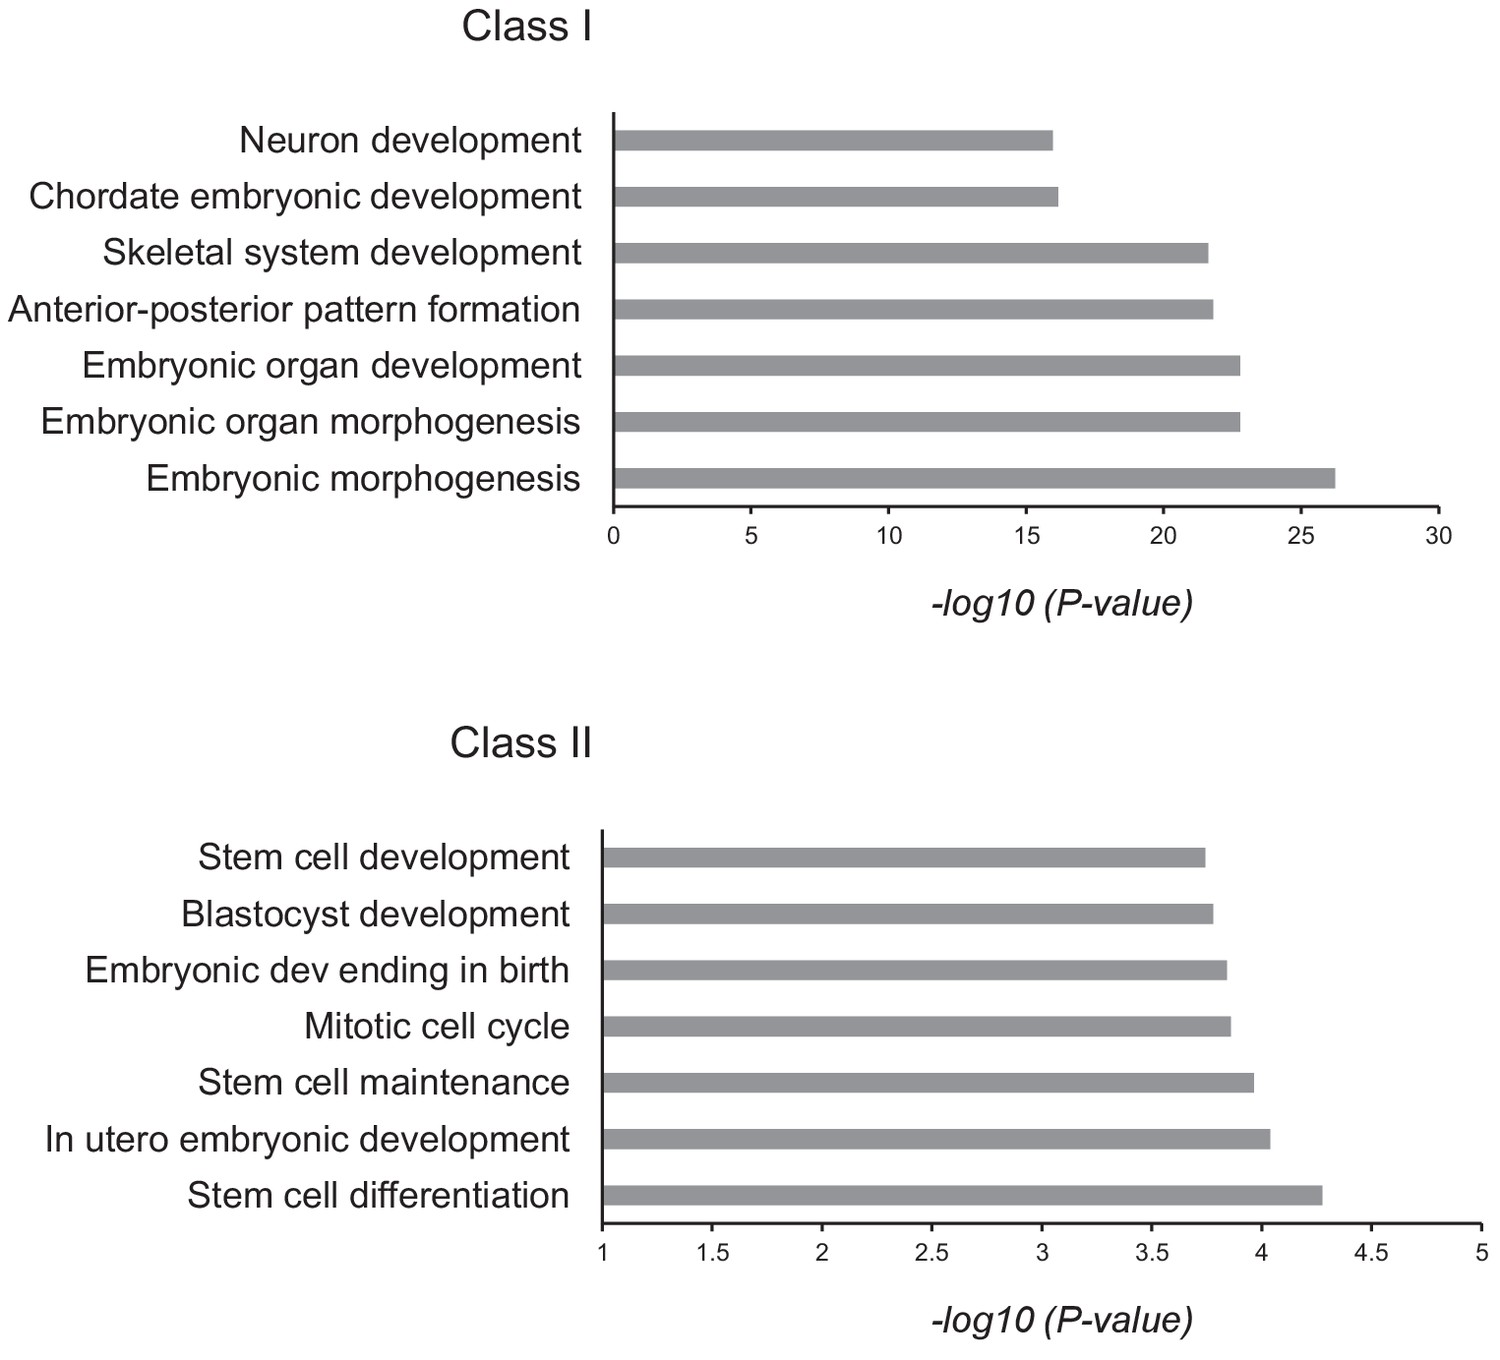
GO analysis of Class I and II of Zfp281 targets.
Gene ontology (GO) analysis for the Class I and II Zfp281 targets. Selected GO terms of Biological Process are shown with p-values. A Zfp281 target gene is defined as the nearest TSS (within 1 kb) of a Zfp281 peak.
Figure 7 with 3 supplements
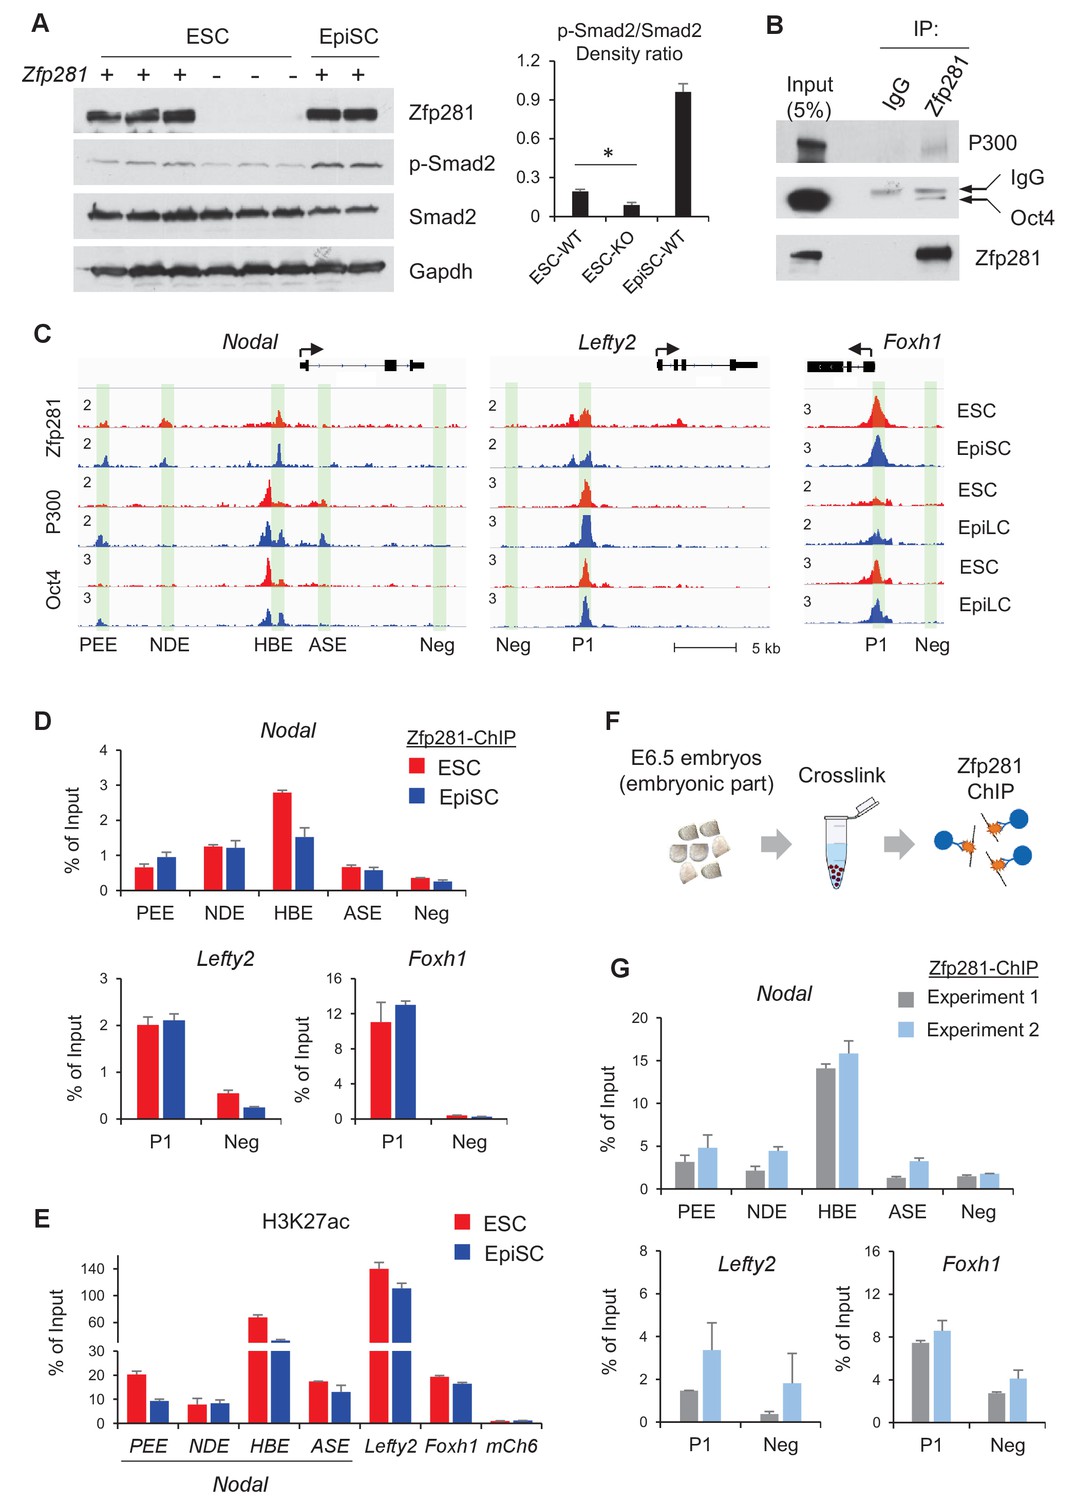
Zfp281 cooperates with Oct4 and P300 for regulation of genes encoding Nodal pathway components.
(A) Protein expression of p-Smad2 and Smad2 in WT (J1, CJ7, WT clone no 3), Zfp281KO (clone no. 2.6, 7, 3.34) ESC and WT EpiSC (OEC2, EpiSC9) cells. P-Smad2/Smad2 density ratios were quantified on the right panel. Student T-test was used examine statistical significance, *p<0.05. (B) Co-IP of Zfp281 with Oct4 and P300 in EpiSCs. The non-specific band is IgG heavy chain. (C) ChIP-seq tracks of Zfp281, Oct4 and P300 in ESCs and EpiSCs/EpiLCs at Nodal, Lefty2, and Foxh1 loci. Intensities are shown as mapped reads per million total mapped (RPM). (D) ChIP-qPCR of Zfp281 at Nodal, Lefty2, and Foxh1 regulatory regions in in ESCs and EpiSCs. (E) ChIP-qPCR of histone markers H3K27me at Nodal, Lefty2, and Foxh1 regulatory regions in ESCs and EpiSCs. (F) Diagram of ChIP experiments on E6.5 (WT) embryos. (G) ChIP-qPCR of Zfp281 at Nodal, Lefty2, and Foxh1 regulatory regions in E6.5 (WT) embryos. ChIP experiments were performed in two independent replicates. ChIP-qPCR primer sequences are provided in Figure 7—source data 1.
-
Figure 7—source data 1
ChIP-qPCR primer sequences.
- https://doi.org/10.7554/eLife.33333.029
Figure 7—figure supplement 1
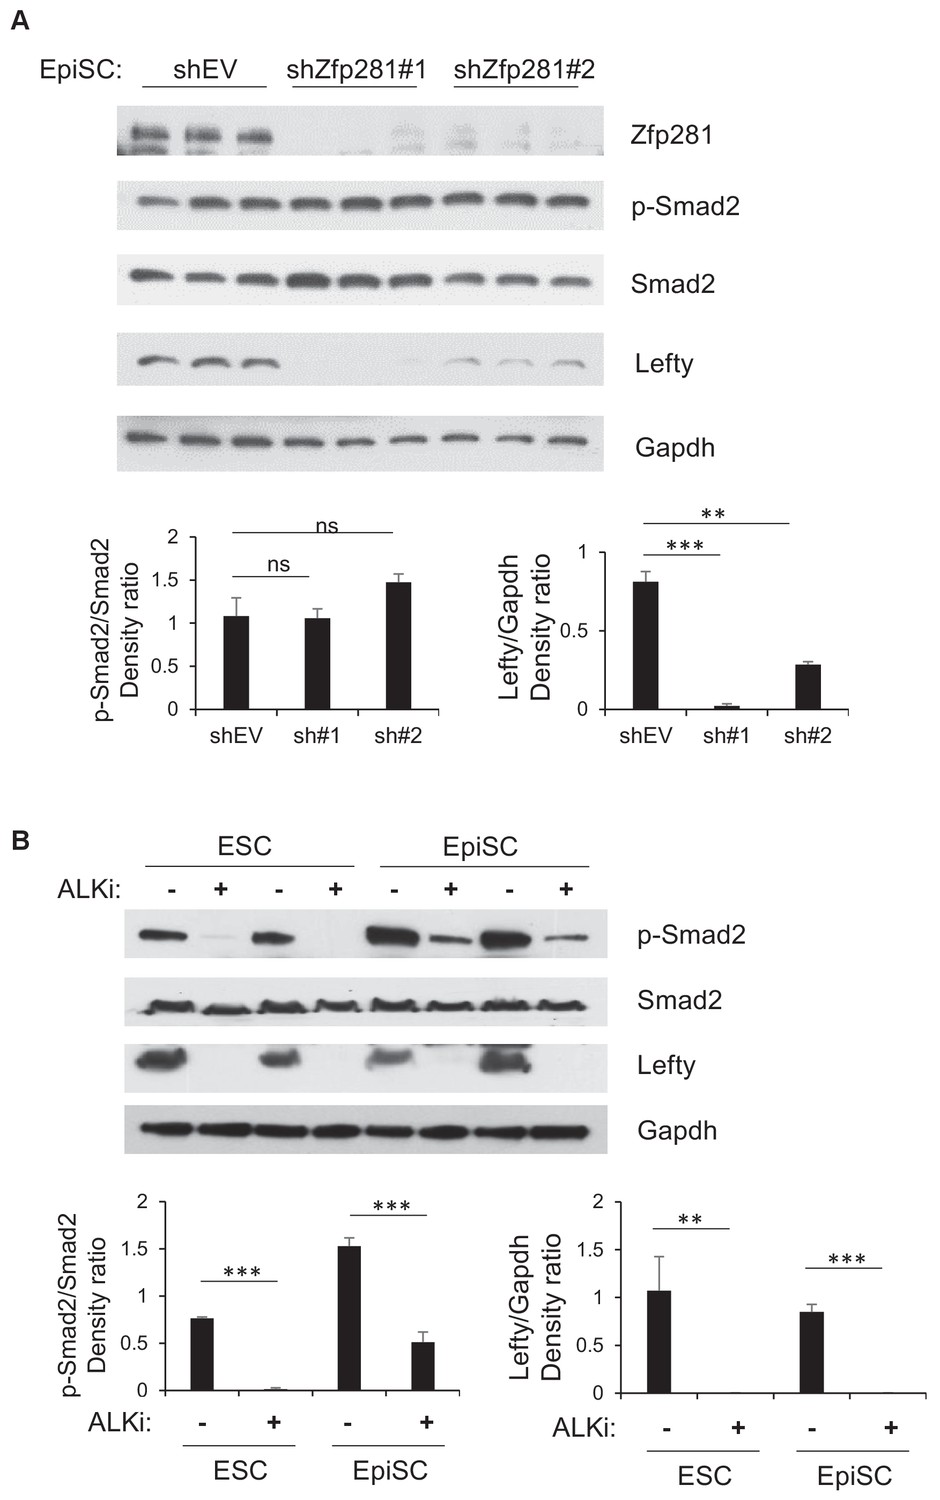
Zfp281 is required to maintain Lefty expression in vitro.
(A) Protein expression of p-Smad2, Smad2, Lefty (an antibody detecting both Lefty1 and Lefty2) by two Zfp281 shRNAs knockdown in EpiSCs. P-Smad2/Smad2 and Lefty/Gapdh density ratios were quantified on the bottom panels. (B) Protein expression of p-Smad2, Smad2, Lefty (an antibody detecting both Lefty1 and Lefty2) by treatment of ALK inhibitor (ALKi) in ESCs (CJ7, WT clone no 3) and EpiSCs (OEC2, EpiSC9). P-Smad2/Smad2 and Lefty/Gapdh density ratios were quantified on the bottom panels. Student T-test was used examine statistical significance: ns = non significant, *p<0.05, **p<0.01, ***p<0.001.
Figure 7—figure supplement 2
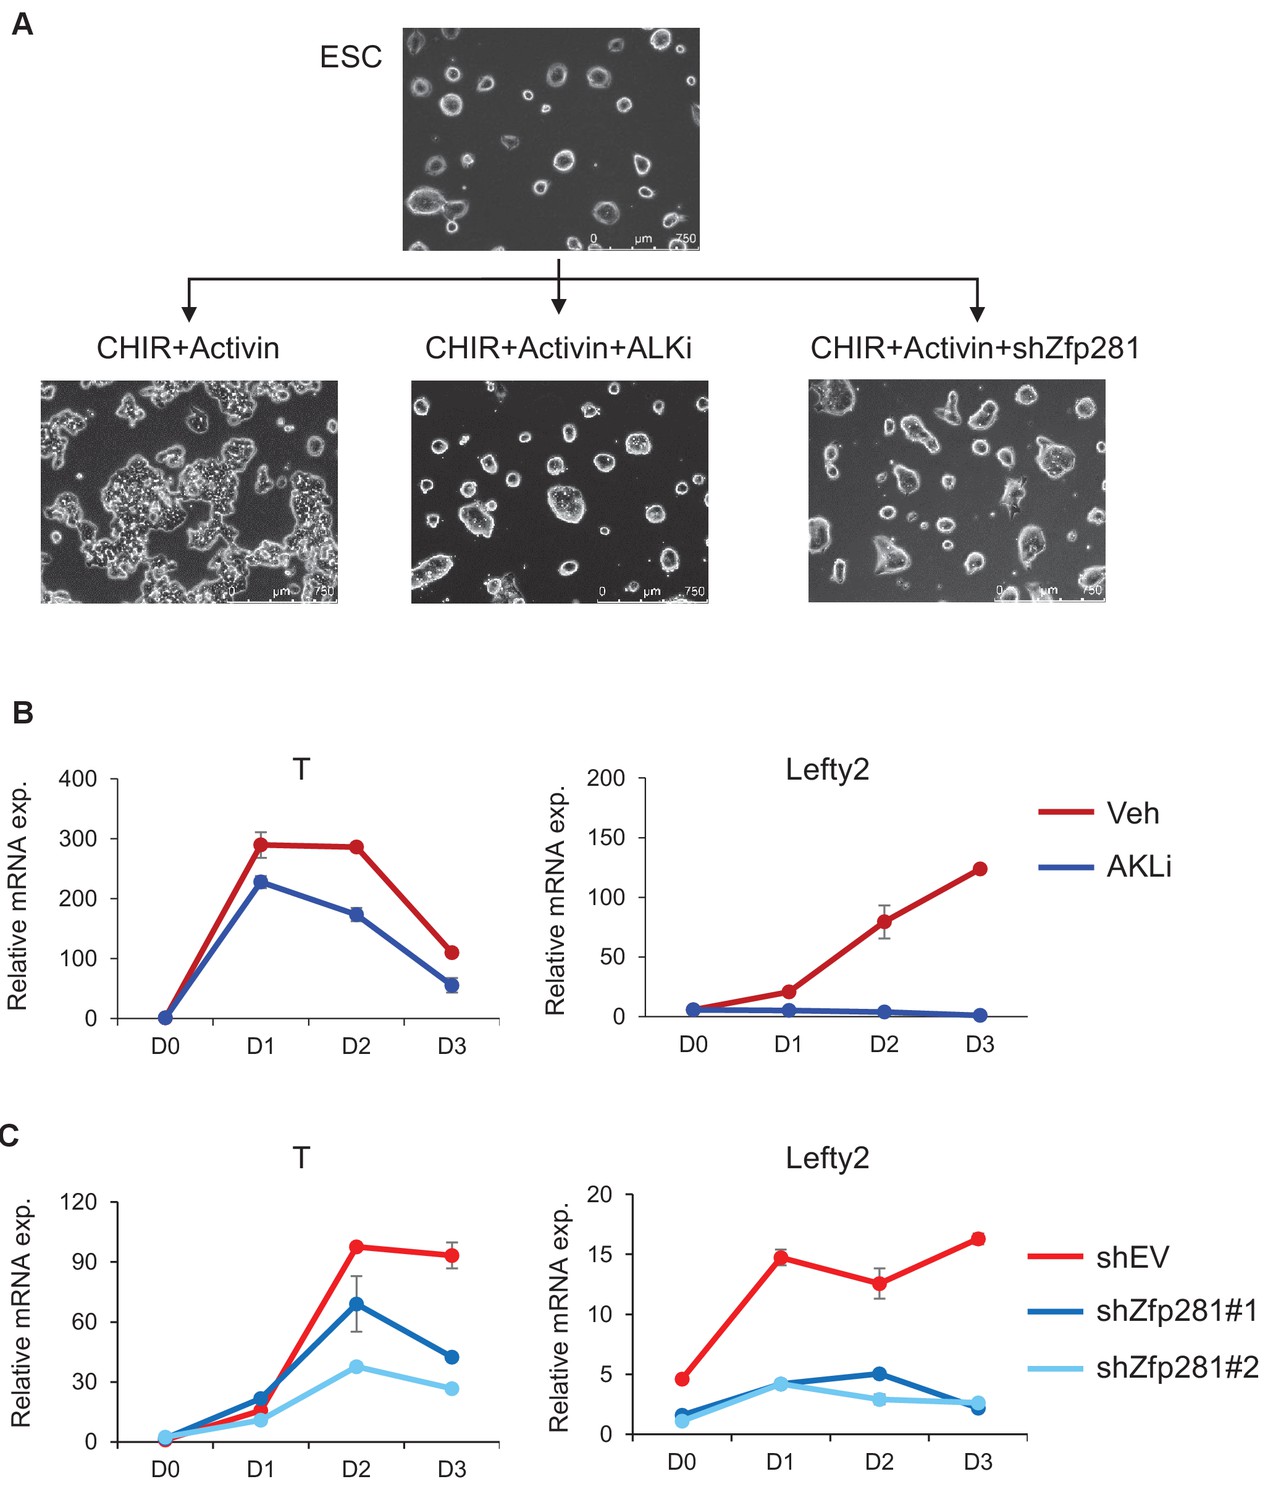
Zfp281 is required for ESCs differentiating to primitive streak (PS)-like cells.
(A) Phase images of ESCs and PS-like like cells with control, ALK inhibitor (ALKi) or Zfp281 shRNA treatments. (B) RT-qPCR for expression of T and Lefty2 at different days in ESC-to-PS-like cells differentiation with vehicle or ALKi treatment. (C) RT-qPCR for expression of T and Lefty2 at different days in ESC-to-PS-like cells differentiation with empty vector or Zfp281 shRNA treatment.
Figure 7—figure supplement 3
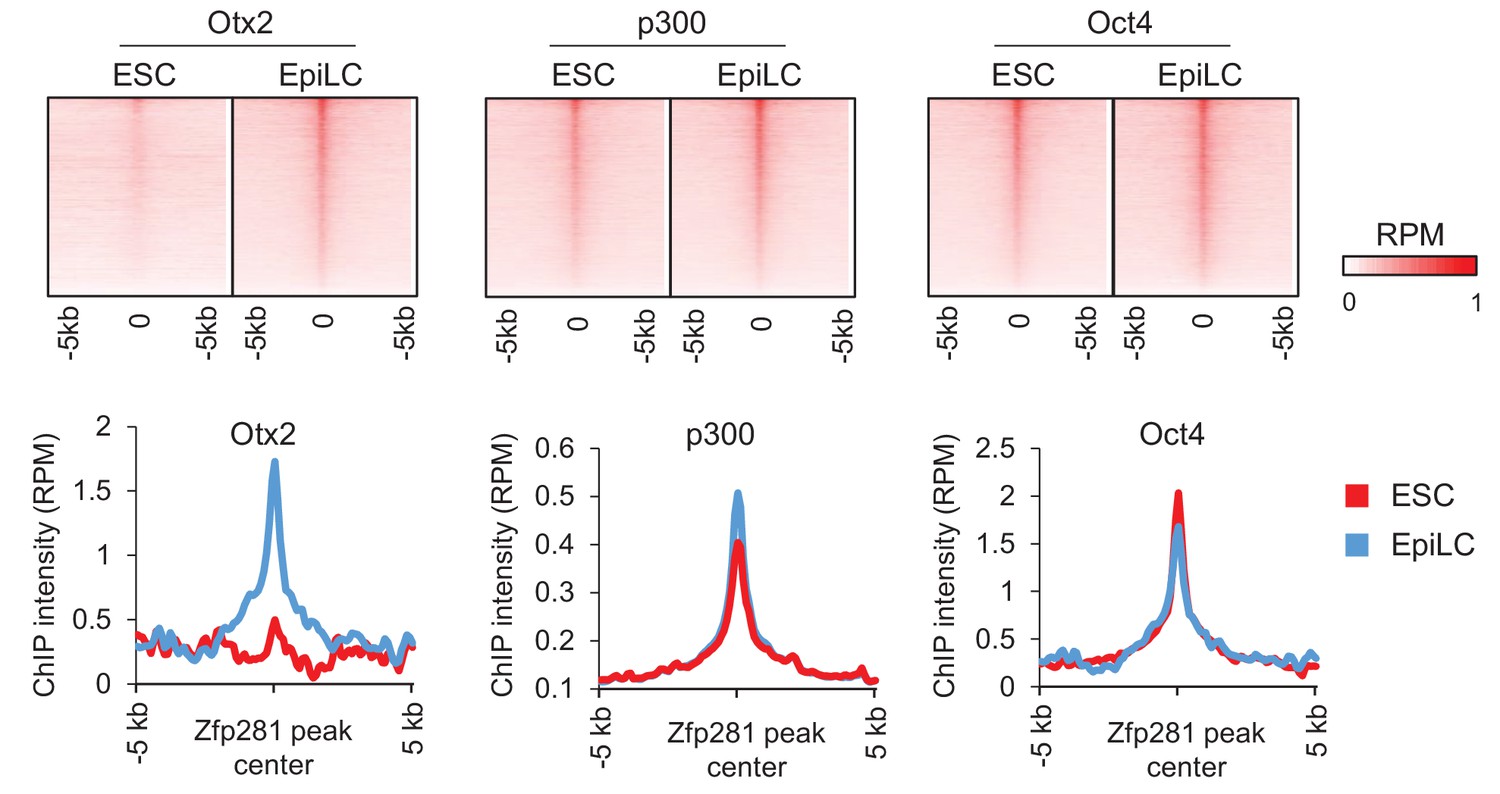
Zfp281, Oct4, and P300 colocalize in ESCs and EpiSCs/EpiLCs.
ChIP-seq profiles of Otx2, p300, and Oct4 (Buecker et al., 2014) at Zfp281 peak regions in ESCs and EpiLCs. Intensity is plotted within 5 kb around Zfp281 peak center in ESCs and EpiSCs, respectively.
Figure 8
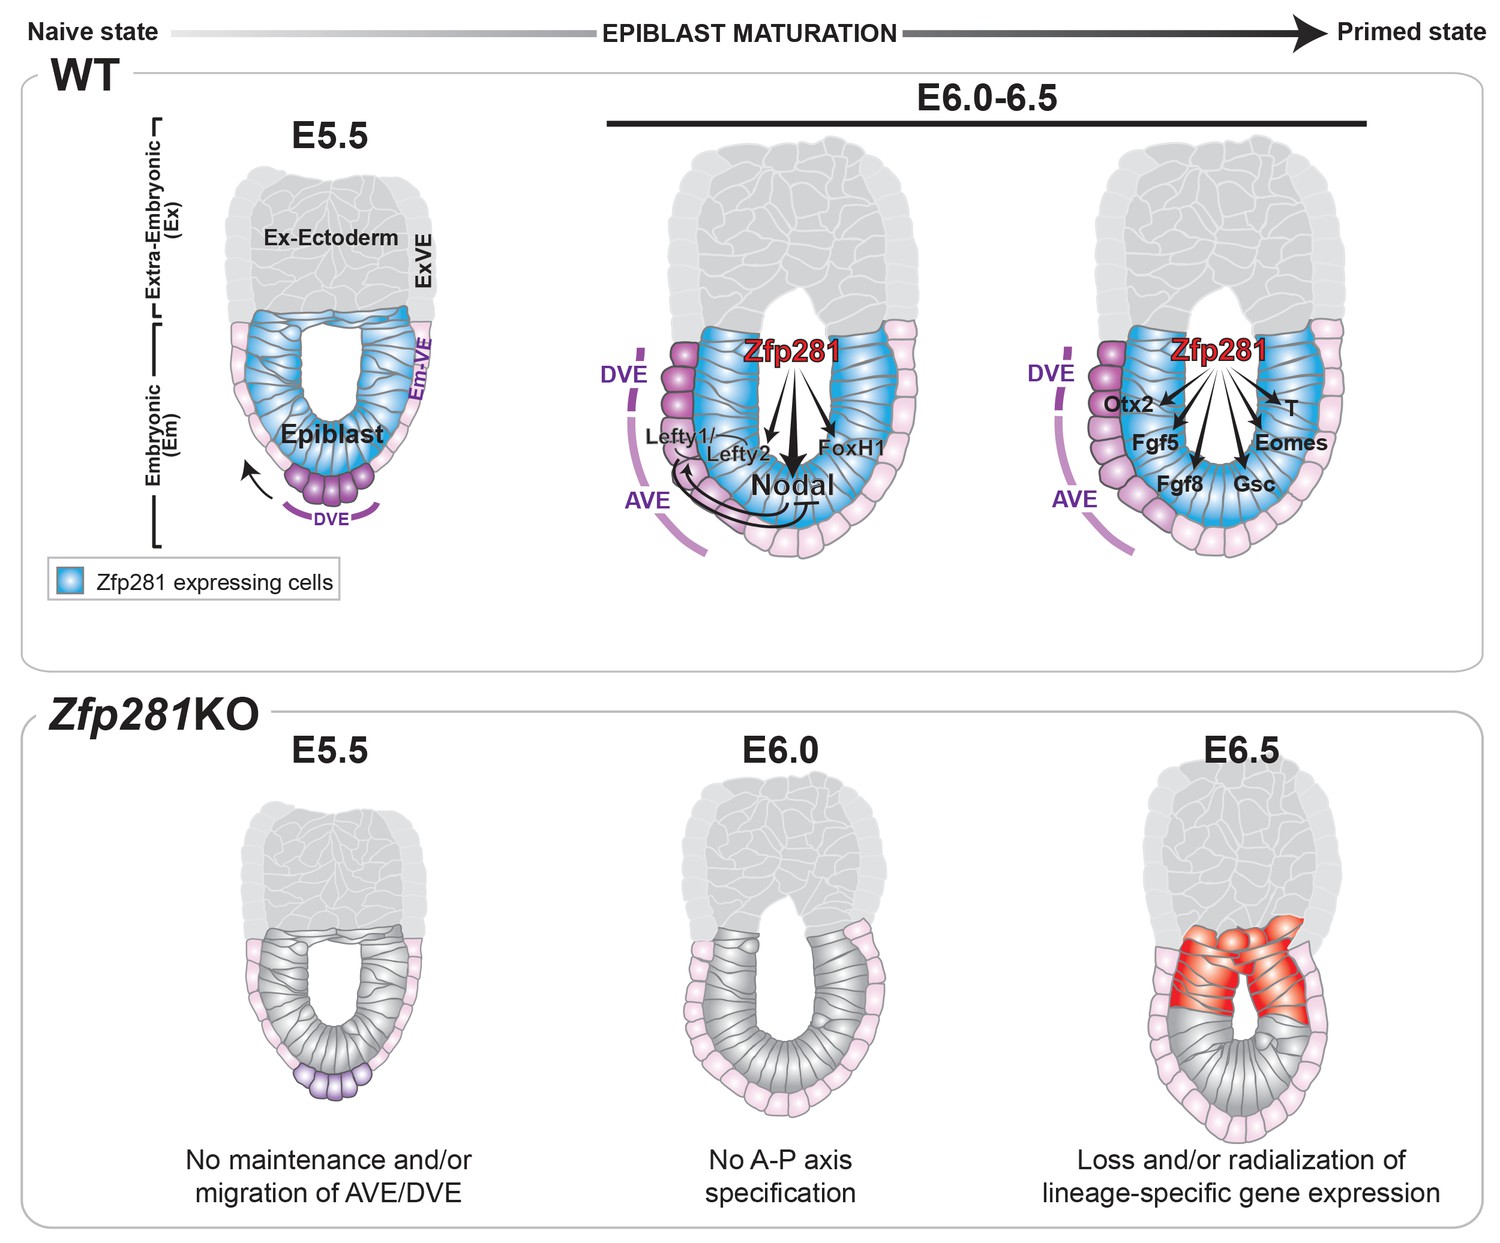
Working model for the role of Zfp281 in epiblast maturation.
Upper panel describes a working model for Zfp281 function during epiblast maturation in the post-implantation embryo. Zfp281 is expressed in epiblast cells (blue) and directs the activation of target genes. The lower panel describes the Zfp281KO embryo phenotype. Defects in epiblast maturation and Nodal signaling lead to failure in anterior-posterior axis establishment. Markers of the posterior epiblast (red) are radialized.
Author response image 1
Author response image 2

Additional files
-
Transparent reporting form
- https://doi.org/10.7554/eLife.33333.031
Download links
A two-part list of links to download the article, or parts of the article, in various formats.
Downloads (link to download the article as PDF)
Open citations (links to open the citations from this article in various online reference manager services)
Cite this article (links to download the citations from this article in formats compatible with various reference manager tools)
Zfp281 is essential for mouse epiblast maturation through transcriptional and epigenetic control of Nodal signaling
eLife 6:e33333.
https://doi.org/10.7554/eLife.33333


