Large-scale two-photon imaging revealed super-sparse population codes in the V1 superficial layer of awake monkeys
- Peking University, China
- Carnegie Mellon University, United States
Figures
Figure 1 with 3 supplements
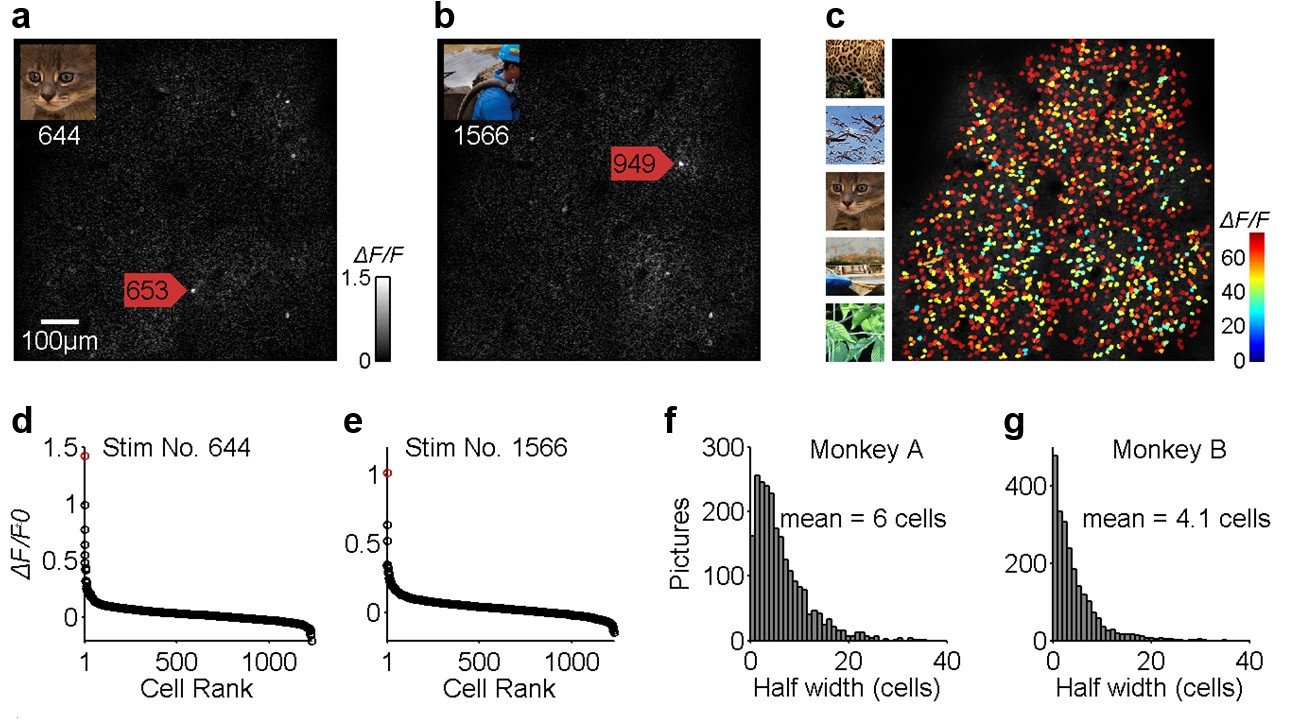
Population sparseness of neuronal responses of V1 layer two neurons to natural scenes.
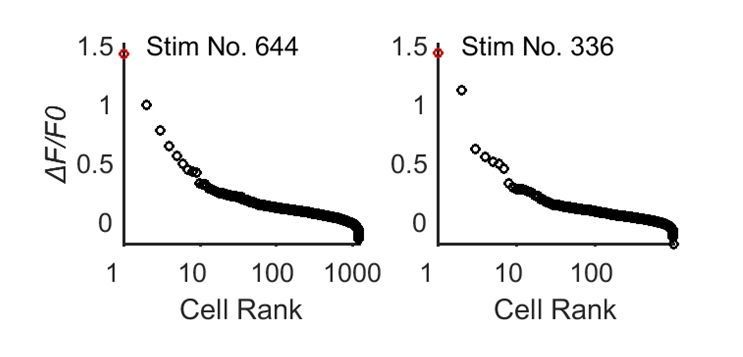
(a, b) Calcium images of the neuronal population response to two different natural images (shown in the insets). Typically, only a few neurons, among the nearly 1000 neurons measured (1225 neurons for Monkey A or 982 neurons for Monkey B), responded strongly to a single patch of natural scenes. (c) The overall neuronal population responses to all 2250 natural images. Each cell was color-coded according to the response intensity to its optimal stimulus. (d, e) The distributions of neuronal population responses to the two natural images. Abscissa indicates the 1225 neurons that showed a significant response to natural images, in ranked order according to their responses to each image. Ordinate indicates ΔF/F0. (f, g) Frequency histograms showing the distributions of the number of stimuli (out of 2250) (y-axis) with different population sparseness, measured by the number of neurons activated strongly (x-axis). On average, fewer than 0.5% of the cells (6 cells out of 1225 for monkey A, and 4.1 cells out of 982 for monkey B) responded above half of their peak responses for any given image.
Figure 1—figure supplement 1
Two-photon calcium imaging in awake macaque monitoring the neuronal activity in V1 layer 2 evoked by natural stimuli.
(a, b) Two-photon images of neurons expressing GCaMP5 at zoom 1X and 2X respectively. (c) Natural stimuli evoked robust neural activity that is probed by the calcium indicator GCaMP5.
Figure 1—figure supplement 2
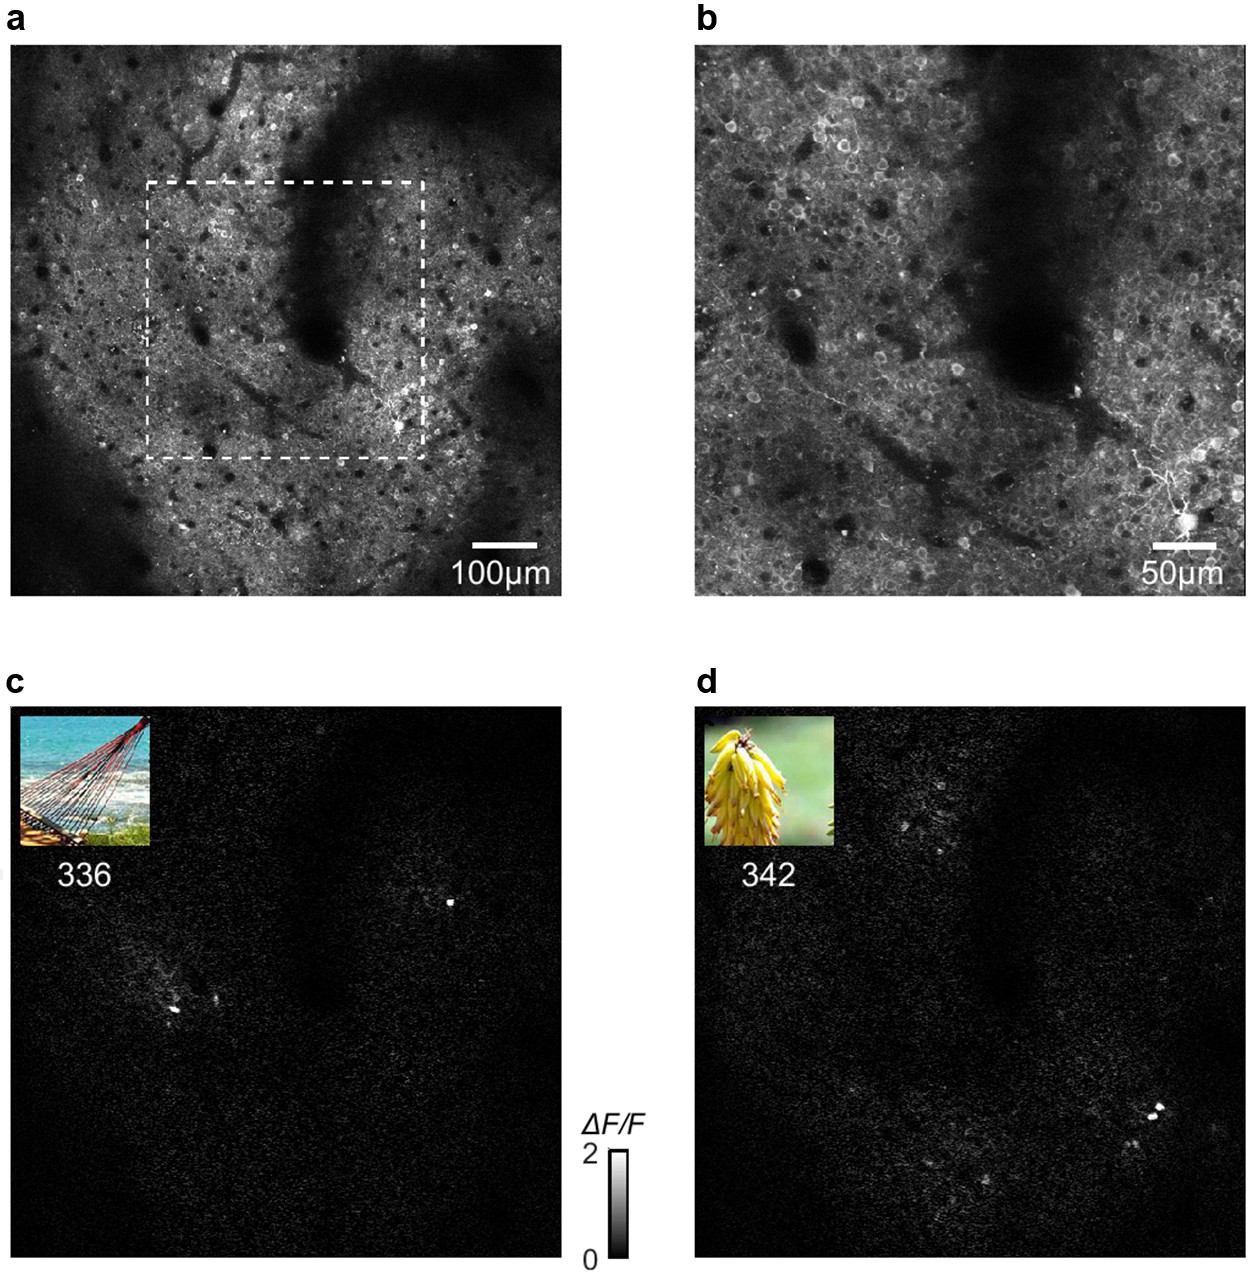
Two-photon images and neuronal responses in monkey B.
(a, b) An average two-photon image from monkey B at two levels of magnification. (c, d) Images showing different sparse strong neuronal responses to different natural stimuli.
Figure 1—figure supplement 3
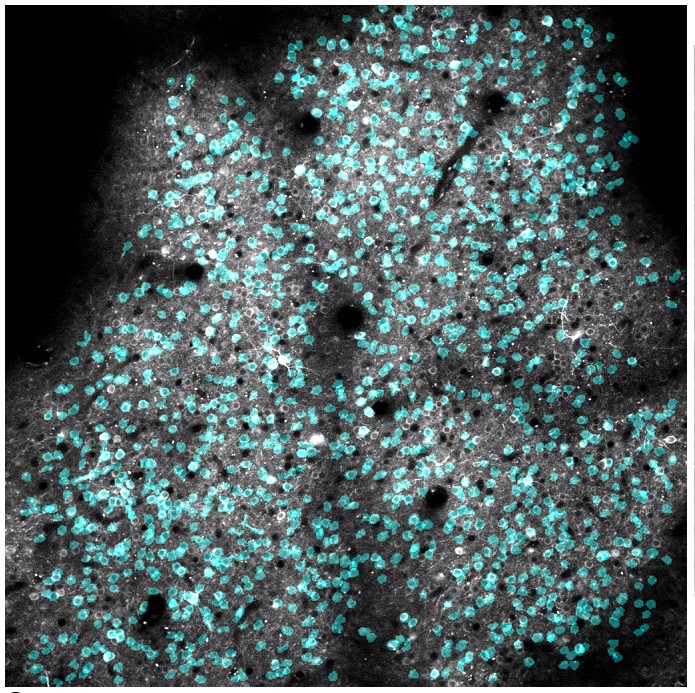
The ROIs overlaid over a two-photon image of a 850 × 850 µm region under a 16X objective, showing that the ROIs extracted on the basis of activities were well matched to the cell bodies.
https://doi.org/10.7554/eLife.33370.005
Figure 2 with 1 supplement
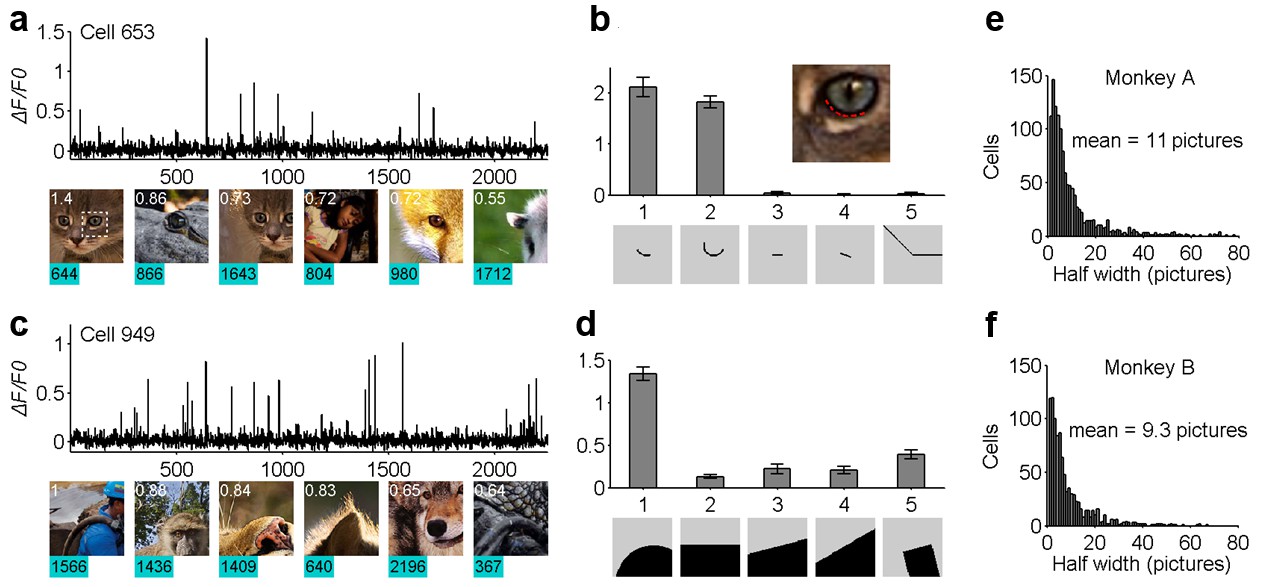
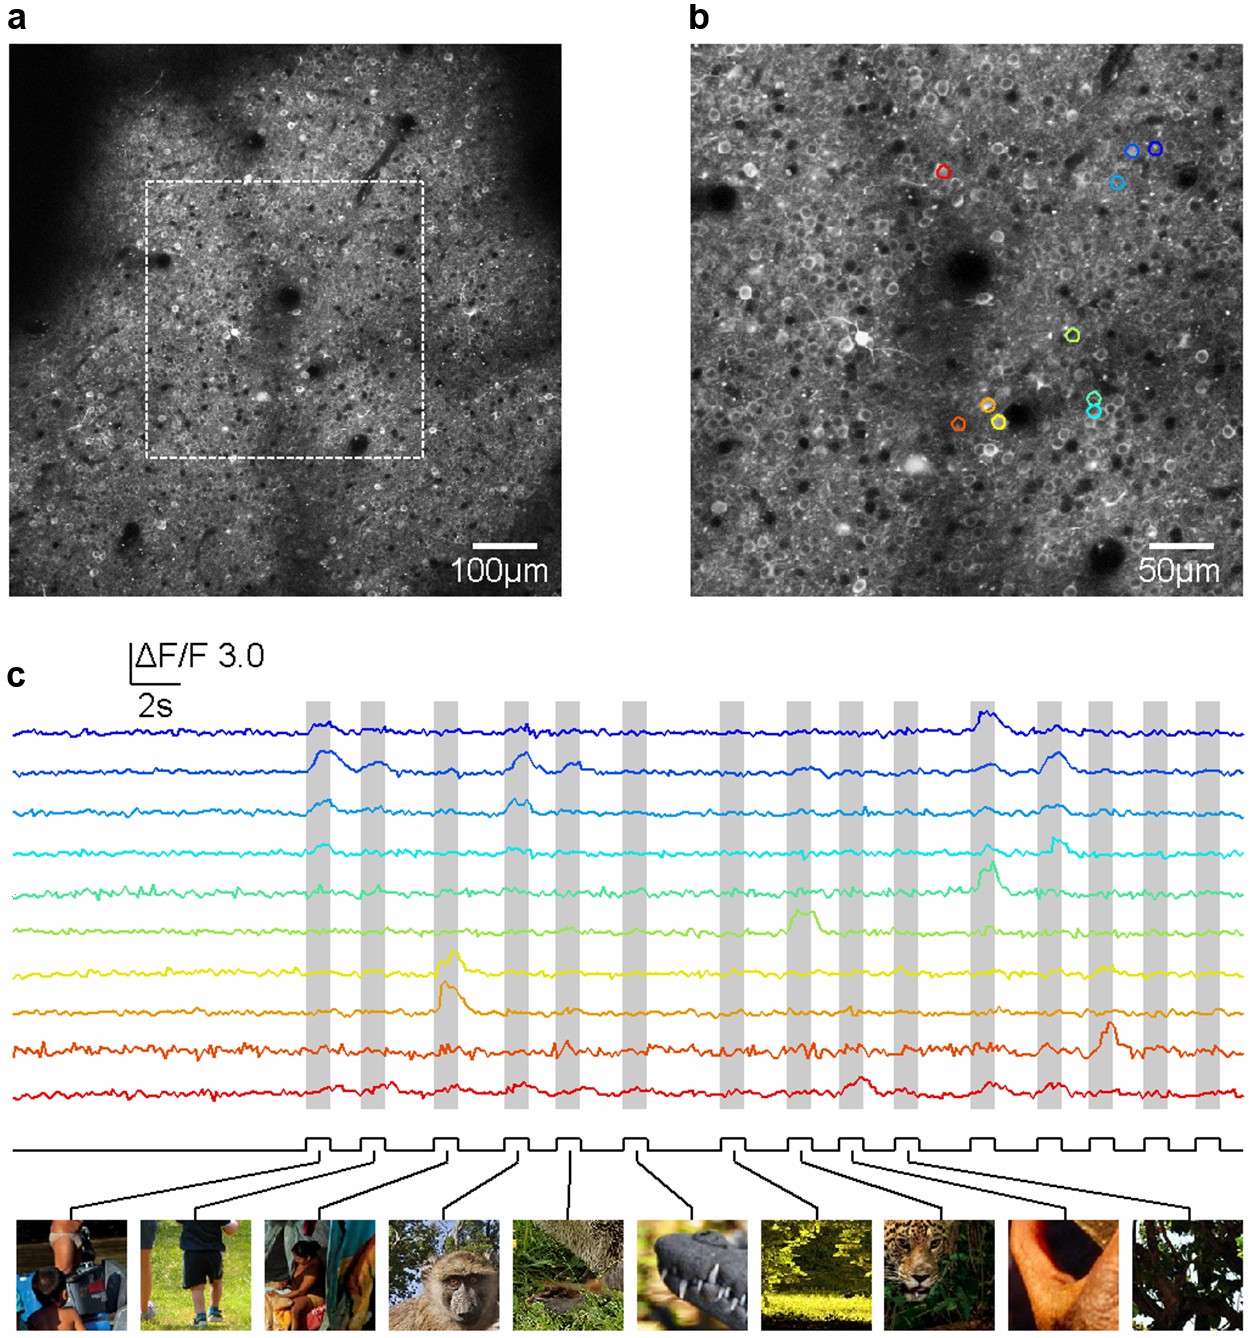
Life-time sparseness in the neuronal responses of V1 layer two neurons to natural scenes.
(a, b) The response of one example cell (cell 653) to the entire set of natural scene stimuli, exhibiting a high level of stimulus specificity. (c, d) Another example cell (cell 949) also shows high stimulus specificity. (e, f) The distributions of the stimulus specificity of neurons, in terms of the half-height width of the stimulus tuning curves. Each cell would typically respond strongly to fewer than 0.5% of the natural images in our test set.
Figure 2—figure supplement 1
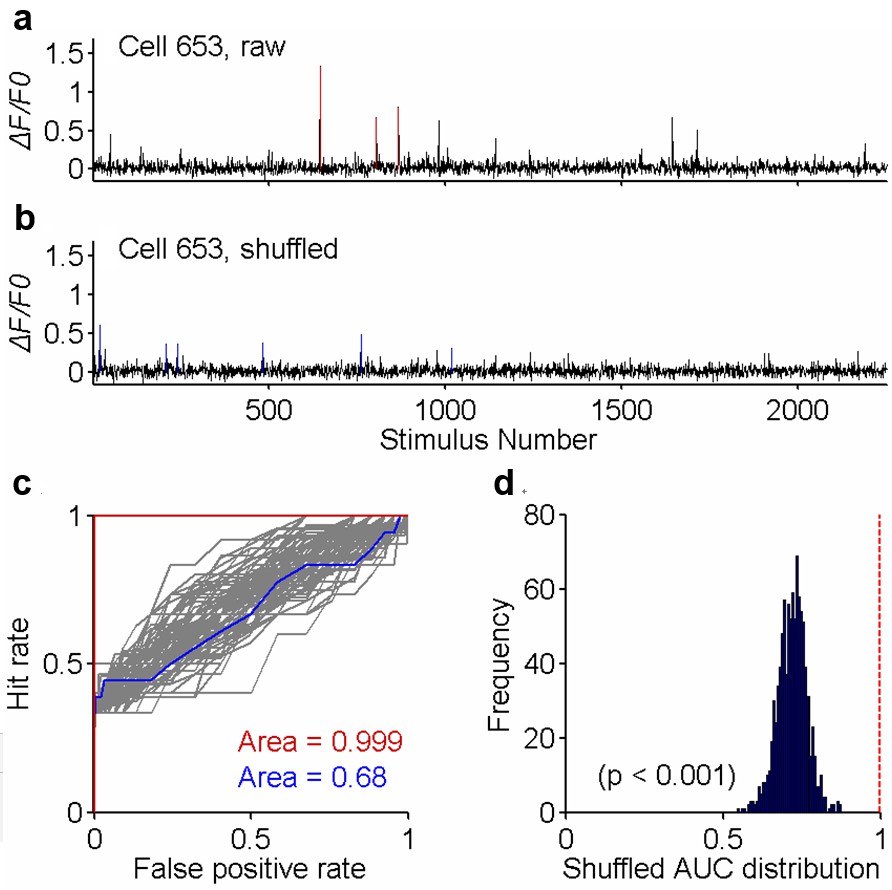
Reliability analysis of neuronal responses.
(a) The tuning curve of neuron #653’s responses (averaged across trials) to the 2250 stimuli. (b) The tuning curve computed from one random shuffle across all trials. (c) The ROC of original trials (red curve) against those of 99 shuffled trials (gray). The AUC of the original data is 0.999. The AUC of the example in (b), colored in blue, is 0.68. (d) The distribution of the AUC’s of all 1000 shuffled cases. The probability that the shuffled AUC can reach the raw data’s AUC is less than 0.001 (p<0.001) for neuron #653.
Figure 3 with 1 supplement
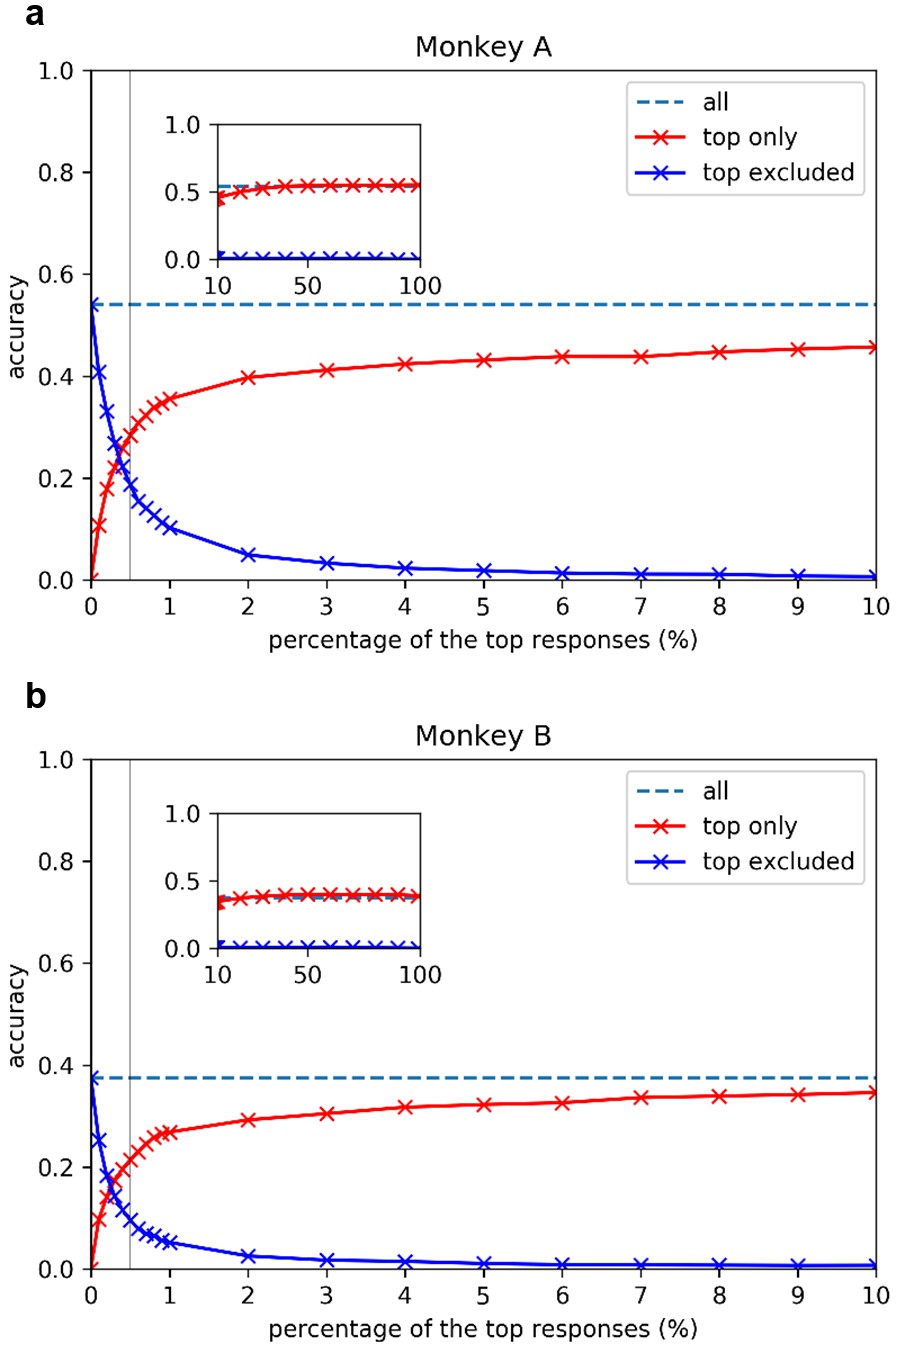
Image decoding performance as a function of the percentage of only the strongest responses used for (a) Monkey A and (b) Monkey B.
Y axes show the cross-validated decoding accuracy on the 2,250-way image classification task. Dash lines are the referential ‘achievable decoding performance’ in accuracy obtained using the original entire neural population responses; red lines (‘top only’ in key) show the decoding accuracies when different percentages of the top responses were kept and lower responses were removed (set to zero); blue lines (‘top excluded’ in legends) show the decoding accuracies when different percentages of top responses were removed (set to zero) and lower responses were kept. X axes show the percentage of top responses included (red curves) and excluded (blue curves). Check 'Materials and methods Decoding Analysis' for details. Gray vertical lines highlight the decoding accuracies including or excluding the top 0.5% responses. Since our classification task is a 2250-way one, the chance accuracy is 1/2,250, or about 0.4%.
Figure 3—figure supplement 1
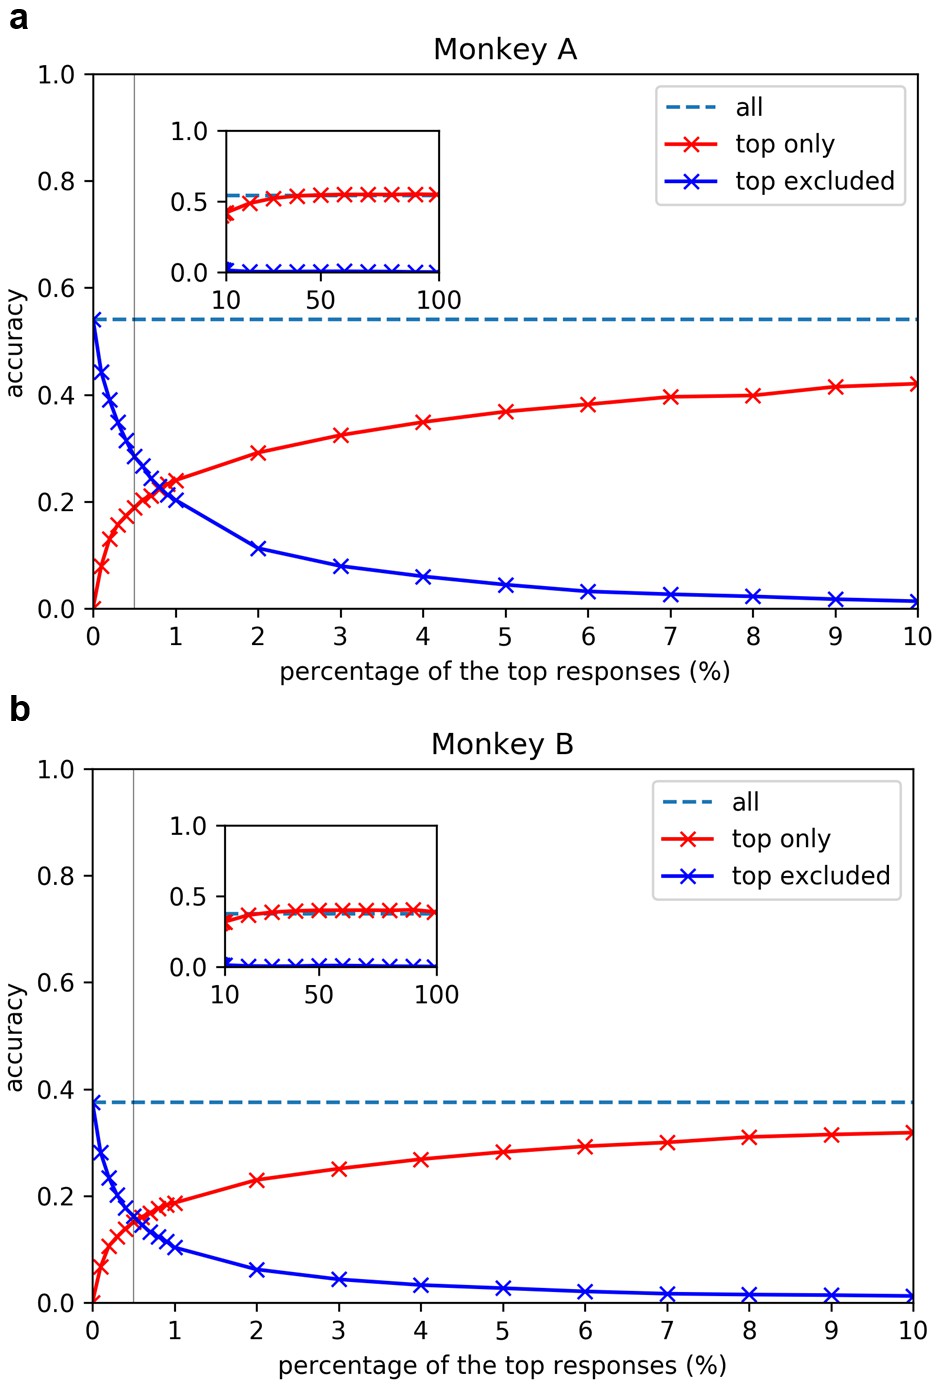
Image decoding performance as a function of the percentage of top-responding neurons selected to be included or excluded, using a threshold relative to the peak response of each neuron.
See 'Materials and methods' for details. Results were qualitatively similar to those shown in Figure 3.
Author response image 1
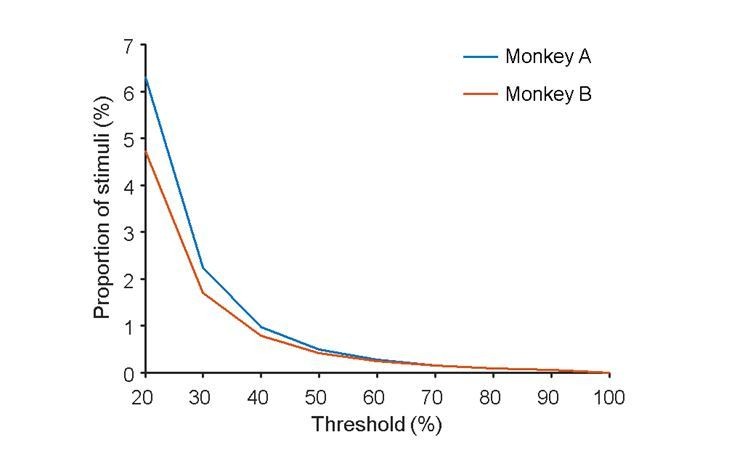
The proportions of stimuli those evoked strong responses above varying thresholds.
https://doi.org/10.7554/eLife.33370.012
Author response image 2
The distribution of neuronal population responses with log X-axis.
https://doi.org/10.7554/eLife.33370.013Tables
Key resources table
| Reagent type (species) or resource | Designation | Source or reference | Identifiers | Additional information |
|---|---|---|---|---|
| Strain, strain background (Macaque) | Rhesus monkeys | Beijing Prima Biotech Inc | http://www.primasbio.com/cn/Default | http://www.primasbio.com/cn/Default |
| Recombinant DNA reagent | AAV1.hSyn.GCaMP5G | Penn Vector Core | V5072MI-R | |
| Software, algorithm | Matab 7.12.0 (R2011a) | MathWorks | Matab 7.12.0 (R2011a) | https://www.mathworks.com |
| Software, algorithm | Codes for the decoding analysis and image movement correction | This paper | Codes for the decoding analysis and image movement correction | https://github.com/leelabcnbc/sparse-coding-elife2018 (copy archived athttps://github.com/elifesciences-publications/sparse-coding-elife2018) |
Additional files
-
Transparent reporting form
- https://doi.org/10.7554/eLife.33370.010
Download links
A two-part list of links to download the article, or parts of the article, in various formats.
Downloads (link to download the article as PDF)
Open citations (links to open the citations from this article in various online reference manager services)
Cite this article (links to download the citations from this article in formats compatible with various reference manager tools)
Large-scale two-photon imaging revealed super-sparse population codes in the V1 superficial layer of awake monkeys
eLife 7:e33370.
https://doi.org/10.7554/eLife.33370


