Microglial transglutaminase-2 drives myelination and myelin repair via GPR56/ADGRG1 in oligodendrocyte precursor cells
- Children's Hospital and Harvard Medical School, United States
- F. M. Kirby Neurobiology Center, Children’s Hospital and Harvard Medical School, United States
- Huazhong University of Science and Technology, PR China
- Washington University School of Medicine, United States
- Korea Brain Research Institute (KBRI), South Korea
- University of Michigan Medical Center, United States
Figures
Figure 1 with 1 supplement
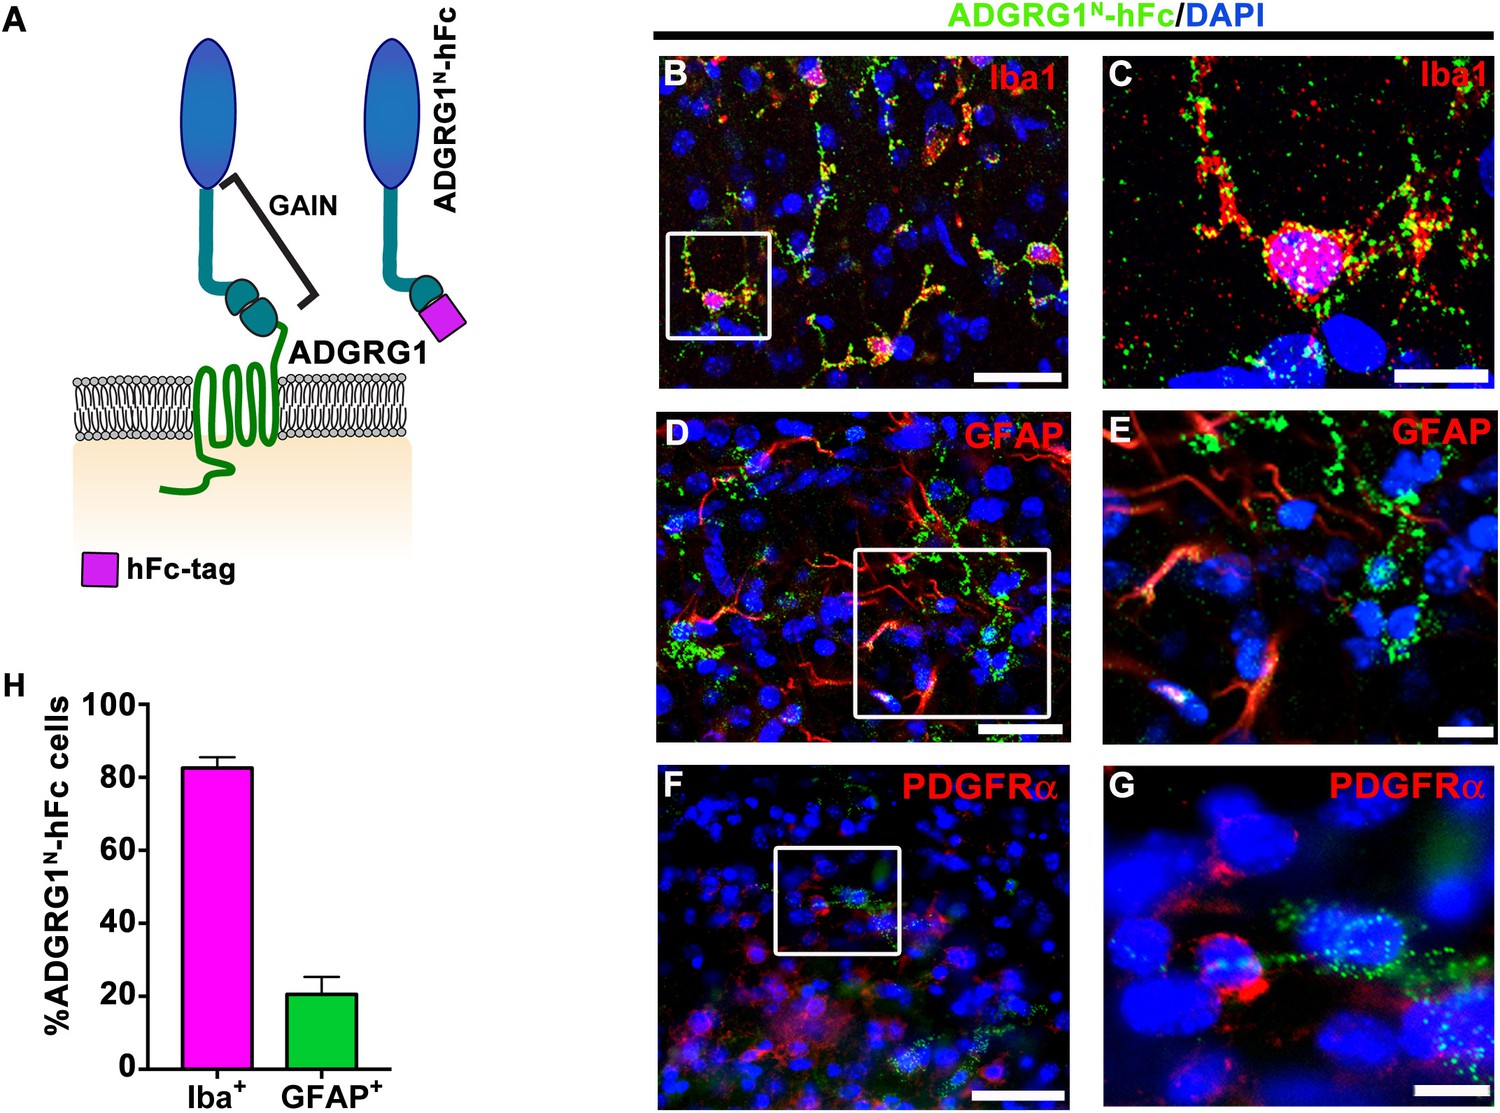
Microglia express the putative ligand of ADGRG1.
(A) Schema of ADGRG1 receptor. GAIN domain and ADGRG1N-hFc are shown. (B, D, and F) Double labeling of ADGRG1N-hFc (green) and Iba1 (B, red), GFAP (D, red), PDGFRα (F, red) in P5 wt corpus callosum. DAPI, blue. Scale bar, 25 µm. (C, E, and G) Higher magnification of the boxed region in (B, D and F). Scale bar, 10 µm. Staining was repeated N = 3–4 animals. (H) Quantification of double positive ADGRG1N-hFc+ and Iba+ cells and ADGRG1N-hFc+ and GFAP+ cells. N = 3–4 per staining.
Figure 1—figure supplement 1
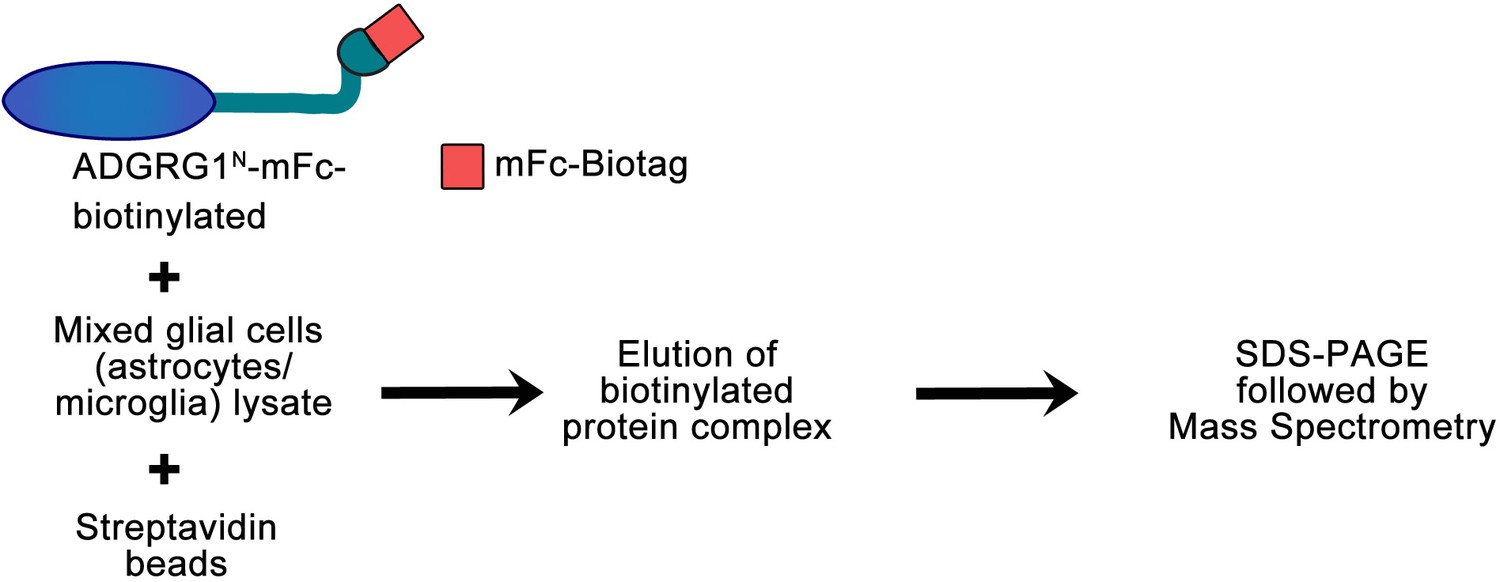
Flow chart of the in vitro biotinylation/proteomic approach.
Biotinylated ADGRG1N-mFc was used to purify ADGRG1 binding partner(s) from mixed glial cell (enriched in microglia and astrocytes) lysate. Protein complexes were subjected to SDS PAGE and tryptic peptide mass spectrometry protein identification after one-step purification with immobilized streptavidin. The whole lane was excised and subjected to tryptic peptide mass spectrometry (MS) protein identification analysis.
Figure 2 with 4 supplements
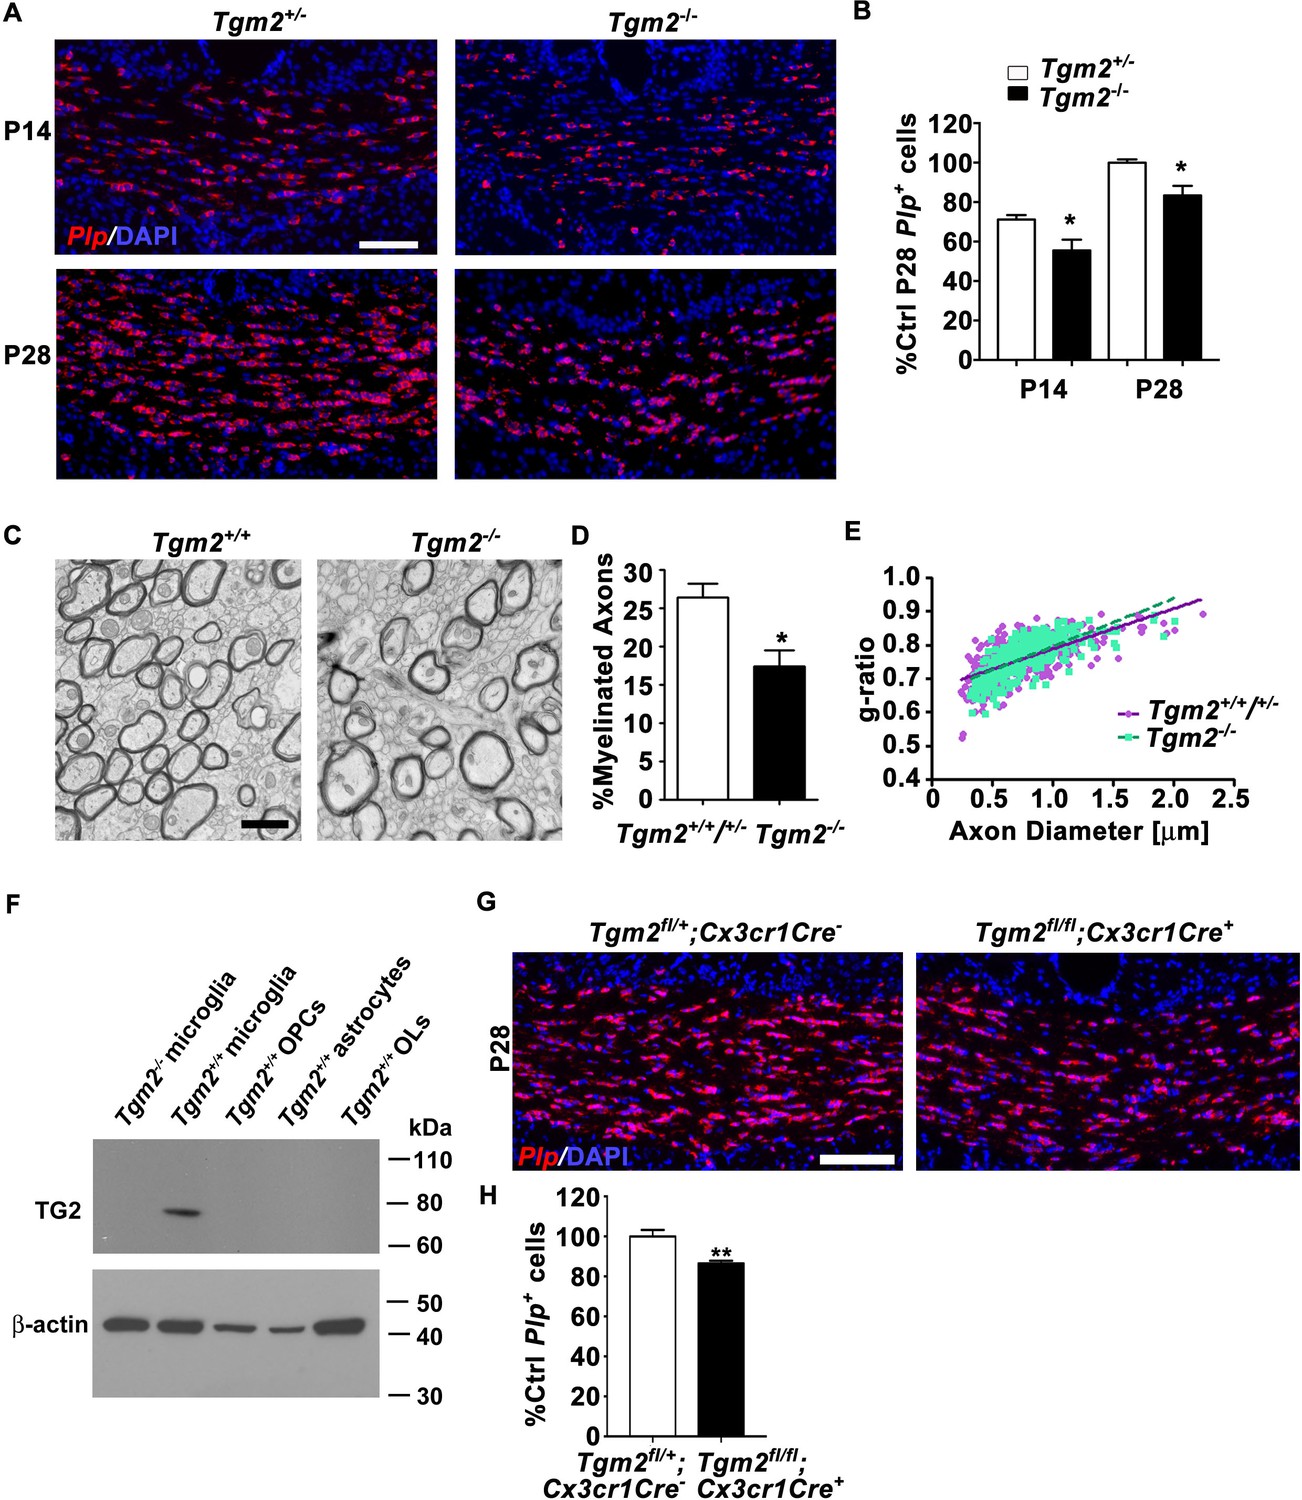
Loss of Tgm2 leads to fewer mature OLs and hypomyelination in the CC.
(A) Representative in situ hybridization (ISH) images of Plp (red) in the CC of P14 (top panel) and P28 (bottom panel) Tgm2+/- and Tgm2-/- mice. DAPI, blue. Scale bar, 100 µm. (B) Quantification of Plp+ oligodendrocytes from the CC of Tgm2+/- and Tgm2-/- P14 and P28 mice. * P=0.0484; N = 5 per genotype (P14); *p=0.0378; N = 4 per genotype (P28), unpaired t-test. (C) Representative TEM images from P28 CC of Tgm2+/+ and Tgm2-/- mice. Scale bar, 1 µm. (D) Percentage of myelinated axons in the CC of control (Tgm2+/+ and Tgm2+/-) and Tgm2-/- mice. *p=0.0299; N = 3 per genotype; unpaired t-test. (E) Scatter plot displaying g-ratio values in the CC of control and Tgm2-/- mice. (F) TG2 western blot on acutely isolated microglia, OPCs, astrocytes, and mature oligodendrocytes from the P7 neonatal brain. β-actin was used as loading control. (G) Representative ISH images of Plp (red) in the CC of P28 Tgm2fl/+;Cx3cr1Cre- and Tgm2fl/fl;Cx3cr1Cre + mice. DAPI, blue. Scale bar, 100 µm. (H) Quantification of Plp+ oligodendrocytes in the CC of P28 Tgm2fl/+;Cx3cr1Cre- and Tgm2fl/fl;Cx3cr1Cre + mice. **p=0.00850; N = 4 per genotype, unpaired t-test. Error bars are means ± s.e.m (B, D, H).
Figure 2—figure supplement 1
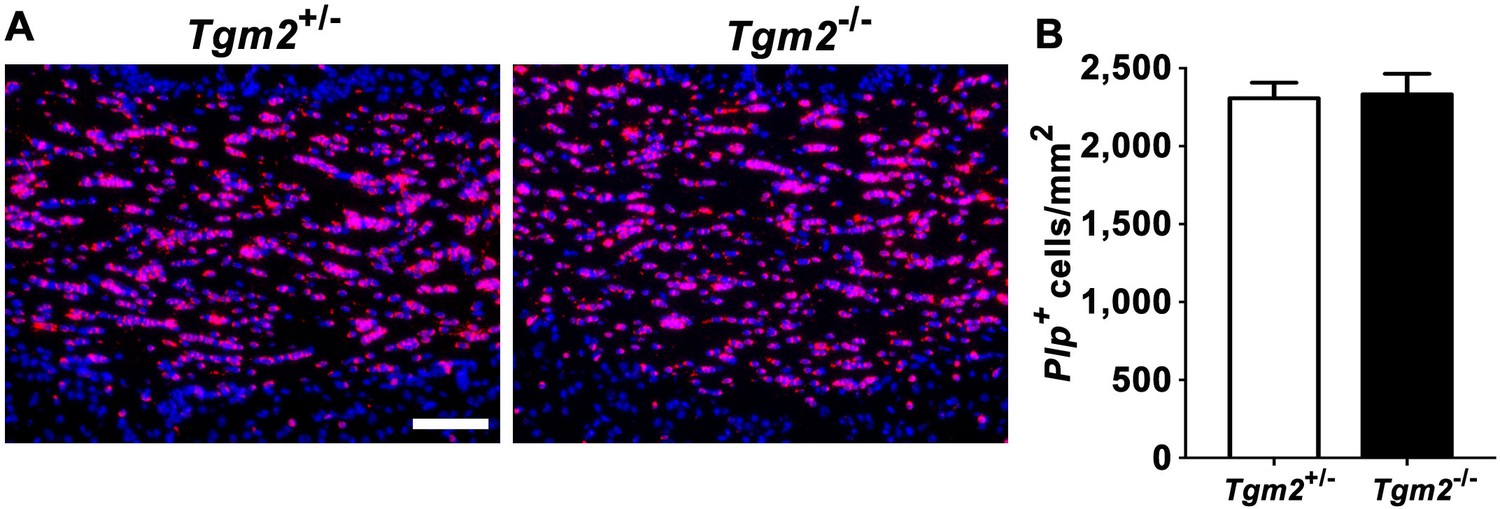
Oligodendrocyte number recovers by 5 month in Tgm2 knockout mice.
(A) Representative images of ISH of Plp in the CC of 4–5 month old Tgm2+/- and Tgm2-/- mice. Scale bar, 100 µm. DAPI, blue. (B) Quantification of Plp+ oligodendrocytes in the CC reveals similar numbers of OLs in the CC of Tgm2+/- and Tgm2-/- mice. * P=0.807, unpaired t-test, N = 3 per genotype. Error bars are means ± s.e.m.
Figure 2—figure supplement 2
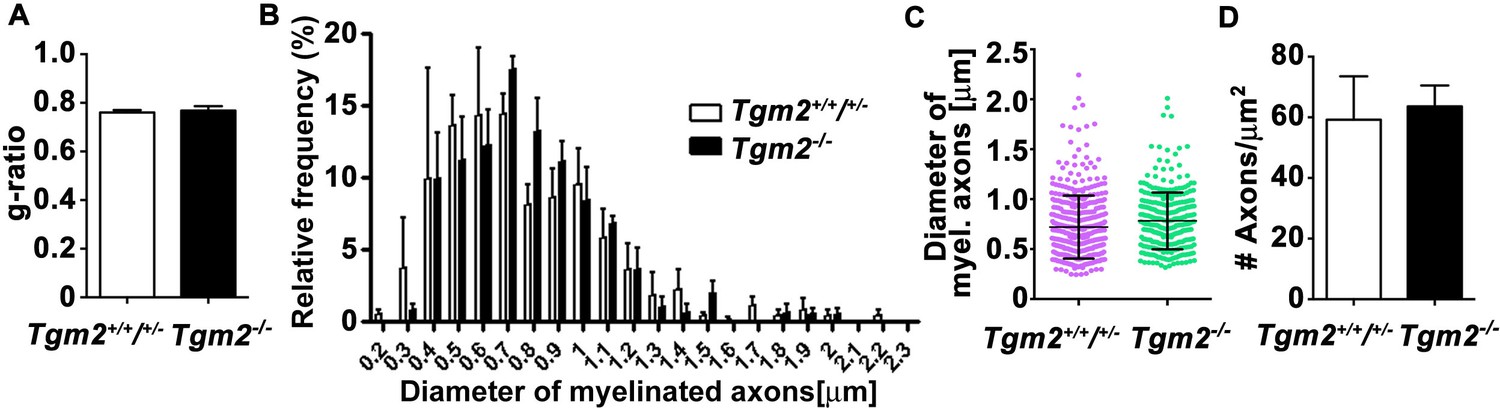
Loss of Tgm2 does not affect g-ratio, myelinated axon distribution, axon diameter or axon number.
(A) Average g-ratio of myelin sheath thickness was comparable in control and Tgm2-/- mice. p=0.728, unpaired t-test, N = 3 per genotype. (B) The distribution of myelinated axons with respect to the axon diameter in the CC of control and Tgm2-/- mice. p=0.8291, two-way ANOVA, p=0.2524, Gaussian non-linear curve fit, N = 3 per genotype. (C) Axon diameter in the CC is comparable in control and Tgm2-/- mice. Mean ± s.d.; p=0.8771; unpaired t-test; N = 3 per genotype. (D) Number of total axons (myelinated and unmyelinated) is comparable in the CC of in control and Tgm2-/- mice at P28. p=0.7947, unpaired t-test, N = 3 per genotype. Error bars are means ± s.e.m (A–D).
Figure 2—figure supplement 3
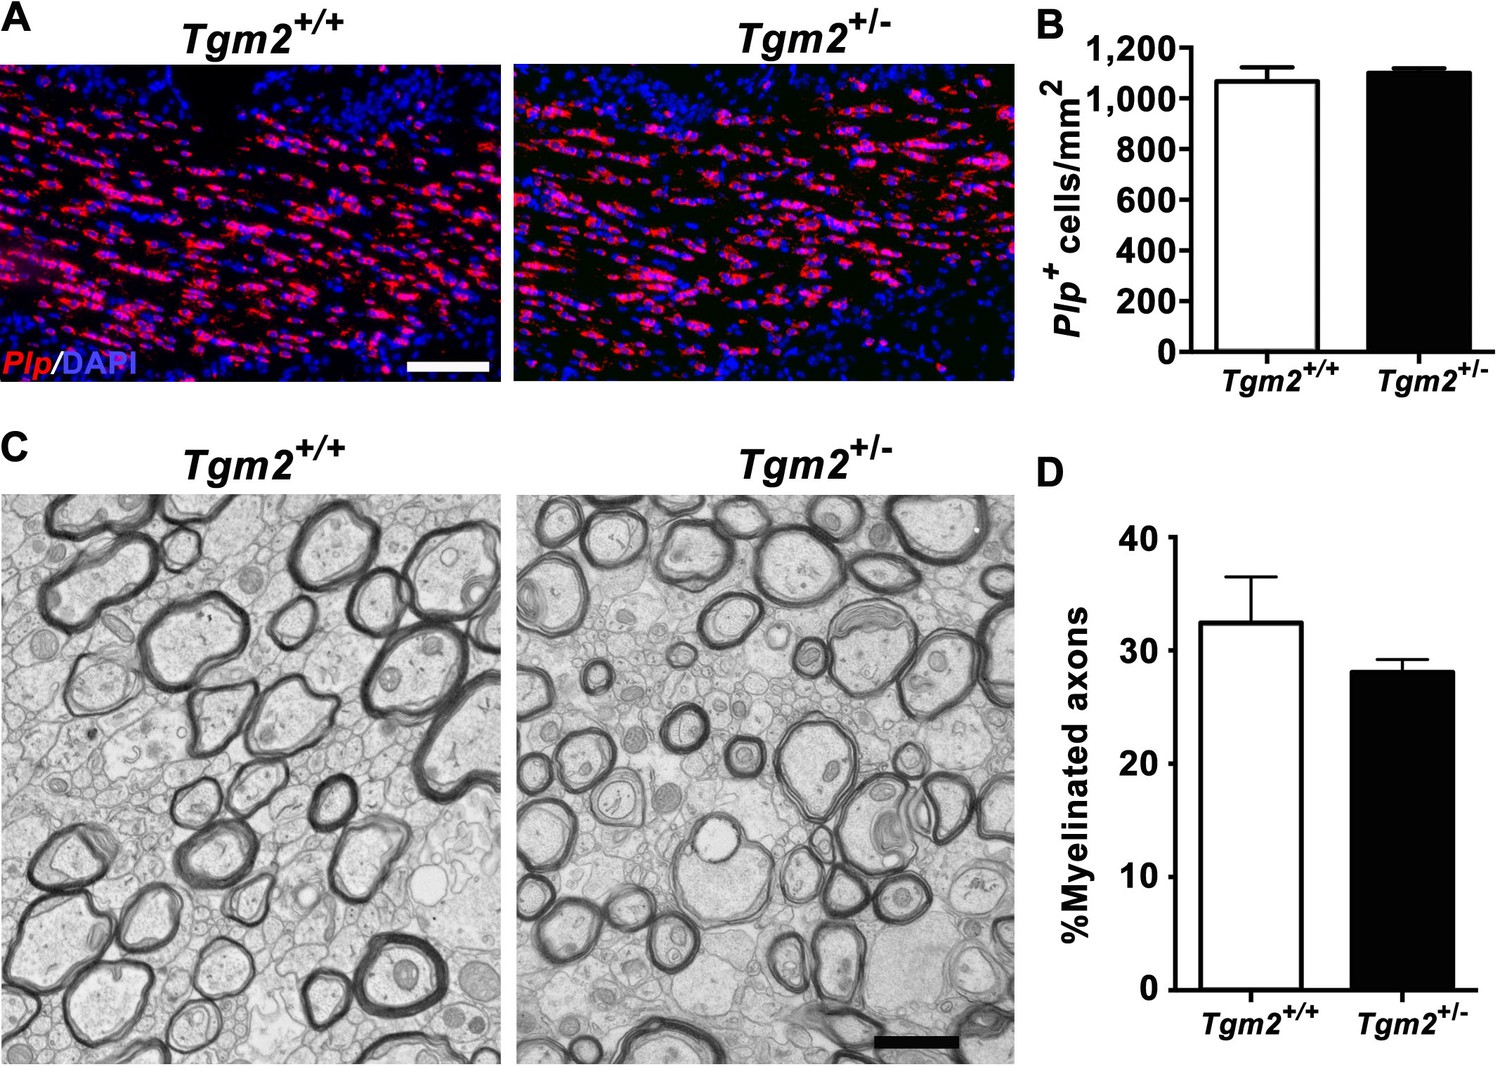
Deleting one allele of Tgm2 has no effect on the number of Plp+ + and myelinated axons.
(A) Representative images of ISH of Plp on P28 in the CC in Tgm2+/+ and Tgm2+/- 100 µm. Scale bar, 100 µm. DAPI, blue. (B) Quantification of Plp+ oligodendrocytes in the CC reveals similar numbers of OLs in the CC of Tgm2+/+ and Tgm2+/- mice. *p=0.6005, unpaired t-test, N = 3 per genotype. (C) Representative TEM images from P28 CC of Tgm2+/+ and Tgm2+/- mice. Scale bar, 1 µm. (D) Percentage of myelinated axons was quantified in the CC in Tgm2+/+ and Tgm2+/- mice. p=0.5129, unpaired t-test, N = 3 per genotype. Error bars are means ± s.e.m (B, D).
Figure 2—figure supplement 4
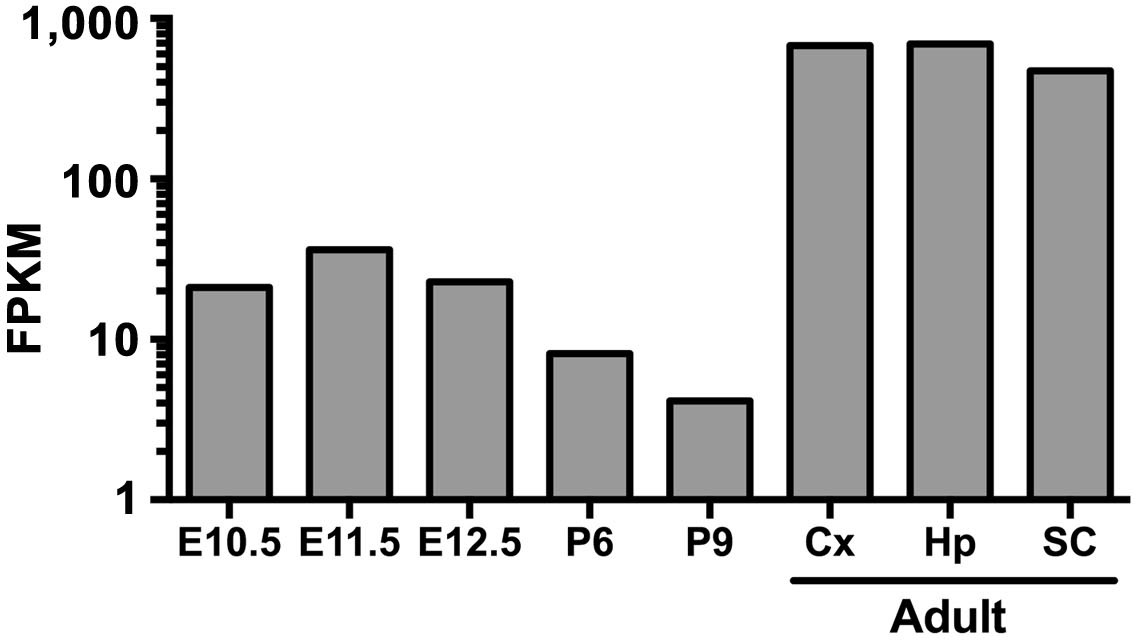
Developmental expression of Tgm2.
Developmental expression of Tgm2 in murine microglia purified from whole brains (E10.5 through P) or brain regions (adult) at the indicated embryonic and postnatal ages. RNA-sequencing data was extracted from public database of (Matcovitch-Natan et al., 2016). Cx: cortex, Hp: hippocampus, SC: spinal cord.
Figure 3 with 1 supplement
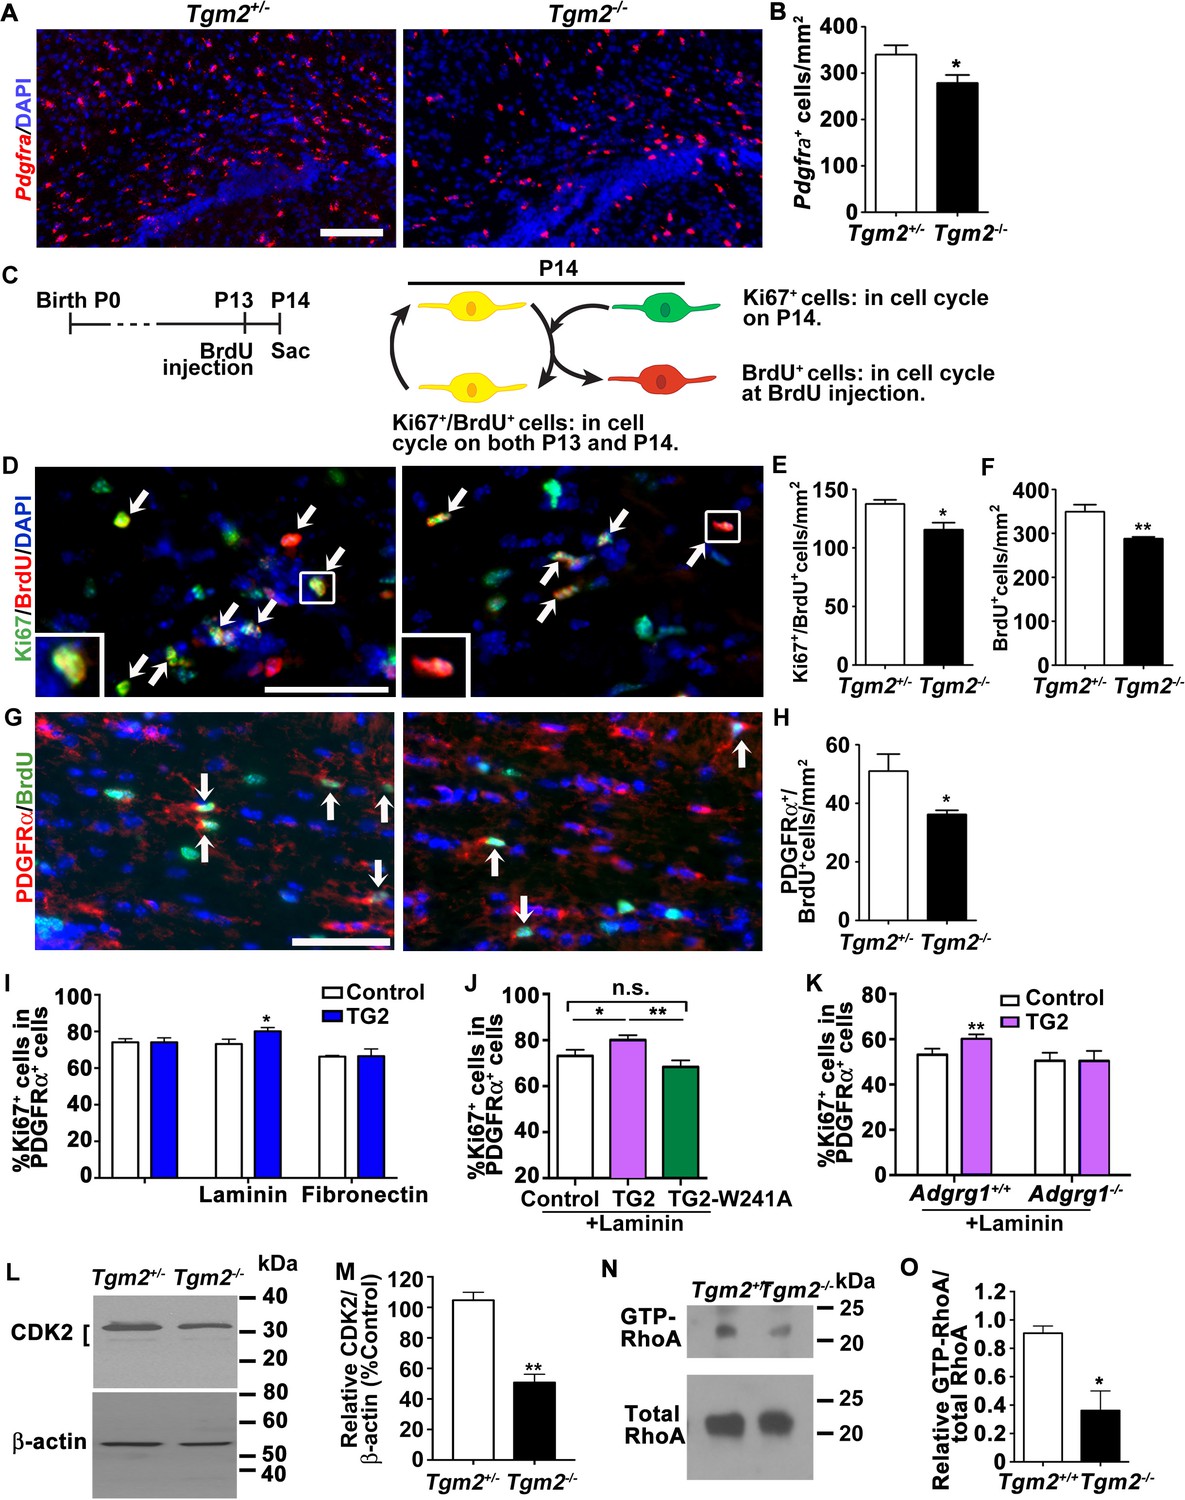
TG2 regulates OPC proliferation through ADGRG1.
(A) Representative ISH images of Pdgfra (red) in the CC of P14 Tgm2+/- and Tgm2-/- mice. DAPI, blue. Scale bar, 100 µm. (B) Quantification of Pdgfra+ OPCs in the CC of control and Tgm2-/- mice. *p=0.0320, unpaired t-test, N = 6 per genotype. (C) Cartoon showing the cell cycle exit assay. (D) Representative images of double IHC of BrdU (red) and Ki67 (green) in the CC of P14 Tgm2+/- and Tgm2-/- mice that were pulsed with BrdU 24 hr earlier (arrows mark double positive Ki67+/BrdU+ cells). DAPI, blue. Scale bar, 50 µm. (E) The density of Ki67+/BrdU+ cells in the CC is lower in Tgm2-/- mice. *p=0.0207, unpaired t-test, N = 5 per genotype. (F) The density of BrdU+ cells in the CC is reduced in Tgm2-/- mice. **p=0.0099, unpaired t-test, N = 5 per genotype. (G) Representative images of double IHC of PDGFRα (red) and BrdU (green) in the CC of P14 Tgm2+/- and Tgm2-/- mice (arrows mark double positive PDGFRα+/BrdU+cells). DAPI, blue. Scale bar, 50 µm. (H) The number of BrdU+/PDGFRα+ cells in the CC is reduced in Tgm2-/- mice. *p=0.0465, unpaired t-test, N = 4 per genotype. Error bars are means ± s.e.m. (I) The effect of recombinant TG2 (rTG2) on OPC proliferation in basal condition, laminin-111 or fibronectin. rTG2 stimulates OPC proliferation only in the presence of laminin-111. *p=0.039, paired t-test, N = 3–6 per group. (J) The effect of wild type TG2 and its enzymatic dead mutant TG2-W241A proteins on OPC proliferation. Only wild type TG2 stimulates OPC proliferation. **p=0.0091; One-way ANOVA followed by Tukey post-hoc test, F(2,14) = 6.7, *p=0.05 (control vs. rTG2); n.s. p=0.70 (control vs. TG2-W241A); **p=0.0088 (TG2 vs. TG2-W241A); (K) Adgrg1-/- OPCs fail to respond to rTG2-enhanced proliferation. *p=0.0063, paired t-test, N = 5 per genotype. (L) Western blot analyses of CDK2 in acutely isolated OPCs from P7 Tgm2+/- and Tgm2-/- brains. The bracket indicates CDK2 protein isoform bands. β-actin was used as loading control. (M) CDK2 protein levels are reduced in the Tgm2-/- mice. ±=0.002, unpaired t-test, N = 3 per genotype. (N) Western blot of active RhoA (top panel) and total RhoA (bottom panel) in the CC of Tgm2+/+ and Tgm2-/- mice. (O) The relative level of active RhoA to total RhoA was diminished in the CC of Tgm2-/- mice compared to Tgm2+/+ control mice. *p=0.0207, unpaired t-test, N = 3 per genotype. Error bars are means ± s.e.m (B, E, F, H, I, J, K, M, O).
Figure 3—figure supplement 1
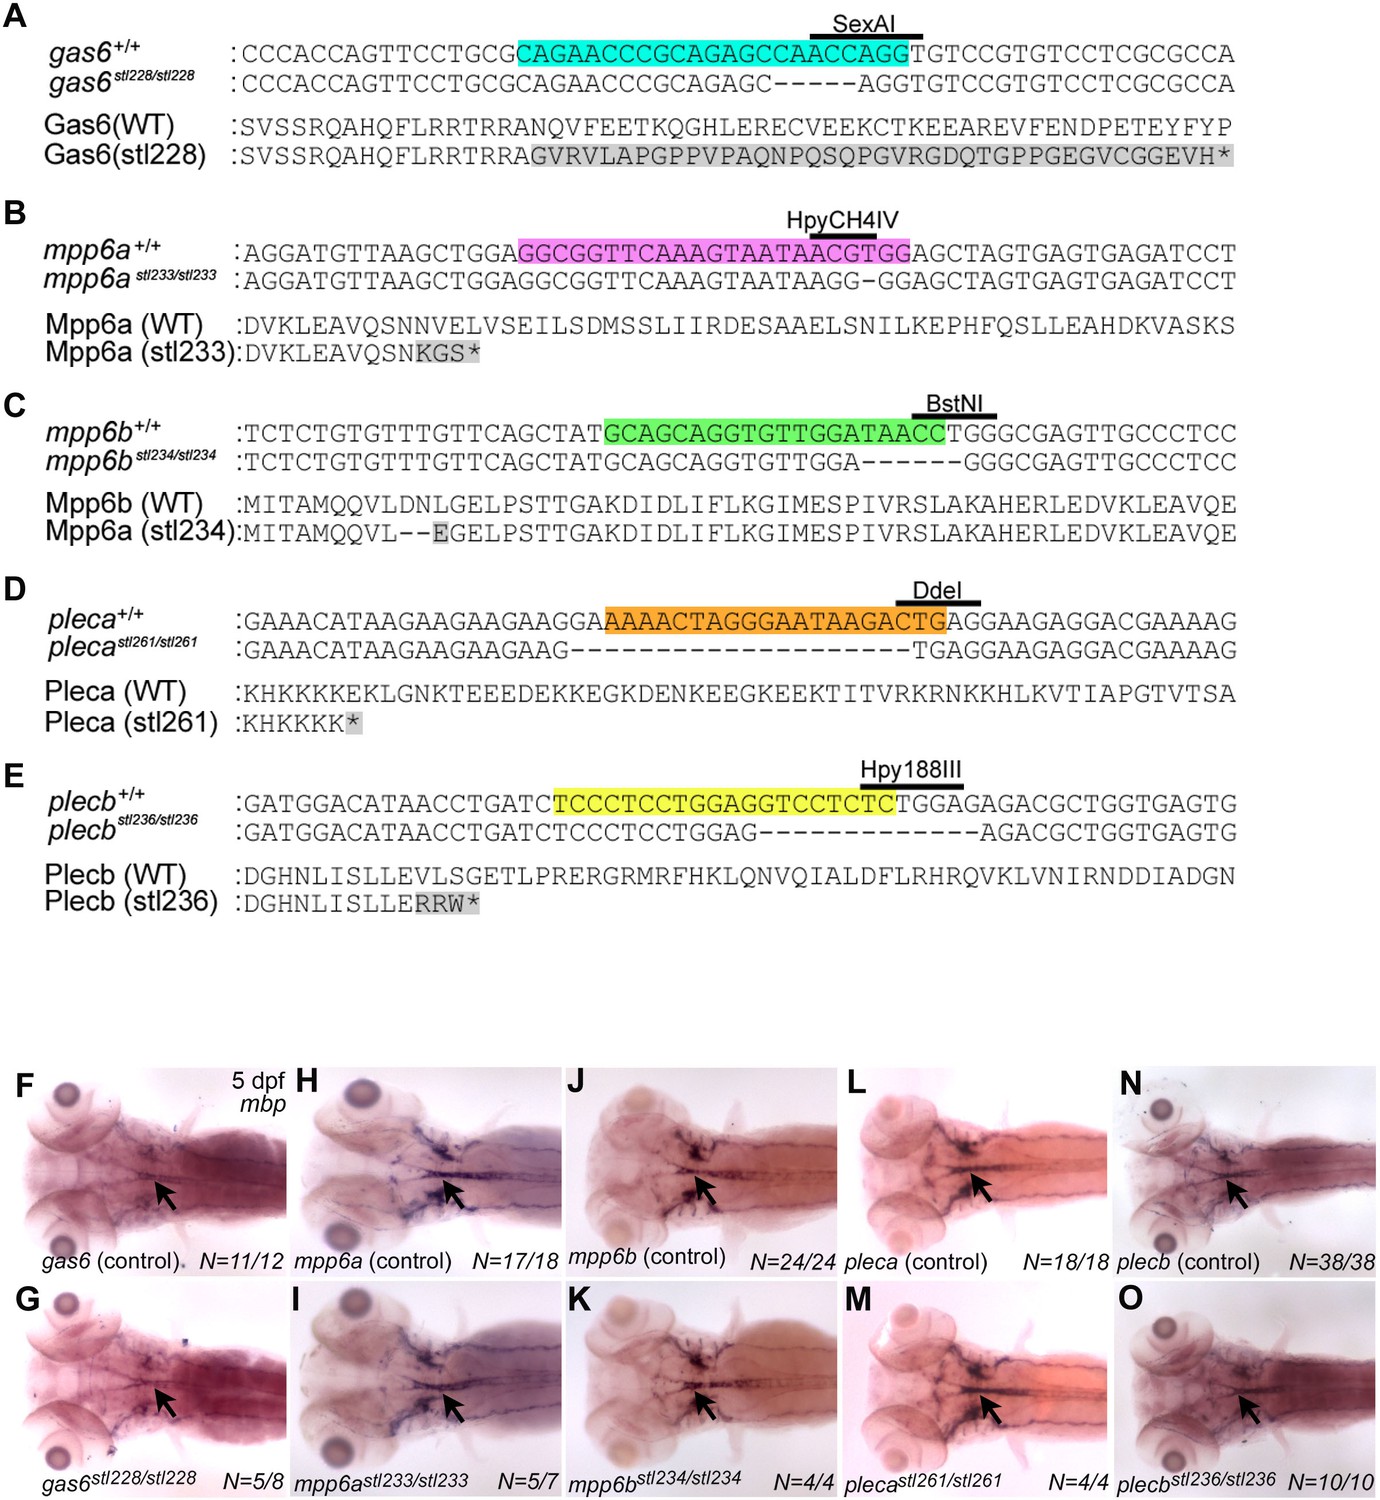
Mutations in gas6, mpp6, and plec do not affect CNS Mbp expression.
(A–E) CRISPR-Cas9 technology was used to generate mutations in zebrafish gas6 (A), mpp6a (B), mpp6b (C), pleca (D), and plecb (E). (A) A CRISPR/Cas9 system guide RNA (gRNA) designed to disrupt exon 2 (targeted sequence highlighted blue and SexAI restriction enzyme site used for genotyping denoted) of gas6 generated gas6stl228, a 4 bp deletion predicted to result in a frameshift and premature STOP. Alignments of wt and mutant nucleotide sequences (top), and predicted wt (706 aa) and mutant (78 aa) protein sequences (bottom) shown. (B) A gRNA designed to disrupt the 3rd coding exon 5 (targeted sequence highlighted purple, and HpyCH4IV restriction enzyme site used for genotyping denoted) of mpp6a generated mpp6astl233, a 1 bp deletion predicted to result in a frameshift and premature STOP. Alignments of wt and mutant nucleotide sequences (top), and predicted wt (550 aa) and mutant (69 aa) protein sequences (bottom) shown. (C) A gRNA designed to disrupt exon 2 (targeted sequence highlighted green and BstNI restriction enzyme site used for genotyping denoted) of mpp6b generated mpp6bstl234, a 6 bp deletion predicted to result in a two amino acid deletion and a single amino acid change within the receptor targeting domain. Alignments of wt and mutant nucleotide sequences (top), and predicted wt (539 aa) and mutant (537 aa) protein sequences (bottom) shown. (D) A gRNA designed to disrupt exon 3 (targeted sequence highlighted orange, and DdeI restriction enzyme site used for genotyping denoted) of pleca generated plecastl261, a 20 bp deletion predicted to result in a frameshift and premature STOP. Alignments of wt and mutant nucleotide sequences (top), and predicted wt (4752 aa) and mutant (103 aa) protein sequences (bottom) shown. (E) A gRNA designed to disrupt the 3rd coding exon (targeted sequence highlighted yellow, and Hpy188III restriction enzyme site used for genotyping denoted) of plecb generated plecbstl236, a 13 bp deletion predicted to result in a frameshift and premature STOP. Alignments of wt and mutant nucleotide sequences (top), and predicted wt (4530 aa) and mutant (111 aa) protein sequences (bottom) shown. (F– O) Whole mount ISH showing mbp expression (CNS denoted by black arrows) at 5 days post-fertilization (dpf) in (F) gas6 control larva (wt and gas6stl228/+, N = 11/12), (G) gasstl228/stl228 mutant larva (N = 5/8), (H) mpp6a control larva (wt and mpp6astl233/+, N = 17/18), (I) mpp6astl233/stl233 mutant larva (N = 5/7), (J) mpp6b control larva (wt and mpp6bstl234/+, N = 24/24), (K) mpp6bstl234/stl234 (N = 4/4), (L) pleca control larva (wt and plecastl261/+, N = 18/18), (M) plecastl261/stl261mutant larva (N = 4/4), (N) plecb control larva (wt and plecbstl236/+, N = 36/38), and (O) plecbstl236/st’236 mutant larva (N = 10/10). Dorsal views are shown for all, anterior to the left. No gross changes in mbp expression were observed in putative ligand mutants relative to sibling controls.
Figure 4 with 1 supplement

ADGRG1 is required for remyelination in vivo.
(A) Representative images of Black-Gold myelin staining of the corpus callosum of Adgrg1fl/fl;PdgfraCreER- and Adgrg1fl/fl;PdgfraCreER+ + after cuprizone feeding for 6 weeks followed by recovery for 3 d (3 DR), 7 d (7 DR) and 10 d (10 DR) (dotted line outlines quantified region). Scale bar, 250 µm. (B) Percentage of remyelinated corpus callosum displayed significant decrease in myelination at 7 DR and 10 DR between Adgrg1fl/fl;PdgfraCreER- and Adgrg1fl/fl;PdgfraCreER+ +. *p=0.0285 (7 DR), N = 4 (cre-); N = 4 (cre+); *p=0.0416 (10 DR), N = 3 (cre-); N = 4 (cre+), unpaired t-test. (C) Number of GSTπ+ OLs are significantly decreased at 10 DR between Adgrg1fl/fl;PdgfraCreER- and Adgrg1fl/fl;PdgfraCreER+ +. *p=0.0457 (10 DR), N = 3 (cre-); N = 3 (cre+), unpaired t-test. (D) Representative images of GSTπ+ OLs in the corpus callosum of Adgrg1fl/fl;PdgfraCreER- and Adgrg1fl/fl;PdgfraCreER+ + 14 days post-lesion (dotted line outlines quantified region). Scale bar, 200 µm. (E) Number of GSTπ+ OLs are significantly decreased 14 days post-lesion between Adgrg1fl/fl;PdgfraCreER- and Adgrg1fl/fl;PdgfraCreER+ +. *p=0.0133, N = 3 (cre-); N = 3 (cre+), unpaired t-test. (F) Representative TEM images from the CC of Tgm2fl/fl;Cx3cr1Cre- and Tgm2fl/fl;Cx3cr1Cre + mice. Scale bar, 1 µm. (D) Percentage of myelinated axons in the CC of Tgm2fl/fl;Cx3cr1Cre- and Tgm2fl/fl;Cx3cr1Cre + mice. *p=0.0493; N = 4 per genotype; unpaired t-test. (E) Scatter plot displaying g-ratio values in the CC of Tgm2fl/fl;Cx3cr1Cre- and Tgm2fl/fl;Cx3cr1Cre + mice.
Figure 4—figure supplement 1
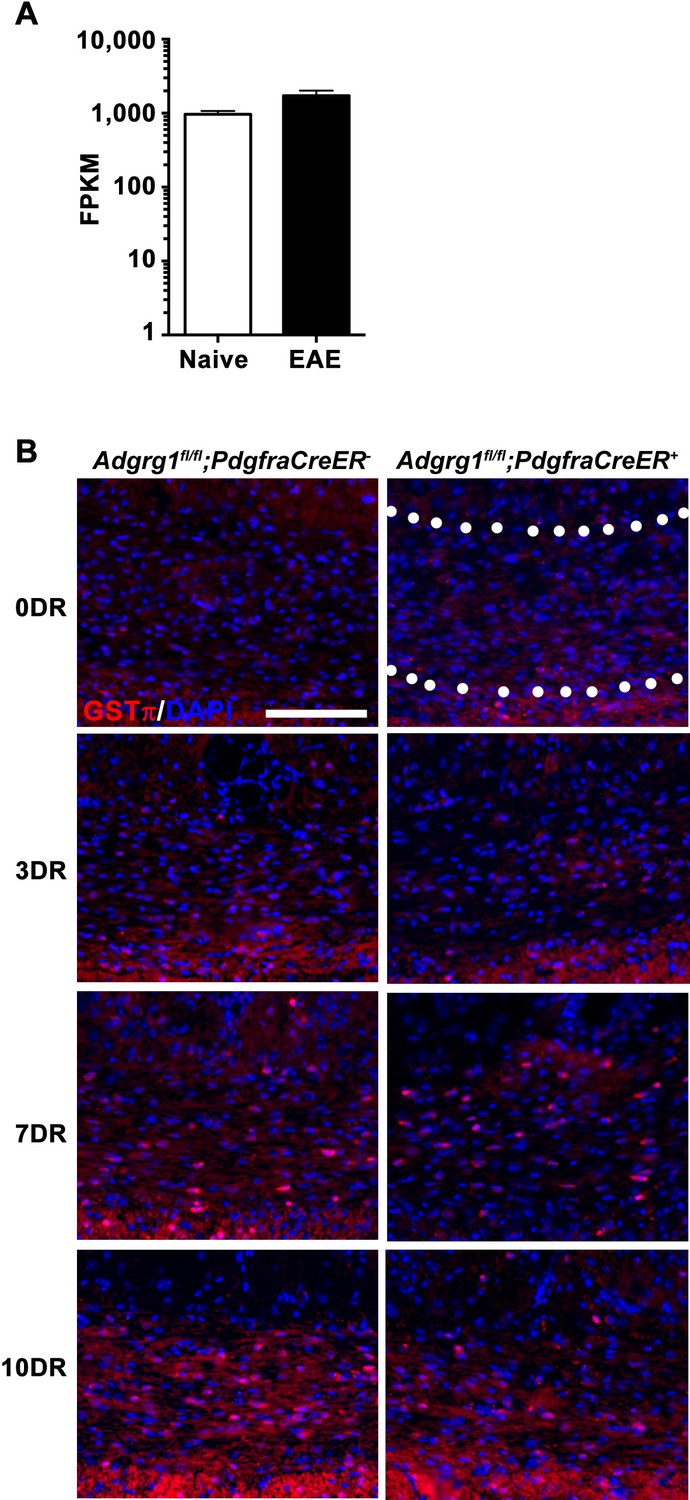
Loss of Adgrg1 in the OL lineage leads to reduced numbers of myelinating OLs.
(A) Expression of Tgm2 in murine microglia purified from naive or EAE brains. RNA-sequencing data was extracted from public database of (Wlodarczyk et al., 2017). (B) Representative images of GSTπ+ OLs of the corpus callosum of Adgrg1fl/fl;PdgfraCreER- and Adgrg1fl/fl;PdgfraCreER + mice after cuprizone feeding for 6 weeks followed by recovery for 3 d (3 DR), 7 d (7 DR) and 10 d (10 DR) (dotted line outlines quantified region). Scale bar, 100 µm.
Figure 5
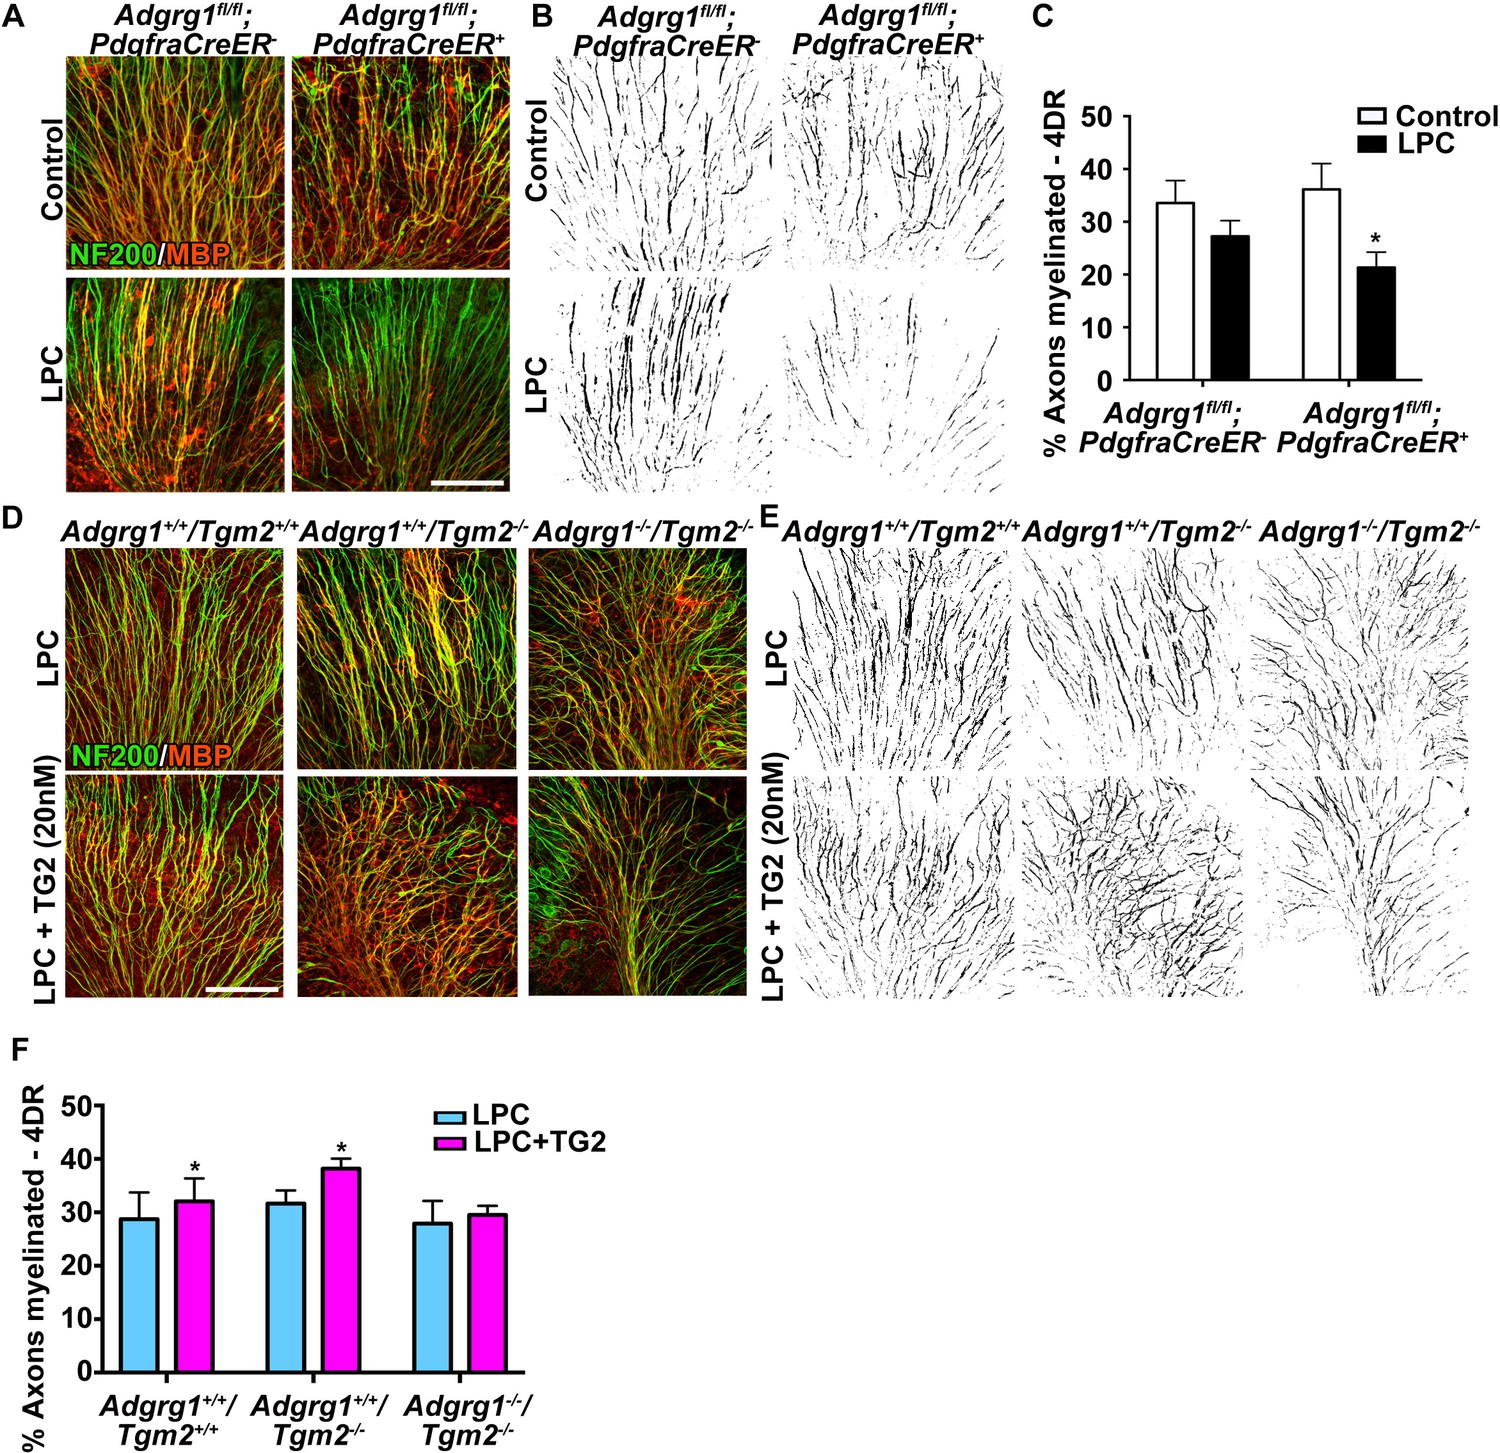
ADGRG1 and its ligand TG2 are required for remyelination.
(A) Representative images of cerebellar slice cultures from P10 Adgrg1fl/fl;PdgfraCreER- and Adgrg1fl/fl;PdgfraCreER+ + cerebella that were demyelinated with LPC for 24 hr followed by 4 days of recovery (4DR). Slices were labeled with NF200 (green) and MBP (red); myelinated fibers appear yellow in merged images. Scale bar, 100 µm. (B) Composite images created in Image J show myelinated axons (black) for quantification. (C) Percentage of myelinated axons after remyelination. Remyelination is reduced in cerebellar slices that lack OPC-derived ADGRG1. *p=0.0135, paired t-test, N = 5 per genotype. (D) Representative images of cerebellar slice cultures from P10 Adgrg1+/+;Tgm2+/+, Adgrg1+/+;Tgm2-/- and Adgrg1-/-;Tgm2-/- mouse cerebella that were demyelinated with LPC for 24 hr followed by 4 days of remyelination in the presence or absence of rTG2 (20 nM). Slices were immunostained with NF200 (green) and MBP (red); myelinated fibers appear yellow in merged images. Scale bar, 100 µm. (E) Composite images created in Image J show myelinated axons (black) for quantification. (F) Percentage of myelinated axons. Recombinant TG2 promotes remyelination in Adgrg1+/+;Tgm2+/+ and Adgrg1+/+;Tgm2-/-, but not Adgrg1-/-;Tgm2-/- cerebellar slices. *p=0.0475 (Adgrg1+/+;Tgm2+/+), *p=0.0197 (Adgrg1+/+;Tgm2-/-), paired t-test, N = 5–6 per genotype. Error bars are mean ± s.e.m (C, F)..
Figure 6
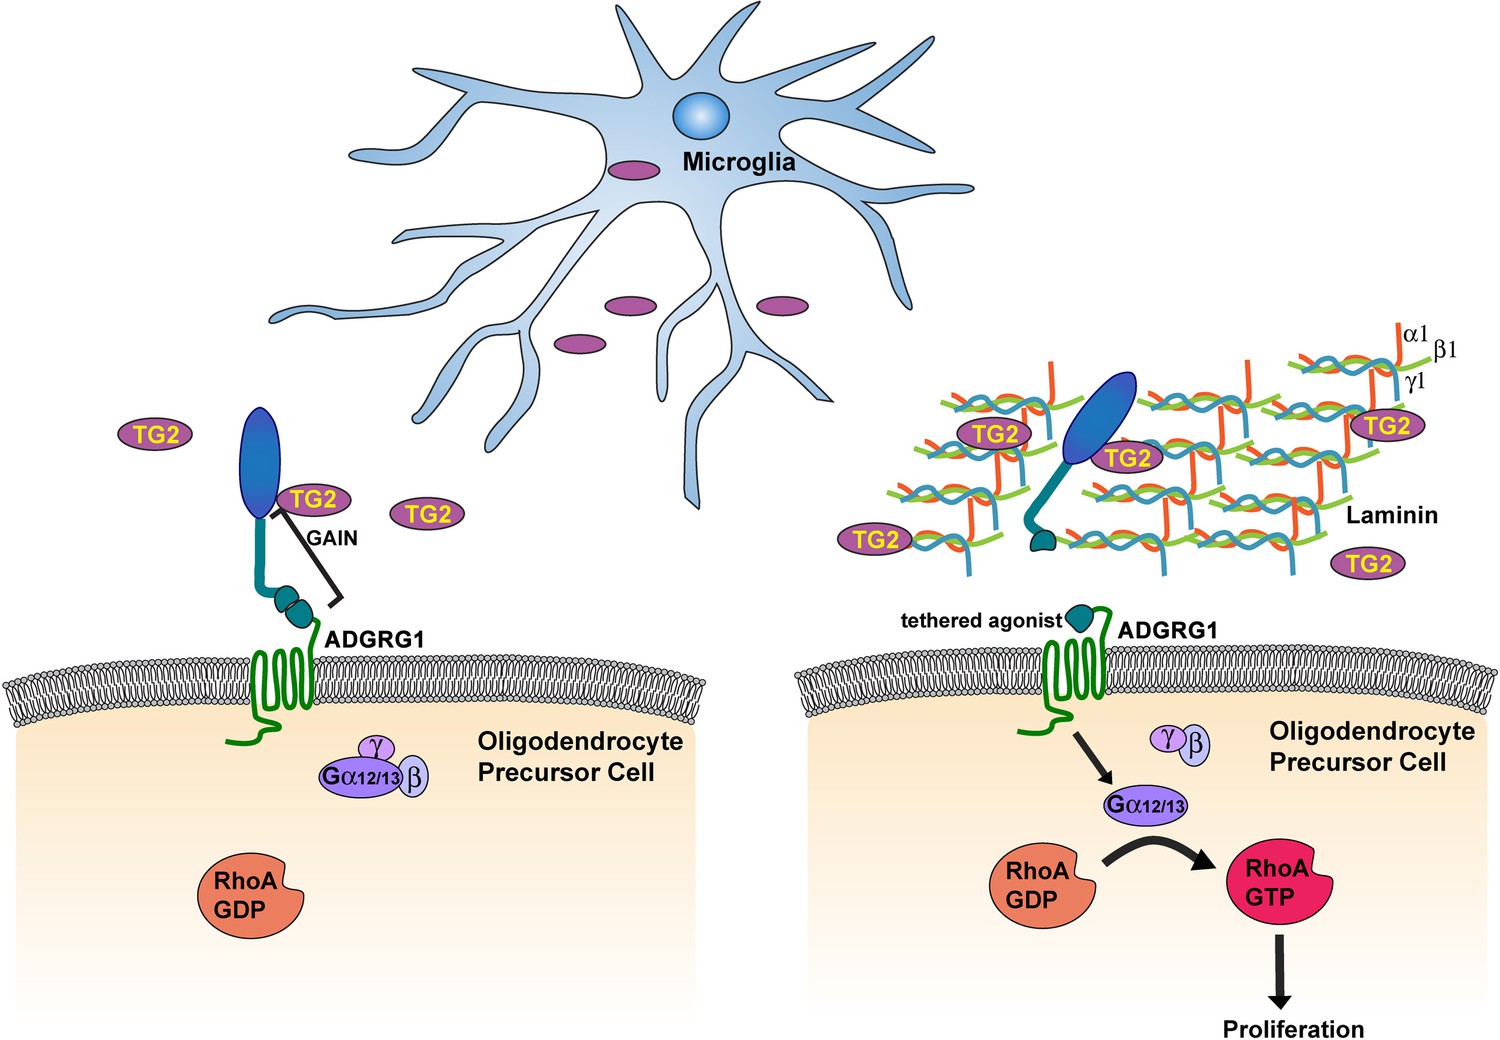
Microglia promote OPC proliferation via ADGRG1 signaling.
TG2, secreted by microglia, binds ADGRG1 but fails to activate the receptor in the absence of ECM protein laminin-111. The binding of TG2 and laminin-111 to ADGRG1 leads to the dissociation of the ADGRG1 NTF from its CTF, allowing the tethered agonist to initiate G-protein signaling, culminating in activated RhoA, which promotes OPC proliferation. GAIN, GPCR-Autoproteolysis-INducing.
Tables
Table 1
Summary of mass spectrometry results from three independent purifications.
Total number of peptides sequences in each individual experiment specific for binding to ADGRG1N.
| Protein name (Gene ID) | Peptide number (Exp1 + Exp2+Exp3) |
|---|---|
| Plectin (Plec) | 21 + 22 + 23 |
| Transglutaminase 2 (Tgm2) | 19 + 20 + 17 |
| GPR56/ADGRG1 (Gpr56/Adgrg1) | 12 + 11 + 9 |
| Growth arrest-specific 6 (Gas6) | 11 + 9 + 11 |
| Sodium/potassium-transporting ATPase subunit alpha-1(Atp1a1) | 8 + 7 + 9 |
| Aspartyl-tRNA synthetase (Dars) | 8 + 3 + 8 |
| Membrane protein, palmitoylated 6 (Mpp6) | 8 + 5 + 11 |
| Microtubule-actin crosslinking factor 1 (Macf1) | 8 + 13 + 8 |
Key resources table
| Reagent type (species) or resource | Designation | Source or reference | Identifiers | Additional information |
|---|---|---|---|---|
| Strain, strain background (M. musculus) | Adgrg1 knockout mice | Genentech/Lexicon Genetics | ||
| Strain, strain background (M. musculus) | Tgm2 knockout mice | Dr. Gerry Melino, University of Rome, Italy PMID: 11113189 | ||
| Strain, strain background (M. musculus) | Adgrg1fl/+ | Dr. Xianhia Piao, Boston Children's Hospital, Boston MA, PMID: 25607655 | ||
| Strain, strain background (M. musculus) | PdgfraCre/ERT | Jackson Laboratory | Cat# 018280 | |
| Strain, strain background (M. musculus) | Tgm2fl/+ | Dr. Joan Cook-Mills, Northwestern University, Chicago, IL PMID: 11274171 | ||
| Strain, strain background (M. musculus) | Cx3cr1Cre | Jackson Laboratory | Cat# 025524 | |
| Antibody | mouse anti-Thy1.2 | Serotec | MCA02R | 12 µl in 10 ml |
| Antibody | mouse anti-GalC | Millipore | MAB342 | 12 µl in 10 ml |
| Antibody | mouse anti-ADGRG1 (H11) | Dr. Xianhia Piao, Boston Children's Hospital, Boston MA, PMID: 21768377 | (1:200) (IHC) | |
| Antibody | rabbit anti-ADGRG1 (199) | Dr. Xianhia Piao, Boston Children's Hospital, Boston MA, PMID: 18509043 | (1:200) (IHC) | |
| Antibody | rabbit anti-MBP | Millipore | AB980 | (1:200) (IHC) |
| Antibody | rabbit anti-Iba1 | Wako | 019–19741 | (1:400) (IHC) |
| Antibody | rabbit anti-GFAP | Abcam | ab7260 | (1:1000) (IHC) |
| Antibody | rabbit anti-NG2 | Millipore | AB5320 | (1:200) (IHC) |
| Antibody | rat anti-PDGFRα | BD Bioscience | 558774 | (1:500) (IHC) |
| Antibody | rabbit anti-PDGFRα | Cell Signaling Technologies | 3164S | (1:500) (IHC) |
| Antibody | rat anti-Ki67 | Affymetrix eBioscience | 14-5698-80 | (1:100) (IHC) |
| Antibody | rat anti-BrdU | Accurate Chemical and Scientific Corporation | OBT0030S | (1:100) (WB) |
| Antibody | mouse anti-RhoA | Cytoskeleton | ARH03-A | (1:500) (WB) |
| Antibody | mouse anti-CDK2 | Santa Cruz | sc-6248 | (1:1000) (WB) |
| Antibody | mouse anti-β-actin | Sigma | A5044 | (1:5000) (WB) |
| Antibody | mouse anti-NF200 | Sigma | N0142 | (1:500) (IHC) |
| Antibody | rat anti-MBP | Abcam | ab7349 | (1:200) (IHC) |
| Antibody | rabbit anti-GSTπ | Enzo | ADI-MSA-102-E | (1:500) (IHC) |
| Antibody | mouse anti-Ki67 | BD Bioscience | 550609 | (1:100) (IHC) |
| Antibody | goat anti mouse IgG-HRP | Sigma | A4416 | (1:3000) (WB) |
| Antibody | goat anti mouse or rabbit IgG-HRP | Sigma | A6154 | (1:3000) (WB) |
| Antibody | goat anti-mouse IgG-Alexa 488 | ThermoFisher | A-11001 | (1:1000) (IHC) |
| Antibody | goat anti-rat IgG-Alexa 488 | ThermoFisher | A-11006 | (1:1000) (IHC) |
| Antibody | goat anti-rat IgG-Alexa 546 | ThermoFisher | A-11081 | (1:1000) (IHC) |
| Antibody | goat anti-rabbit IgG-Alexa 555 | ThermoFisher | A-21428 | (1:1000) (IHC) |
| Antibody | goat anti-rabbit IgG-Alexa 546 | ThermoFisher | A-11035 | (1:1000) (IHC) |
| Recombinant DNA reagent | Pdgfra plasmid | Dr. Charles Stiles, Dana-Farber Cancer Institute, Boston, MA | ||
| Recombinant DNA reagent | Plp plasmid | Addgene | 22651 | |
| Sequence-based reagent | Adgrg1 common | Integrated DNA Technologies (IDT) | 5′- CGAGAAGACTTC CGCTTCTG −3 | 20 µM |
| Sequence-based reagent | Adgrg1 wt | Integrated DNA Technologies (IDT) | 5′- AAAGTAGCTAAG ATGCTCTCC −3’ | 20 µM |
| Sequence-based reagent | Adgrg1 knockout | Integrated DNA Technologies (IDT) | 5′- GCAGCGCATCG CCTTCTATC −3’ | 20 µM |
| Sequence-based reagent | Adgrg1fl/+ common | Integrated DNA Technologies (IDT) | 5′- TGGTAGCTAACCTACT CCAGGAGC −3′ | 20 µM |
| Sequence-based reagent | Adgrg1fl/+ wt | Integrated DNA Technologies (IDT) | 5′- GGTGACTTTGGTG TTCTGCACGAC −3′ | 20 µM |
| Sequence-based reagent | Adgrg1fl/+ floxed | Integrated DNA Technologies (IDT) | 5′- CACGAGACTAGTGA GACGTGCTA −3′ | 20 µM |
| Peptide, recombinant protein | laminin I | R and D Systems | 3400-010-01 | |
| Peptide, recombinant protein | fibronectin | Millipore | 341668 | |
| Commercial assay or kit | DIG RNA labeling kit | Roche Applied Science | 11175025910 | |
| Chemical compound, drug | BlackGold | Millipore | AG105 | |
| Chemical compound, drug | L-α-lyso-Lecithin, Egg Yolk | Millipore-Sigma | 440154 | LPC injections |
| Chemical compound, drug | L-α-Lysophosphatidylcholine from egg yolk | Sigma-Aldrich | L4129 | for organotypic slice culture |
| Chemical compound, drug | tamoxifen | Sigma-Aldrich | T5648 | 100 mg/kg/day tamoxifen for five consecutive days for adults; 50 mg/kg/day for three consecutive days for pups |
| Software, algorithm | Graphpad | GraphPad Software, La Jolla, CA 92037 USA | ||
| Software, algorithm | ImageJ | (http://rsb.info.nih.gov/ij/) |
Additional files
-
Transparent reporting form
- https://doi.org/10.7554/eLife.33385.016
Download links
A two-part list of links to download the article, or parts of the article, in various formats.
Downloads (link to download the article as PDF)
Open citations (links to open the citations from this article in various online reference manager services)
Cite this article (links to download the citations from this article in formats compatible with various reference manager tools)
Microglial transglutaminase-2 drives myelination and myelin repair via GPR56/ADGRG1 in oligodendrocyte precursor cells
eLife 7:e33385.
https://doi.org/10.7554/eLife.33385


