Origin and evolution of the nuclear auxin response system
- Wageningen University, Netherlands
- University of California, United States
- University of Cologne, Germany
- University of Alberta, Canada
- BGI-Shenzhen, China
Figures
Figure 1 with 3 supplements
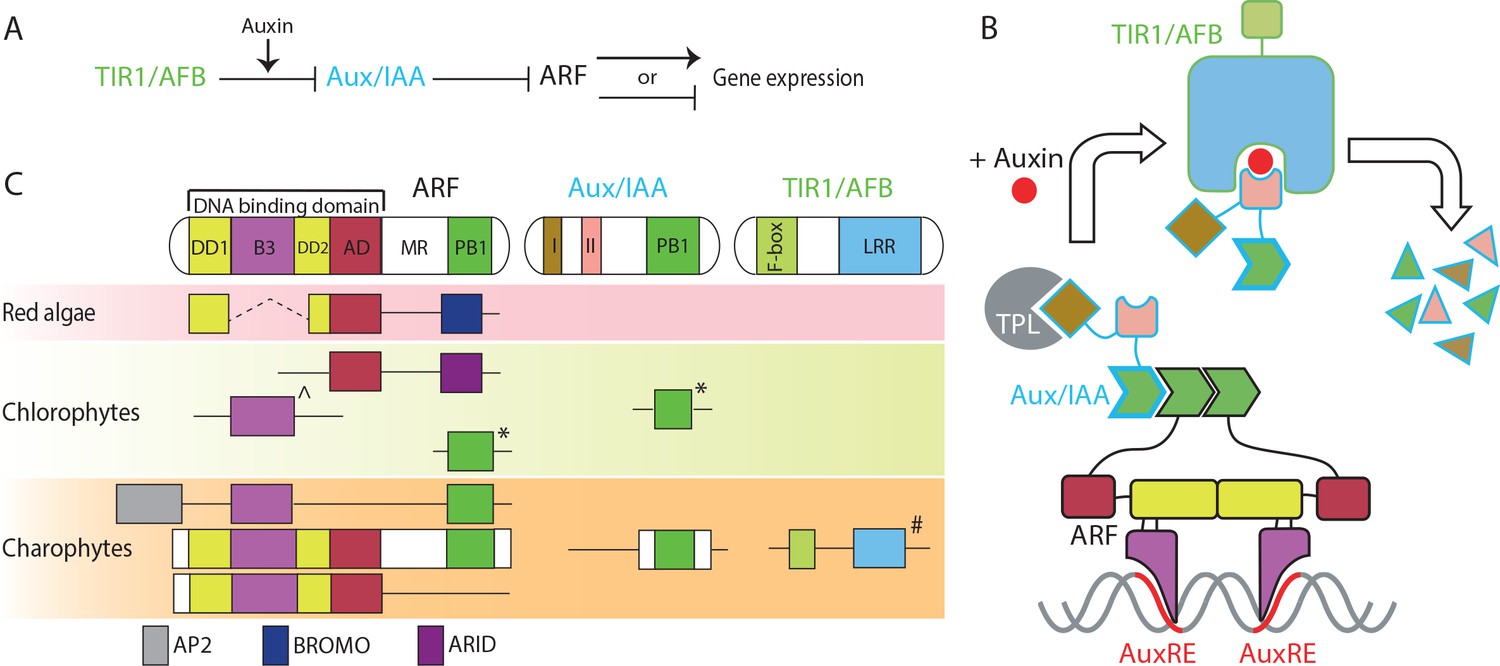
Proteins in nuclear auxin pathway; mechanism and origin of the domains.
(A, B) Scheme of NAP in land plants. In the absence of auxin, Aux/IAA inhibit ARF via their PB1 domains, and by recruiting the TPL co-repressor. Auxin stabilizes the interaction between Aux/IAA and TIR1/AFB, followed by proteasome-mediated degradation of Aux/IAA. (C) Domain structure of NAP components in land plants and presence of each domain in algae, as recovered in transcriptomes. (Sub-)domains are indicated by colors, that match those in (B). ^: basal to all B3-type transcription factors in land plants, *: difficult to assign to ARF or Aux/IAA family; #: forming basal clade to both TIR1/AFB and COI1 in land plants.
Figure 1—figure supplement 1

The work flow of phylogenetic tree construction.
https://doi.org/10.7554/eLife.33399.004
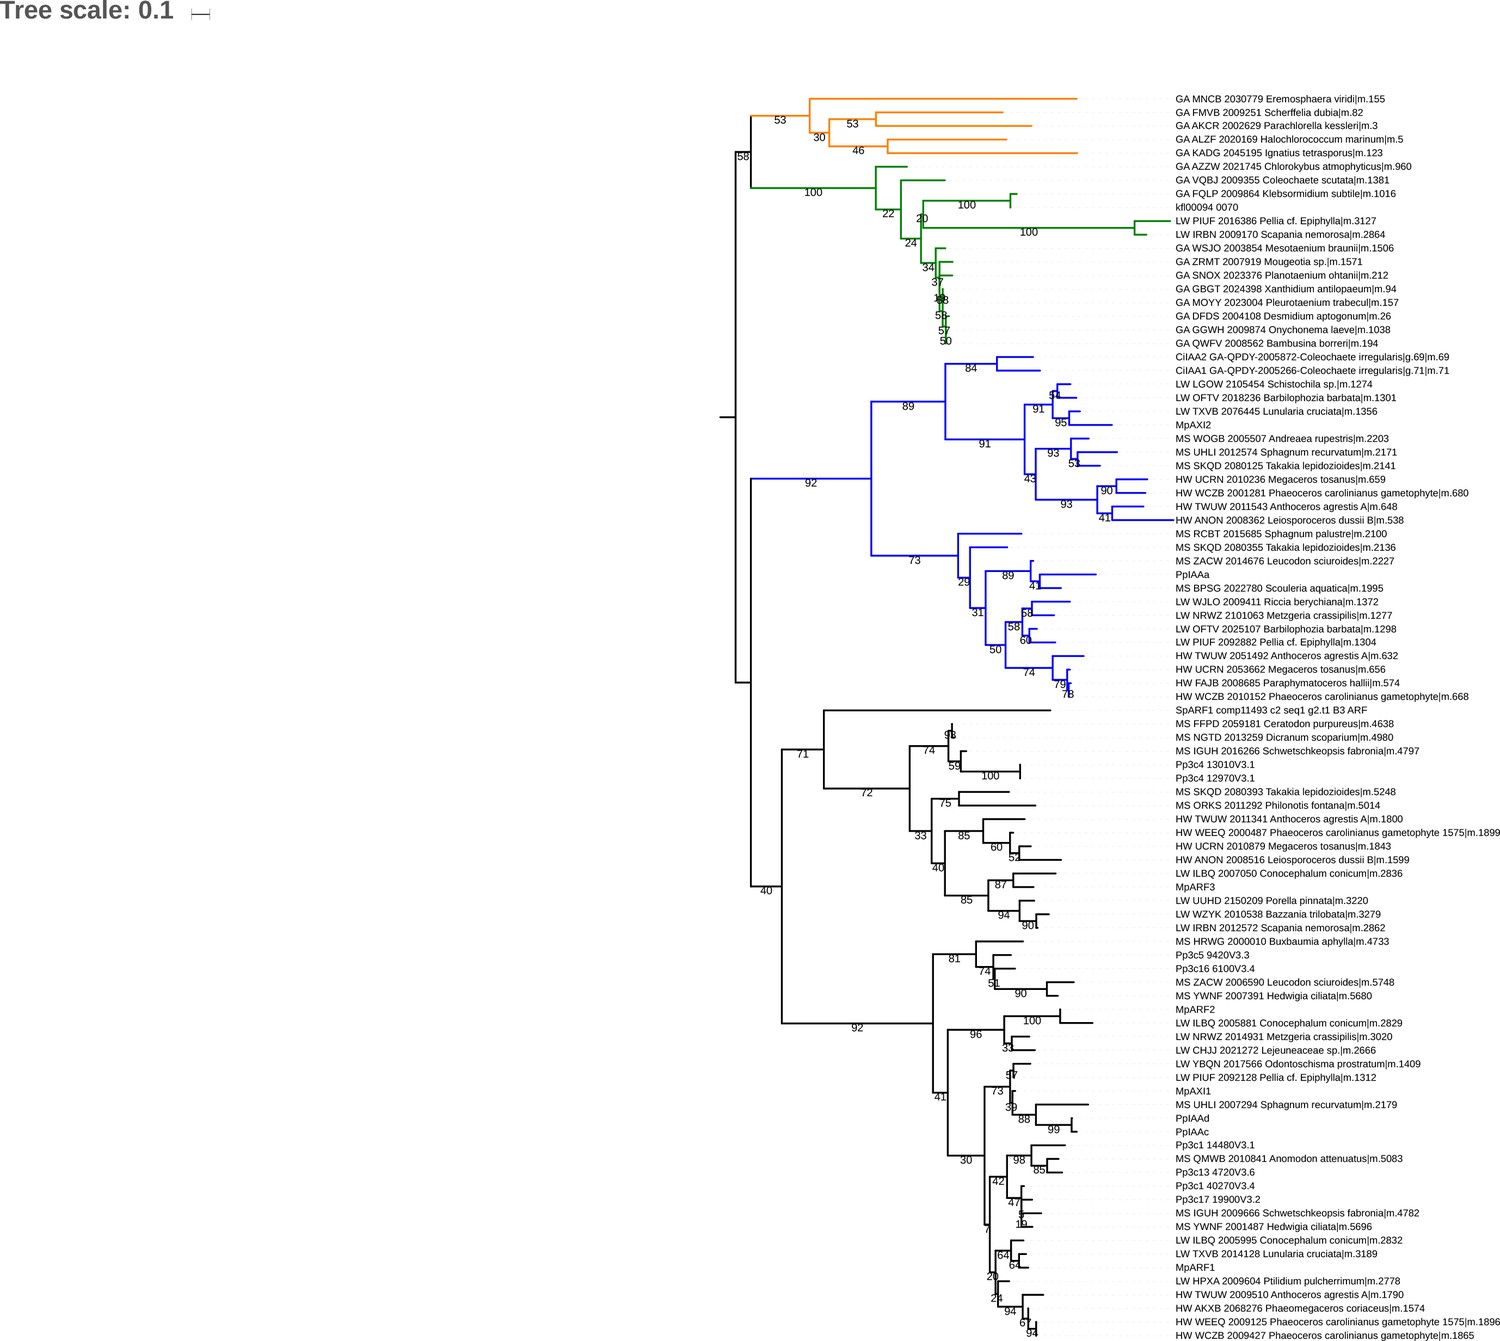
Figure 1—figure supplement 2
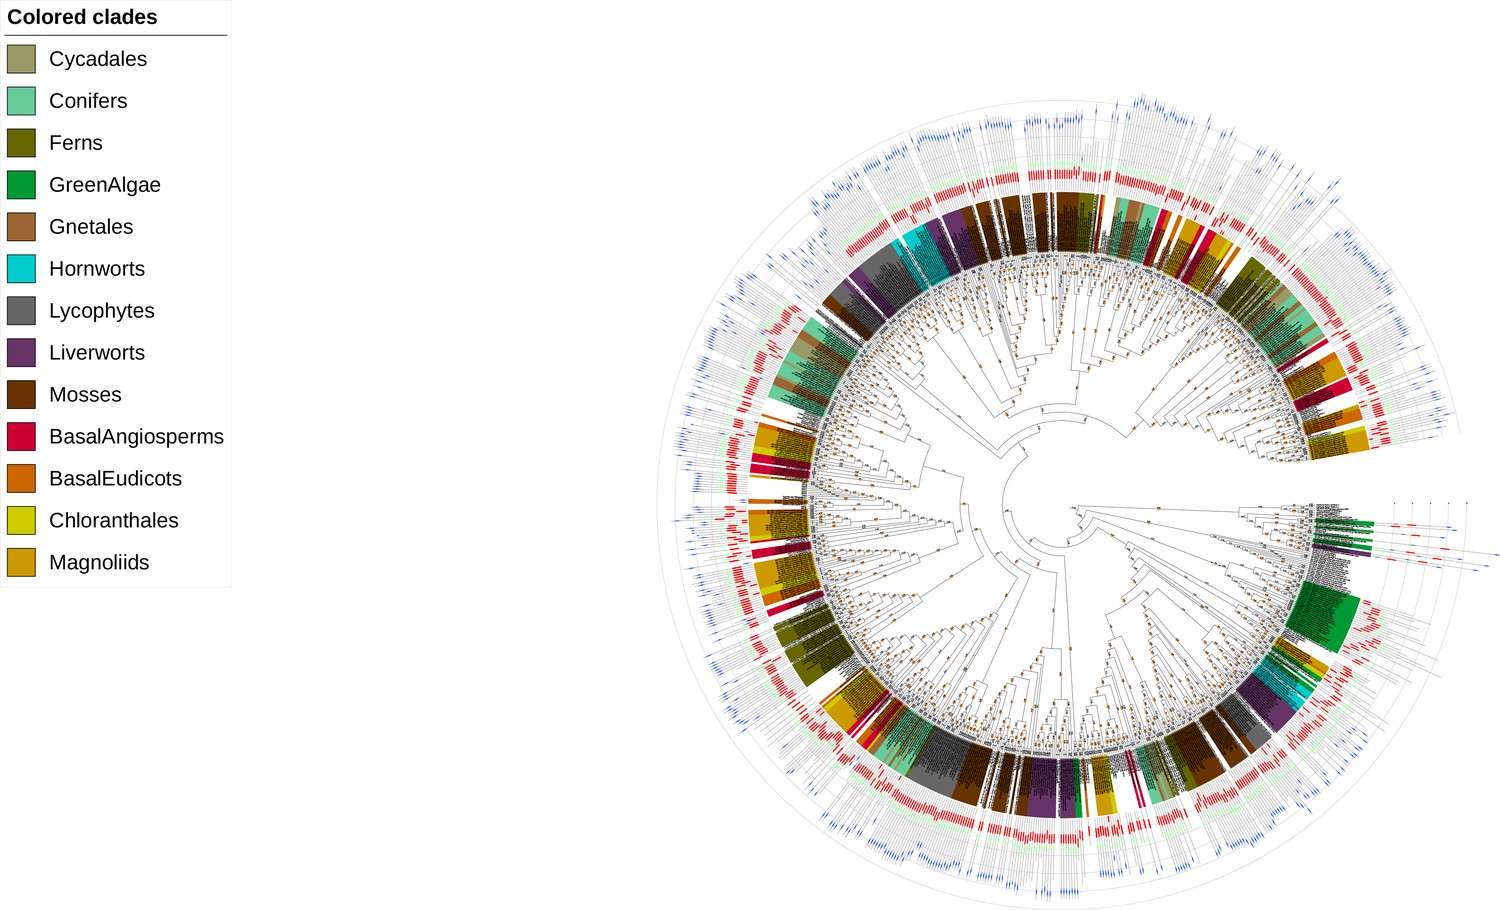
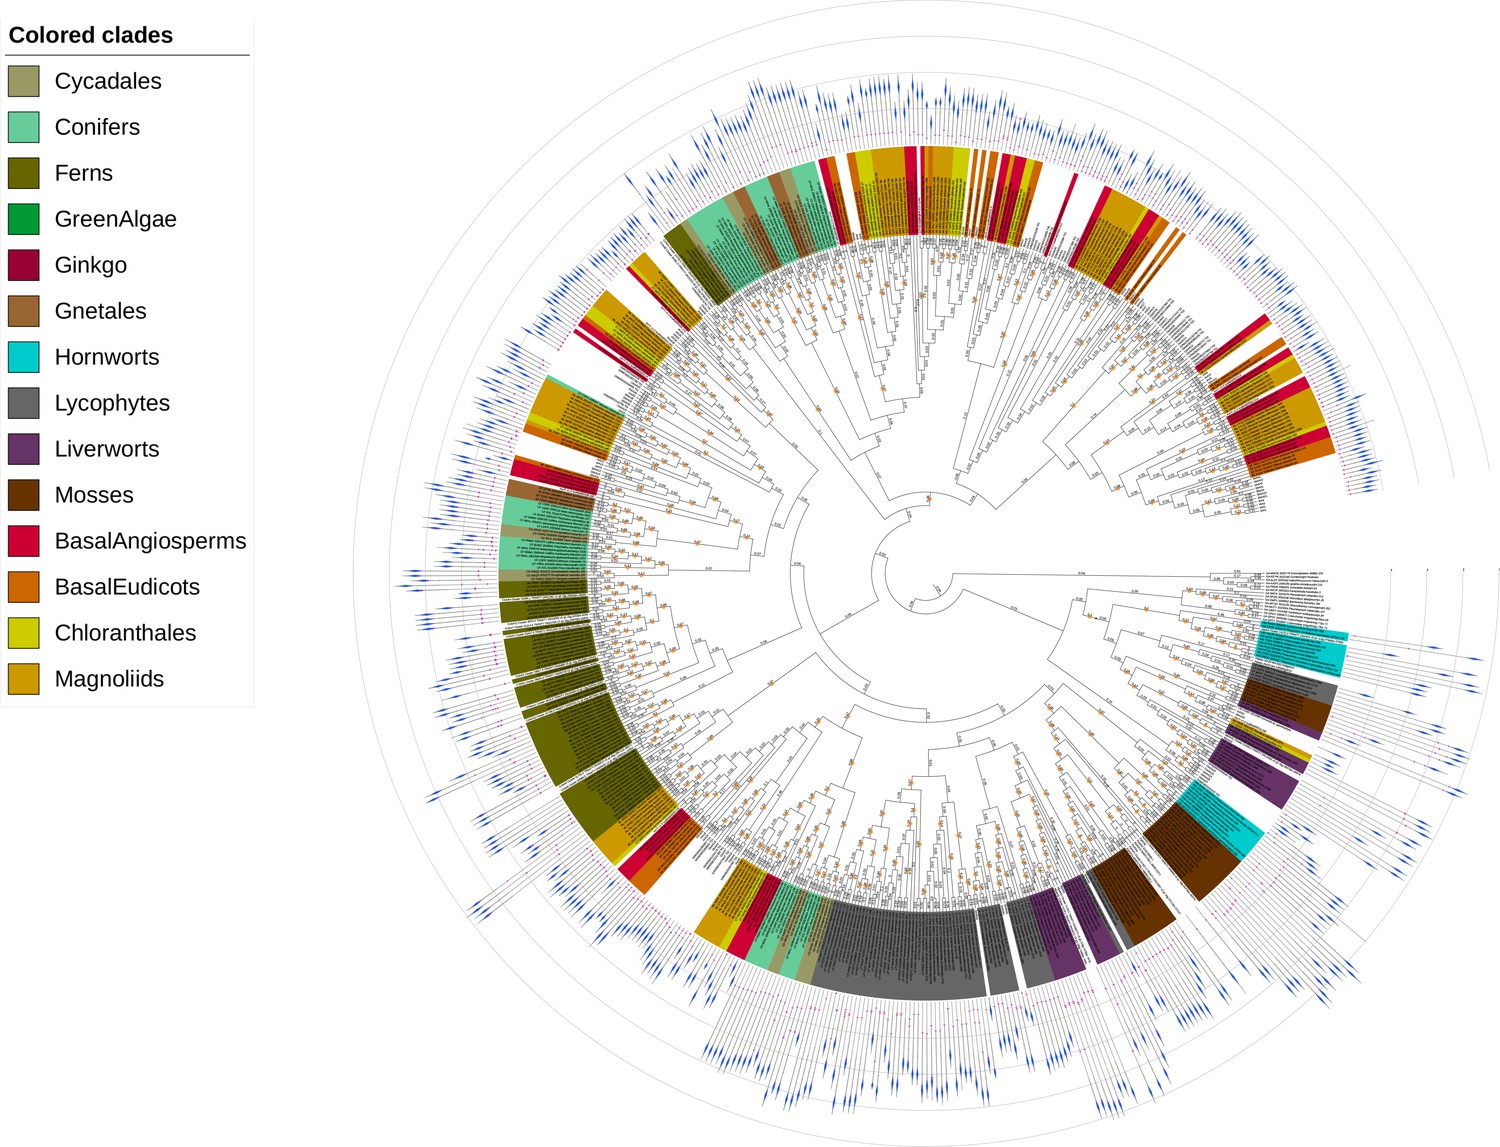
Phylogenetic tree of ARF and RAV proteins.
Label color shows the taxonomic group of each protein as indicated in the box above. Numbers along with the branches indicate branch length. Orange circles indicate the bootstraps higher than 75. Colored boxes connected with gray bar shows the domain structure of each protein. Red: B3, green: DD2 + AD, blue: PB1, gray: AP2. The complete tree can be found at http://itol.embl.de/shared/dolfweijers (interactive Tree of Life; iTOL).
Figure 1—figure supplement 3
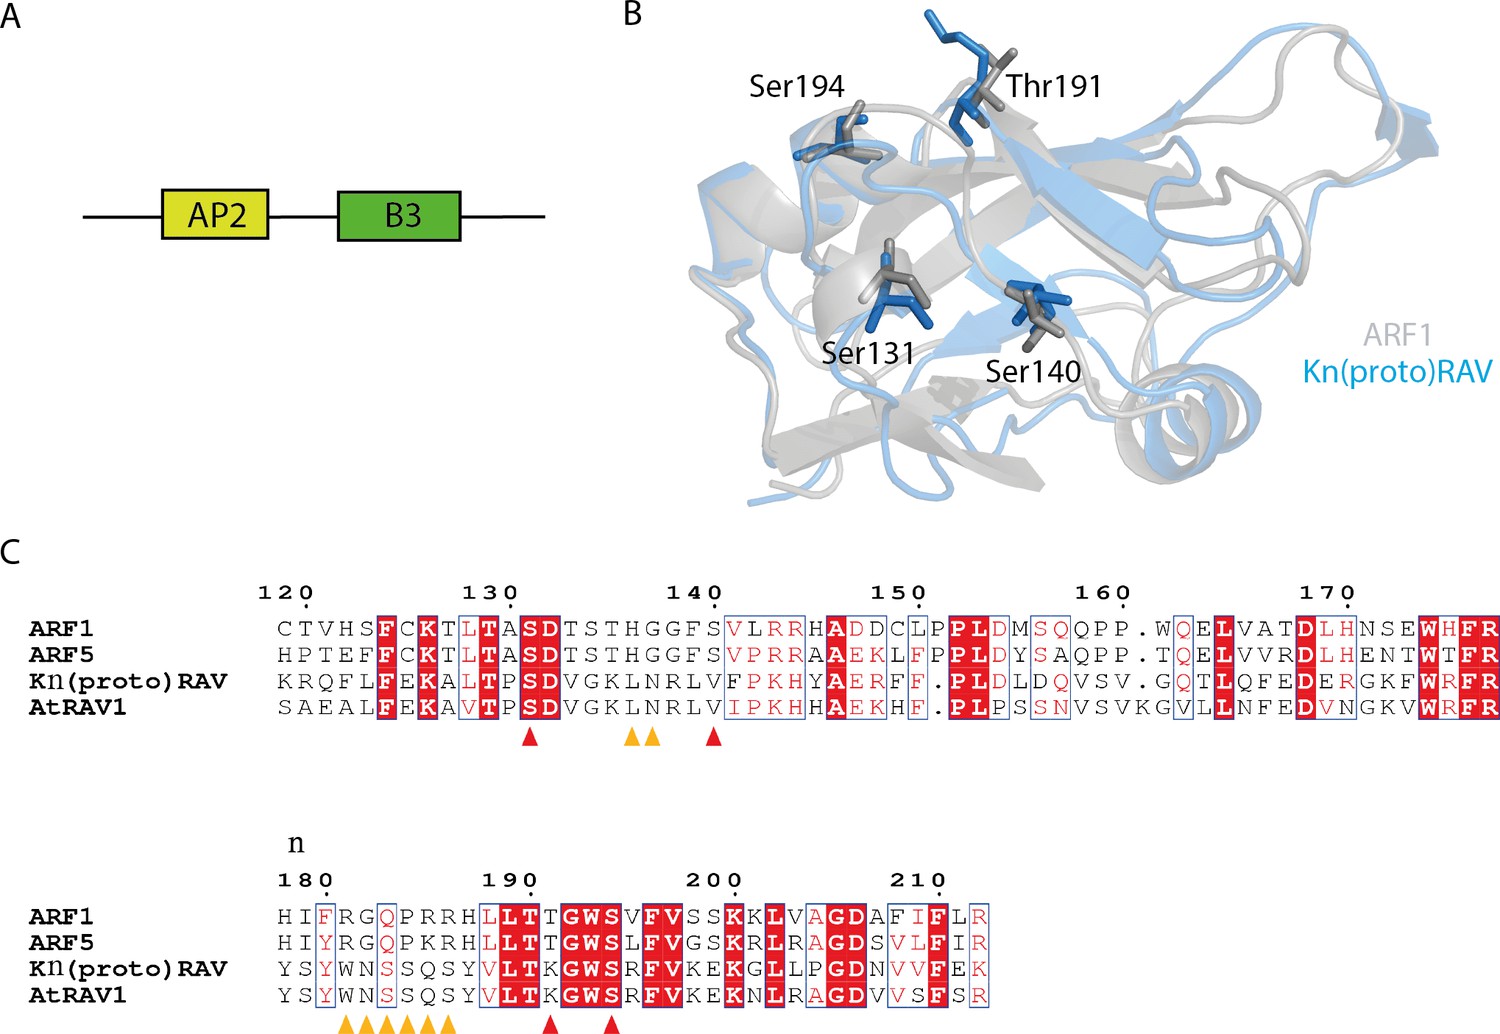
DNA-binding domain of RAV proteins.
(A) Domain structure of RAV proteins in land plants. (B) Homology models for B3 domain of A. thaliana ARF1 (gray) and K. nitens proto-RAV are merged. Four serine residues which are critical for DNA binding of ARF is indicated as stick model. (C) Multiple alignment for B3 domain of ARFs and (proto-)RAVs. Numbering is based on the ARF1 protein of A. thaliana. Red and orange triangles indicate the residues which are important for DNA interaction in ARF proteins.
Figure 2 with 1 supplement
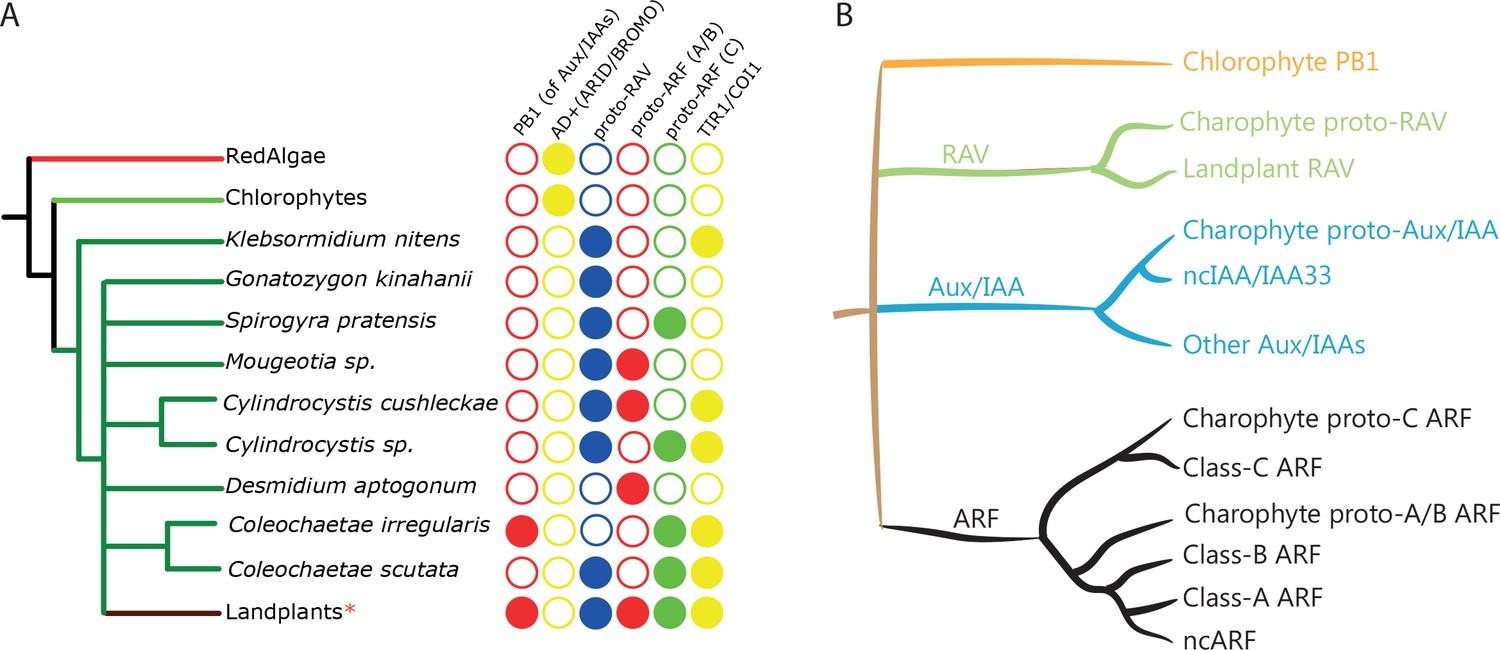
Distribution of auxin signaling proteins precursors in algal lineages.
(A) Occurrence of NAP components in red algae, chlorophytes, and charophytes. Empty circles and filled circles indicate the absence and presence of that particular component, respectively. *: Land plants have defined three classes of ARFs, RAV without PB1, and separate TIR1/AFB and COI1 receptors. (B) Schematic illustration of the phylogenetic arrangement of RAV1, Aux/IAA and ARFs based on the DBD tree and PB1 tree. Note that only branches with strong bootstrap support are shown.
Figure 2—figure supplement 1
Phylogenetic tree based on PB1 domain.
Colored branches indicate protein families. Orange: Chlorophytes, green: proto-RAV, blue: Aux/IAA, black: (proto-)ARF. Numbers along with the branches indicate bootstrap values. The complete tree can be found at http://itol.embl.de/shared/dolfweijers (interactive Tree of Life; iTOL).
Figure 3
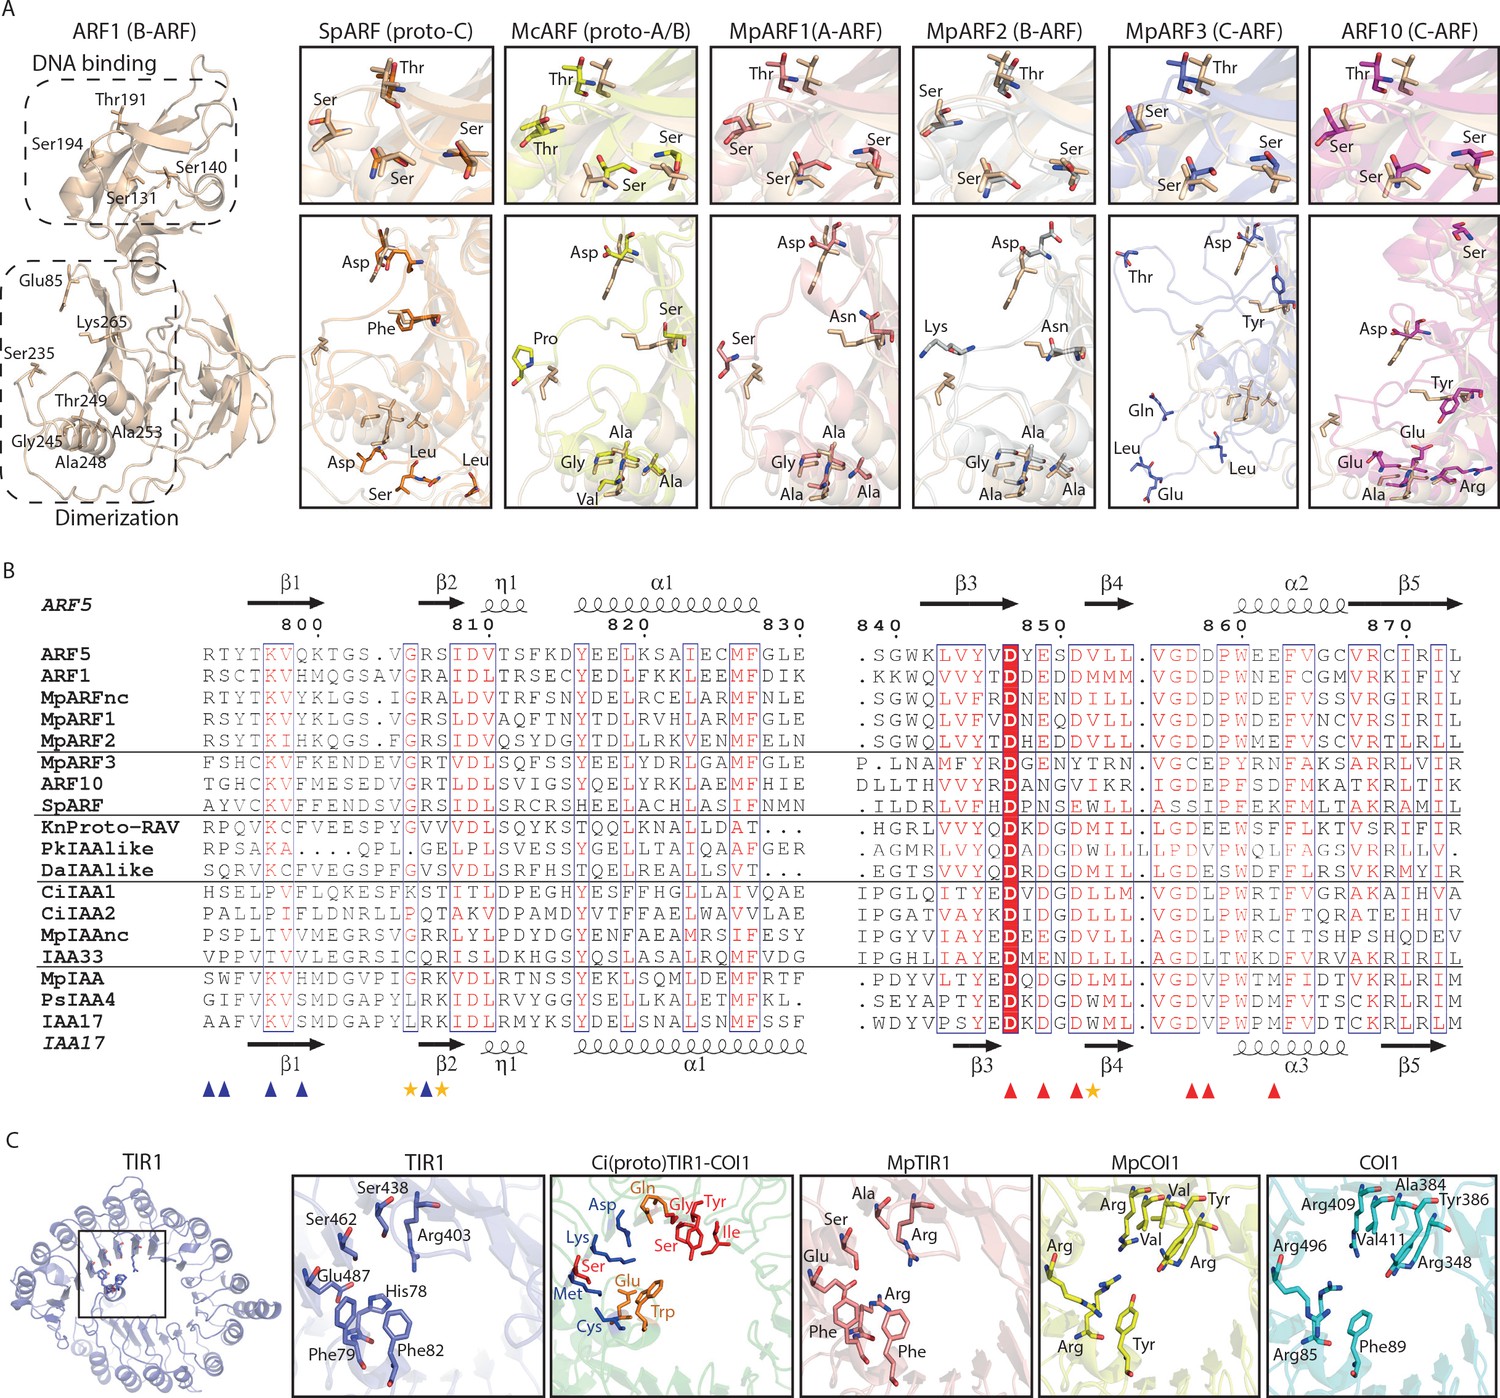
Homology models of ancestral ARF, Aux/IAA and TIR1/AFB proteins.
(A) Homology models for ARF DBDs. The crystal structure of Arabidopsis thaliana ARF1-DBD is shown on the left with important residues for DNA binding (top) and dimerization (bottom). Homology models for (proto-)ARFs are overlaid on A. thaliana ARF1 in right panels (brown). (B) Alignment of PB1 domain of (proto-)ARF, Aux/IAA and proto-RAV proteins. Numbering is based on the ARF5 protein of A. thaliana. Arrows and helices indicate β-sheets and α-helices in ARF5 and IAA17 of A.thaliana, respectively. Blue and red triangles indicate positive (+) and negative (-) faces, respectively. Golden asterisks represent the residues of polar interactions. (C) Homology models for TIR1/AFB and COI1 proteins. Left panel shows crystal structure of A. thaliana TIR1 from top view. Auxin-binding pocket of TIR1/AFB and jasmonate-binding pocket of COI1 are shown in right panels. Hormone-binding residues are indicated as stick model in TIR1 and COI1 of land plants. Blue, red or orange residues in the model for the Coleochaete irregularis protein indicate the residues aligned with hormone binding residues of TIR1, COI1 or both, respectively. Ci: Coloechaete irregularis, Da: Desmidium aptogonum, Kn: Klebsormidium nitens, Mc: Mesotaenium caldariorum, Mp: Marchantia polymorpha, Pk: Parachlorella kessleri, Ps: Pisum sativum, Sp: Spirogyra pratensis.
Figure 4 with 3 supplements
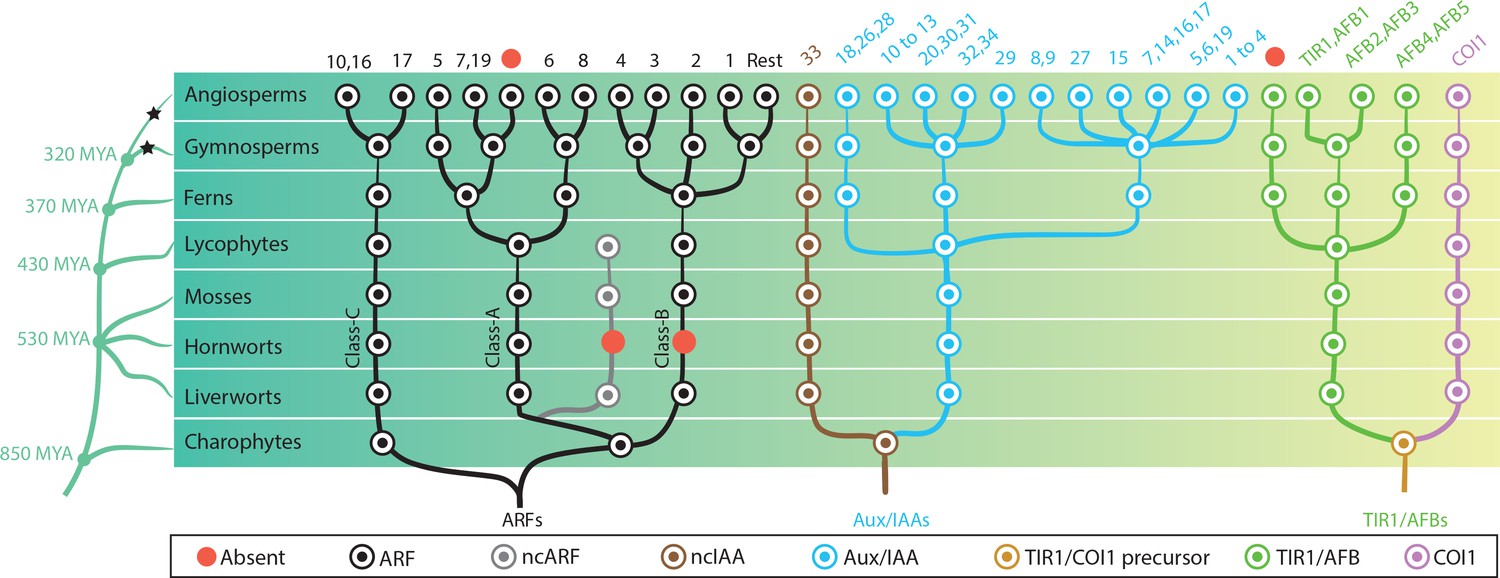
Reconstruction of ancestral state of NAP components in plant evolution.
Phylogeny of taxonomic classes are shown in left. Time point of the lineage diversification was calculated using TimeTree database (Kumar et al., 2017). Black stars indicate whole genome duplication events (Jiao et al., 2011). Right: phylogenetic trees show the copy number and phylogenetic relationship of each protein family in the common ancestors. Each circle is colored according to protein type as indicated in the box. In the top row, numbers indicate which genes of Arabidopsis thaliana belong to each subfamily and red circles indicates missing subfamilies in A. thaliana. Note that only branches with strong bootstrap support are shown.
Figure 4—figure supplement 1
Phylogenetic tree of Aux/IAA.
Label color shows the taxonomic group of each protein as indicated in top. Colored boxes connected with gray bar shows the domain structure of each protein. Magenta: domain I, yellow domain II, blue: PB1. Numbers along with the branches indicate branch length. Orange circles indicate bootstrap values higher than 75. The complete tree can be found at http://itol.embl.de/shared/dolfweijers (interactive Tree of Life; iTOL).
Figure 4—figure supplement 2

Phylogenetic tree of the proteins containing F-box and LRR.
Colored branches indicate protein families. Green: TIR1/COI1 precursor of Charophytes, red: COI1, orange: TIR1/AFB, black: the others. Numbers along with the branches indicate bootstrap values. The complete tree can be found at http://itol.embl.de/shared/dolfweijers (interactive Tree of Life; iTOL).
Figure 4—figure supplement 3

Phylogenetic tree of TIR1/AFB.
Label color shows the taxonomic group of each protein as indicated in left. Numbers along with the branches indicate branch length. Orange circles indicate bootstrap values higher than 75.
Figure 5
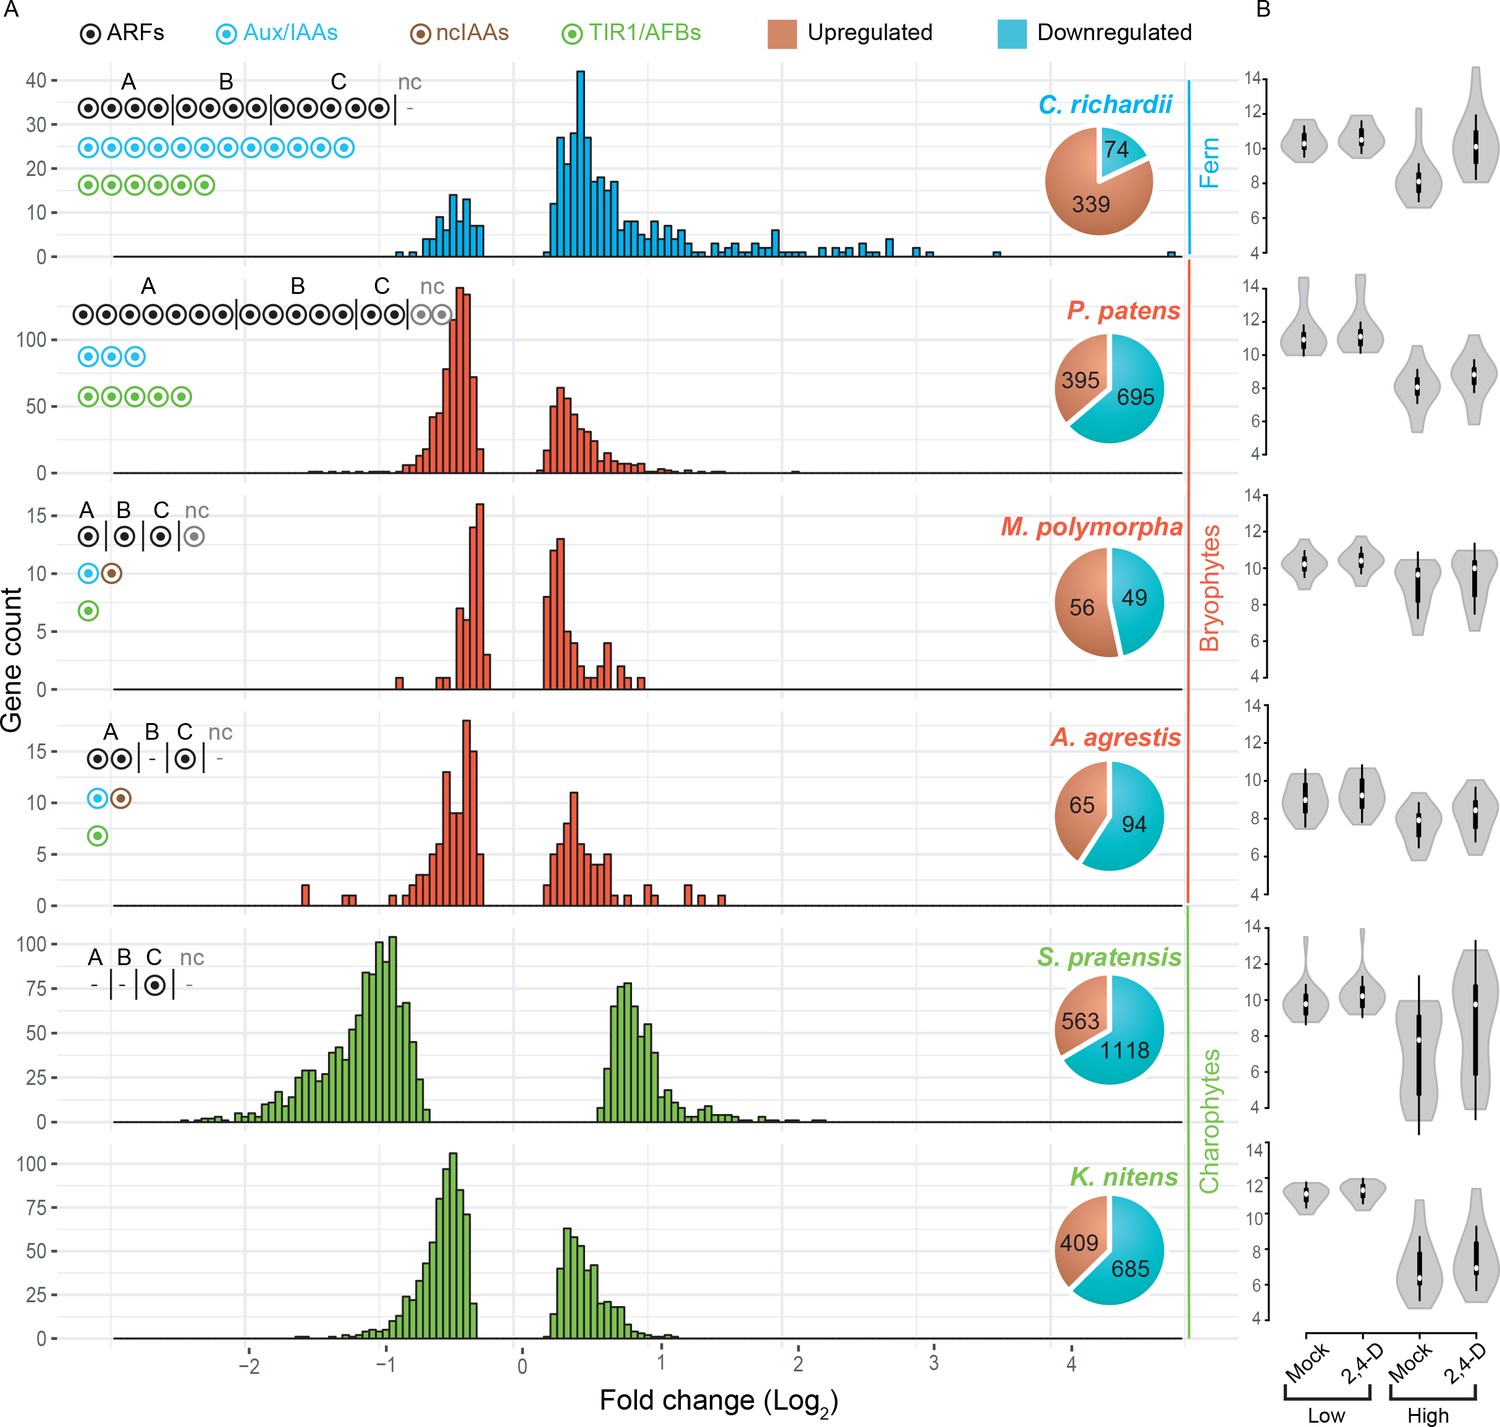
Auxin-dependent gene regulation across basal plant species.
(A) Histograms represent the distribution of log2 fold change among differentially expressed genes on X-axis (Padj <0.01). Y-axis indicates the number of genes in each log2 fold-change bin. Pie charts indicate the total number of up- and down-regulated genes in each species. Circles in the top left of each graph indicate the number of NAP components. (B) Violin plots of log2 normalized expression values (DEseq2-based; y-axis) of 20 least auxin activated (Low) and 20 top-most auxin upregulated (High) genes in each six species. White dot indicated the median expression value.
-
Figure 5—source data 1
Number of DEG in de novo assembly- or genome-based transcriptome analysis.
- https://doi.org/10.7554/eLife.33399.015
-
Figure 5—source data 2
Summary statistics of comparative RNA-seq analysis.
- https://doi.org/10.7554/eLife.33399.016
Figure 6 with 2 supplements
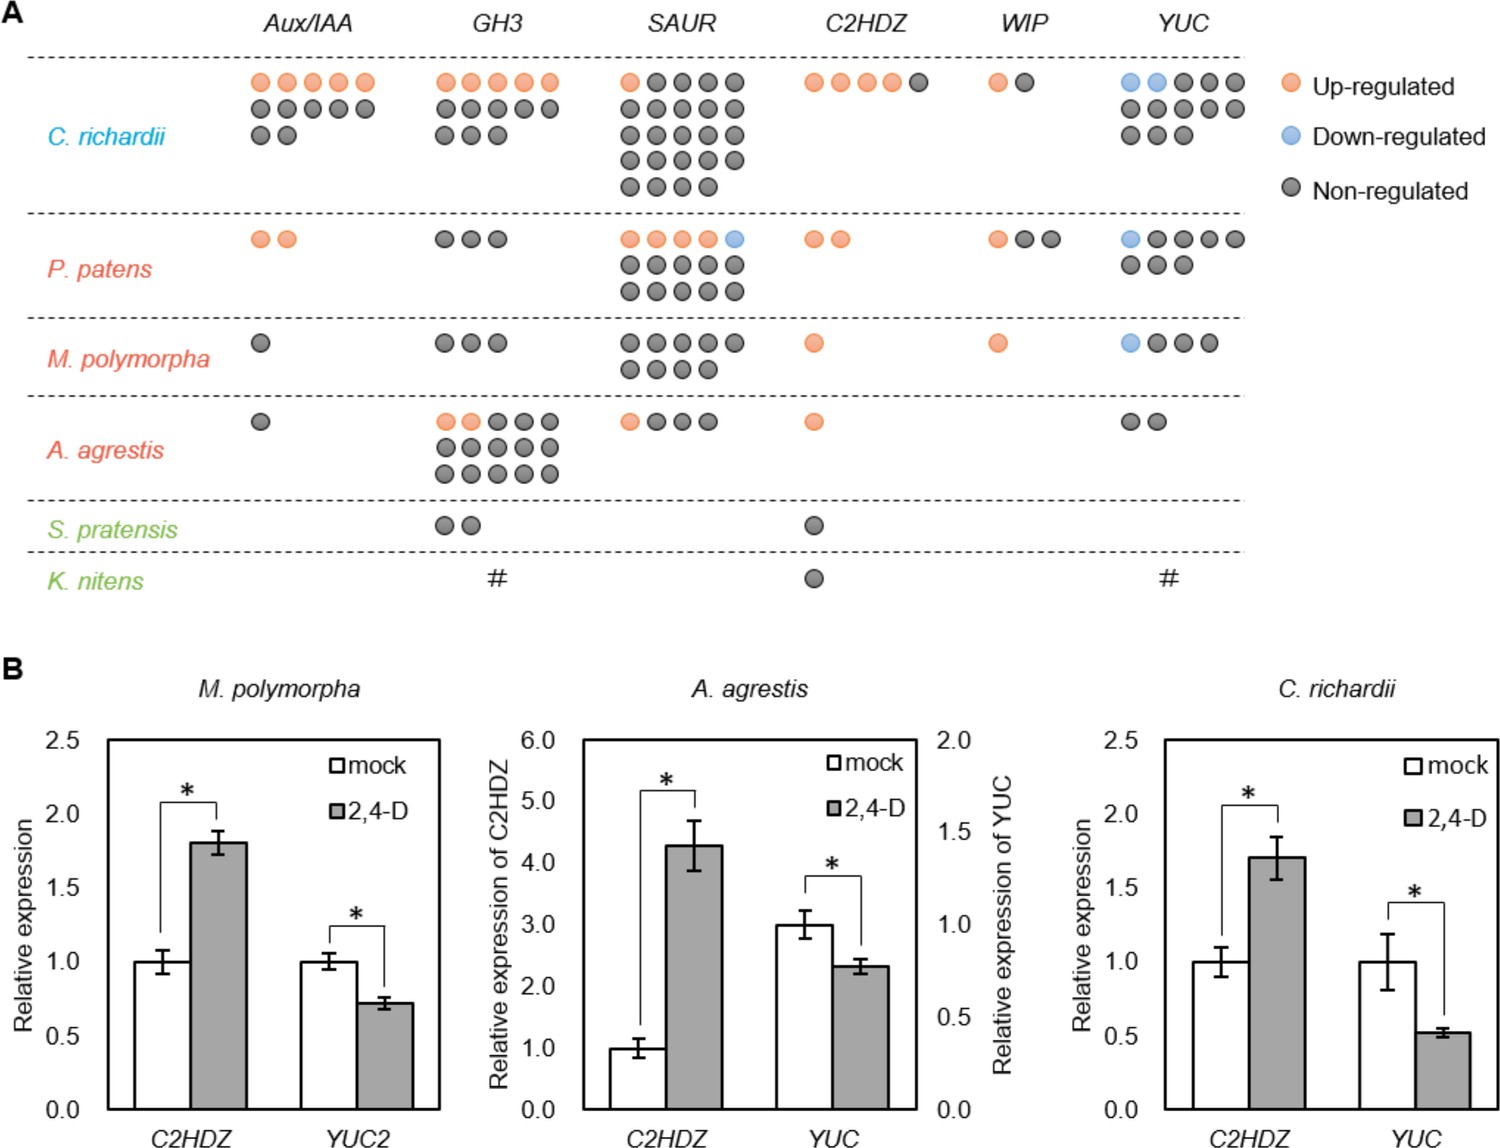
Identification of deeply conserved auxin-responsive genes.
(A) Auxin-dependence of six well-known angiosperm auxin-responsive gene families (top) surveyed from de novo assembly-based transcriptomes in six species. Each circle indicates a gene copy of each gene family. Red, blue and grey circle indicate up-, down- and non-regulated genes in response to auxin. #: no homologues were identified in our transcriptome possibly due to low expression, or they might be lost during evolution. (B) qPCR analysis of conserved auxin-responsive genes. Auxin treatment was performed in the same condition with RNA-seq experiment (10 μM 2,4-D for 1 hr). Relative expression values are normalized by the expression of EF1α in Marchantia polymorpha or the amount of total RNA in Anthoceros agrestis and Ceratopteris richardii. Each bar indicates average of expression with SD (biological replicates ≥3). *: p<0.01 (t-test).
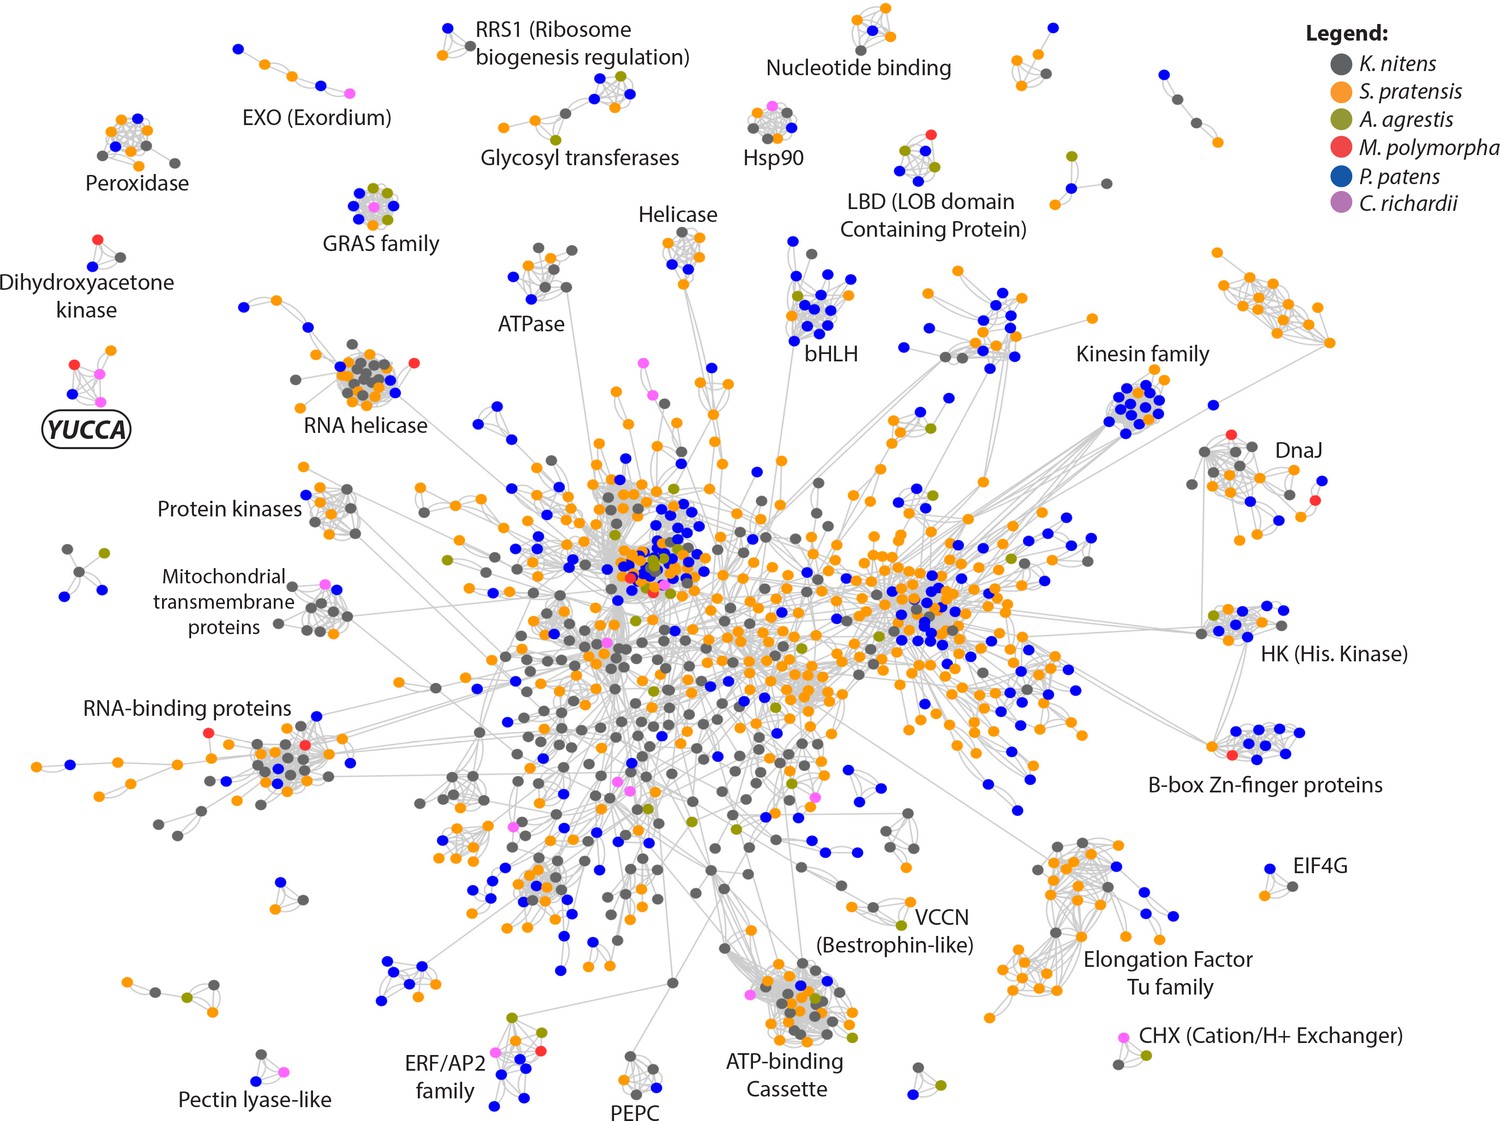
Figure 6—figure supplement 1

Network of up-regulated genes shared between different species upon auxin treatment.
Nodes represent the genes and edges represent the presence of BLAST similarity. Colors indicate the species in the legend above. Note that two edges connect nodes if the genes are bi-directional BLAST hits. See also Supplementary file 4.
Figure 6—figure supplement 2
Network of down-regulated genes shared between different species upon auxin treatment.
Nodes represent the genes and edges represent the presence of BLAST similarity. Note that two edges connect nodes if the genes are bi-directional BLAST hits. Colors indicate the species in the legend above. See also Supplementary file 5.
Figure 7 with 1 supplement
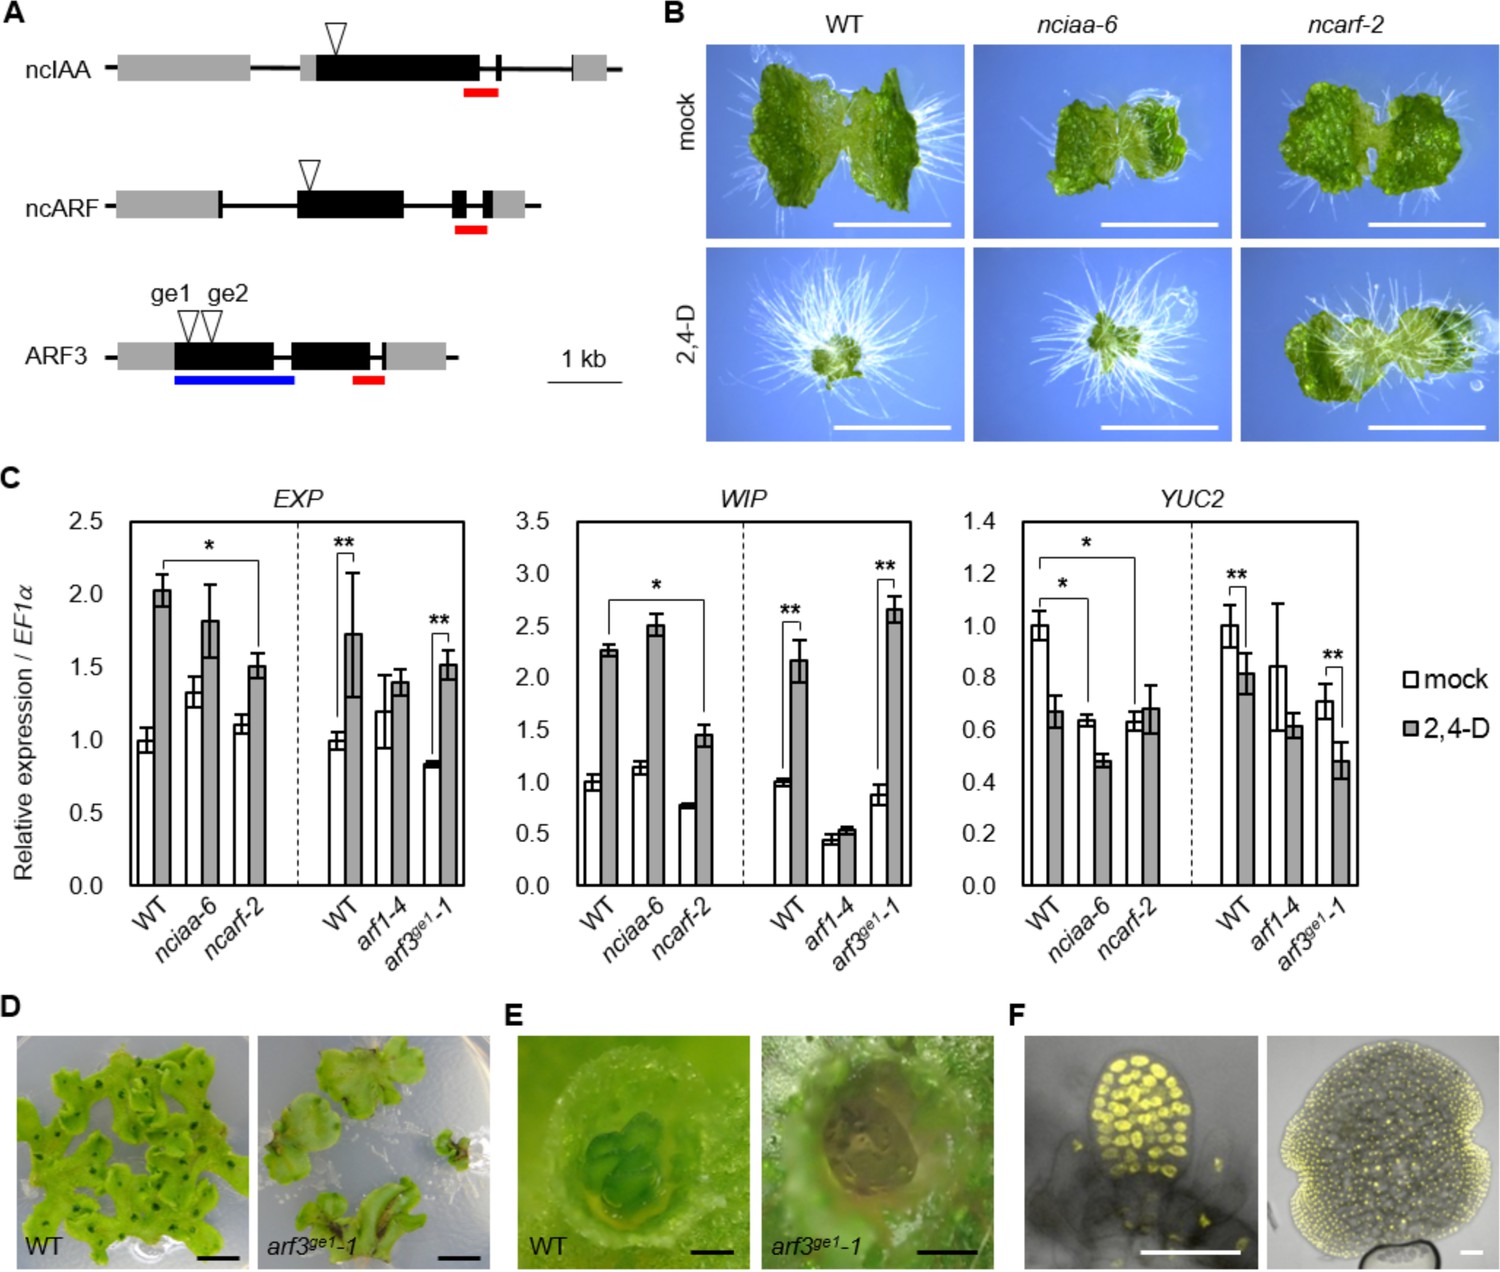
Genetic analysis of ancient components in Marchantia polymorpha.
(A) Diagrams of gene structure and CRISPR/Cas9-mediated mutation in ncIAA, ncARF and ARF3 loci. Arrowheads indicate sgRNAs target sites. Gray and black boxes indicate UTR and CDS, respectively. Red and blue bars indicate the region coding PB1 and DBD. (B) 10-day-old gemmalings grown without or with 3 μM 2,4-D. Scale bars: 5 mm. (C) Expression analysis of auxin-responsive genes in WT, nciaa, ncarf, and arf3 mutants by qPCR. 10-day-old gemmalings (nciaa and ncarf) or regenerating thalli (arf1 and arf3) were treated with 10 μM 2,4-D for 1 hr. Each bar indicates average ±SD (biological replicates = 3). Asterisks indicate significant differences. *: p<0.01 (Tukey test), **: p<0.05 (t-test). (D, E) Thallus tips grown for 2 weeks (D) and gemma cups (E) of WT and arf3ge1-1 mutant. arf3ge1-1 showed growth retardation and no mature gemmae, similar to the other alleles. (F) Expression analysis of proARF3:ARF3-Citrine in arf3ge2-1 background. Left and right panel show developing and mature gemmae, respectively. Scale bars: 5 mm in (B and D), 0.5 mm in (E), 50 μm in (F).
Figure 7—figure supplement 1
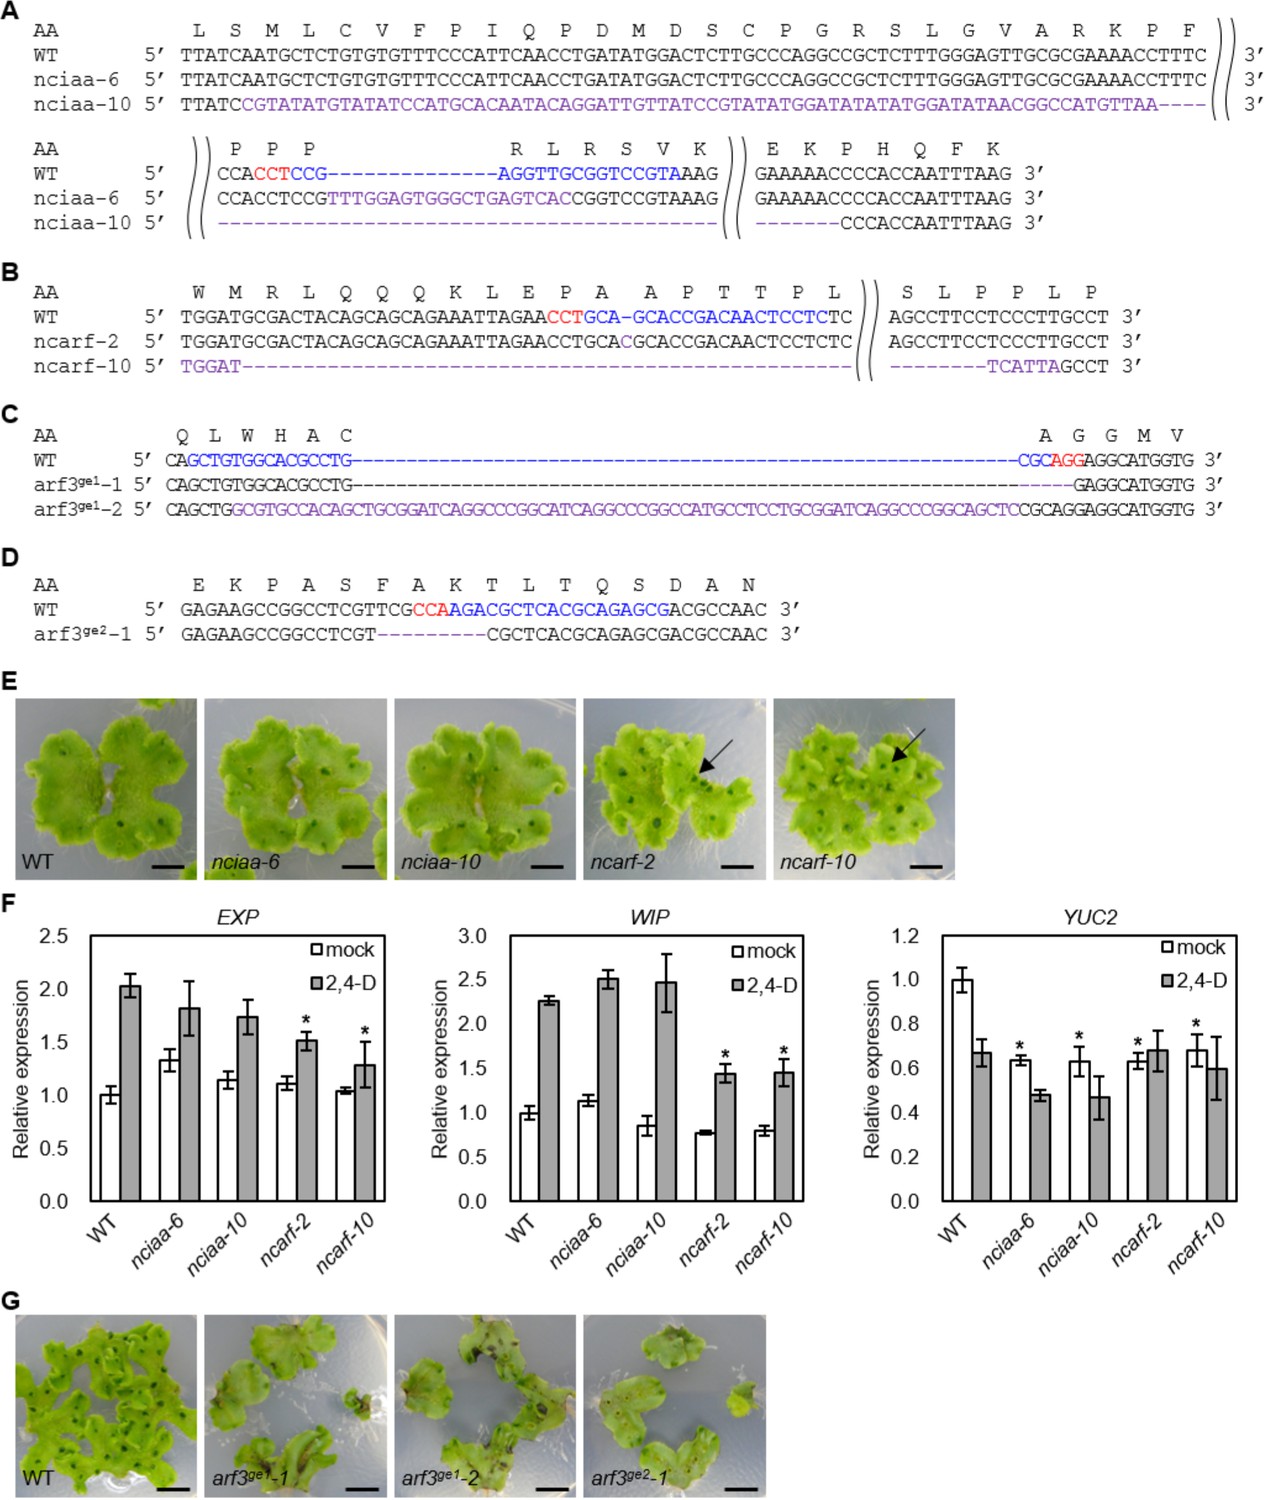
CRISPR/Cas9-mediated mutagenesis in M.
polymorpha. (A–D) Mutations detected by sequencing analysis. The amino acid (AA) sequences encoded in WT are shown at the top. WT sequence is shown with the PAM sequence highlighted in red and the target sequence of sgRNA in blue. Purple bases indicate mutation. nciaa-6: 6 bp deletion and 20 bp insertion, nciaa-10: 776 bp deletion and 75 bp insertion, ncarf-2: 1 bp insertion, ncarf-10: 486 bp deletion and 6 bp insertion, arf3ge1-1: 5 bp deletion, arf3ge1-2: 11 bp deletion and 72 bp insertion, arf3ge2-1: 9 bp deletion. (E) Three-week-old gemmalings. Arrows indicate the thalli formed with up-side-down. (F) qPCR analysis on 10-day-old gemmalings with or without 10 μM 2,4-D treatment for 1 hr. Relative expression values are normalized by the expression of EF1α. Each bar indicates average with SD (biological replicate = 3). Each asterisk indicates significant difference between WT and mutants in the same condition (p<0.01, Tukey test). (G) Thallus tips of WT and arf3 mutants grown for 2 weeks. Scale bars = 5 mm.
Author response image 1
Tables
Key resources table
| Reagent type (species) or resource | Designation | Source or reference | Identifiers | Additional information |
|---|---|---|---|---|
| Strain, strain background (Anthoceros agresitis) | Oxford | PMID: 26146510 | ||
| Strain, strain background (Ceratopteris richardii) | Hnn | PMID: 25886741 | ||
| Strain, strain background (Klebsormidium nitens) | NIES-2285 | National Institute of Environmental Studies (Japan) | ||
| Strain, strain background (Physcomitrella patens) | Grandsden | PMID: 18079367 | ||
| Strain, strain background (Spirogyra pratensis) | UTEX928 | The University of Texas at Austin | ||
| Strain, strain background (Marchantia polymorpha) | Tak-1 | PMID: 26020919 | ||
| Genetic reagent (M. polymorpha) | ncarf-2 | this paper | mutant of ncARF of M. polymorpha, Tak-1 background | |
| Genetic reagent (M. polymorpha) | ncarf-10 | this paper | mutant of ncARF of M. polymorpha, Tak-1 background | |
| Genetic reagent (M. polymorpha) | nciaa-6 | this paper | mutant of ncIAA ofM. polymorpha, Tak-1 background | |
| Genetic reagent (M. polymorpha) | nciaa-10 | this paper | mutant of ncIAA ofM. polymorpha, Tak-1 background | |
| Genetic reagent (M. polymorpha) | arf3ge1-1 | this paper | mutant of ARF3 ofM. polymorpha, Tak-1 background | |
| Genetic reagent (M. polymorpha) | arf3ge1-2 | this paper | mutant of ARF3 ofM. polymorpha, Tak-1 background | |
| Genetic reagent (M. polymorpha) | arf3ge2-1 | this paper | mutant of ARF3 ofM. polymorpha, Tak-1 background | |
| Genetic reagent (M. polymorpha) | arf1-4 | PMID: 29016901 | ||
| Recombinant DNA reagent | pMpGE_En03 | Addgene | 71535 | |
| Recombinant DNA reagent | pMpGE_010 | Addgene | 71536 | |
| Recombinant DNA reagent | pHKDW081 | this paper | entry vector containing sgRNA for nciaa | |
| Recombinant DNA reagent | pHKDW084 | this paper | entry vector containing sgRNA for ncarf | |
| Recombinant DNA reagent | pHKDW004 | this paper | entry vector containing sgRNA for arf3ge1 | |
| Recombinant DNA reagent | pHKDW005 | this paper | entry vector containing sgRNA for arf3ge2 | |
| Commercial assay or kit | TRIzol reagent | Thermo Fisher | 15596018 | |
| Commercial assay or kit | RNeasy Plant Mini kit | QIAGEN | 74904 | |
| Commercial assay or kit | RNase-free DNase I set | QIAGEN | 79254 | |
| Commercial assay or kit | iScript cDNA Synthesis Kit | Bio-Rad | 1708891 | |
| Commercial assay or kit | iQ SYBR Green Supermix | Bio-Rad | 1708886 | |
| Chemical compound, drug | Gamborg B5 medium | Duchefa Biochemie | G0209 | |
| Software, algorithm | BLAST + v2.2.28 | PMID: 20003500 | ||
| Software, algorithm | TransDecoder (ver2.0.1) | |||
| Software, algorithm | InterProScan database (ver5.19–58.0) | PMID: 24451626 | ||
| Software, algorithm | MAFFT | PMID: 23329690 | ||
| Software, algorithm | Phyutility (ver2.2.6) | PMID: 18227120 | ||
| Software, algorithm | PartitionFinder (ver1.1.1) | PMID: 22319168 | ||
| Software, algorithm | RAxML (ver8.1.20) | PMID: 24451623 | ||
| Software, algorithm | iTOL (ver3) | PMID: 27095192 | ||
| Software, algorithm | Trinity | PMID: 23845962 | ||
| Software, algorithm | Bowtie2 | PMID: 22388286 | ||
| Software, algorithm | Corset | PMID: 25063469 | ||
| Software, algorithm | DEseq2 | PMID: 25516281 | ||
| Software, algorithm | ClustalOmega | PMID: 21988835 | ||
| Software, algorithm | Espript | PMID: 24753421 | ||
| Software, algorithm | Modeller v9.17 | PMID: 27322406 | ||
| Software, algorithm | PyMOL | Schrödinger | ||
| Software, algorithm | Cytoscape | PMID: 14597658 |
Additional files
-
Supplementary file 1
Species used in phylogenomic analysis.
- https://doi.org/10.7554/eLife.33399.022
-
Supplementary file 2
Multiple sequence alignments used in the study.
- https://doi.org/10.7554/eLife.33399.023
-
Supplementary file 3
Primers used in this study.
- https://doi.org/10.7554/eLife.33399.024
-
Supplementary file 4
Detail for network of up-regulated genes.
- https://doi.org/10.7554/eLife.33399.025
-
Supplementary file 5
Detail for network of down-regulated genes.
- https://doi.org/10.7554/eLife.33399.026
-
Transparent reporting form
- https://doi.org/10.7554/eLife.33399.027
Download links
A two-part list of links to download the article, or parts of the article, in various formats.
Downloads (link to download the article as PDF)
Open citations (links to open the citations from this article in various online reference manager services)
Cite this article (links to download the citations from this article in formats compatible with various reference manager tools)
Origin and evolution of the nuclear auxin response system
eLife 7:e33399.
https://doi.org/10.7554/eLife.33399


