Exportin Crm1 is repurposed as a docking protein to generate microtubule organizing centers at the nuclear pore
- University of Edinburgh, United Kingdom
- National Institute of Information and Communications Technology, Japan
- Japan Women’s University, Japan
- Institute of Biotechnology, Technische Universität Berlin, Germany
- Osaka University, Japan
Figures
Figure 1 with 3 supplements

Identification of proteins interacting with Mto1[NE] but not Mto[bonsai].
(A) Diagram of full-length Mto1 and Mto1-truncation mutants. Asterisk indicates 9A1 mutation, which abolishes interaction with γ-tubulin complex (Samejima et al., 2008). (B) Outline of cross-linking and mass spectrometry approach to identify Mto1 interactors. (C) Localization of GFP-Mto1[9A1-NE]-HTB and GFP-Mto1[9A1-bonsai]-HTB. Numbers below images indicate percent cells with GFP signal on the nuclear envelope (n = total number of cells scored). (D) Anti-Mto1 Western blot of whole-cell lysates from GFP-mto1[9A1-NE]-HTB cells in the absence of cross-linking (-DSS) and after disuccinimidyl suberate cross-linking (+DSS). Dashed line indicates boundary between resolving gel and stacking gel. (E) SDS-PAGE of GFP-Mto1[9A1-NE]-HTB sample and GFP-Mto1[9A1-bonsai]-HTB sample after DSS cross-linking and two-step denaturing purification. Regions marked ‘X-linked’ were analyzed by mass spectrometry (see Materials and methods). (F) Mass spectrometry label-free quantification (LFQ) of 750 proteins from samples as in E. ‘LFQ ratio’ indicates relative enrichment of a given protein in the purified GFP-Mto1[9A1-NE]-HTB sample compared to the purified GFP-Mto1[9A1-bonsai]-HTB sample. ‘LFQ intensity’ indicates total intensity (arbitrary units) of a given protein from the combined purified samples. Data shown represent one of two independent biological replicates. See also Table 1. Complete datasets are in Supplementary file 3. Bar, 5 µm.
Figure 1—figure supplement 1
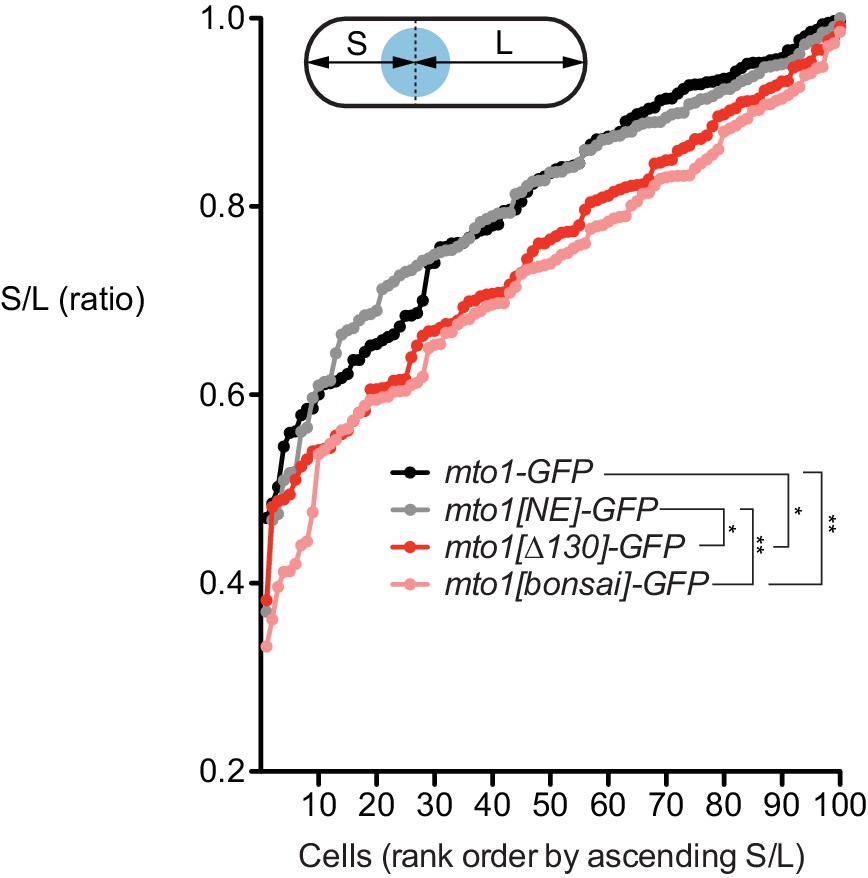
Nuclear positioning in mto1 mutants.
Nuclear positioning in strains of the indicated genotypes (see Figure 1A). 100 cells of each genotype were scored. For each cell, distance from nucleus to each cell end was measured. The shorter of the two distances was termed S, and the longer was termed L. Y-axis shows ratio S/L for cells of each genotype, in rank order. Higher S/L ratios indicate more accurate nuclear centering. *p<0.01; **p<0.001 (non-paired t-test, two-tailed); other differences are not significant. Actual p values are: mto1-GFP vs. mto1[NE]-GFP, 0.99; mto1-GFP vs. mto1[∆130]-GFP, 0.0066; mto1-GFP vs. mto1[bonsai]-GFP, 0.0002; mto1[NE]-GFP vs. mto1[∆130]-GFP, 0.0060; mto1[NE]-GFP vs. mto1[bonsai]-GFP, 0.0002; mto1[∆130]-GFP vs. mto1[bonsai]-GFP, 0.29.
Figure 1—figure supplement 2
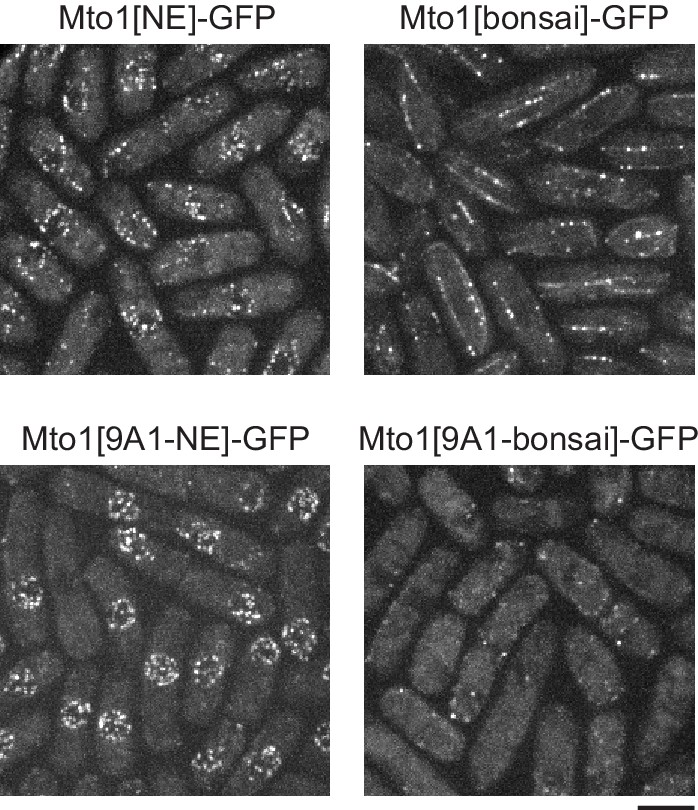
The mto1 9A1 mutation enhances Mto1[NE]-GFP localization to the nuclear envelope.
Both Mto1[NE]-GFP and Mto1[bonsai]-GFP promote microtubule (MT) nucleation by the γ-tubulin complex, and thus both are present at minus ends of individual MTs within MT bundles, even though neither binds directly to the MT lattice. When the 9A1 mutation is introduced into Mto1, absence of MT nucleation abrogates association with MT minus ends, leading to increased Mto1[9A1-NE]-GFP on the nuclear envelope (previously described by Lynch et al., 2014). Bar, 5 µm.
Figure 1—figure supplement 3
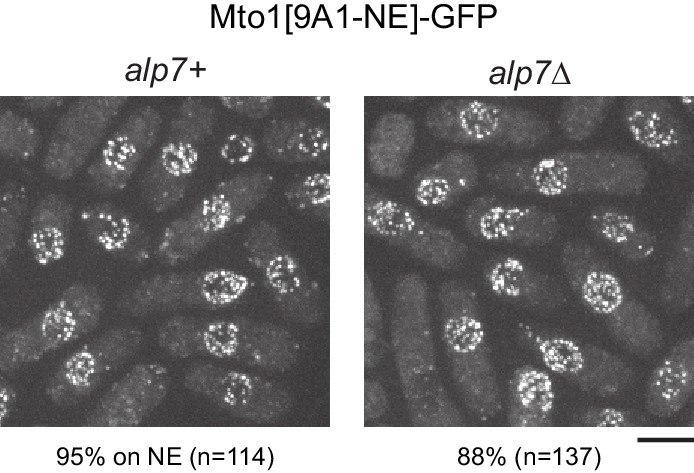
Alp7 is not required for Mto1[NE] localization to the nuclear envelope.
Localization of Mto1[9A1-NE]-GFP to the nuclear envelope (NE) in wild-type (alp7+) and alp7∆ cells. Numbers below images indicate percent cells with Mto1[9A1-NE]-GFP on the NE (n = total number of cells scored). Bar, 5 µm.
Figure 2
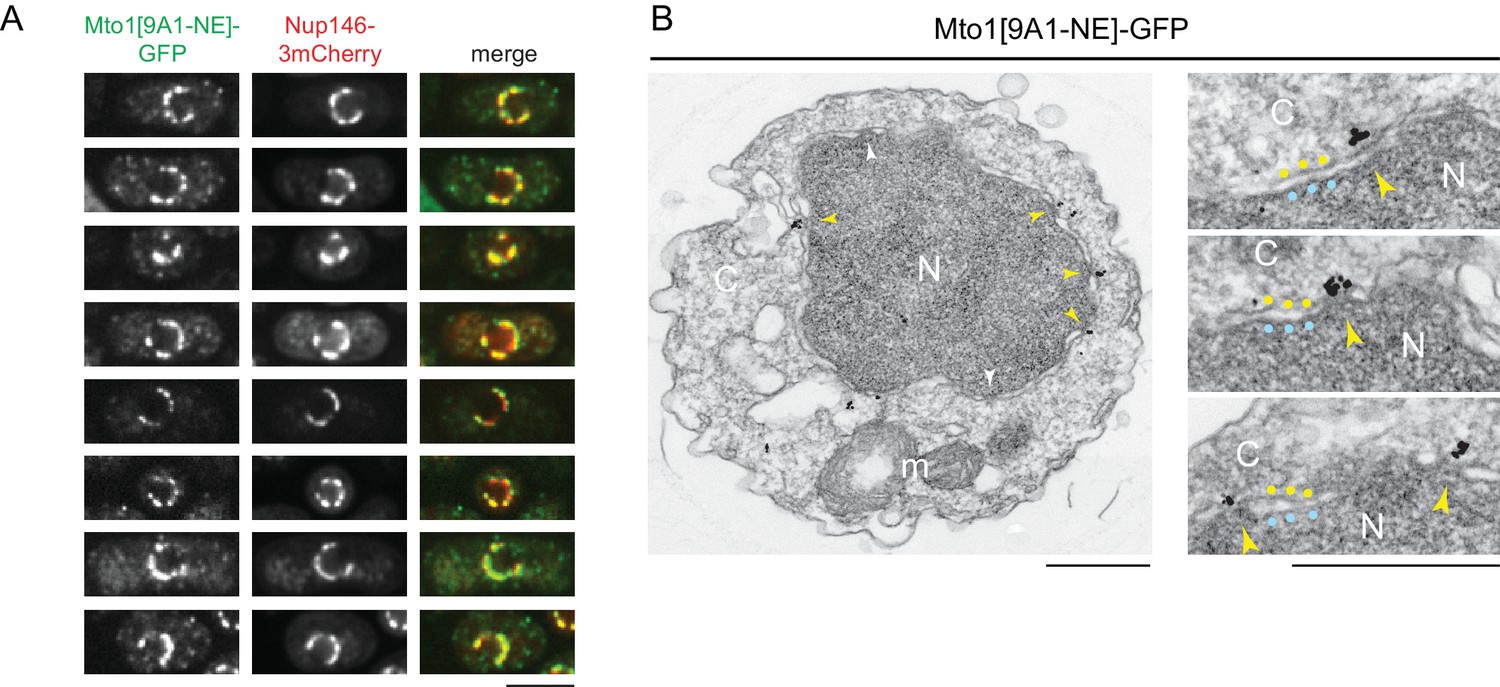
Mto1[NE] is localized to the cytoplasmic face of the nuclear pore complex.
(A) Colocalization of Mto1[9A1-NE]-GFP and Nup146-3mCherry after nuclear pore complex (NPC) clustering in nup132∆ cells. For each cell, a single central Z-section is shown. (B) Immunoelectron microscopy of Mto1[9A1-NE]-GFP. Left panel shows cross-section of a single cell. NPCs can be seen as slightly electron-dense regions where inner and outer nuclear membranes meet. Yellow arrowheads indicate NPCs with Mto1[9A1-NE]-GFP on cytoplasmic face of NPC. White arrowheads indicate examples of unstained NPCs. Right panels show magnified examples from other cells. Blue and yellow dots indicate inner and outer nuclear membranes, respectively. N, nucleus; C, cytoplasm; m, mitochondria. Bars, 5 µm (A), 0.5 µm (B).
Figure 3 with 3 supplements
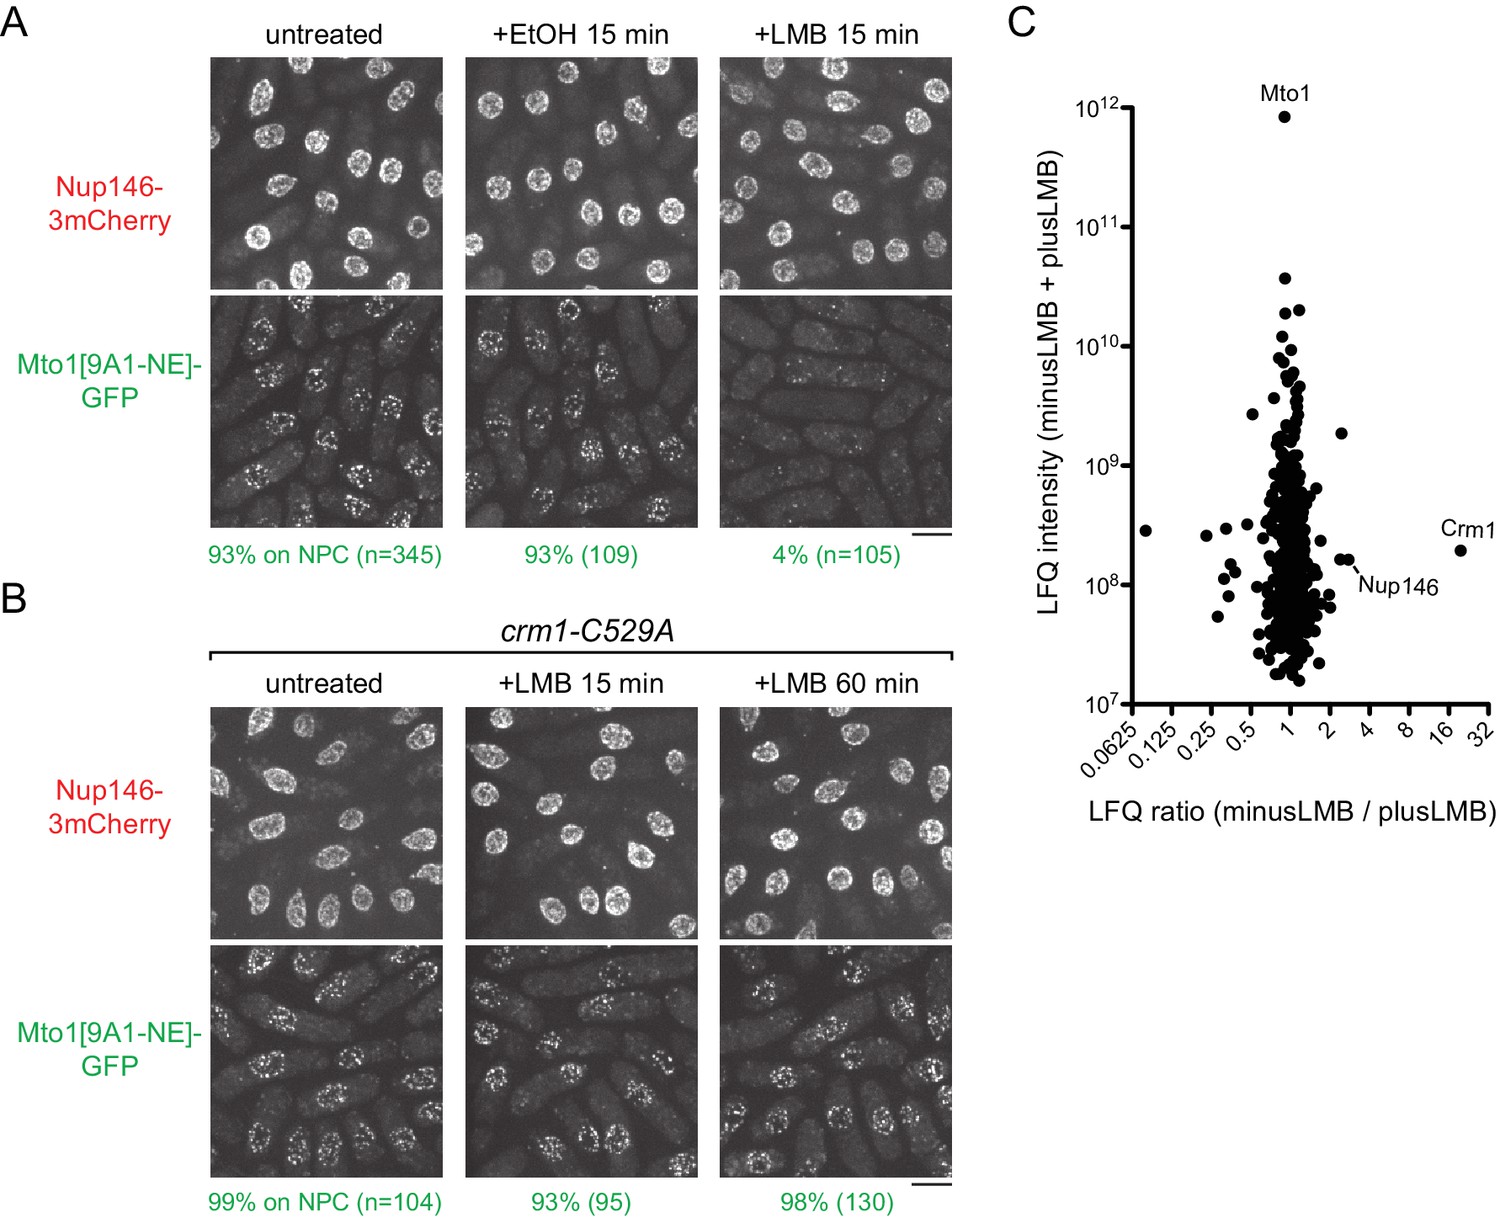
Inhibition of Crm1 cargo-binding by Leptomycin B treatment disrupts Mto1[NE] localization to nuclear pore complexes and Mto1[NE] interaction with Crm1.
(A) Localization of Nup146-3mCherry and Mto1[9A1-NE]-GFP in untreated cells and in cells treated with 1% ethanol (+EtOH) or with 100 nM leptomycin B (+LMB) in ethanol for 15 min. Numbers below images indicate percent cells with Mto1 on NPCs (n = total number of cells scored). (B) Localization of Nup146-3mCherry and Mto1[9A1-NE]-GFP in crm1-C529A cells, which are resistant to LMB. Cells were untreated or treated with 100 nM LMB for 15 or 60 min. (C) Mass spectrometry label-free quantification (LFQ) of 483 proteins from samples of cross-linked, purified GFP-Mto1[9A1-NE]-HTB from untreated (”minusLMB’) vs. LMB-treated (”plusLMB’) cells. ‘LFQ ratio’ indicates relative enrichment of a given protein in the purified minusLMB sample compared to the purified plusLMB sample. ‘LFQ intensity’ indicates total intensity (arbitrary units) of a given protein from the combined purified samples. Data shown represent geometric mean from two independent biological replicates. See also Table 2. Complete datasets are in Supplementary file 4. Bars, 5 µm.
Figure 3—figure supplement 1
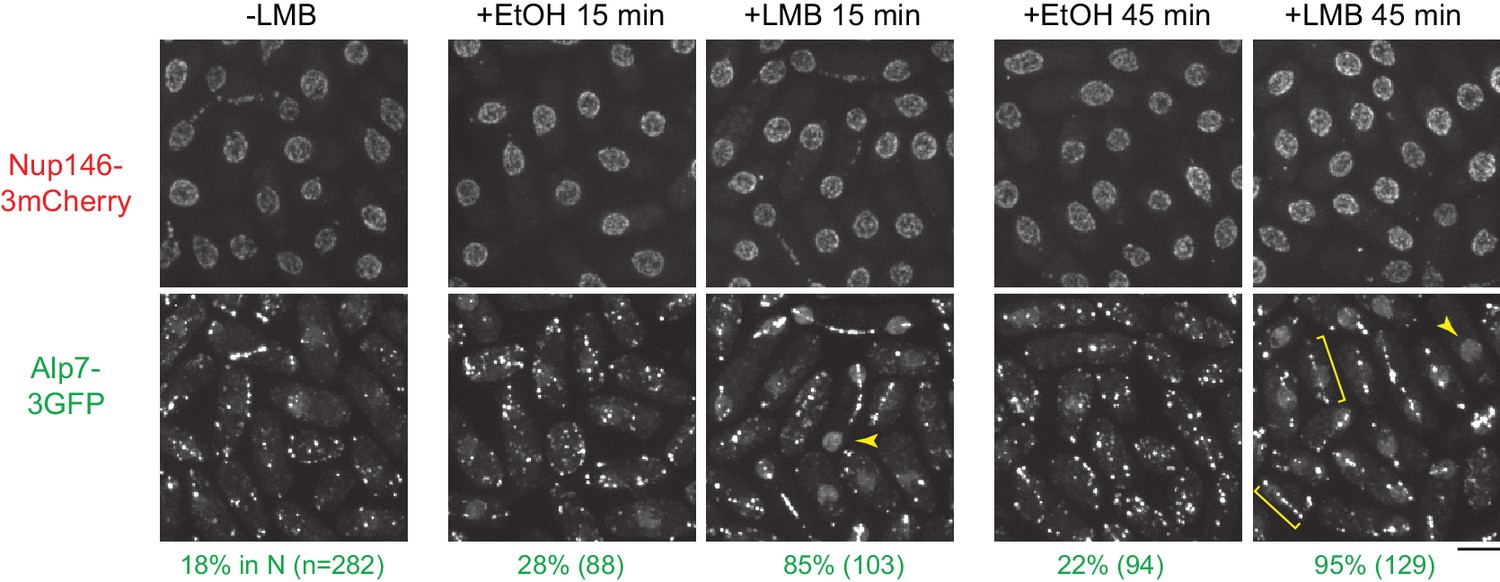
Leptomycin B treatment leads to accumulation of Alp7 in the nucleoplasm.
Localization of Nup146-3mCherry and Alp7-3GFP in untreated cells and in cells treated with 1% ethanol (+EtOH; carrier) or with 100 nM leptomycin B (LMB) in ethanol for 15 and 45 min. Numbers below images indicate percent cells with Alp7 in the nucleus (n = total number of cells scored). Arrowheads indicate examples of Alp7-3GFP accumulation in the nucleus. Brackets indicate examples of Alp7-3GFP puncta on an intranuclear microtubule bundle that can form in interphase cells after LMB treatment (Matsuyama et al., 2006). Bar, 5 µm.
Figure 3—figure supplement 2
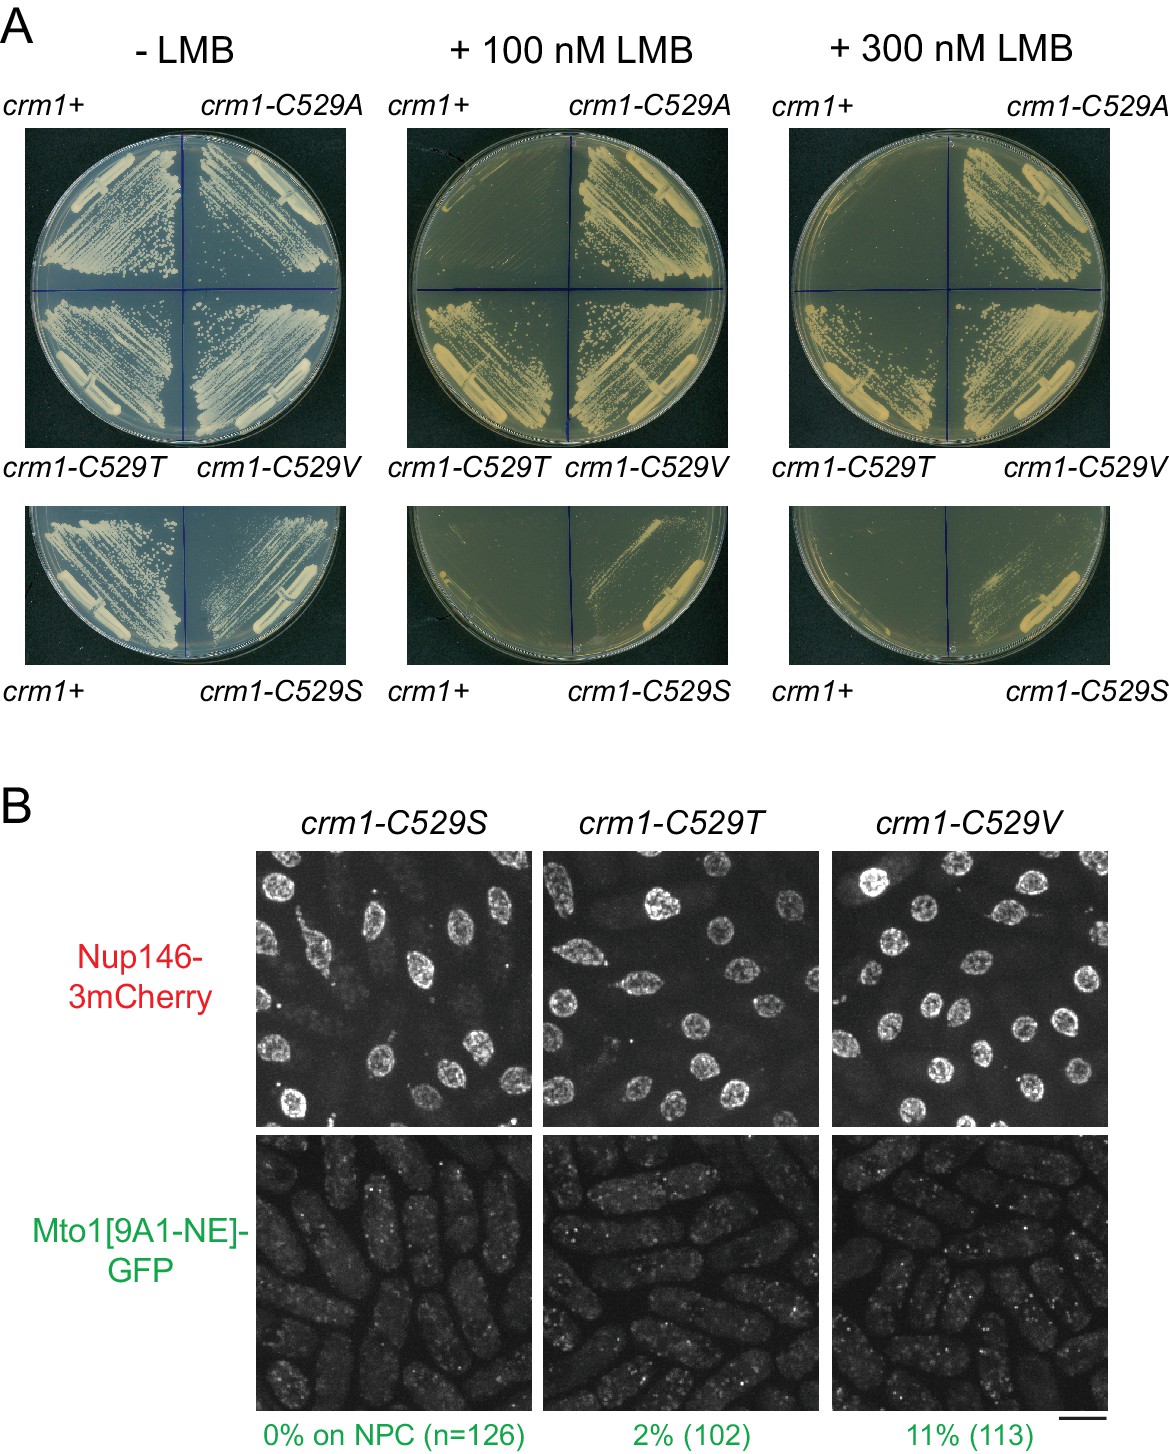
Characterization of crm1-C529 mutants.
(A) Growth of wild-type (crm1+) cells and the crm1 mutants indicated, on plates with and without leptomycin B (LMB). The crm1-C529A, crm1-C529T, and crm1-C529V mutants are essentially completely resistant to LMB, while the crm1-C529S mutant is only partially resistant. (B) Mto1[9A1-NE]-GFP and Nup146-3mCherry localization in the crm1 mutants indicated, in the absence of LMB. In crm1-C529S, crm1-C529T, and crm1-C529V mutants, Mto1[9A1-NE]-GFP fails to localize to nuclear pore complexes (NPCs), although it does localize to NPCs in crm1-C529A mutants (Figure 3). Bar, 5 µm.
Figure 3—figure supplement 3

Microtubule regrowth after leptomycin B treatment.
Anti-tubulin immunofluorescence of control (ethanol-treated) and leptomycin B (LMB)-treated cells during microtubule (MT) regrowth after cold-induced MT depolymerization, in a strain expressing untagged, full-length wild-type Mto1. Arrowheads indicate examples of MT regrowth from the nuclear envelope, which does not occur in LMB-treated cells. MT regrowth is slightly slower in LMB-treated cells compared to control cells, possibly because LMB leads to increased intranuclear localization of some MT-associated proteins, such as Alp7 (see Figure 3—figure supplement 1). LMB treatment also leads to partial intranuclear localization of tubulin after cold treatment, although this may be only a small proportion of total tubulin, as most MT regrowth in LMB-treated cells still occurs in the cytoplasm.
Figure 4
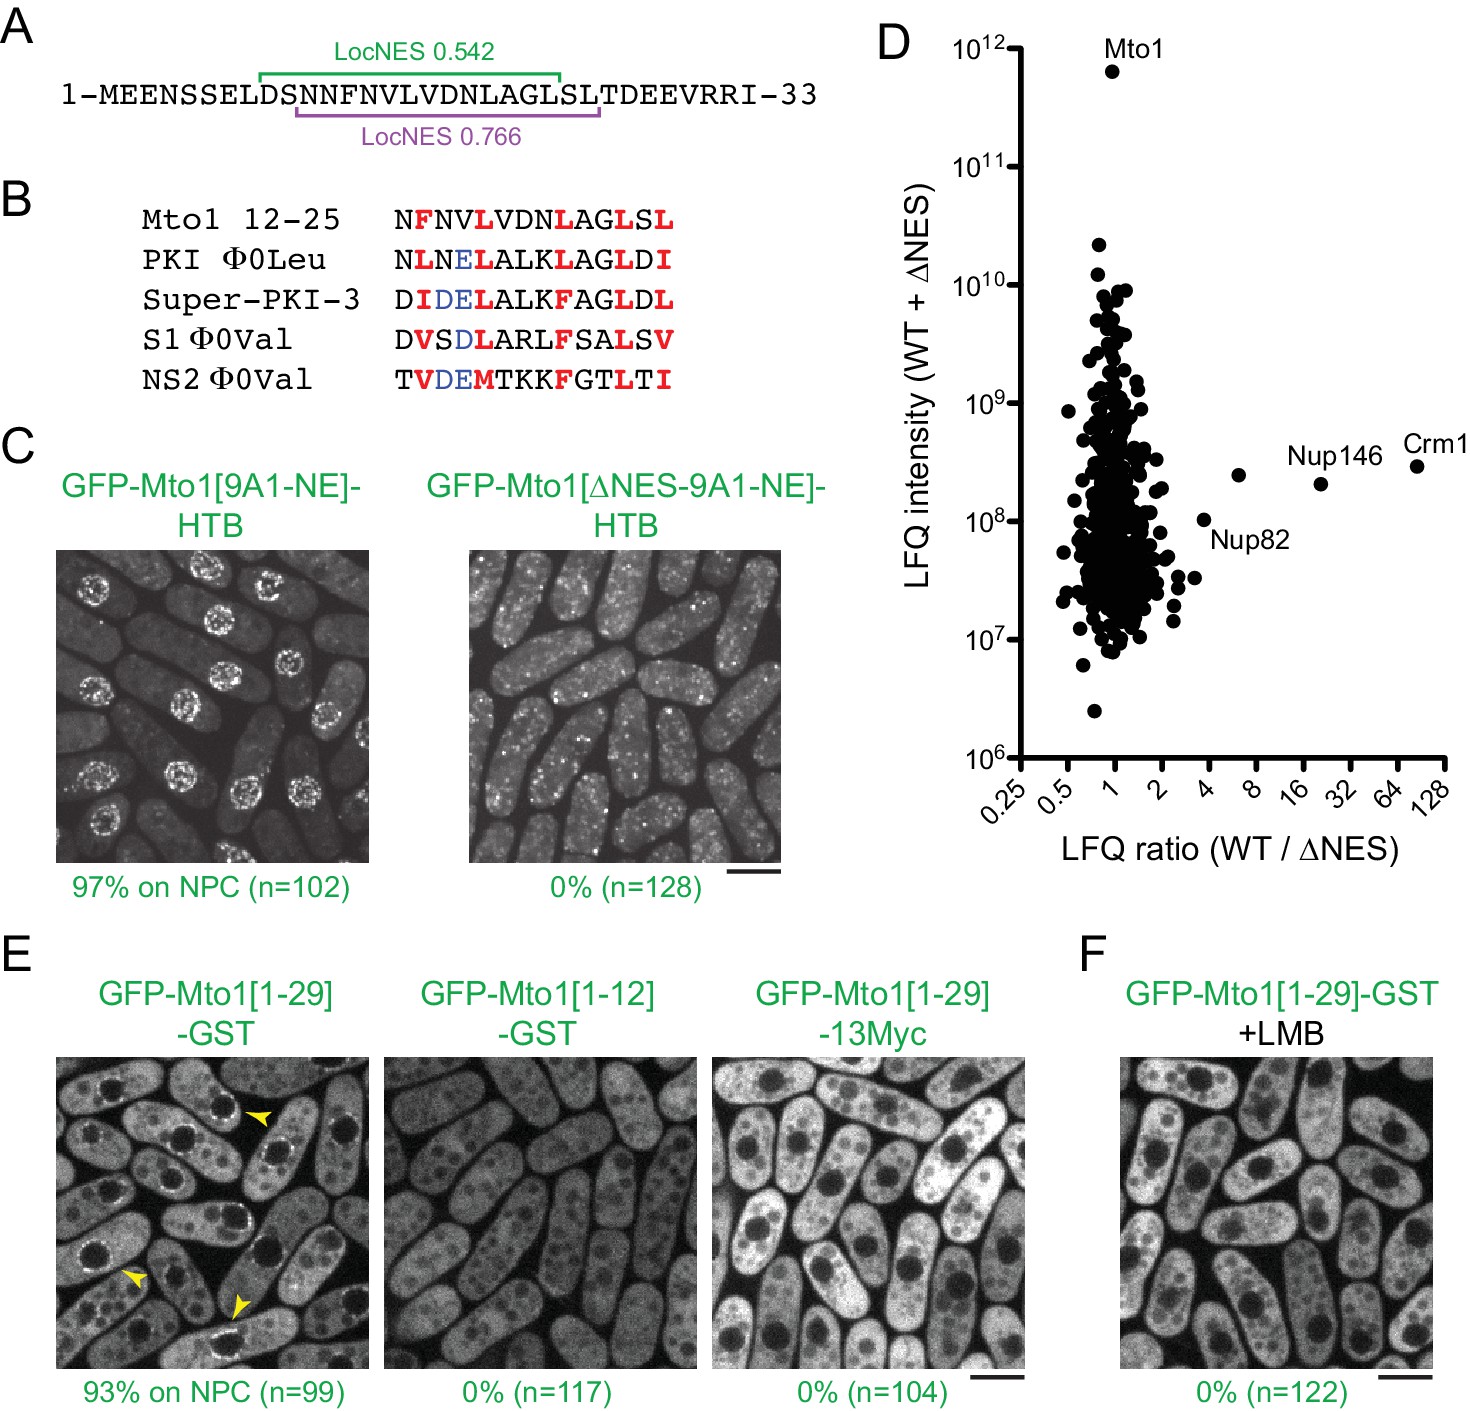
Mto1 interacts with Crm1 via a NES-like sequence near the Mto1 amino-terminus.
(A) Predicted NESs in the first 33 amino acids of Mto1, with associated LocNES scores (Xu et al., 2015). These are the only sequences in the first 130 amino acids of Mto1 with LocNES scores greater than 0.1 (B) Alignment of Mto1 amino acids 12–25 with four non-natural, high-affinity NESs (‘supraphysiological’ NESs) described by Güttler et al. (2010) and Engelsma et al. (2004). Conserved hydrophic residues are indicated in red. Acidic residues shown to enhance NES affinity for Crm1 are in blue. (C) Localization of GFP-Mto1[9A1-NE]-HTB and GFP-Mto1[∆NES-9A1-NE]-HTB, which lacks Mto1 amino acids 1–25. Numbers below images indicate percent cells with Mto1 at NPCs (n = total number of cells scored). (D) Mass spectrometry label-free quantification (LFQ) of 469 proteins from samples of cross-linked, purified GFP-Mto1[9A1-NE]-HTB ('WT’) and cross-linked, purified GFP-Mto1[∆NES-9A1-NE]-HTB ('∆NES’). ‘LFQ ratio’ indicates relative enrichment of a given protein in the purified WT sample compared to the purified ∆NES sample. ‘LFQ intensity’ indicates total intensity (arbitrary units) of a given protein from the combined purified samples. Data shown represent one of two independent biological replicates. Nup82 is labeled because it is likely to interact with Nup146, based on homology with budding yeast (Belgareh et al., 1998). See also Table 3. Complete datasets are in Supplementary file 5. (E) Localization of the indicated Mto1 fragments fused to GFP at their N-termini and either GST or 13Myc at their C-termini. Arrowheads indicate examples of localization to the NPCs. Numbers below images indicate percent cells with Mto1 at NPCs (n = total number of cells scored). (F) Localization of GFP-Mto1[1-29]-GST in leptomycin B-treated cells. Images in E and F are single Z-sections, while other images are maximum projections. Bars, 5 µm.
Figure 5 with 2 supplements
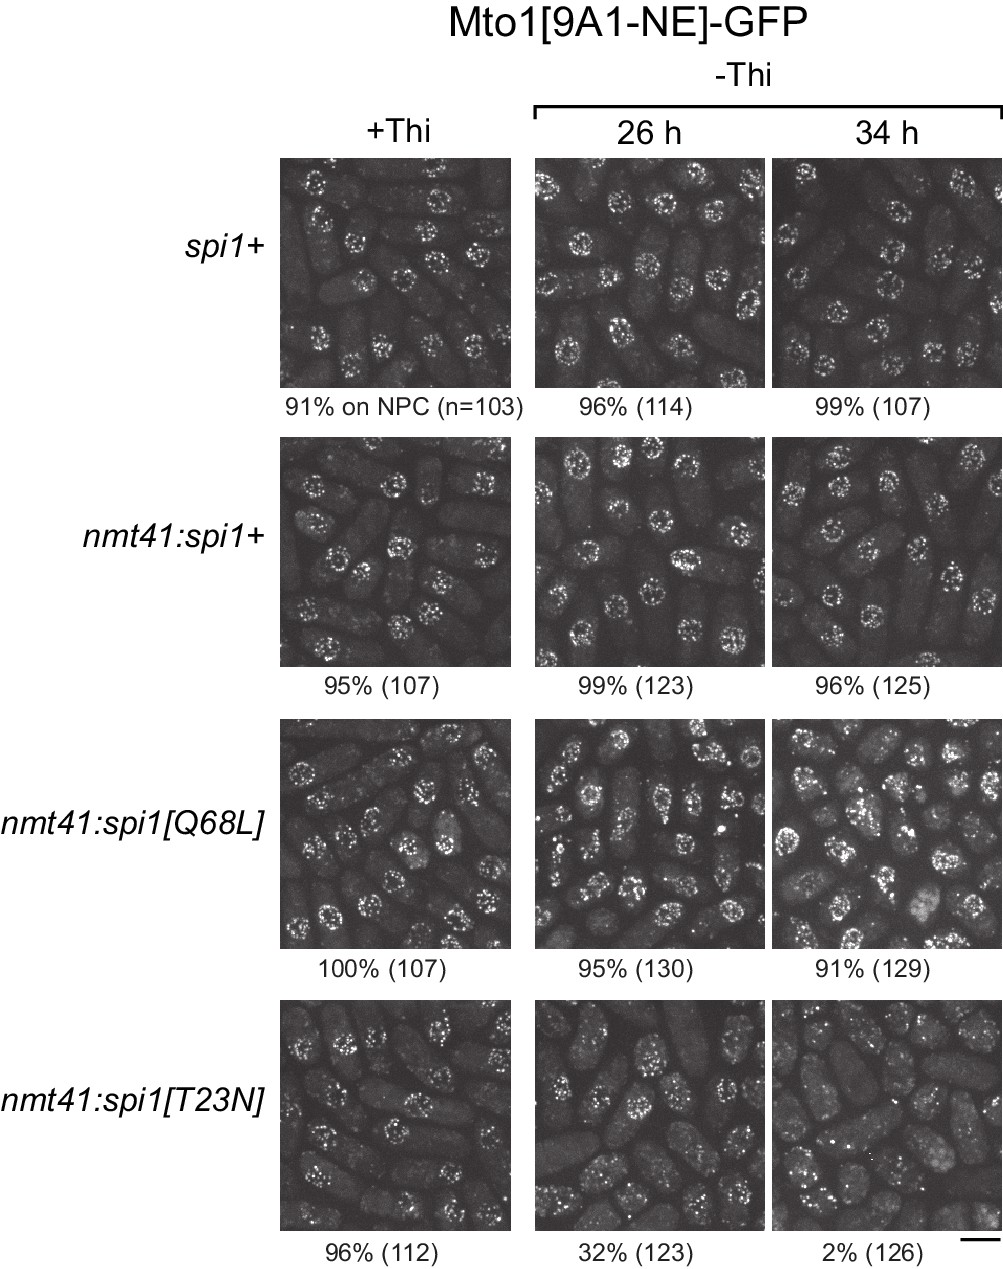
Expression of dominant-negative Ran (spi1[T23N]) but not constitutively active Ran (spi1[Q68L]) disrupts localization of Mto1[NE] to nuclear pore complexes.
Mto1[9A1-NE]-GFP localization in strains containing different versions of Ran (spi1 in fission yeast) expressed from the thiamine-repressible nmt41 promoter, together with control wild-type cells (spi1+). Cells are shown in the presence of thiamine (+Thi), and 26 and 34 hr after removal of thiamine (-Thi). 26 and 34 hr represent early and later stages of induced expression, respectively (see Figure 5—figure supplement 2). Numbers below images indicate percent cells with Mto1[9A1-NE]-GFP on nuclear pore complexes (n = total number of cells scored). Bar, 5 µm.
Figure 5—figure supplement 1
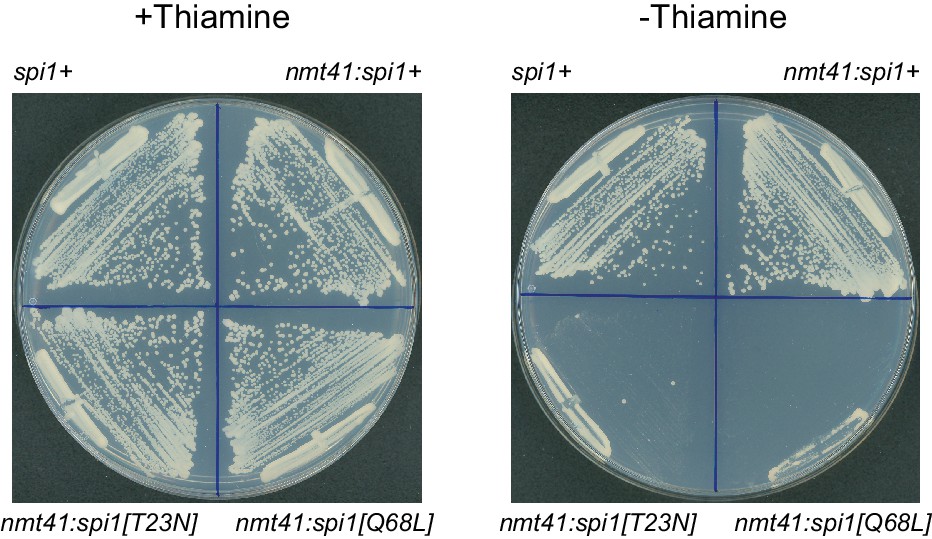
Effects of mutant Ran (spi1 in fission yeast) on cell viability.
Colony formation after 2-day growth in the presence and absence of thiamine, in wild-type control cells (spi1+) and in cells expressing transgenes for wild-type Ran (nmt41:spi1+), dominant-negative Ran (nmt41:spi1[T23N]), or constitutively active Ran (nmt41:spi1[Q68L]), under the control of the medium-strength thiamine-repressible nmt41 promoter.
Figure 5—figure supplement 2
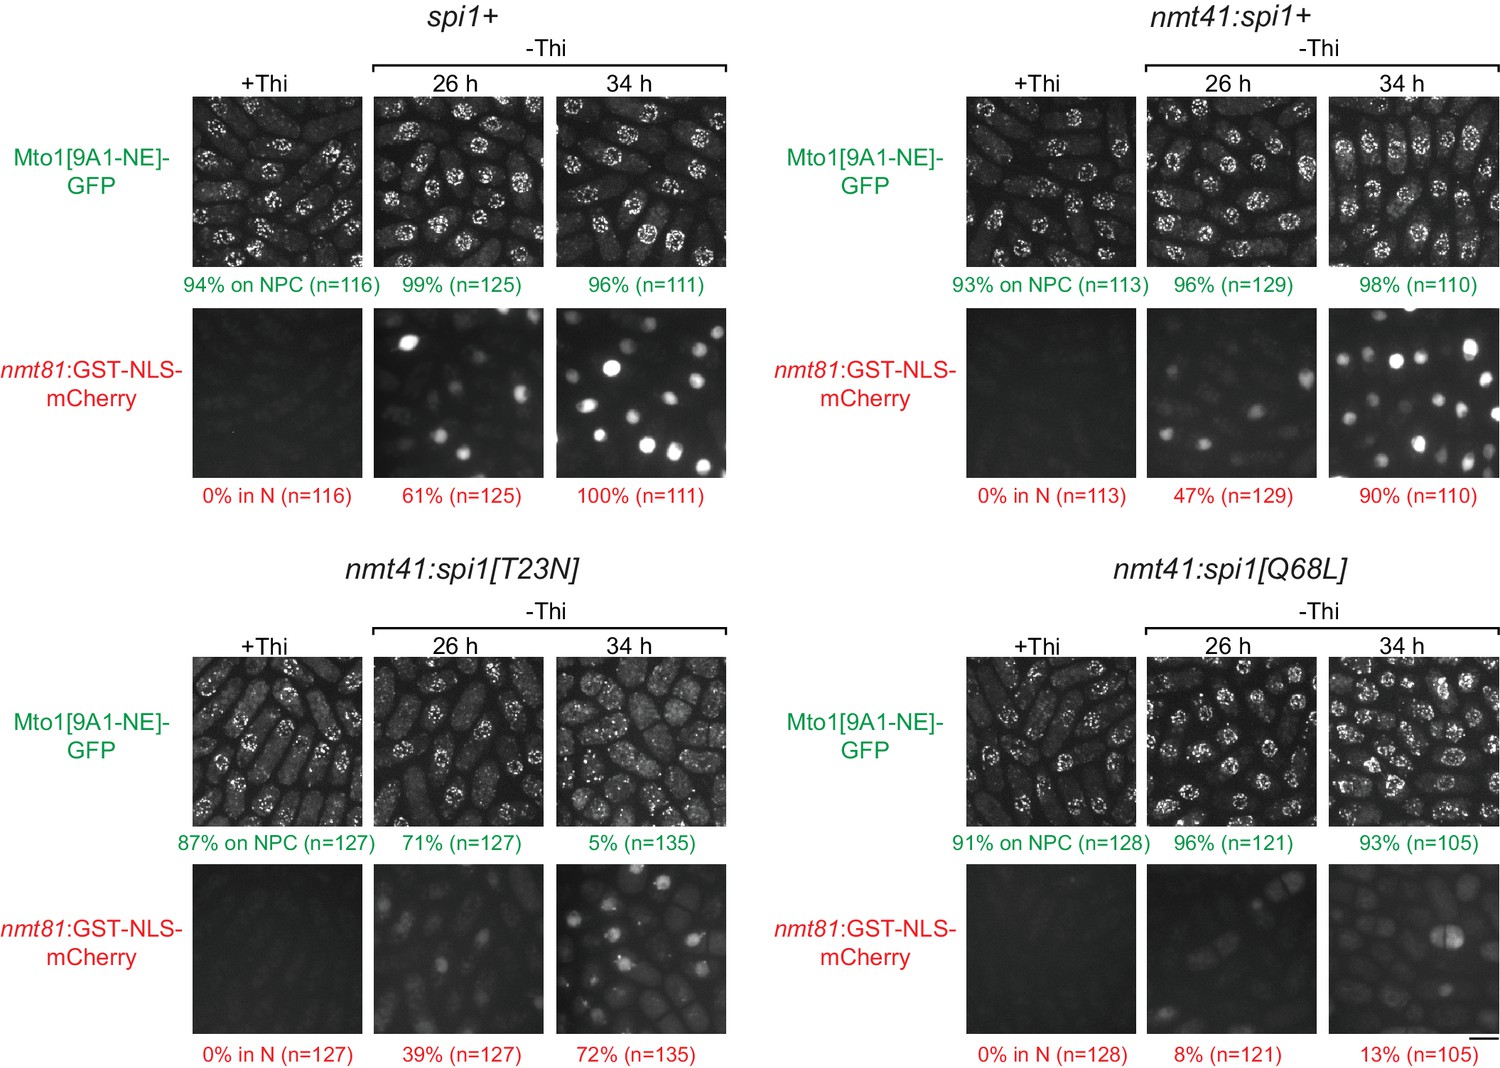
Effects of mutant Ran (spi1 in fission yeast) on Mto1[NE] localization to nuclear pore complexes and on import of a nuclear localization signal (NLS) reporter.
Localization of Mto1[9A1-NE]-GFP, together with nuclear-localization-signal (NLS) reporter GST-NLS-mCherry, in wild-type control cells (spi1+) and in cells expressing transgenes for wild-type Ran (nmt41:spi1+), dominant-negative Ran (nmt41:spi1[T23N]), or constitutively active Ran (nmt41:spi1[Q68L]), under the control of the medium-strength thiamine-repressible nmt41 promoter. Cells are shown in the presence of thiamine (+Thi), and 26 and 34 hr after removal of thiamine to induce expression (-Thi). GST-NLS-mCherry expression is under control of the low-strength thiamine-repressible nmt81 promoter and is therefore also induced after removal of thiamine. As a result, GST-NLS-mCherry reports both the kinetics of thiamine-regulated expression (e.g. 26 vs. 34 hr) and the effects of different Ran mutants on nuclear transport and/or nuclear morphology. Numbers below images indicate percent cells with Mto1[9A1-NE]-GFP on nuclear pore complexes (NPCs; green), and percent cells with GST-NLS-mCherry in the nucleus (N; red). n = total number of cells scored. Images of GST-NLS-mCherry are sum projections, while images of Mto1[9A1-NE]-GFP are maximum projections. Bar, 5 µm.
Figure 6 with 1 supplement
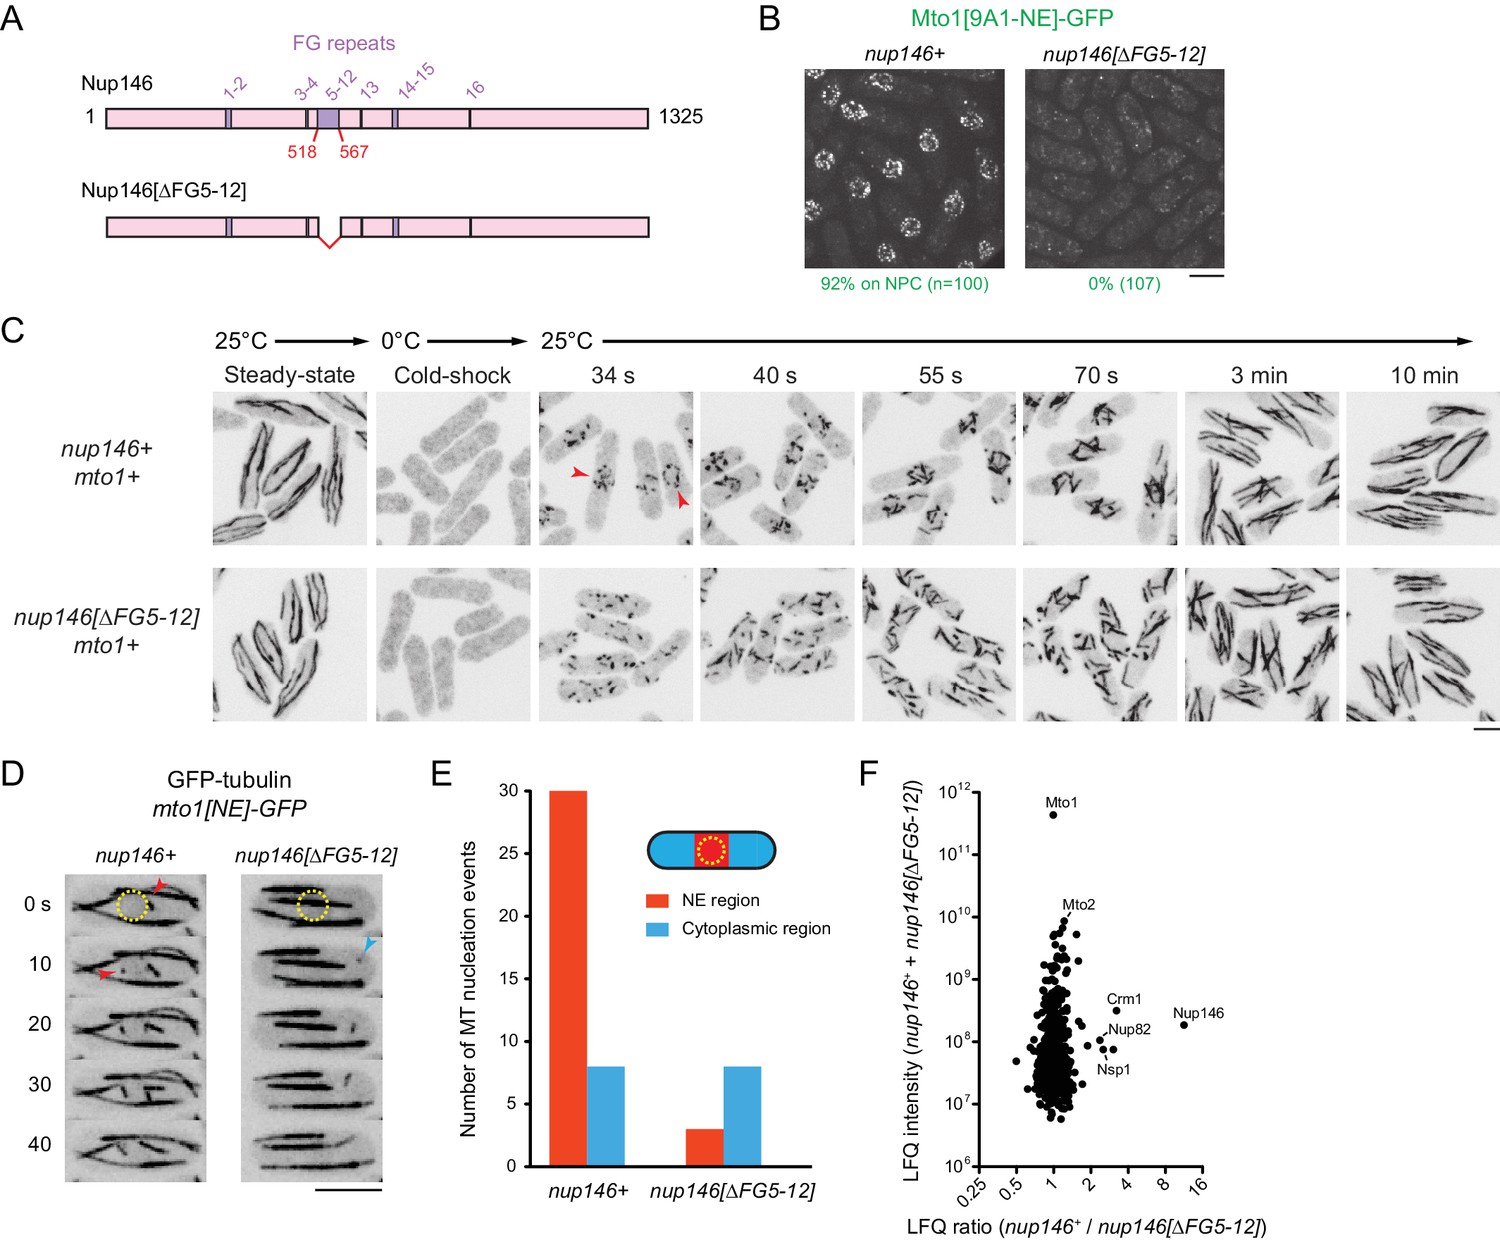
Nup146 FG repeats are required for Mto1[NE] docking at nuclear pore complexes, microtubule nucleation from the nuclear envelope region, and Mto1 interaction with Nup146.
(A) Diagram of Nup146 and Nup146[∆FG5-12]. (B) Localization of Mto1[9A1-NE]-GFP in wild-type (nup146+) and nup146[∆FG5-12] cells. Numbers below images indicate percent cells with Mto1 on NPCs (n = total number of cells scored). (C) Anti-tubulin immunofluorescence of wild-type (nup146+) and nup146[∆FG5-12] cells during microtubule (MT) regrowth after cold-induced MT depolymerization. Both strains express full-length, wild-type Mto1. Arrowheads in nup146+ cells indicate examples of MT regrowth from the nuclear envelope (NE), which does not occur in nup146[∆FG5-12] cells. (D) GFP-tubulin images from time-lapse video showing MT nucleation in wild-type (nup146+) and nup146[∆FG5-12] cells. Yellow dashed line indicates cell nucleus. Red arrowheads indicate nucleation from the NE region. Blue arrowhead indicates nucleation from non-NE cytoplasmic region. In these cells, Mto1[NE] is also tagged with GFP but is too faint to be seen relative to GFP-tubulin. (E) Quantification of MT nucleation from videos of the type shown in D. Numbers represent total number of events for 90 cells of each strain, imaged for 100 s. Differences between strains were highly significant (p=0.0026; Fisher’s exact test, two-sided). (F) Mass spectrometry label-free quantification (LFQ) of 512 proteins from samples of cross-linked, purified GFP-Mto1[9A1-NE]-HTB from wild-type (nup146+) and from nup146[∆FG5-12] cells. ‘LFQ ratio’ indicates relative enrichment of a given protein in the purified sample from nup146+ cells compared to the purified sample from nup146[∆FG5-12] cells. ‘LFQ intensity’ indicates total intensity (arbitrary units) of a given protein from the combined purified samples. Data shown represent geometric mean from two independent biological replicates. Nup82 and Nsp1 are labeled because they are likely to interact with Nup146, based on homology with budding yeast (Belgareh et al., 1998). See also Table 4. Complete datasets are in Supplementary file 6. Bars, 5 µm.
Figure 6—figure supplement 1
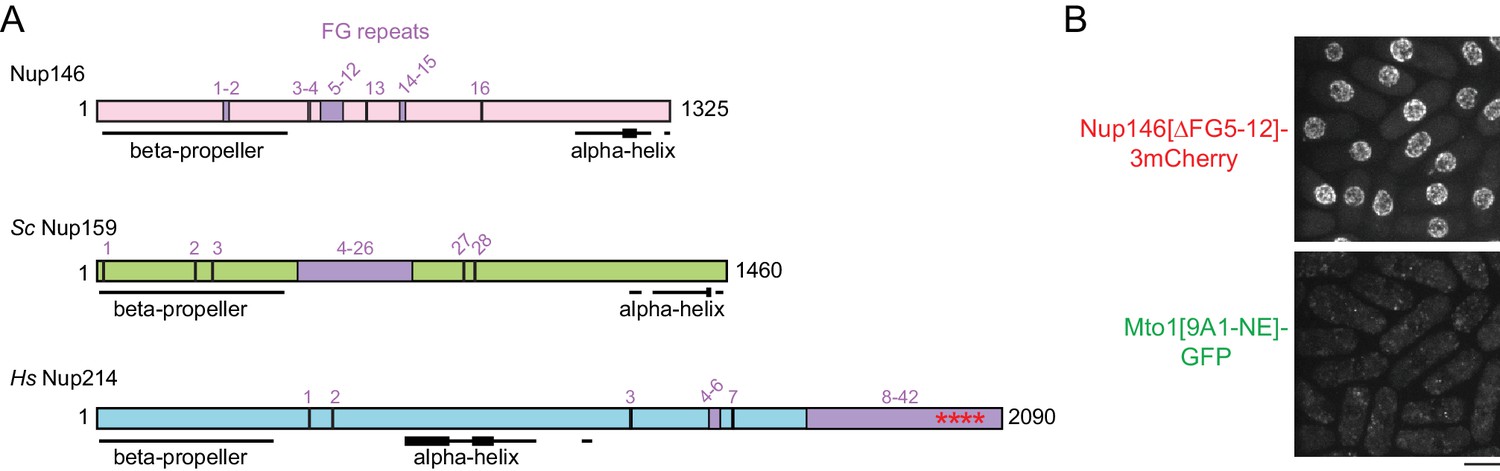
Additional characterization of Nup146[∆FG5-12].
(A) Diagram of S. pombe Nup146 (see Figure 6), together with homologs S. cerevisiae Nup159 and H. sapiens Nup214. Note rearranged domain organization in Nup214. All FG (Phe-Gly) sequence repeats are numbered, although some (e.g. near N-terminus) may not interact with nuclear transport receptors. Where FG repeats are densely distributed, the corresponding region is labeled. Asterisks in Nup214 indicate structured portion of FG repeats observed in co-crystal with Crm1 (Port et al., 2015). Beta-propeller structures in Sc Nup159 and Hs Nup214 have been experimentally verified (Weirich et al., 2004; Napetschnig et al., 2007) and bind to RNA helicases Sc Dbp5 and Hs Ddx19 (respectively), which are involved in mRNP processing in terminal stages of mRNA export. Beta-propeller structure in Nup146 is predicted (Weirich et al., 2004). Alpha-helical regions were predicted using JPred4 (Drozdetskiy et al., 2015). Thicker lines in alpha-helical regions indicate predicted coiled-coils or amphipathic helices. Alpha-helix at the C-terminus of Sc Nup159 is involved in forming a heterotrimeric complex with Sc Nup82 and Sc Nup116 (Yoshida et al., 2011), whose counterparts in fission yeast are Nup82 and Nup189n, respectively. (B) Localization of Nup146[∆FG5-12]−3mCherry to NPCs, with corresponding localization of Mto1[9A1-NE]-GFP.
Figure 7 with 1 supplement
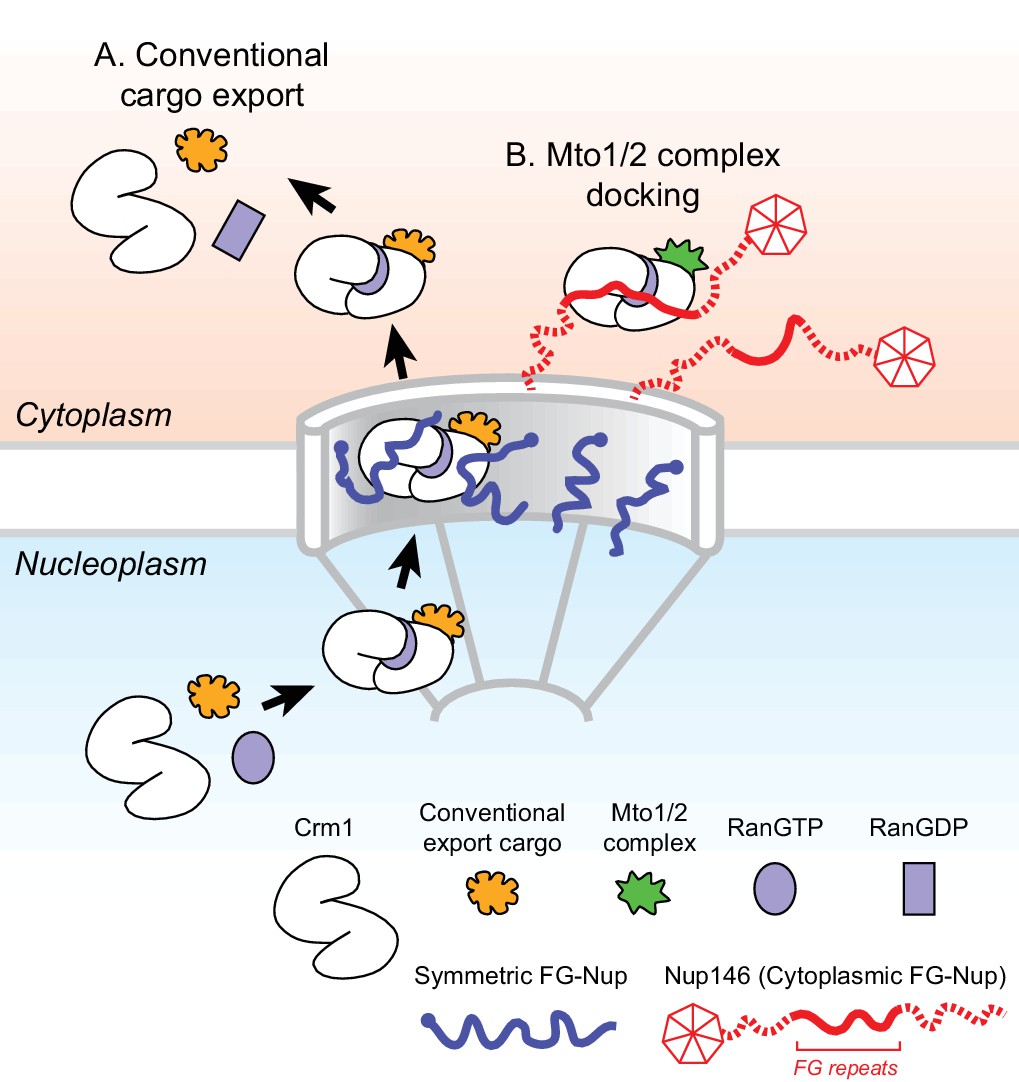
Model for Mto1/2 complex docking at the nuclear pore complex (NPC), compared to conventional nuclear export.
(A) Conventional export cargos form a trimeric complex with Crm1 and RanGTP in the nucleus. Passage through NPC permeability barrier depends on interaction of export complexes with FG repeats of symmetric FG-Nups. While passing through the NPC, some export complexes may also interact with FG repeats of Nup146 (not shown). Once in the cytoplasm, export complexes are disassembled by soluble RanBP1 and RanGAP, and RanGTP is hydrolyzed to RanGDP (here, multiple steps are simplified to a single step). (B) Mto1/2 complex docked at NPC. Mto1/2 is sourced from a cytoplasmic pool rather than a nucleoplasmic pool. The Mto1 NES-M binds Crm1 by mimicking an export cargo, and the docking complex binds to cytoplasmic FG-Nup Nup146. Docking requires RanGTP and FG repeats of Nup146. See also Figure 7—figure supplement 1.
Figure 7—figure supplement 1

Models for stable docking of a high-affinity NES cargo at the cytoplasmic face of the nuclear pore complex via Nup146 and for formation of export-like complexes from cytoplasmic cargo.
(A) Speculative model for how a high-affinity NES cargo could become docked at the cytoplasmic face of the nuclear pore complex (NPC). In diagrams, only the FG-repeat region of Nup146 is shown; by analogy to Sc Nup159, Nup146 is assumed to be anchored at the cytoplasmic face of the NPC by interaction of its C-terminal domain with partners Nup82 and Nsp1. Binding of Crm1 to cargo, RanGTP and Nup146 FG repeats all contribute cooperatively to Crm1 compact conformation. Therefore, 1) if cargo has only low affinity for Crm1, then after partial release of Nup146 FG repeats from Crm1, the trimeric export complex (Crm1, cargo and RanGTP) can disassemble, releasing cargo into the cytoplasm. However, 2) if cargo has a high affinity for Crm1, then stabilization of the Crm1 compact conformation by cargo binding allows partially released FG repeats to rebind to Crm1. Increased stability of interaction between trimeric complex and Nup146 FG repeats leads to increased residence time at the cytoplasmic face of the NPC. See main text for further details. (B) ‘Cargo-handover’ as a potential mechanism for incorporating high-affinity NES cargos from the cytoplasm into export-like complexes at the cytoplasmic face of NPCs. First, a conventional nuclear export complex with a low-affinity NES cargo transiently interacts with Nup146 FG repeats during passage through the NPC. Recent integrated structural analysis in budding yeast suggests that FG repeats of Sc Nup159 may be directly adjacent to the symmetric FG-Nups at the centre of the NPC (Fernandez-Martinez et al., 2016); therefore, even though Nup146 FG repeats are not required for export, some proportion of export complexes could be expected to interact with Nup146 during passage through the NPC. Second, low-affinity cargo dissociates from Crm1, while Crm1 remains bound to Nup146 and to RanGTP. Dissociation of low-affinity cargo could be either spontaneous or aided by RanBP1; in both cases, this could occur without dissociation or hydrolysis of RanGTP (Koyama and Matsuura, 2010). In absence of cargo, compact Crm1 conformation (and RanGTP binding) may be partially stabilized by interaction with Nup146 FG repeats, as has been shown for FG repeats of Hs Nup214 (Hutten and Kehlenbach, 2006). Finally, during a ‘window of opportunity’ before dissociation of Crm1 from Nup146, a high-affinity NES cargo such as the Mto1 NES-M can bind to Crm1 to generate the export-like complex.
Tables
Table 1
Data for selected proteins from mass spectrometry comparison of GFP-Mto1[9A1-NE]-HTB and GFP-Mto1[9A1-bonsai]-HTB interactomes.
Peptide counts and label-free quantification (LFQ) values for selected proteins shown in Figure 1F. Data from two independent biological replicates are shown. Nsp1 and Nup82 are included as likely representative Nup146 interactors, based on homology to budding yeast (Belgareh et al., 1998). See also Supplementary file 3.
| Protein | Replicate 1 (E160307) | Replicate 2 (E161126) | ||||||||
|---|---|---|---|---|---|---|---|---|---|---|
| Peptides from strain KS7611 | Peptides from strain KS8371 | LFQ intensity from strain KS7611 | LFQ intensity from strain KS8371 | LFQ ratio | Peptides from strain KS7611 | Peptides from strain KS8371 | LFQ intensity from strain KS7611 | LFQ intensity from strain KS8371 | LFQ ratio | |
| Alp7 | 17 | 3 | 2.3e8 | 7.5e6 | 30.5 | 14 | 5 | 1.9e8 | 3.7e7 | 5.2 |
| Crm1 | 20 | 5 | 2.7e8 | 1.7e7 | 15.6 | 18 | 5 | 2.7e8 | 2.0e7 | 13.7 |
| Mto1 | 59 | 46 | 2.8e11 | 2.3e11 | 1.2 | 52 | 43 | 2.8e11 | 2.5e11 | 1.1 |
| Mto2 | 14 | 20 | 6.6e9 | 5.1e9 | 1.3 | 16 | 22 | 6.7e9 | 5.8e9 | 1.2 |
| Nsp1 | 14 | 11 | 2.5e8 | 1.8e8 | 1.4 | 14 | 12 | 2.2e8 | 1.3e8 | 1.7 |
| Nup146 | 20 | 2 | 2.1e8 | 7.7e6 | 27.3 | 20 | 1 | 2.1e8 | NQ | NQ |
| Nup82 | 13 | 9 | 1.5e8 | 7.3e7 | 2.1 | 9 | 4 | 7.4e7 | 2.2e7 | 3.4 |
| Plo1 | 28 | 13 | 4.9e8 | 1.1e8 | 4.6 | 20 | 9 | 3.3e8 | 6.3e7 | 5.3 |
-
NQ = not quantified, because peptide count in the relevant sample was below threshold for quantification.
Table 2
Data for selected proteins from mass spectrometry comparison of GFP-Mto1[9A1-NE]-HTB interactomes from control cells and after treatment with leptomycin B.
Peptide counts and label-free quantification (LFQ) values for selected proteins from the two replicate experiments contributing to the graph in Figure 3C. See also Supplementary file 4.
| Protein | Replicate 1 (E150924) | Replicate 2 (E151106) | ||||||||
|---|---|---|---|---|---|---|---|---|---|---|
| Peptides from strain KS7669 -LMB | Peptides from strain KS7669 +LMB | LFQ intensity from strain KS7669 -LMB | LFQ intensity from strain KS7669 + LMB | LFQ ratio | Peptides from strain KS7669-LMB | Peptides from strain KS7669 +LMB | LFQ intensity from strain KS7669 -LMB | LFQ intensity from strain KS7669 + LMB | LFQ ratio | |
| Alp7 | 20 | 13 | 2.5e8 | 1.4e8 | 1.7 | 14 | 15 | 6.3e8 | 4.4e8 | 1.4 |
| Crm1 | 17 | 4 | 1.1e8 | 1.3e7 | 9.0 | 19 | 3 | 2.9e8 | 6.8e6 | 43.3 |
| Mto1 | 59 | 58 | 2.6e11 | 2.9e11 | 0.9 | 58 | 59 | 6.1e11 | 6.7e11 | 0.9 |
| Mto2 | 7 | 7 | 2.0e8 | 2.2e8 | 0.9 | 5 | 5 | 6.5e8 | 8.4e8 | 0.8 |
| Nsp1 | 7 | 7 | 6.9e7 | 6.0e7 | 1.2 | 11 | 11 | 3.7e8 | 3.7e8 | 1.0 |
| Nup146 | 14 | 8 | 7.4e7 | 3.3e7 | 2.3 | 12 | 5 | 1.9e8 | 5.6e7 | 3.4 |
| Nup82 | 9 | 10 | 4.5e7 | 7.6e7 | 0.6 | 9 | 9 | 1.7e8 | 2.9e8 | 0.6 |
| Plo1 | 26 | 26 | 2.4e8 | 2.4e8 | 1.0 | 25 | 27 | 8.5e8 | 7.7e8 | 1.1 |
Table 3
Data for selected proteins from mass spectrometry comparison of GFP-Mto1[9A1-NE]-HTB and GFP-Mto1[∆NES-9A1-NE]-HTB interactomes.
Peptide counts and label-free quantification (LFQ) values for selected proteins shown in Figure 4D. Data from two independent biological replicates are shown. See also Supplementary file 5.
| Protein | Replicate 1 (E160419) | Replicate 2 ((E161127) | ||||||||
|---|---|---|---|---|---|---|---|---|---|---|
| Peptides from strain KS7611 | Peptides from strain KS8573 | LFQ intensity from strain KS7611 | LFQ intensity from strain KS8573 | LFQ ratio | Peptides from strain KS7611 | Peptides from strain KS8573 | LFQ intensity from strain KS7611 | LFQ intensity from strain KS8573 | LFQ ratio | |
| Alp7 | 15 | 14 | 2.2e8 | 1.4e8 | 1.5 | 12 | 9 | 2.1e8 | 1.4e8 | 1.5 |
| Crm1 | 21 | 2 | 2.9e8 | 3.4e6 | 85.2 | 20 | 2 | 3.5e8 | 5.5e6 | 63.4 |
| Mto1 | 47 | 47 | 3.1e11 | 3.2e11 | 1.0 | 40 | 40 | 3.1e11 | 3.2e11 | 1.0 |
| Mto2 | 10 | 10 | 4.8e9 | 4.1e9 | 1.2 | 8 | 8 | 6.3e9 | 5.9e9 | 1.1 |
| Nsp1 | 10 | 9 | 2.2e8 | 1.2e8 | 1.8 | 10 | 9 | 2.4e8 | 1.0e8 | 2.4 |
| Nup146 | 15 | 3 | 2.0e8 | 9.5e6 | 20.7 | 19 | 0 | 1.5e8 | NQ | NQ |
| Nup82 | 10 | 7 | 8.1e7 | 2.2e7 | 3.7 | 6 | 2 | 5.1e7 | NQ | NQ |
| Plo1 | 17 | 15 | 2.5e8 | 1.6e8 | 1.5 | 17 | 10 | 2.2e8 | 1.8e8 | 1.2 |
-
NQ = not quantified, because peptide count and/or LFQ intensity in the relevant samples was below threshold for quantification.
Table 4
Data for selected proteins from mass spectrometry comparison of GFP-Mto1[9A1-NE]-HTB interactomes in wild-type (nup146+) and nup146[∆FG5-12] cells.
Peptide counts and label-free quantification (LFQ) values for selected proteins from the two replicate experiments contributing to the graph in Figure 6F. Complete datasets are in Supplementary file 6.
| Protein | Replicate 1 (E170214) | Replicate 2 (E170306) | ||||||||
|---|---|---|---|---|---|---|---|---|---|---|
| Peptides from strain KS9021 | Peptides from strain KS9077 | LFQ intensity from strain KS9021 | LFQ intensity from strain KS9077 | LFQ ratio | Peptides from strain KS9021 | Peptides from strain KS9077 | LFQ intensity from strain KS9021 | LFQ intensity from strain KS9077 | LFQ ratio | |
| Alp7 | 17 | 15 | 1.4e8 | 1.4e8 | 1.0 | 16 | 16 | 1.0e8 | 8.2e7 | 1.3 |
| Crm1 | 31 | 17 | 3.4e8 | 9.2e7 | 3.6 | 27 | 18 | 1.7e8 | 6.1e7 | 2.9 |
| Mto1 | 62 | 61 | 2.7e11 | 2.6e11 | 1.0 | 55 | 54 | 1.7e11 | 1.8e11 | 0.9 |
| Mto2 | 12 | 12 | 6.0e9 | 5.0e9 | 1.2 | 13 | 13 | 3.8e9 | 3.1e9 | 1.2 |
| Nsp1 | 11 | 3 | 8.3e7 | 2.7e7 | 3.0 | 9 | 4 | 3.5e7 | 1.7e7 | 2.1 |
| Nup146 | 29 | 6 | 2.1e8 | 1.5e7 | 13.9 | 31 | 10 | 1.4e8 | 1.5e7 | 9.2 |
| Nup82 | 13 | 10 | 1.1e8 | 4.0e7 | 2.8 | 12 | 11 | 4.9e7 | 2.5e7 | 2.0 |
| Plo1 | 17 | 17 | 1.5e8 | 1.3e8 | 1.1 | 17 | 17 | 1.1e8 | 8.1e7 | 1.3 |
Key resources table
| Reagent type (species) or resource | Designation | Source or reference | Identifiers | Additional information |
|---|---|---|---|---|
| Gene (Schizosaccharomyces pombe) | Mto1 | NA | Pombase:SPCC417.07c | |
| Gene (S. pombe) | Mto2 | NA | Pombase:SPBC902.06 | |
| Gene (S. pombe) | Crm1 | NA | Pombase:SPAC1805.17 | |
| Gene (S. pombe) | Nup146 | NA | Pombase:SPAC23D3.06c | |
| Gene (S. pombe) | Alp7 | NA | Pombase:SPAC890.02c | |
| Gene (S. pombe) | Nup132 | NA | Pombase:SPAC1805.04 | |
| Gene (S. pombe) | Spi1 | NA | Pombase:SPBC1289.03c | Spi1 is the S. pombe gene name for Ran GTPase |
| Gene (S. pombe) | Plo1 | NA | Pombase:SPAC23C11.16 | |
| Gene (S. pombe) | Alp14 | NA | Pombase:SPCC895.07 | |
| Gene (Saccharomyces cerevisiae) | Nup159 | NA | SGD:S000001377 | Alternate systematic name YIL115C |
| Gene (Homo sapiens) | Nup214 | NA | HGNC:8064 | Alternate name CAN |
| Antibody | TAT1 anti-tubulin (mouse monoclonal) | PMID:2606940 | (1:15 of hybridoma supernatant) | |
| Antibody | Alexa Fluor 488 secondary (donkey anti-mouse polyclonal) | Thermo Fisher Scientific | Thermo Fisher Scientific :A-21202; RRID:AB_141607 | (1:80) |
| Antibody | anti-GFP (rabbit polyclonal) | Rockland | Rockland:600-401-215; RRID:AB_828167 | (1:400) |
| Antibody | Alexa 594 FluoroNanogold Fab’ fragment (goat anti-rabbit polyclonal) | Nanoprobes | Nanoprobes:7304 | (1:400) |
| Antibody | anti-GFP (sheep polyclonal) | other | homemade lab stock; used for immunoprecipitation | |
| Commercial assay or kit | QuikChange II Site Directed Mutagenesis Kit | Agilent | Agilent:200523 | |
| Chemical compound, drug | Leptomycin B | LC Laboratories | LC Laboratories: L-6100 | |
| Software, algorithm | Metamorph | Molecular Devices | RRID:SCR_002368 | |
| Software, algorithm | Image J | NIH | RRID:SCR_003070 | |
| Software, algorithm | Prism | Graphpad | RRID:SCR_002798 | |
| Software, algorithm | Photoshop | Adobe | RRID:SCR_014199 | |
| Software, algorithm | Illustrator | Adobe | RRID:SCR_010279 | |
| Software, algorithm | MaxQuant | PMID:19029910 | RRID:SCR_014485 | |
| Software, algorithm | MaxLFQ | PMID:24942700 | ||
| Software, algorithm | Pombase | PMID:25361970 | RRID:SCR_006586 | |
| Other | DAPI | Thermo Fisher Scientific | Thermo Fisher Scientific: D1306; RRID:AB_2629482 | |
| Other | Protein G Dynabeads | Thermo Fisher Scientific | Thermo Fisher Scientific: 10003D | |
| Other | Fractogel EMD Chelate (M) | Merck KGaA | Merck:1.10338.0010 | |
| Other | Nanolink streptavidin magnetic beads | Trilink | Trilink:M-1002 |
Additional files
-
Supplementary file 1
Yeast strains, plasmids and oligonucleotides used in this work.
- https://doi.org/10.7554/eLife.33465.024
-
Supplementary file 2
Mass spectrometry data and summary from preliminary SILAC experiment.
- https://doi.org/10.7554/eLife.33465.025
-
Supplementary file 3
Combined mass spectrometry data and LFQ summaries for experiments shown in Figure 1.
- https://doi.org/10.7554/eLife.33465.026
-
Supplementary file 4
Combined mass spectrometry data and LFQ summaries for experiments shown in Figure 3.
- https://doi.org/10.7554/eLife.33465.027
-
Supplementary file 5
Combined mass spectrometry data and LFQ summaries for experiments shown in Figure 4.
- https://doi.org/10.7554/eLife.33465.028
-
Supplementary file 6
Combined mass spectrometry data and LFQ summaries for experiments shown in Figure 6.
- https://doi.org/10.7554/eLife.33465.029
-
Transparent reporting form
- https://doi.org/10.7554/eLife.33465.030
Download links
A two-part list of links to download the article, or parts of the article, in various formats.
Downloads (link to download the article as PDF)
Open citations (links to open the citations from this article in various online reference manager services)
Cite this article (links to download the citations from this article in formats compatible with various reference manager tools)
Exportin Crm1 is repurposed as a docking protein to generate microtubule organizing centers at the nuclear pore
eLife 7:e33465.
https://doi.org/10.7554/eLife.33465


