LRRTM1 underlies synaptic convergence in visual thalamus
- Virginia Tech Carilion Research Institute, United States
- Virginia Tech, United States
- Virginia Tech Carilion School of Medicine, United States
- Roanoke Valley Governor School, United States
Figures
Figure 1 with 1 supplement

Retinal projections develop into unique terminal types in dLGN.
(A) Schematic of the mouse brain highlighting the main retinorecipient regions including dLGN. (B) Development of VGluT2+ retinal terminals in dLGN and vLGN in wild type mice. (C–G) Cumulative (cum.) distribution of VGluT2+ puncta size in P3 (C), P8 (D), P14 (E), P25 (F) and P62 (G) dLGN (orange) and vLGN (blue). Data are shown as Mean ±SEM. (H) Average total VGluT2+ terminal size in developing dLGN and vLGN. Data are shown as Mean ±SEM, *p<0.0001 by ANOVA. (I) GFP+ retinal terminals in dLGN and superior colliculus (SC) of Mnx1-GFP mice. Red arrowheads highlight gfp-labeled retinal terminals. (J) Cumulative (cum.) distribution of GFP+ puncta size in P25 dLGN (orange) and SC (purple). Data are shown as Mean ±SEM. (K) SBFSEM of retinogeniculate synapses in dLGN of P8 and P14 mice. 3D reconstructions of retinal terminals and relay cell dendrites are depicted below each micrograph. The black arrows denote simple retinogeniculate synapses in P8 and P14 or clusters of retinal terminals originating from multiple RGCs in P14 mouse dLGN. (L) Schematic representation of brainbow-AAV constructs. (M–O) Examples of brainbow-labeled clusters of retinal terminals in dLGN of P8 (M), P10 (N) and P14 (O) Calb2-Cre mice. Arrowheads denote terminals labeled by different colors. Scale bars, 20 µm (B and I), 5 µm (K), 10 µm (M).
Figure 1—figure supplement 1
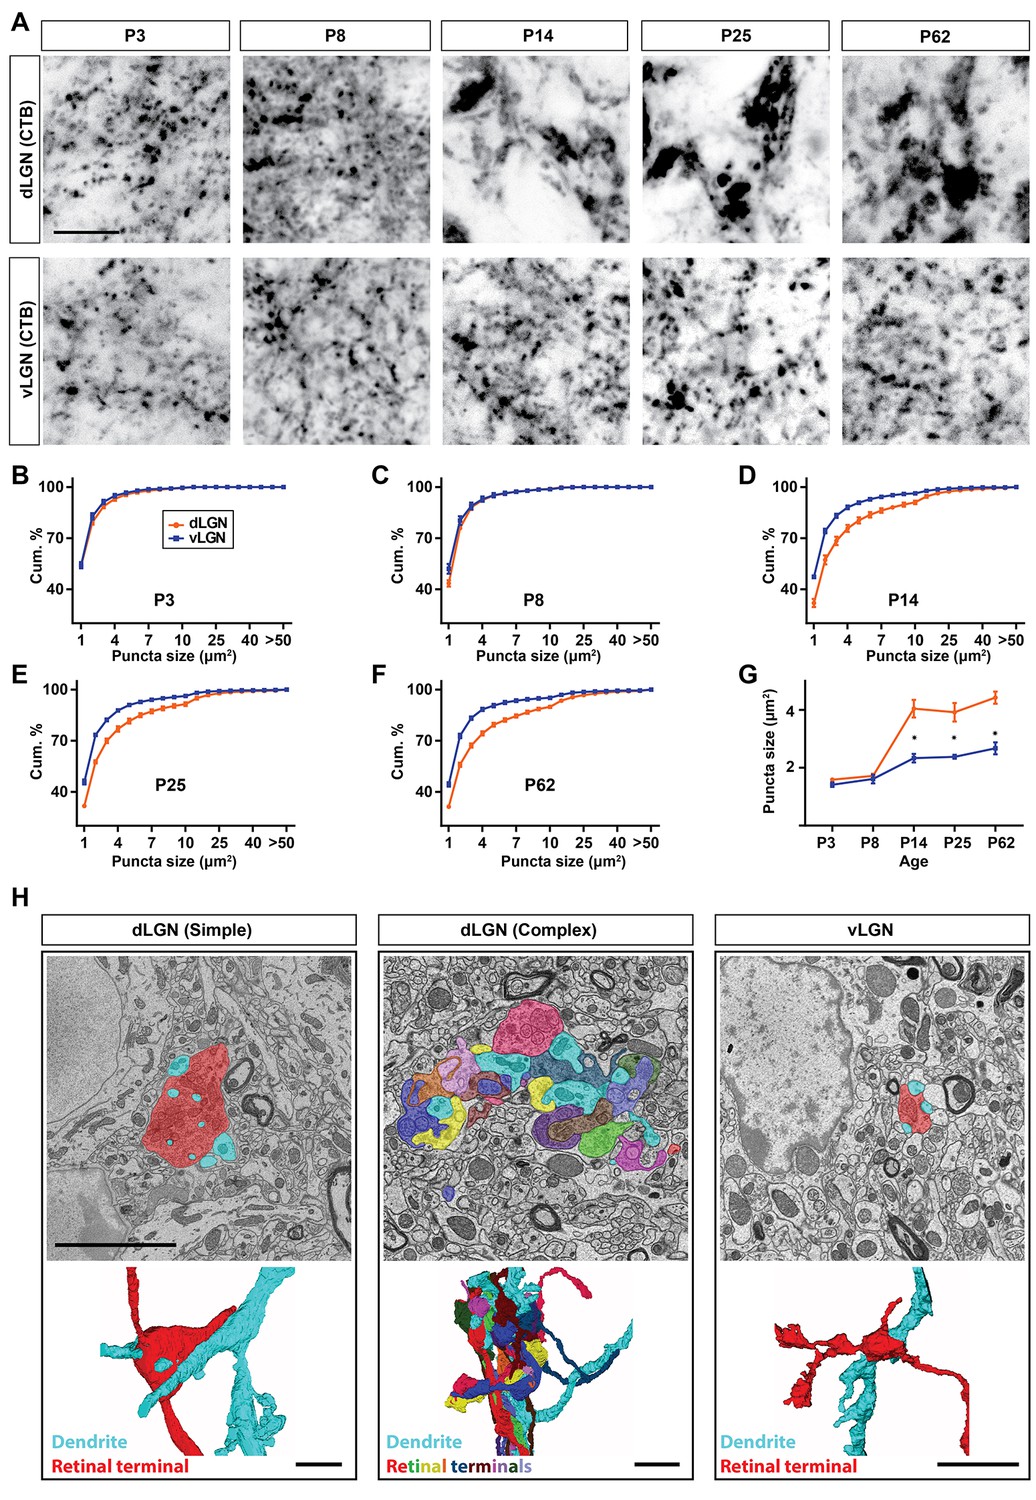
Unique transformation of retinal nerve terminals in the developing dLGN.
(A) Intraocular injection of CTB was used to study the developmental transformation of retinal terminals in dLGN and vLGN in wild type mice. Similar to VGluT2 labeling in Figure 1, CTB-labeled retinal terminals undergo a significant enlargement in dLGN (but not vLGN) at eye-opening. (B–F) Cumulative distribution of CTB-labeled retinal terminal size in the developing mouse dLGN (orange) and vLGN. Data are shown as Mean ±SEM. (G) Average area of CTB-labeled retinal nerve terminals in the developing dLGN (orange) and vLGN (blue). Data represent Mean ±SEM; * indicate terminals in dLGN differ from those in vLGN by p<0.0001 by ANOVA. (H) SBFSEM of retinogeniculate synapses in dLGN and vLGN of P42 mice. 3D reconstruction of retinal terminals and relay cell dendrites are depicted below each micrograph. Scale bars, 10 µm (A), 5 µm (H).
Figure 2 with 1 supplement
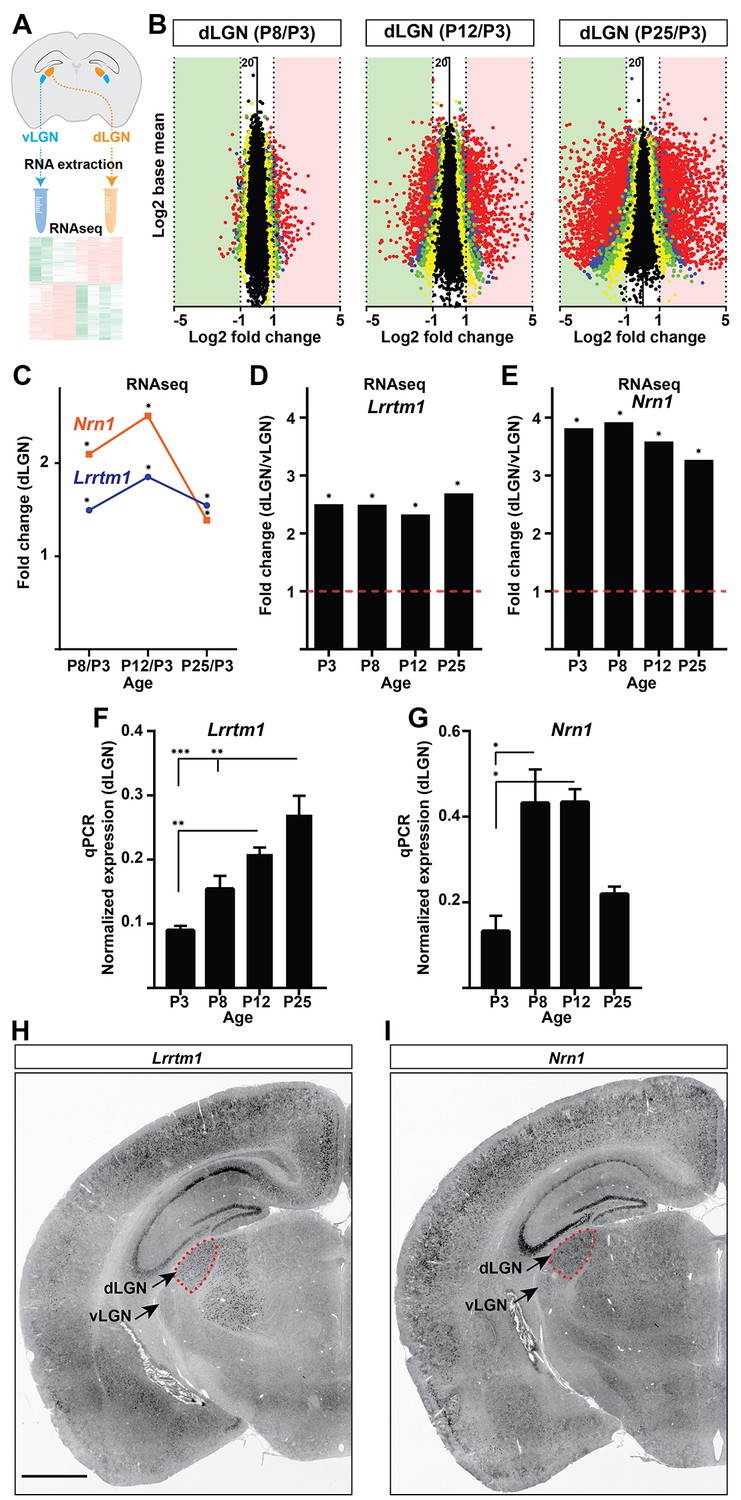
Identification of Lrrtm1 and Nrn1 as candidate synaptic organizing cues in dLGN.
(A) Next generation RNAseq was performed on RNA isolated from dLGN and vLGN at P3, P8, P12 and P25. (B) Volcano scatter plots show differentially expressed mRNAs in the developing dLGN. (C) Relative Lrrtm1 and Nrn1 mRNA levels in dLGN at P8, P12 and P25 compared to P3 by RNAseq. Data are relative values comparing different ages, *p<0.0001 by Wald Chi-Squared Test (DESeq2). (D and E) Enrichment of Lrrtm1 (D) and Nrn1 (E) mRNAs in dLGN compared to vLGN at four ages in wild type mice. Data are relative values comparing dLGN and vLGN, *p<0.0001 by Wald Chi-Squared Test (DESeq2). (F and G) Developmental expression of Lrrtm1 (F) and Nrn1 (G) mRNAs in wild type dLGN by qPCR. Data are shown as Mean ±SEM; ***p<0.0001, **p<0.01, *p<0.05 by ANOVA. (H and I) ISH for Lrrtm1 (F) and Nrn1 (G) mRNAs in coronal sections of wild type P25 mouse brains. Scale bar, 1 mm (H and I).
-
Figure 2—source data 1
- https://doi.org/10.7554/eLife.33498.006
Figure 2—figure supplement 1
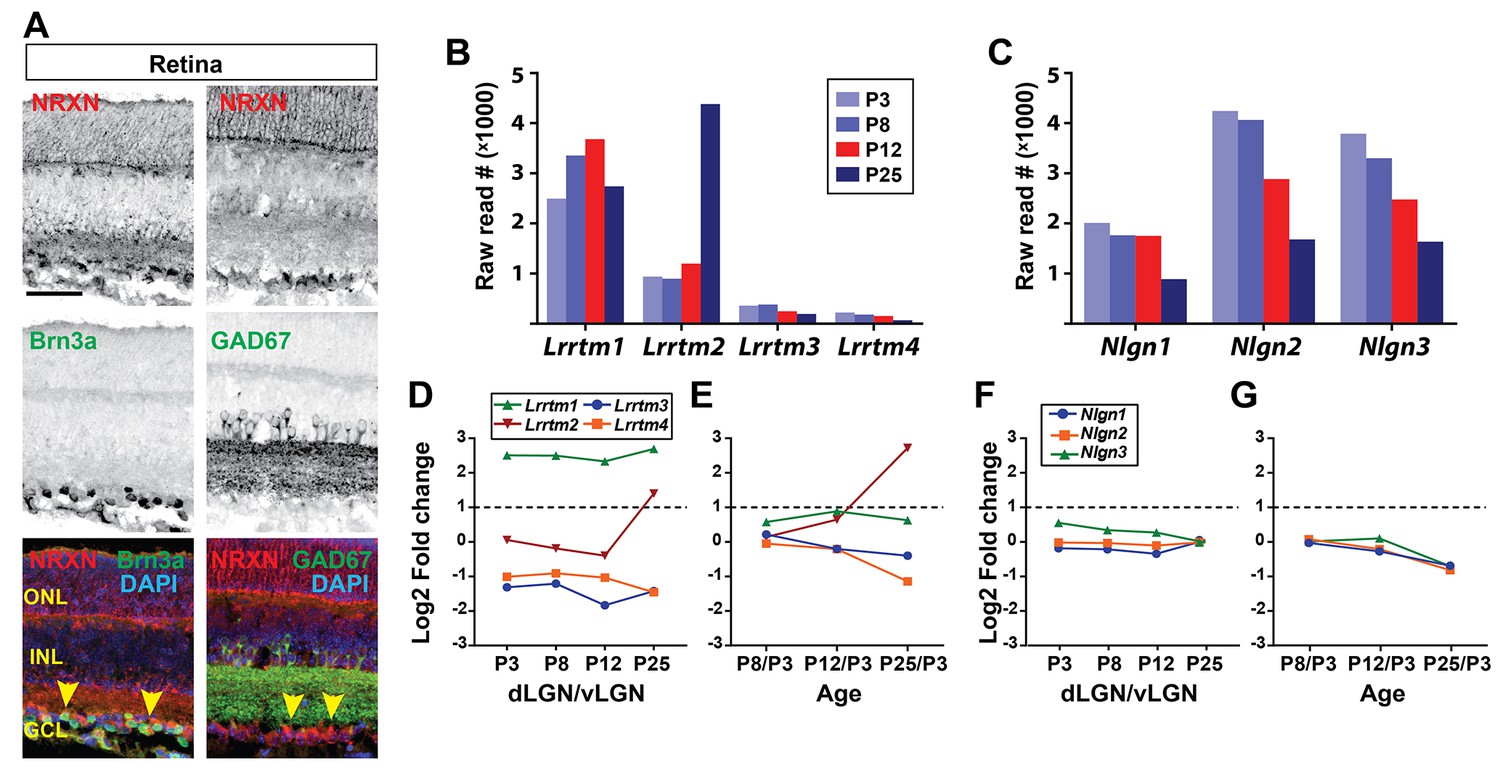
Expression of NRXN proteins and lrrtm, and nlgn mRNAs in the subcortical visual thalamus.
(A) Immunolabeling with a pan-neurexin antibody revealed the presence of neurexins in P12 RGCs. Yellow arrowheads denote neurexin protein expression in RGCs. Brn3a-immunoreactivity labels a subset of RGCs and GAD67-immunoreactivity labels the inner plexiform layer and a subset of cells in INL. (B and C) RNAseq analysis revealed the presence of several neurexin-binding genes that belong to either LRRTM or Neuroligin families of synaptic adhesion proteins. Data are shown as RNA raw reads. (D–G) relative expression values obtained by comparing expression in dLGN to vLGN (D and F) or by comparing expression in dLGN in different ages (E and G). Scale bars, 50 µm (A).
Figure 3 with 1 supplement
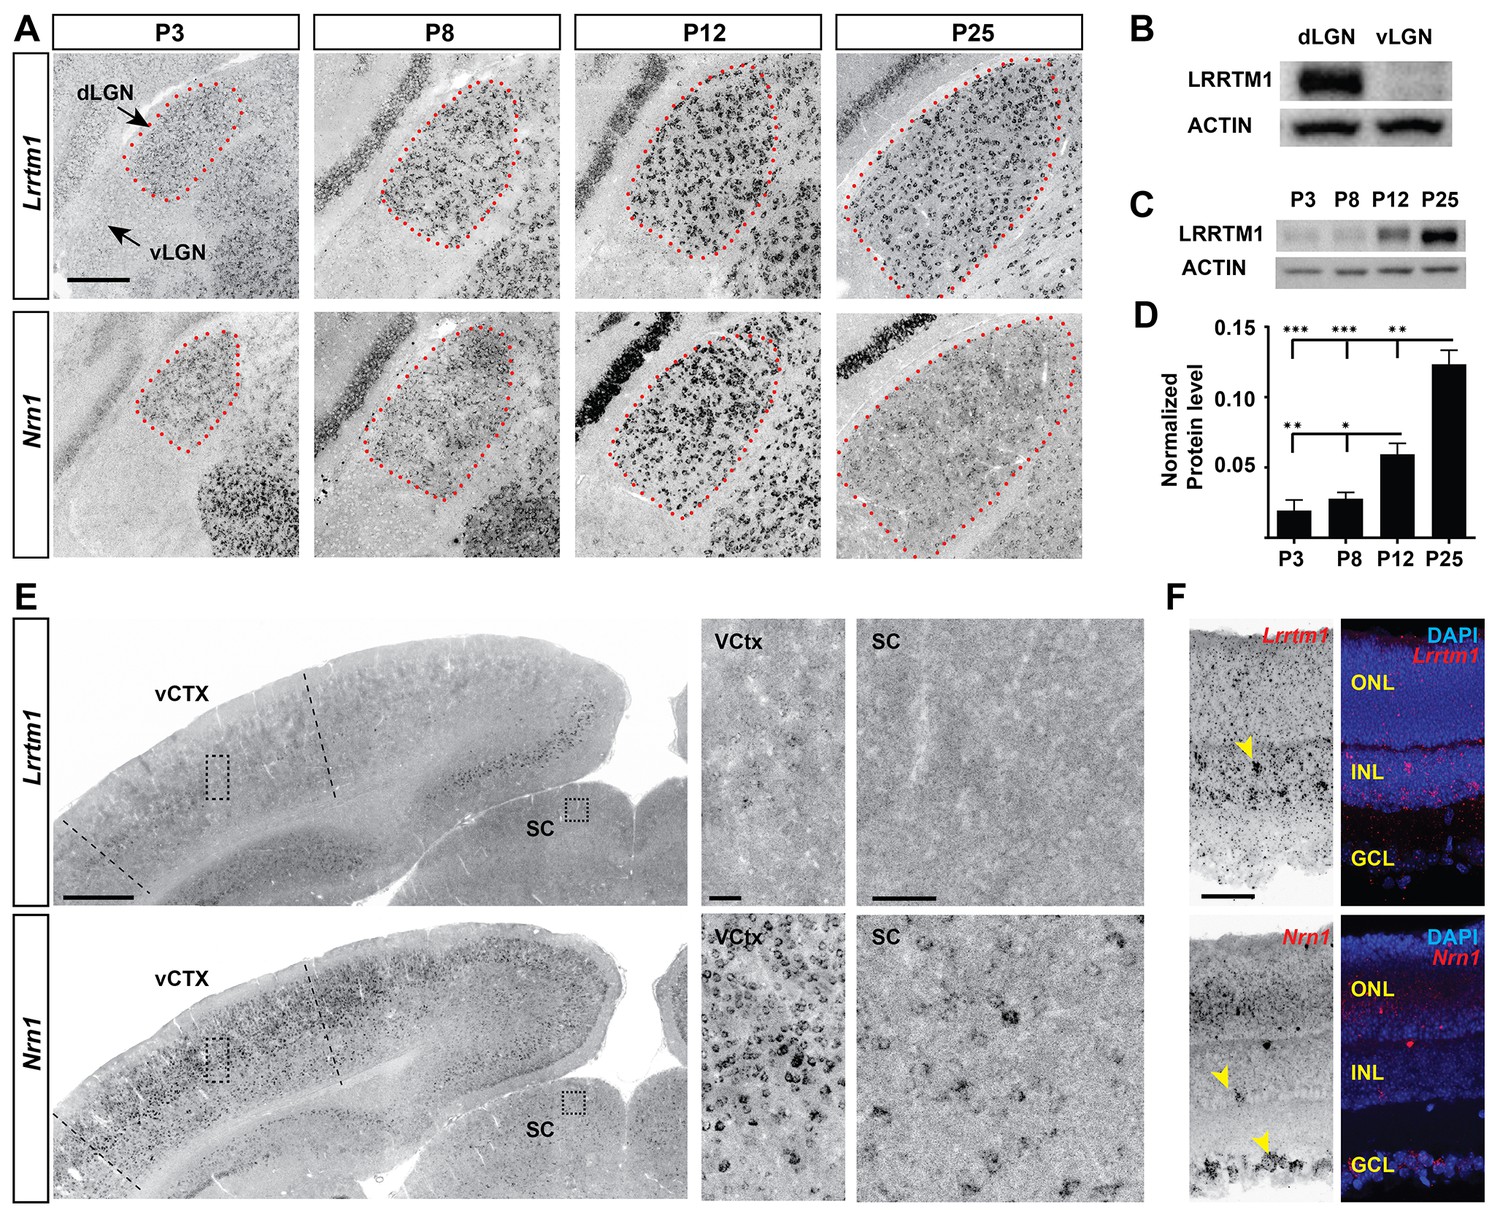
Developmental and region-specific expression of Lrrtm1 and Nrn1.
(A) ISH for Lrrtm1 and Nrn1 mRNAs in the developing visual thalamus. dLGN encircled by red dots. (B–D) Western blots show LRRTM1 protein level is higher in dLGN than vLGN (B) and increases in the dLGN postnatally (C and D). Data are shown as Mean ±SEM; ***p<0.0001, **p<0.01, *p<0.05 by ANOVA. (E) Expression of Lrrtm1 and Nrn1 mRNAs in coronal sections of P25 mouse brains. Boxes in visual cortex (vCTX) and superior colliculus (SC) are shown in higher magnifications on the right. (F) Expression of Lrrtm1 and Nrn1 mRNAs in P25 retina. Yellow arrowheads denote mRNA expression. ONL, outer nuclear layer; INL, inter nuclear layer; GCL, ganglion cell layer. Scale bars, 200 µm (A), 500 µm (E), 50 µm (insets of vCTX and SC and F).
Figure 3—figure supplement 1
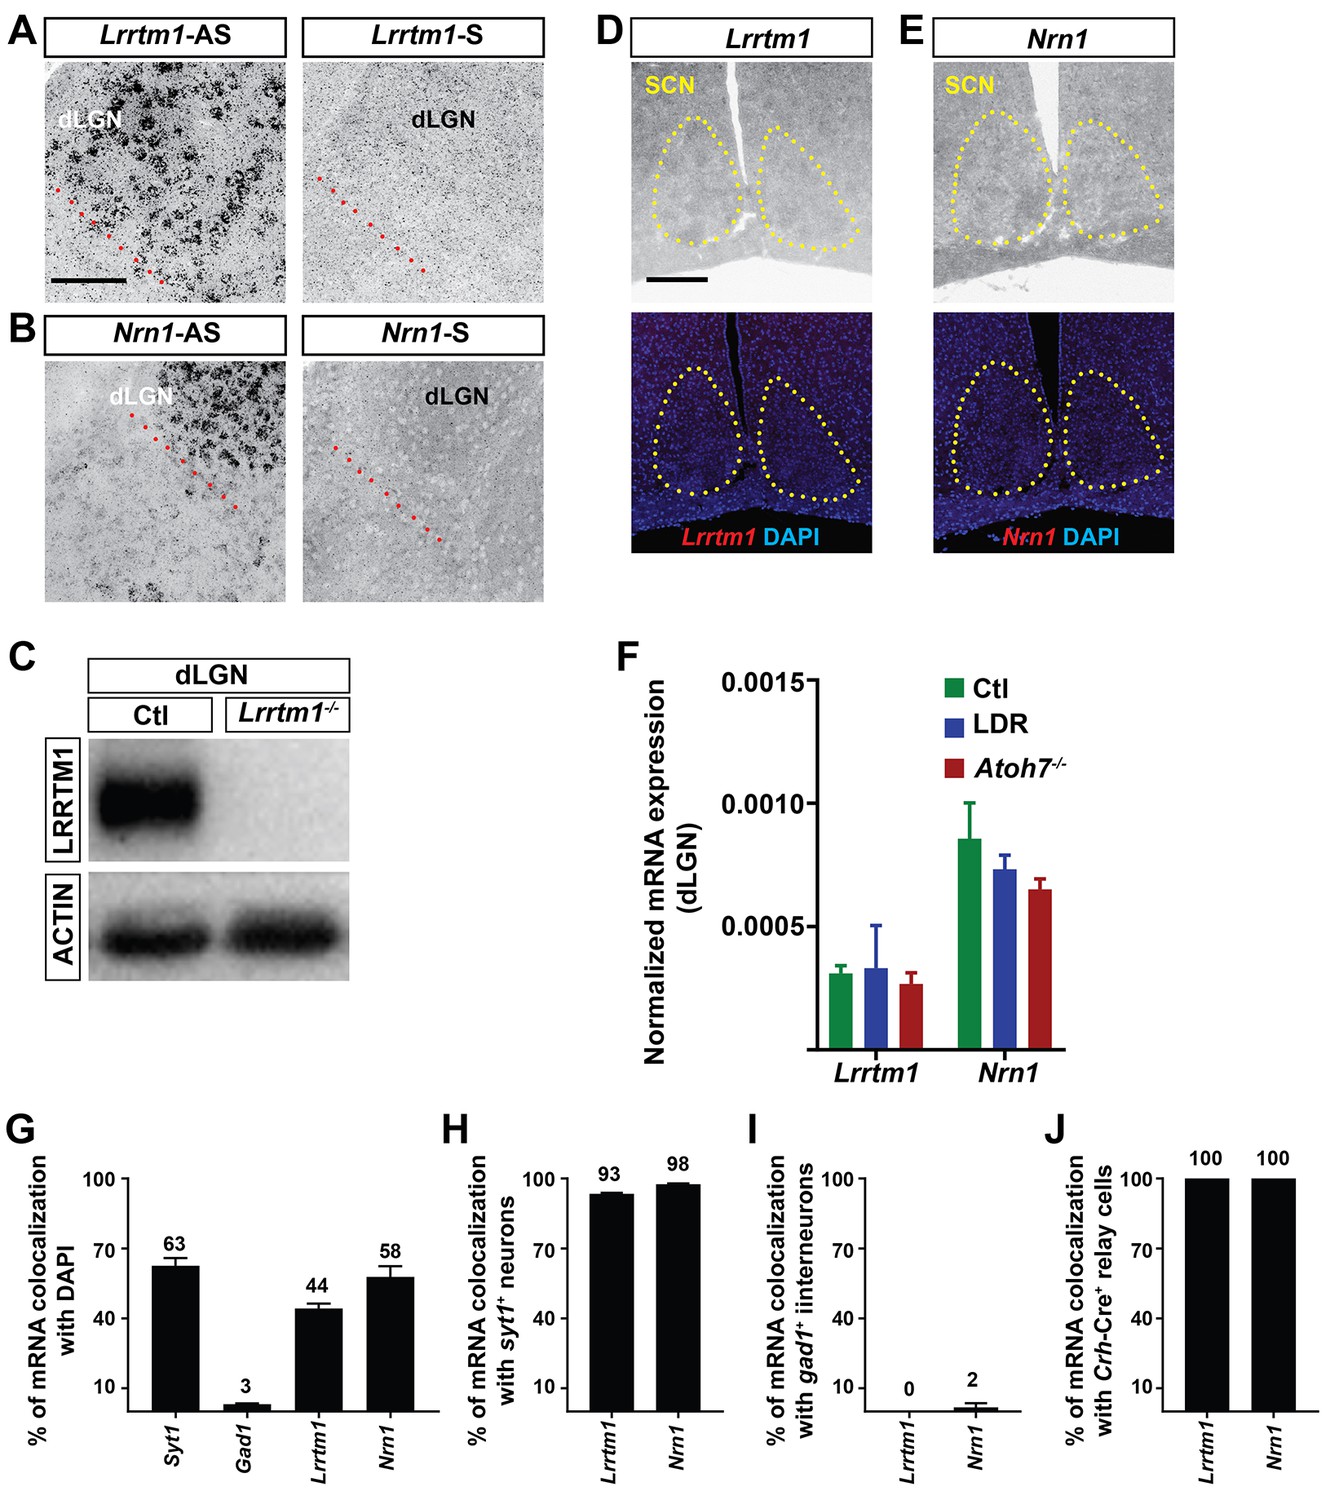
Region- and cell-specific expression of Lrrtm1 and Nrn1.
(A and B) The specificity of antisense riboprobes (AS) against Lrrtm1 (C) and Nrn1 (D) used in this study was confirmed by comparison to sense riboprobes (S). Red dashed line indicates the border separating dLGN from the intergeniculate leaflet and vLGN. (C) Western blots with a LRRTM1 antibody raised against human LRRTM1 confirmed the absence of LRRTM1 in the dLGN of Lrrtm1−/− mice. (D and E) Lrrtm1 (D) and Nrn1 (E) mRNAs are absent from the SCN, the main retinorecipient nucleus involved in providing photic input to the circadian clock. Yellow dashed line indicates SCN. (F) Expression of Lrrtm1 and Nrn1 mRNA in the absence of retinal projections (in P30 Atoh7 mutant mice) and in the absence of visual information (in P30 late dark reared [LDR] mice) in dLGN. (G–J) Percent colocalization of Lrrtm1 and Nrn1 mRNAs with DAPI, Syt1+, Gad1+, and Crh-Cre+ cells in the dLGN of P25-28 mice. Scale bars, 200 µm (A), 100 µm (C).
Figure 4
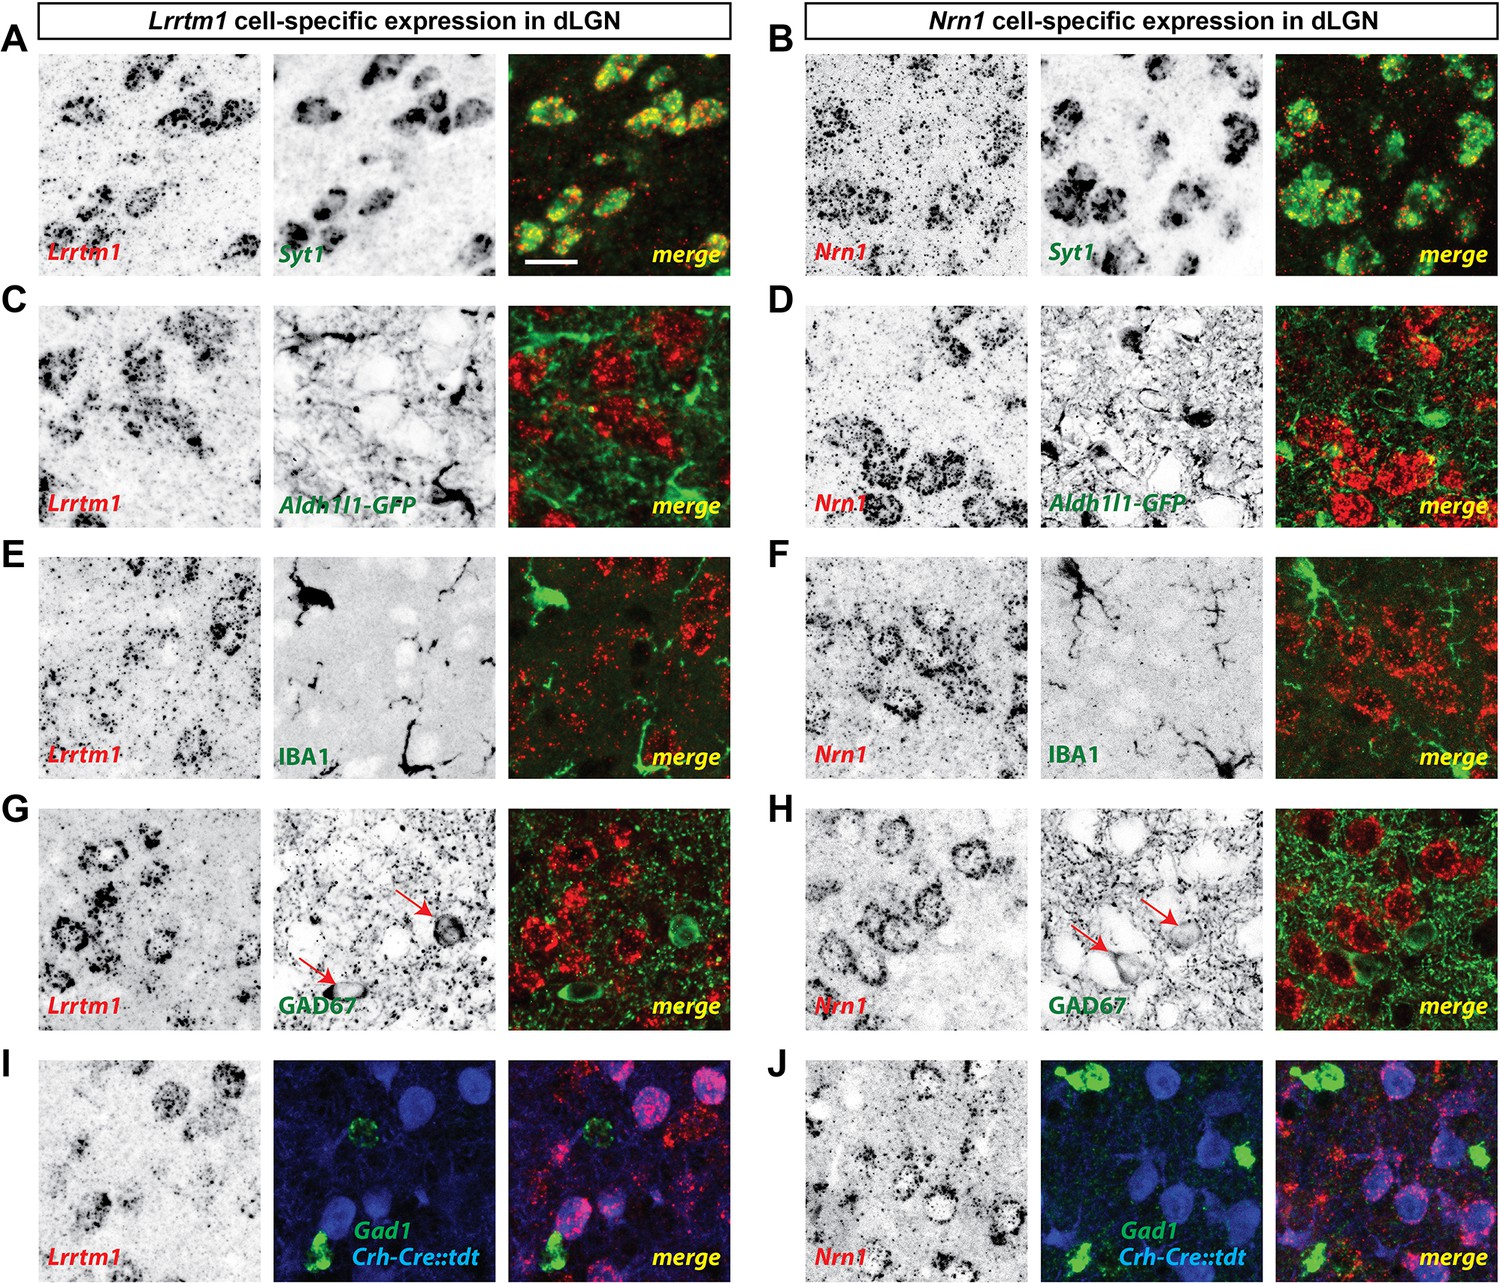
dLGN relay cells generate Lrrtm1 and Nrn1.
(A and B) Double in situ hybridization (ISH) for Syt1 and either Lrrtm1 (A) or Nrn1 (B) in P14 wild type dLGN. (C and D) ISH for either Lrrtm1 (C) or Nrn1 (D) in dLGN of P14 Aldh1l1-GFP mice revealed no astrocytic expression of these mRNAs. (E and F) ISH for Lrrtm1 (E) or Nrn1 (F) and immunostaining (IHC) for the microglia marker IBA1 in P14 wild type dLGN. (G and H) ISH for Lrrtm1 (G) or Nrn1 (H) and IHC for GAD67 in P14 (Lrrtm1) and P25 (Nrn1) wild type mice revealed no mRNA expression by inhibitory interneurons. Red arrows depict GAD67+ interneurons. (I and J) Double ISH for either Lrrtm1 (I) or Nrn1 (J) and Gad1 in P25 Crh-Cre::tdt dLGN revealed mRNA expression by relay cells. Scale bar, 20 µm (A–J).
Figure 5 with 2 supplements

Loss of Lrrtm1 results in smaller vglut2-positive puncta in dLGN but not vLGN.
(A and D) Immunostaining of VGluT2+ retinal terminals in dLGN (A) and vLGN (D) of littermate control and Lrrtm1−/− mice at P3, P8, P14 and P25 and adult mice (P60-85). Red boxes in P25 panels are shown in higher magnification on the right. (B and E) Cumulative (cum.) distribution of VGluT2+ puncta size in control and Lrrtm1−/− mice dLGN (B) and vLGN (E). (C and F) Average VGluT2+ puncta size in control and Lrrtm1−/− mice dLGN (C) and vLGN (F). Data represent Mean ±SEM; **p=0.0005, *p<0.05 by ANOVA. Scale bar, 20 µm (A and C), 10 µm (insets).
Figure 5—figure supplement 1
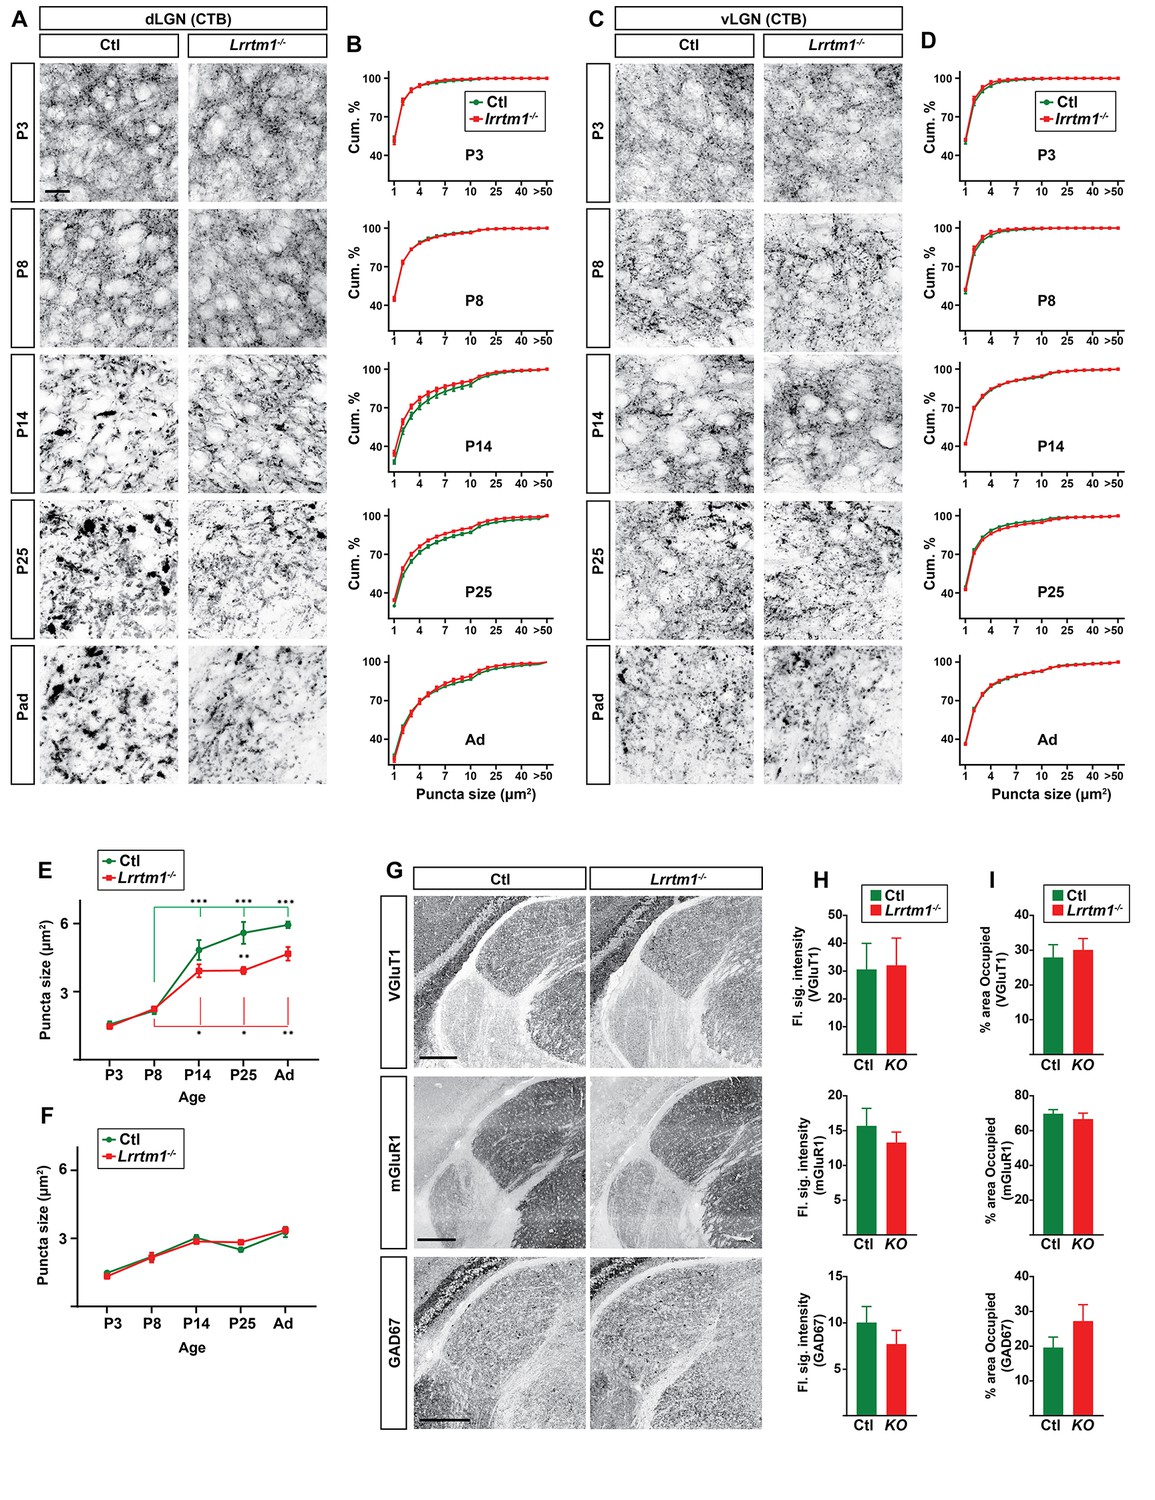
Lack of Lrrtm1 affects retinogeniculate synapses but not other synapses in dLGN.
(A and C) CTB-labeled retinal terminals in dLGN (A) and vLGN (C) of littermate controls and Lrrtm1−/− mutants at P3, P8, P14, P25 and adults. (B and D) Cumulative (cum.) distribution of the size of CTB-labeled retinal terminals in control (green) and Lrrtm1−/− mutant (red) dLGN (B) and vLGN (D) throughout development. (E and F) The average size of CTB-labeled puncta in in control (green) and Lrrtm1−/− mutant (red) dLGN (E) and vLGN (F). Data represent Mean ±SEM; ***p<0.0001, **p<0.01, *p<0.05 by ANOVA. (G) GAD67, mGluR1 and VGluT1 immunostaining in P25 control and Lrrtm1−/−. (H and I) Quantification of the flourescence signal intensity (H) and fraction of the total dLGN area occupied by the signal (I) for GAD67, mGluR1 and VGluT1 immunostainings. All data are shown as Mean ±SEM. No significant changes have been observed for these non-retinal synaptic markers in Lrrtm1−/− mice. Scale bars, 20 µm (A), 250 µm (G).
Figure 5—figure supplement 2
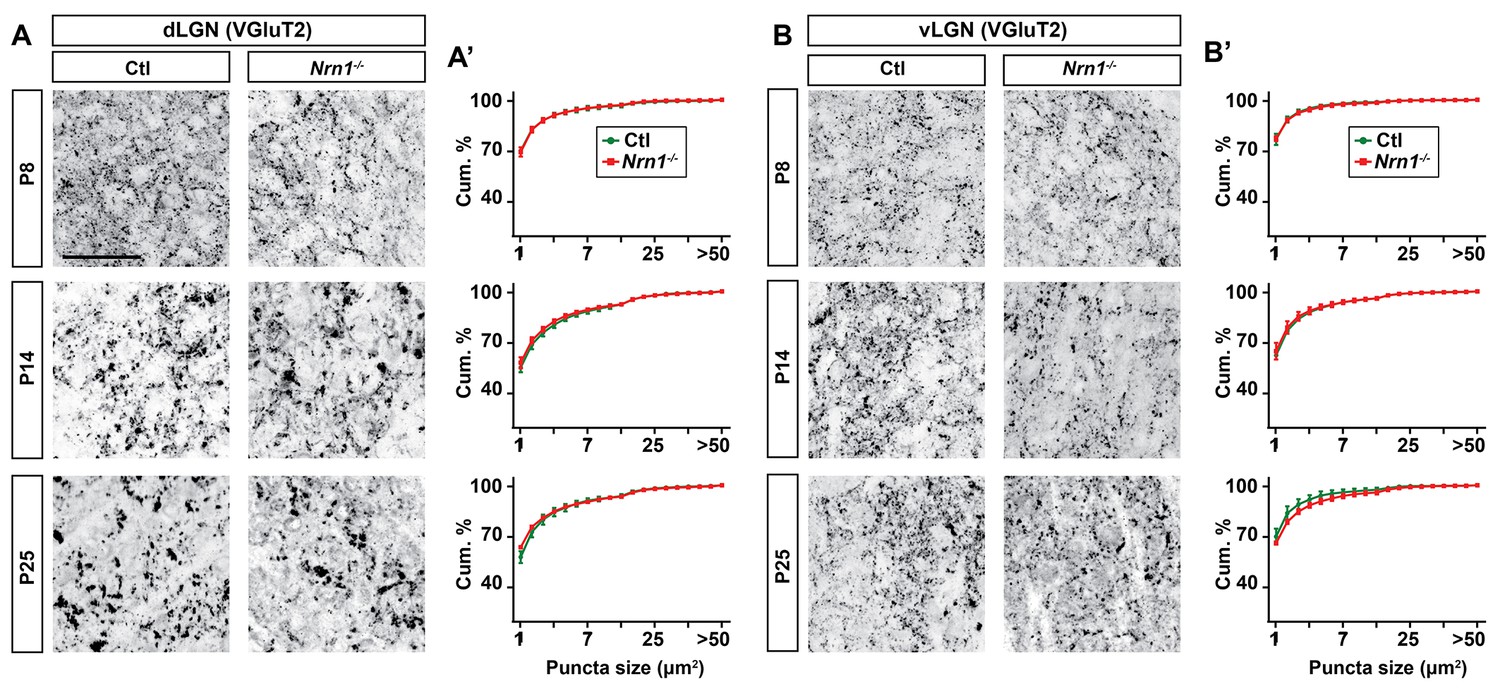
Lack of Nrn1 did not alter retinal nerve terminal development in dLGN.
(A and B) VGluT2-immunostained retinal nerve terminals in dLGN (A) and vLGN (B) of littermate control and Nrn1−/− mice at P8, P14 and P25. Cumulative (Cum.) distribution of VGluT2+ puncta size is depicted in A’ (for dLGN) and B’ (for vLGN). No significant difference in the size of retinal terminals was observed in dLGN of mice lacking Nrn1. All data are shown as Mean ±SEM. Scale bars, 50 µm (A).
Figure 6 with 1 supplement
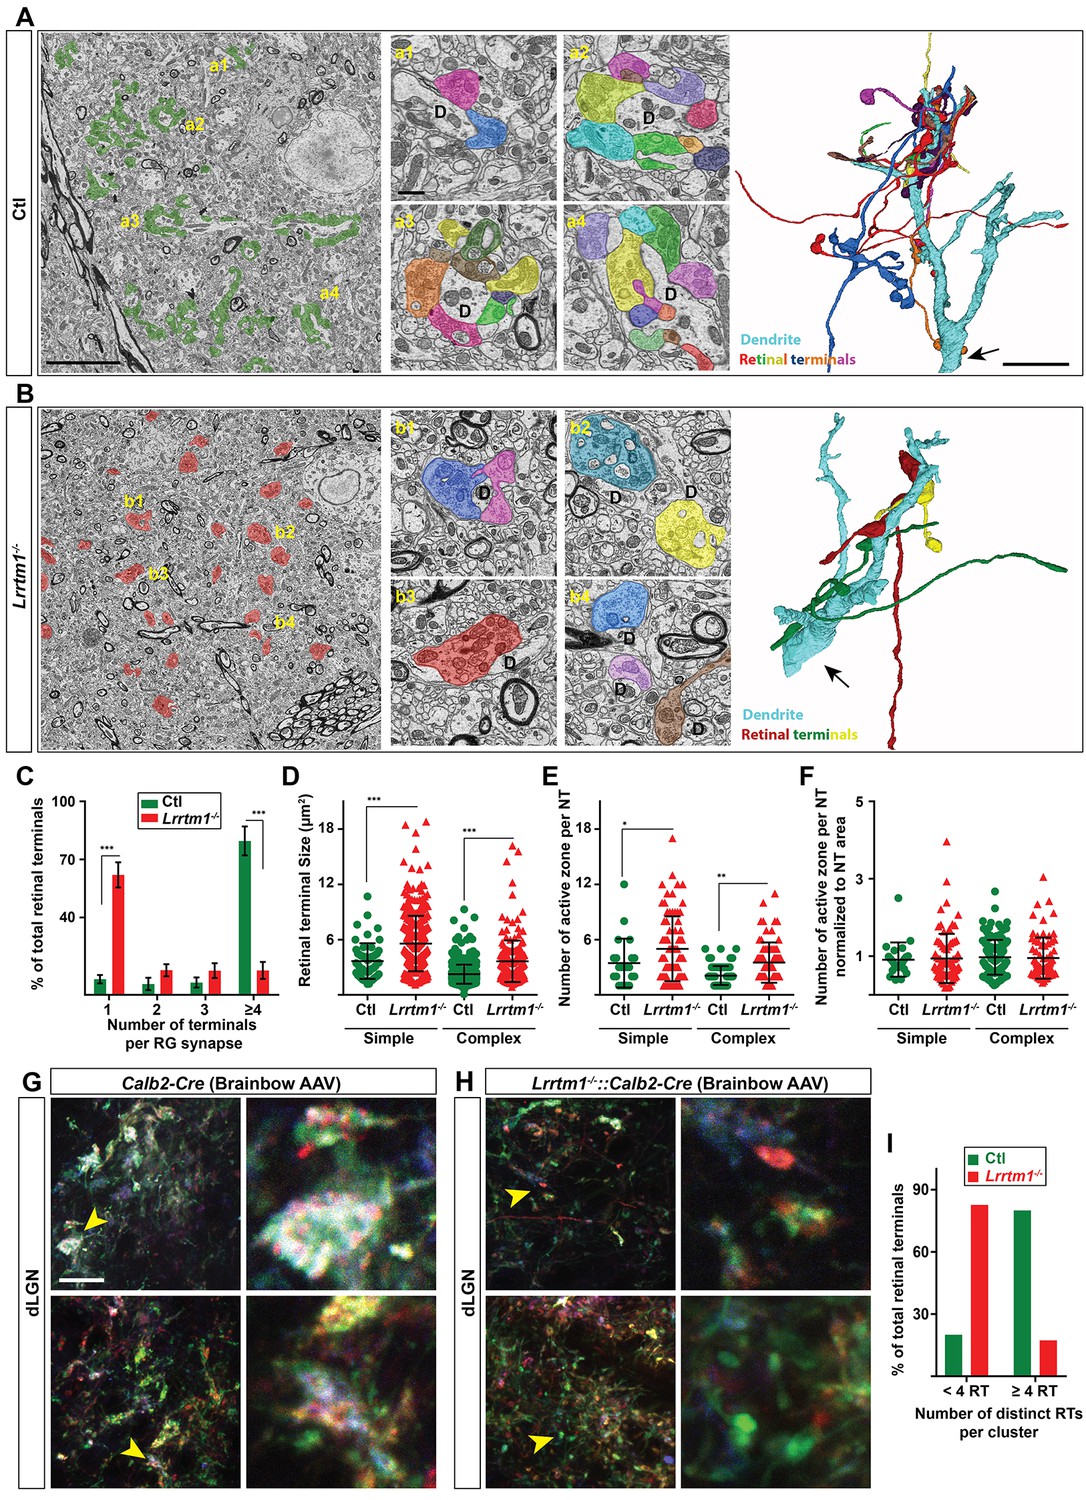
Loss of complex RG synapses in Lrrtm1−/− mice.
(A and B) SBFSEM images of retinal terminals in P42 control (A, labeled in green) and Lrrtm1−/− (B, labeled in red) dLGN. RG synapses are depicted in insets a1-a4 (Ctl) and b1-b4 (Lrrtm1−/−). In insets, each retinal terminal is depicted in a unique color. Similar colors in different insets do not represent axonal branches of the same RGC. 3D reconstruction of retinal terminals and relay cell dendrite are depicted on the right. The black arrows denote the position of dendrites stemming from relay cells somas. (C) Percentage of retinal terminals contributing to forming RG synapses with 1, 2, 3 or ≥4 distinct retinal terminals in P42 Lrrtm1−/− and control dLGN. Data represent Mean ±SEM; ***p<0.0001, by ANOVA. (D–F) Quantification of terminal size (D), actual number of active zones per terminal (E) and the active zones: terminal area ratio for simple and complex RG synapses in dLGN of Lrrtm1−/− and control mice (NT = nerve terminal). Data represent Mean ±SEM; ***p<0.0001, by ANOVA. (G and H) Retinal terminals were multicolor-labeled by injecting 1–2 µl brainbow AAVs into the vitreous humor of Lrrtm1−/−::Calb2-Cre and control mice. (I) Color analysis of clustered retinal terminals in wild type and Lrrtm1−/− mutants revealed a lower level of complex RG synapses in mutants. Scale bar, 10 µm (A and the 3D image), 20 µm (G), 1 µm (insets).
Figure 6—figure supplement 1
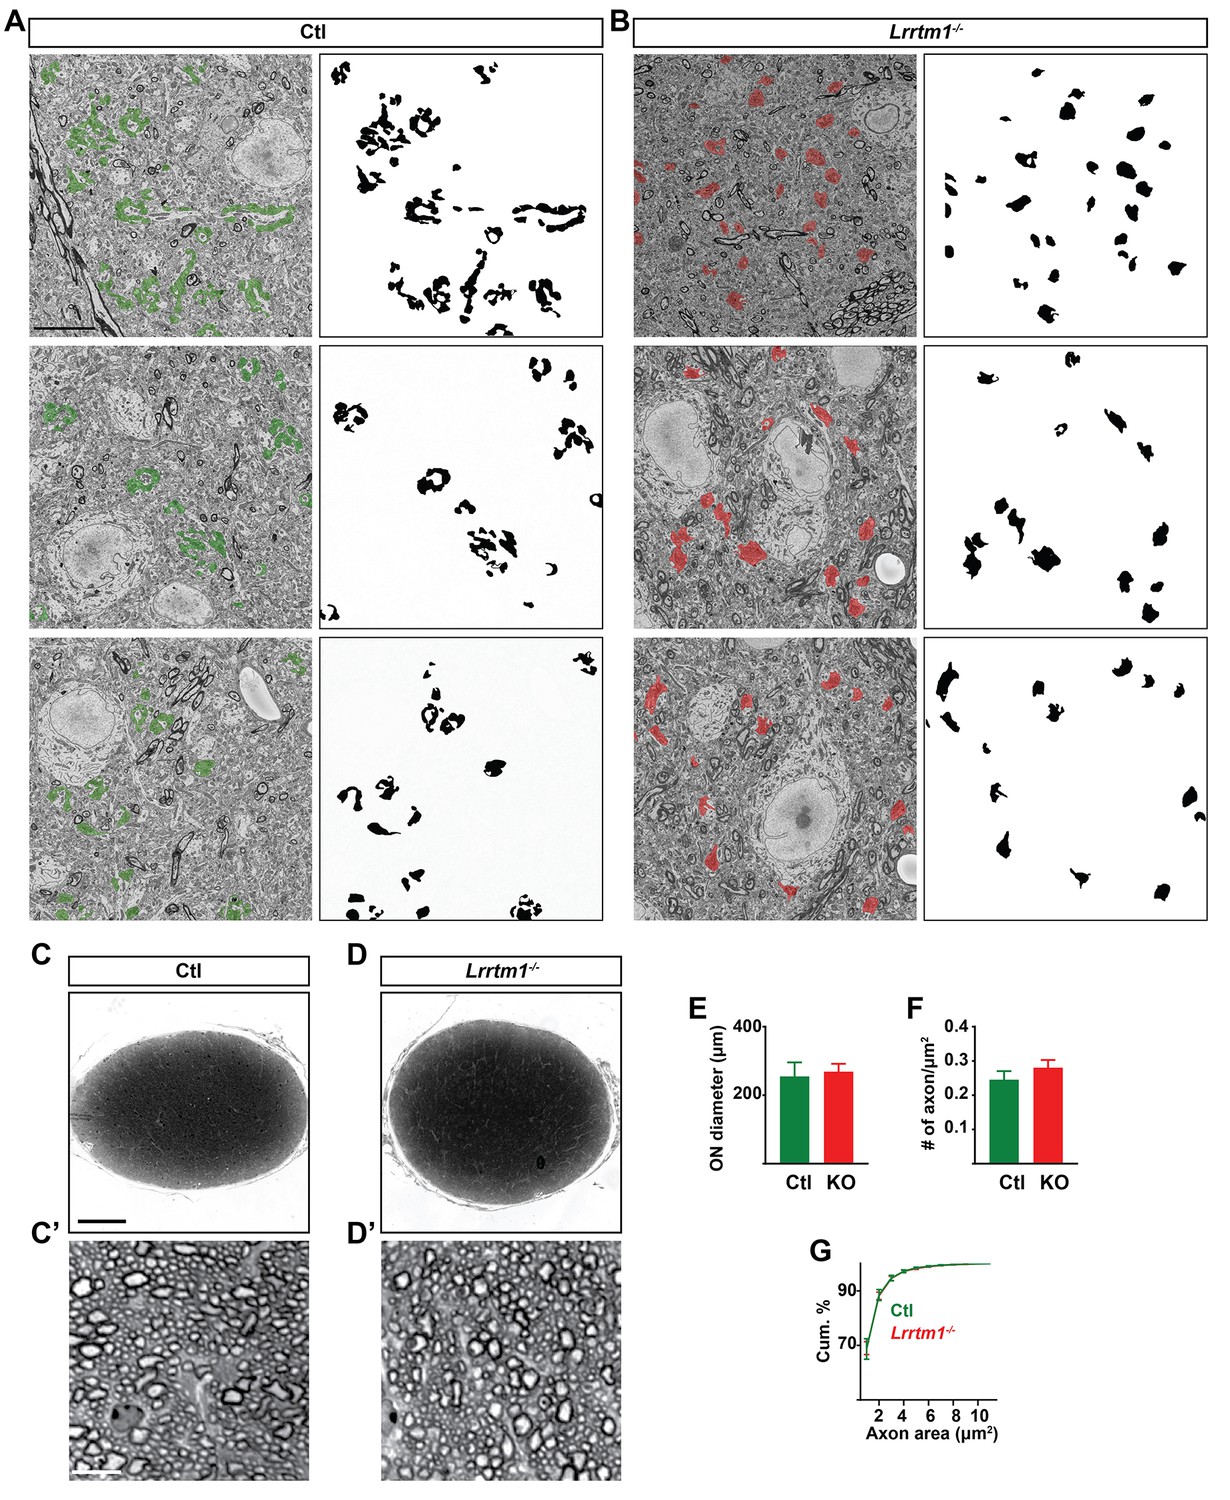
Loss of LRRTM1 resulted in a significant decrease in the number of complex RG synapses.
(A and B) Examples of dLGN SBFSEM micrographs in control (A) and Lrrtm1−/− dLGN (B). In order to simulate what these micrographs might look like with CTB or VGluT2 immunostaining all retinal terminals in the micrographs were pseudocolored in a single color (green for controls and red for mutants). Masks of these nerve terminals are depicted in black on the right. While individual retinal terminals are larger in Lrrtm1−/− mutants, the aggregates of clustered terminals give the impression of larger puncta in control dLGN. In the left micrographs, retinal terminals are labeled in green (A, control) and red (B, Lrrtm1−/−). (C and D) Cross sections of P25 control (C) and Lrrtm1−/− (D) optic nerves (ON) stained with toluidine blue. High magnification images of the stained ON are depicted in C’ (control) and D’ (Lrrtm1−/−). (E) Diameters of control (green) and Lrrtm1−/− (red) ON revealed no significant difference between mutant and control mice (KO indicates Lrrtm1−/−). (F) Quantification of RGC axon number in control (green) and Lrrtm1−/− (red) ON. (G) Cumulative distribution of individual RGC axon size in control (green) and Lrrtm1−/− (red) ON. All data are shown as Mean ±SEM. Scale bars, 10 µm (A), 100 µm (C), 10 µm (C’).
Figure 7 with 2 supplements
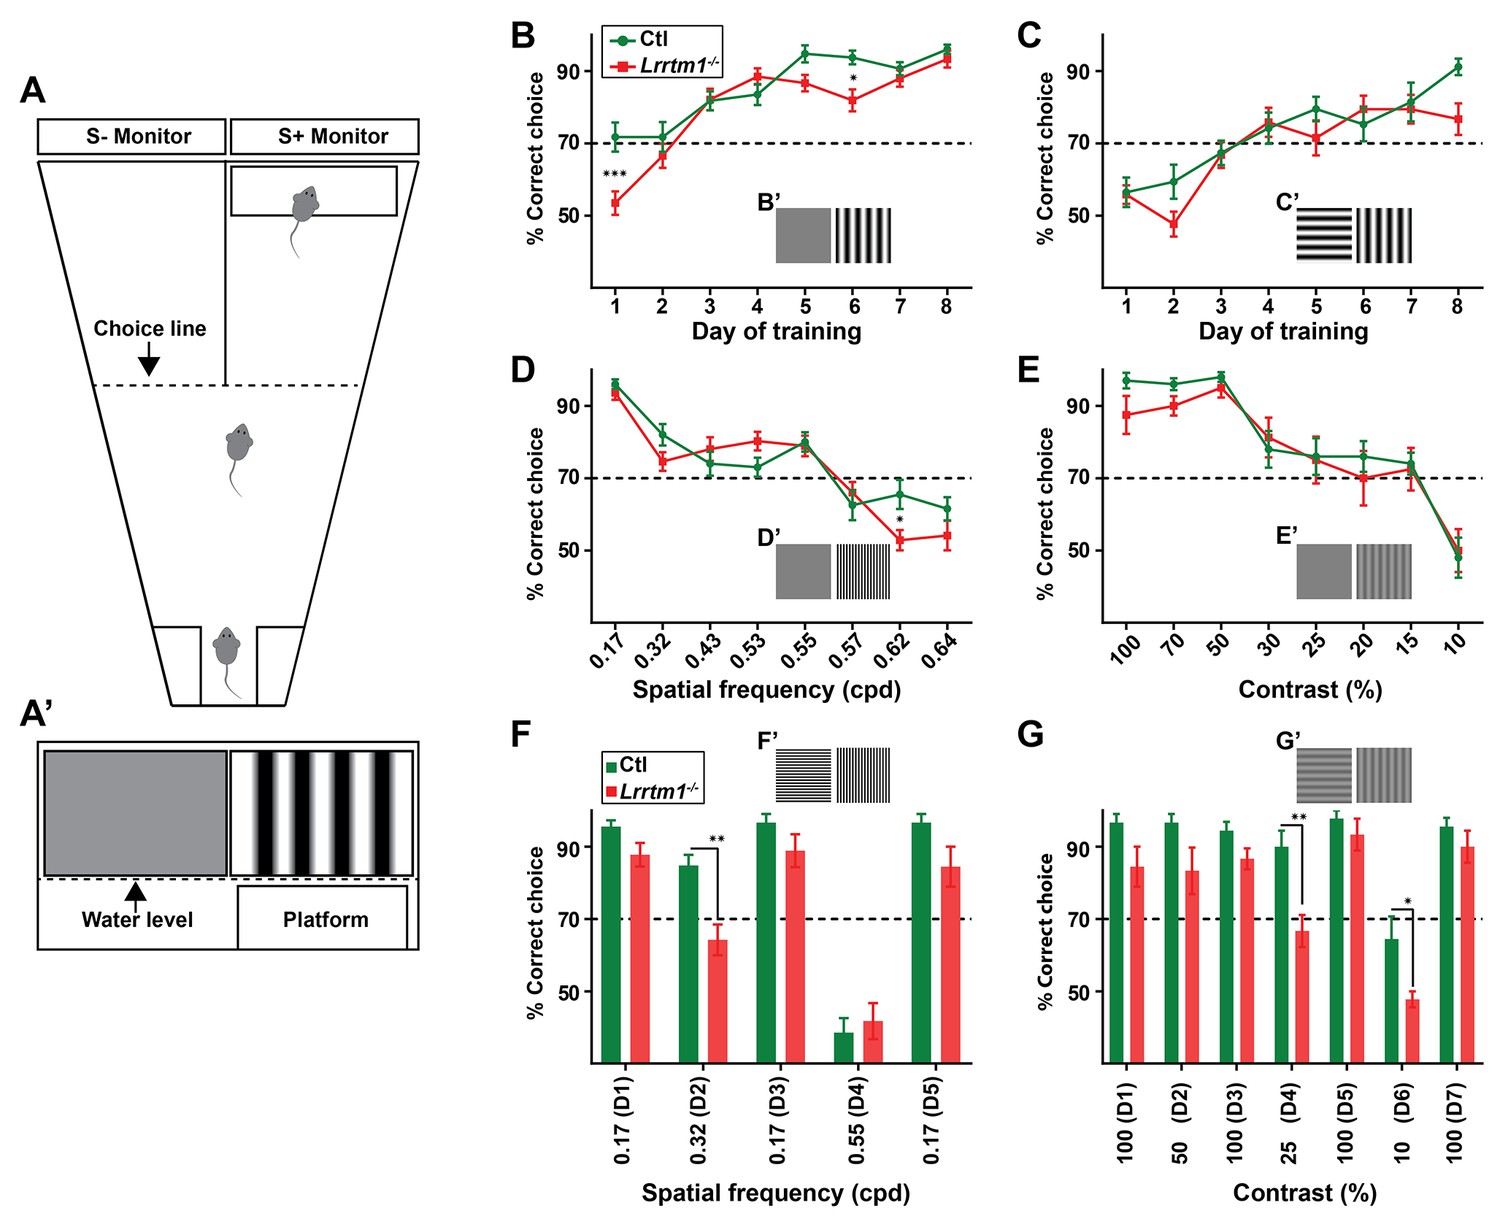
Complex RG synapses are required for visual behaviors.
(A) Schematic diagrams depicting the two-alternative forced swim behavior task. A’ depicts a mouse’s view of the visual displays (e.g. vertical gratings). (B and C) Training Lrrtm1−/− (red) and control (green) mice to detect a vertical grating display versus a gray screen (B, n = 20 for Ctl; and 21 for Lrrtm1−/−) or horizontal grating display (C, n = 19 for Ctl; and 18 for Lrrtm1−/−). Examples of visual displays are depicted in B’ and C’. (D and E) Percentage of correct choices made by Lrrtm1−/− (red) and control (green) mice for detection of vertical gratings with increasing spatial frequency (D; cpd, cycle per degree, n = 20 for Ctl; and 21 for Lrrtm1−/−) or decreasing contrast versus a gray screen (E, n = 10 for Ctl; and nine for Lrrtm1−/−). Examples of visual displays are depicted in D’ and E’. (F and G) Correct choices made by Lrrtm1−/− (red) and control (green) mice for discriminating vertical grating from horizontal grating either with increasing spatial frequency (F, n = 10 for Ctl; and 10 for Lrrtm1−/−) or with decreasing contrast (G, n = 10 for Ctl; and nine for Lrrtm1−/−). D1-D7 are the consecutive days of the test phase. Examples of visual displays are depicted in F’ and G’. For B-G, dashed line represents the 70% correct threshold for successful completion of task. All data are shown as Mean ±SEM; ***p<0.0001, **p<0.01, *p<0.05 by ANOVA.
Figure 7—figure supplement 1
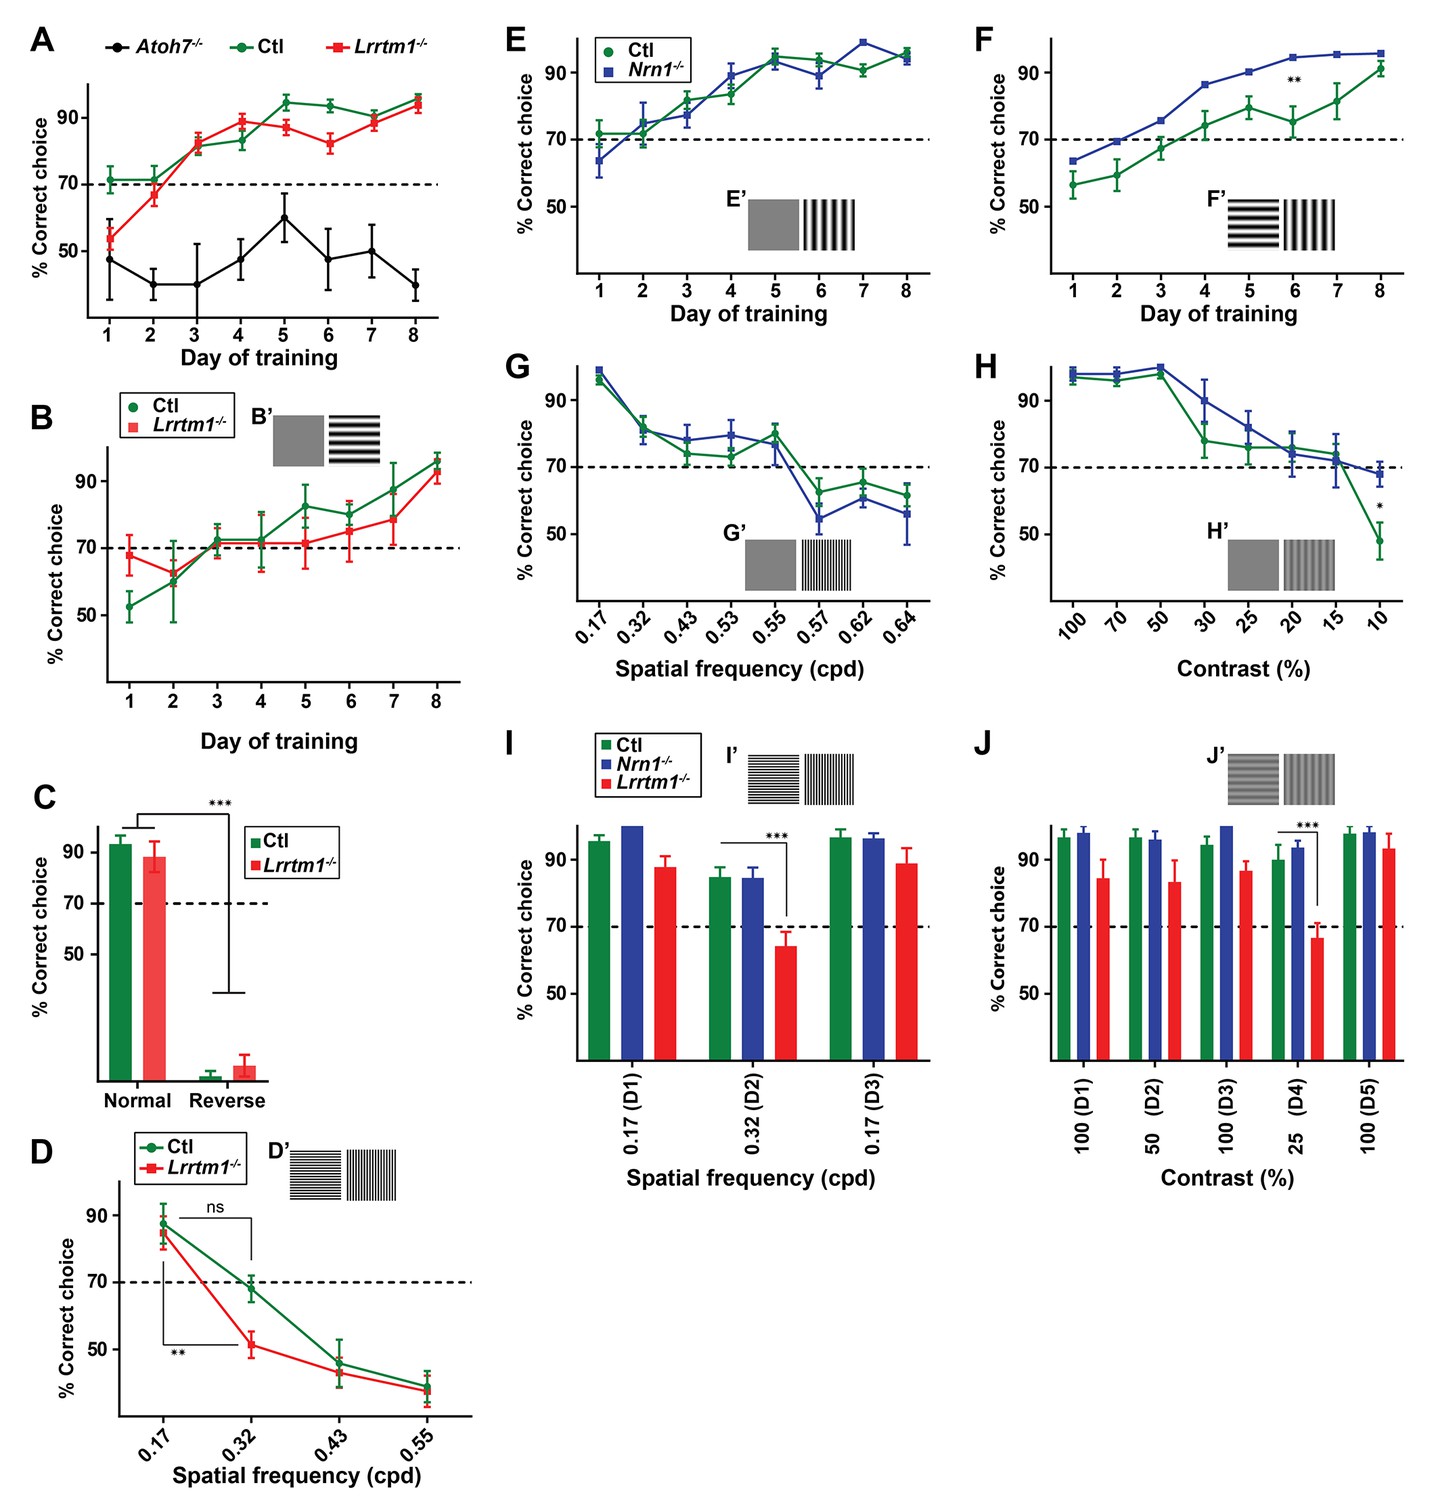
Visual behaviors in Lrrtm1−/−, Nrn1−/− and Atoh7−/− mice.
(A) Training of control, Lrrtm1−/−, and Atoh7−/− mice in a two alternative forced swim task. See Figure 7 for detail. Atoh7−/− mice which are genetically blind failed to learn the visual detection task, confirming the necessity of vision for this assay. The dashed line indicates the 70% threshold for successful performance in these tasks. (B) Comparison of correct choices made by Lrrtm1−/− (red) and control (green) mice for detecting horizontal gratings versus a gray screen during 8 days of trainings. (C) The percentage of correct choices made by control (green) or Lrrtm1−/− mice (red) after 8 days of trainings in a ‘normal’ discrimination test when hidden platform was positioned on the S + side (vertical gratings) and in a ‘reverse’ test when hidden platform was placed on the S- (horizontal gratings). Results confirmed that accurate performance in this assay was dependent on association of the visual cues rather than detecting the hidden platform itself. All data are shown as Mean ±SEM; ***p<0.0001 by ANOVA. (D) Correct choices made by Lrrtm1−/− (red) and control (green) mice for discriminating vertical grating from horizontal grating with increasing spatial frequency (n = 6 for Ctl; and six for Lrrtm1−/−). Each frequency was tested randomly once per day for 10 days. See Figure 7A for comparison. All data are shown as Mean ±SEM; **p<0.01 by ANOVA. (E and F) Training of Nrn1−/− (red) and control (green) mice to detect vertical gratings versus either a gray screen (E) or horizontal gratings (F) in the two alternative forced swim task. Nrn1−/− Mutants showed a slight improved learning performance compared to wild types. Examples of visual displays are depicted in E’ and F’. All data are shown as Mean ±SEM; **p<0.01 by ANOVA. (G and H) Percentage of correct choices made by Nrn1−/− (red) and control (green) mice for detection of vertical gratings with increasing spatial frequency (G; cpd, cycle per degree) or decreasing contrast (H). Examples of visual displays are depicted in G’ and H’. All data are shown as Mean ±SEM; *p<0.05 by ANOVA. (I and J) Comparison of correct choices made by Lrrtm1−/− (red) Nrn1−/− (blue) and control (green) mice for discriminating vertical gratings from horizontal gratings either with increasing spatial frequency (I) or with decreasing contrast (J). Examples of visual displays are depicted in I’ and J’. D1-D5 indicates the consecutive days of the test phase. All data are shown as Mean ±SEM; ***p<0.0001 by ANOVA.
Figure 7—figure supplement 2
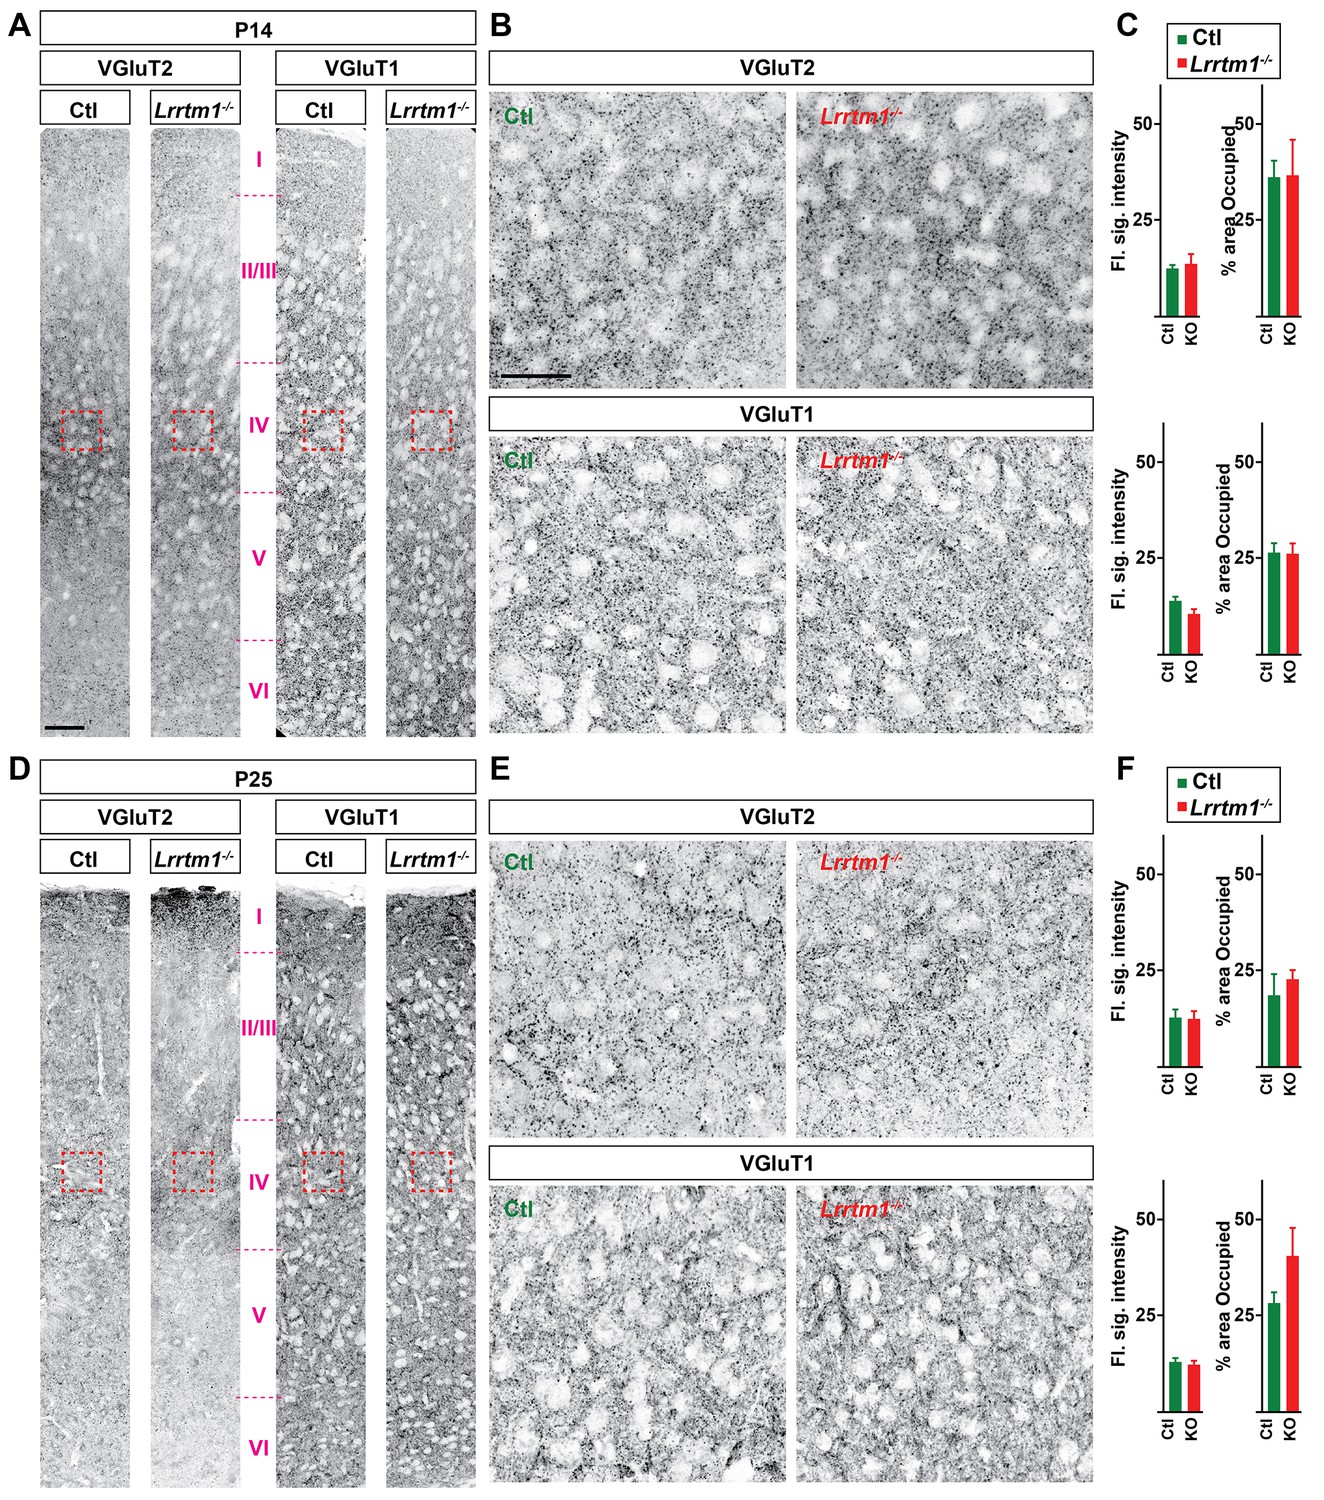
Loss of Lrrtm1−/− did not alter the distribution of VGluT1+ and VGluT2+ terminals in visual cortex.
(A and D) VGluT1+ and VGluT2+ nerve terminals in P14 (A) and P25 (D) control and Lrrtm1−/− primary visual cortex. Red boxes indicates the approximate location of the images in B and E. (B and E) High magnification images of VGluT1+ and VGluT2+ nerve terminals in P14 (B) and P25 (E) control and Lrrtm1−/− layer IV primary visual cortex. (C and F) Quantification of flourescence signal intensity and fraction of the total dLGN area occupied by VGluT1- and VGluT2-immunostaining (KO = Lrrtm1−/− mutant). Data are shown as Mean ±SEM. Scale bars, 50 µm (A), 20 µm (B).
Tables
Key resources table
| Reagent type (species) or resource | Designation | Source or reference | Identifiers |
|---|---|---|---|
| Virus, AAV9 | AAV9.hEF1a.lox.TagBFP.lox.eYFP.lox. WPRE.hGH-InvBYF | Penn Vector Core | AV-9-PV2453 |
| Virus, AAV9 | AAV9.hEF1a.lox.mCherry.lox.mTFP1. lox.WPRE.hGH-InvCheTF | Penn Vector Core | AV-9-PV2454 |
| Mouse (C57/Bl) | Lrrtm1−/− (Lrrtm1tm1Lex) | MMRRC | RRID:MMRRC_031619-UCD |
| Mouse (C57/Bl) | Atoh7tm1Gla (Atoh7−/−) | MMRRC | RRID:MMRRC_042298-UCD |
| Mouse (C57/Bl) | Aldh1l1-EGFP | MMRRC | RRID:MMRRC_011015-UCD |
| Mouse (C57/Bl) | Nrn1−/− (Nrn1tm1.2Ndiv) | The Jackson Laboratory | RRID:IMSR_JAX:018402 |
| Mouse (C57/Bl) | Rosa-stop-tdT | The Jackson Laboratory | RRID:IMSR_JAX:007905 |
| Mouse (C57/Bl) | Crh-Cre | MMRRC | RRID:MMRRC_030850-UCD |
| Mouse (C57/Bl) | Calb2-Cre | The Jackson Laboratory | 10774 |
| antibody | mouse anti-GAD67 | EMD Millipore | MAB5406, RRID:AB_2278725 |
| antibody | mouse anti-actin | EMD Millipore | MAB1501, RRID:AB_2223041 |
| antibody | rabbit anti-IBA1 | Wako | 019–19741, RRID:AB_839504 |
| antibody | rabbit anti-mGluR1a | Frontier Institute co.,ltd | RRID:AB_2571799 |
| antibody | rabbit anti-VGluT1 | Synaptic Systems | 135402, RRID:AB_2187539 |
| antibody | rabbit anti-VGluT2 | Synaptic Systems | 135511 |
| antibody | sheep anti-LRRTM1 | Synaptic Systems | AF4897, RRID:AB_10643427 |
| antibody | sheep (POD)-conjugated anti-DIG | Roche | 11426346910 |
| antibody | sheep (POD)-conjugated anti-FL | Roche | 11207733910 |
| commercial assay or kit | PrepX PolyA mRNA Isolation Kit | Wafergen | 400047 |
| commercial assay or kit | PrepX RNA-Seq for Illumina Library Kit, 48 samples | Wafergen | 400046 |
| commercial assay or kit | Quant-iT dsDNA HS Kit | Invitrogen | Q33120 |
| commercial assay or kit | Superscript II Reverse Transcriptase First Strand cDNA Synthesis kit | Invitrogen | 18064014 |
| commercial assay or kit | Aurum Total RNA Fatty and Fibrous Tissue kit | BioRad | 7326870 |
| commercial assay or kit | pGEM-T Easy Vector Systems | Promega | A1360 |
| commercial assay or kit | Ambion MAXIscript T7 In Vitro Transcription Kit | Thermo Fisher Scientific | AM1312 |
| commercial assay or kit | |||
| commercial assay or kit | iTaq SYBRGreen Supermix | BioRad | 1725124 |
| commercial assay or kit | Tyramide Signal Amplification (TSA) systems | PerkinElmer | NEL75300 1KT |
| commercial assay or kit | Amersham ECL Prime Western Blotting Detection Reagent | GE Healthcare Life Sciences | RPN2236 |
| commercial assay or kit | TruSeq PE Cluster Kit v3-cBOT-HS | illumina | PE-401–3001 |
| commercial assay or kit | TruSeq SBS Kit v3-HS (200-cycles) | illumina | FC-401–3001 |
| chemical compound, drug | Alexa-conjugated cholera toxin beta subunit | Thermo Fisher Scientific | C22841 |
| chemical compound, drug | Fluorescein RNA Labeling Mix | Roche | 11685619910 |
| chemical compound, drug | DIG RNA Labeling Mix | Roche | 11277073910 |
| chemical compound, drug | Proteinase K | Thermo Fisher Scientific | EO0491 |
| chemical compound, drug | Paraformaldehyde, EM grade | EMS | 19202 |
| chemical compound, drug | Sodium cadodylate | EMS | 12300 |
| chemical compound, drug | Tissue Freezing Medium | EMS | 72592 |
| chemical compound, drug | Glutaraldehyde | EMS | 16220 |
| chemical compound, drug | Prehybridization Solution | Sigma | P1415 |
| chemical compound, drug | Heparin Sodium | Fisher Scientific | BP2425 |
| chemical compound, drug | Yeast RNA | Roche | 10109223001 |
| chemical compound, drug | Blocking reagent (ISH) | Roche | 11096176001 |
| software, algorithm | TrakEM2 | ImageJ plugin | RRID:SCR_008954 |
| software, algorithm | Fiji | Fiji | RRID:SCR_002285 |
| software, algorithm | ImageJ | NIH | RRID: SCR_003070 |
| software, algorithm | Prism | GraphPad | RRID: SCR_002798 |
| software, algorithm | Gabor-patch generator | https://www.cogsci.nl/ | N/A |
| sequence-based reagent | Cloning primers for Gad1: F:TGTGCCCAAACTGGTCCT; R:TGGCCGATGATTCTGGTT | Integrated DNA Technologies | N/A |
| sequence-based reagent | qPCR primer for Nrn1: F:TTCCCCCGCGTTCTCTAAAC; R:GCCTGCACCAGGTAAGCTAT | Integrated DNA Technologies | N/A |
| sequence-based reagent | qPCR primer for Lrrtm1: F:AGCAGCTGAATGGAGGTTGTC; R:AGTGTAGACAGAGGCCGAGTAG | Integrated DNA Technologies | N/A |
| sequence-based reagent | qPCR primer for Gapdh: F:CGTCCCGTAGACAAA ATG GT; R:TTGATG GCAACAATC TCCAC | Integrated DNA Technologies | N/A |
| recombinant DNA reagent | Nrn1 (5367281) | Dharmacon | MMM1013-202769896 |
| recombinant DNA reagent | Lrrtm1 (5321979) | Dharmacon | MMM1013-202769075 |
| recombinant DNA reagent | Syt1 (5363062) | Dharmacon | MMM1013-202709704 |
Download links
A two-part list of links to download the article, or parts of the article, in various formats.
Downloads (link to download the article as PDF)
Open citations (links to open the citations from this article in various online reference manager services)
Cite this article (links to download the citations from this article in formats compatible with various reference manager tools)
LRRTM1 underlies synaptic convergence in visual thalamus
eLife 7:e33498.
https://doi.org/10.7554/eLife.33498


