Temporal transitions of spontaneous brain activity
- The Pennsylvania State University, United States
Figures
Figure 1
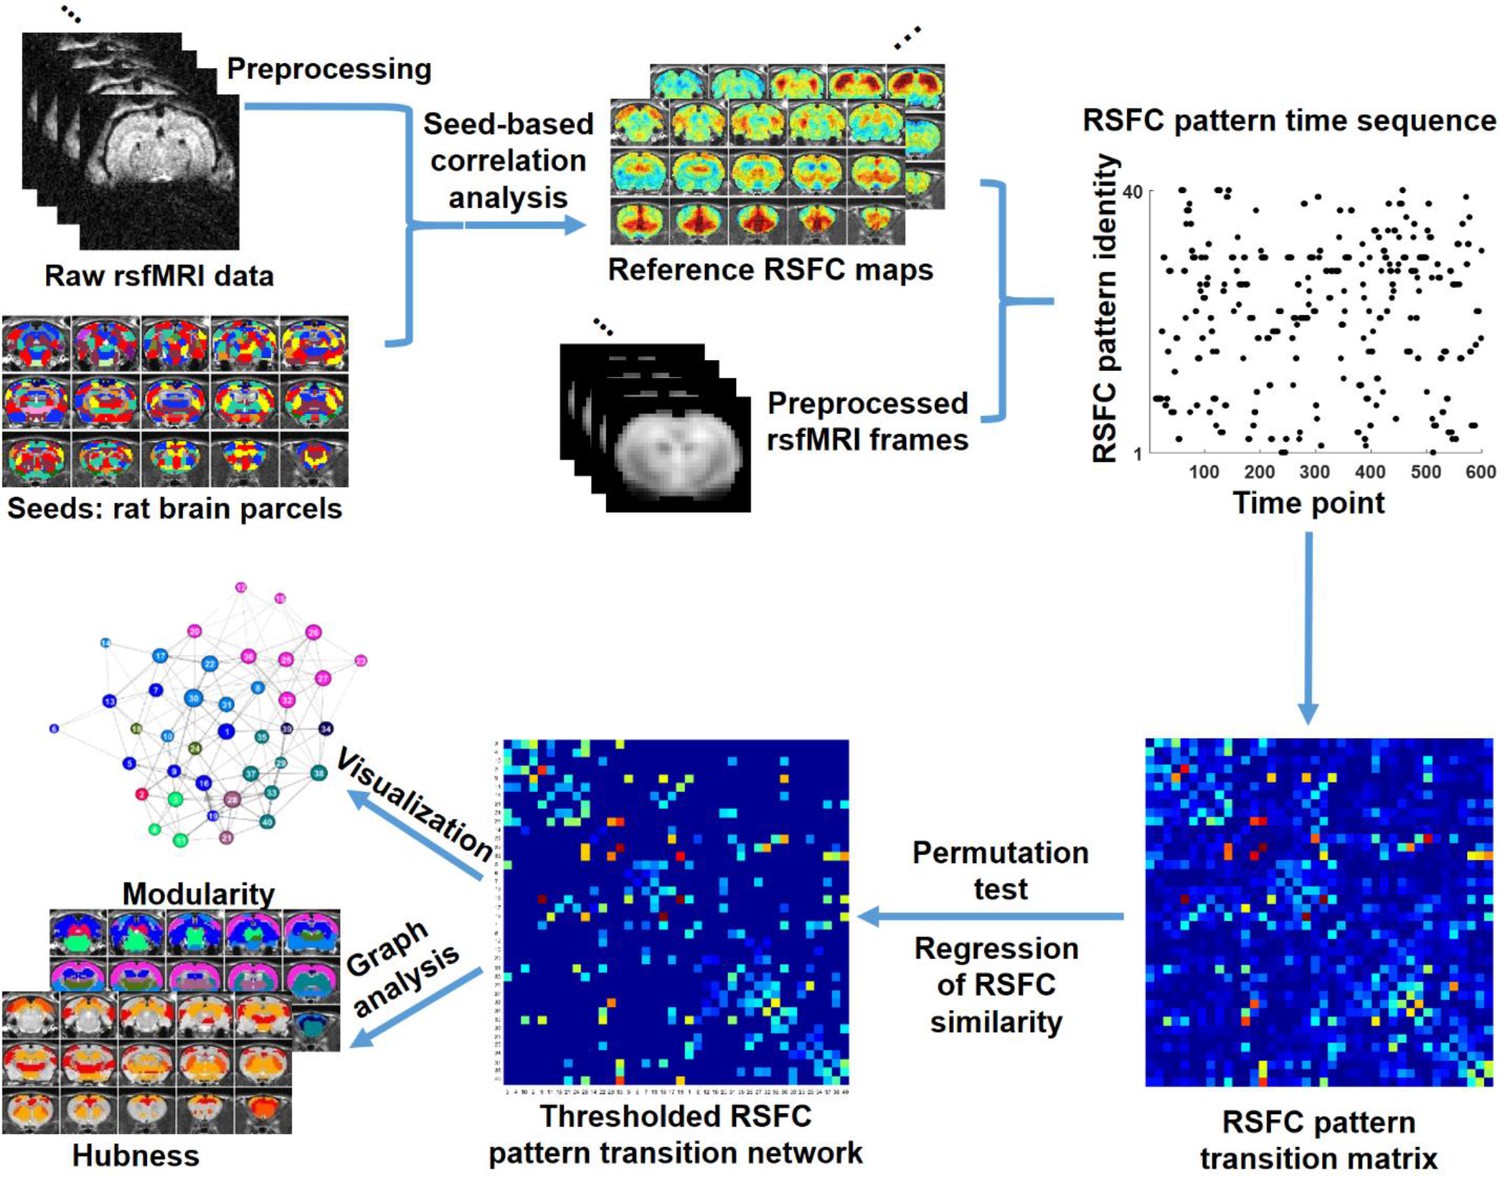
Schematic illustration of the data analysis pipeline.
https://doi.org/10.7554/eLife.33562.002
Figure 2 with 5 supplements

An example of a RSFC spatial pattern.
Left: seed region; Mid: RSFC pattern of the seed. Color bar indicates t values; Right: average of rsfMRI frames matched to the RSFC pattern. Color bar shows BOLD amplitude. Distance to bregma is listed at the bottom of each slice. CC: spatial correlation coefficient between the average of rsfMRI frames (Right) and the corresponding seed map (Mid).
Figure 2—figure supplement 1
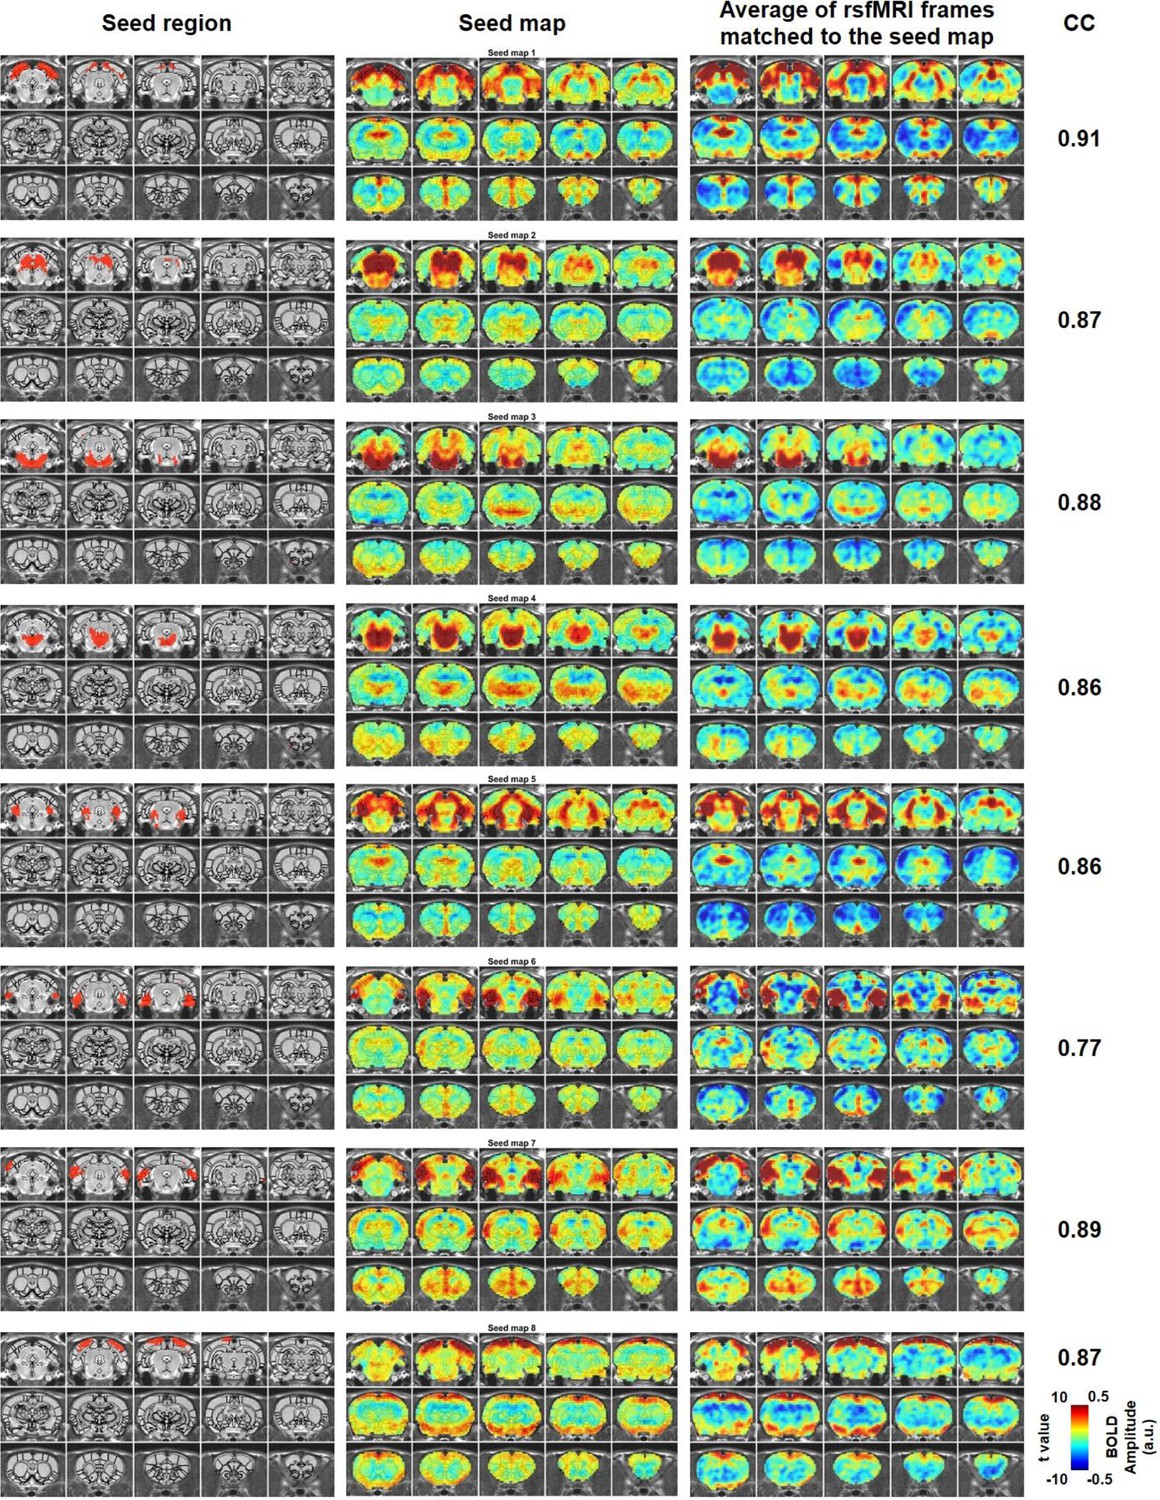
Characteristic RSFC patterns (1-8) in the awake rat brain.
Left: seed region; Mid: RSFC pattern of the seed; Right: average of rsfMRI frames matched to the RSFC pattern. Distance to bregma for each slice is the same as those shown in Figure 2. CC: spatial correlation coefficient between the average of rsfMRI frames and the corresponding seed map.
Figure 2—figure supplement 2
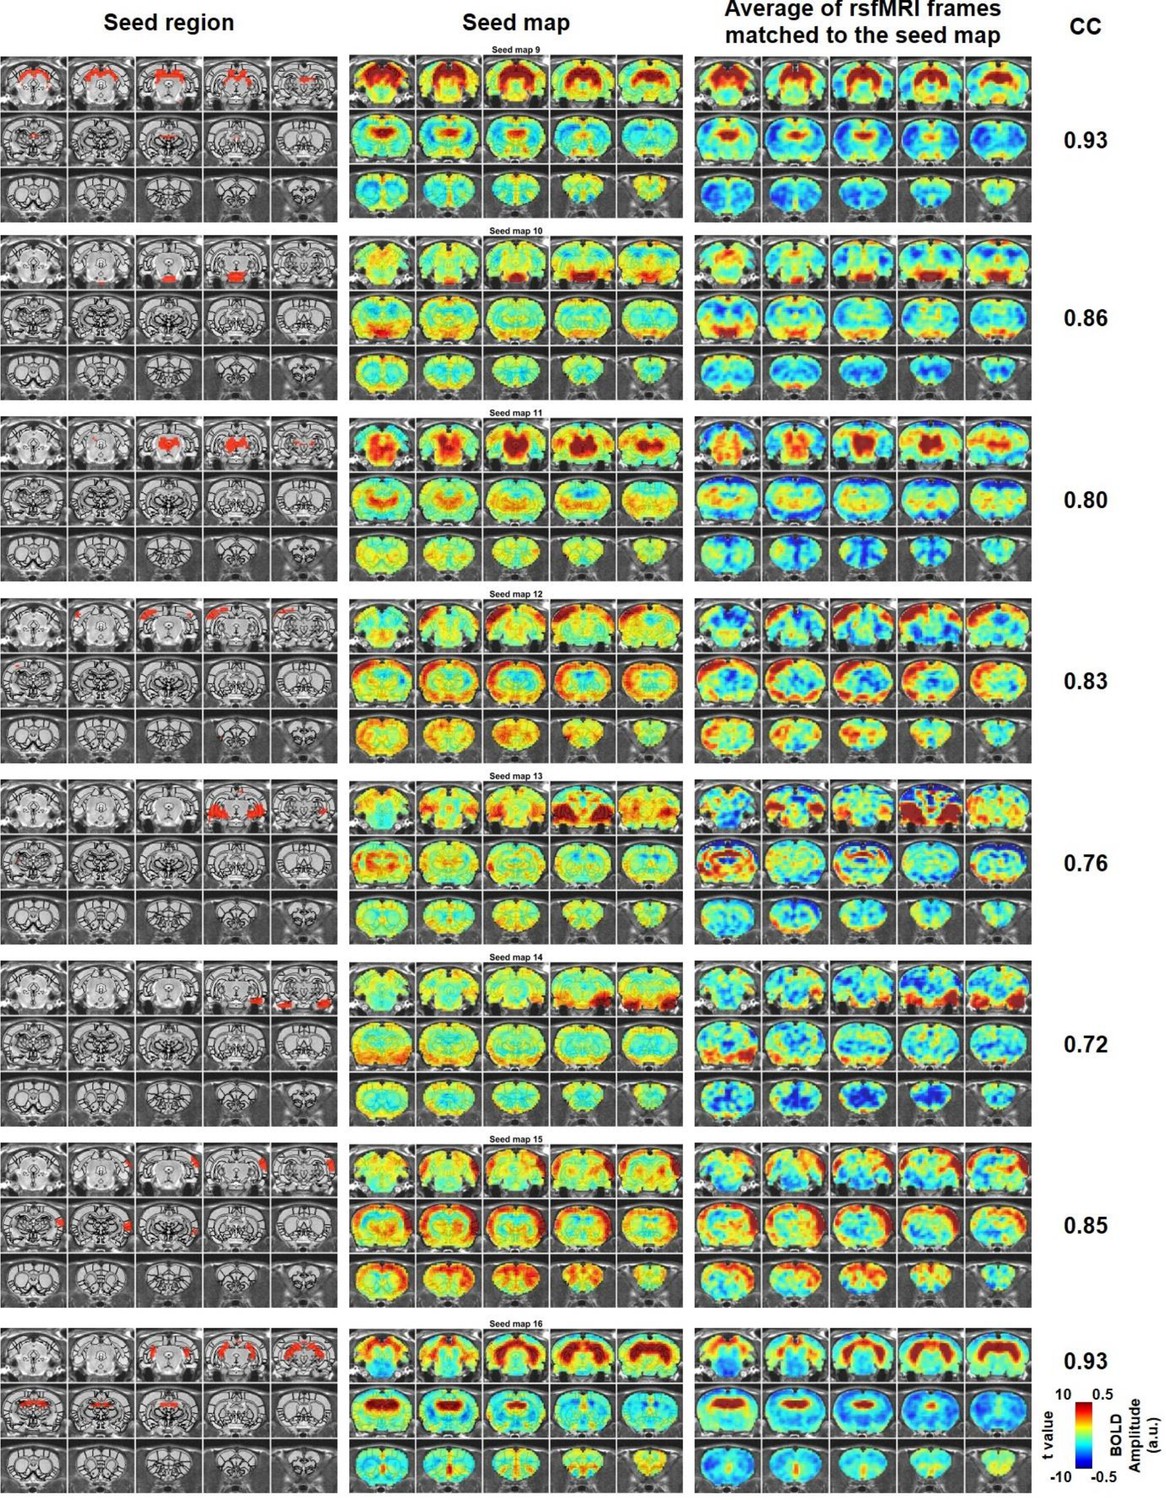
Characteristic RSFC patterns (9-16) in the awake rat brain.
Left: seed region; Mid: RSFC pattern of the seed; Right: average of rsfMRI frames matched to the RSFC pattern. Distance to bregma for each slice is the same as those shown in Figure 2. CC: spatial correlation coefficient between the average of rsfMRI frames and the corresponding seed map.
Figure 2—figure supplement 3

Characteristic RSFC patterns (17-24) in the awake rat brain.
Left: seed region; Mid: RSFC pattern of the seed; Right: average of rsfMRI frames matched to the RSFC pattern. Distance to bregma for each slice is the same as those shown in Figure 2. CC: spatial correlation coefficient between the average of rsfMRI frames and the corresponding seed map.
Figure 2—figure supplement 4

Characteristic RSFC patterns (25-32) in the awake rat brain.
Left: seed region; Mid: RSFC pattern of the seed; Right: average of rsfMRI frames matched to the RSFC pattern. Distance to bregma for each slice is the same as those shown in Figure 2. CC: spatial correlation coefficient between the average of rsfMRI frames and the corresponding seed map.
Figure 2—figure supplement 5
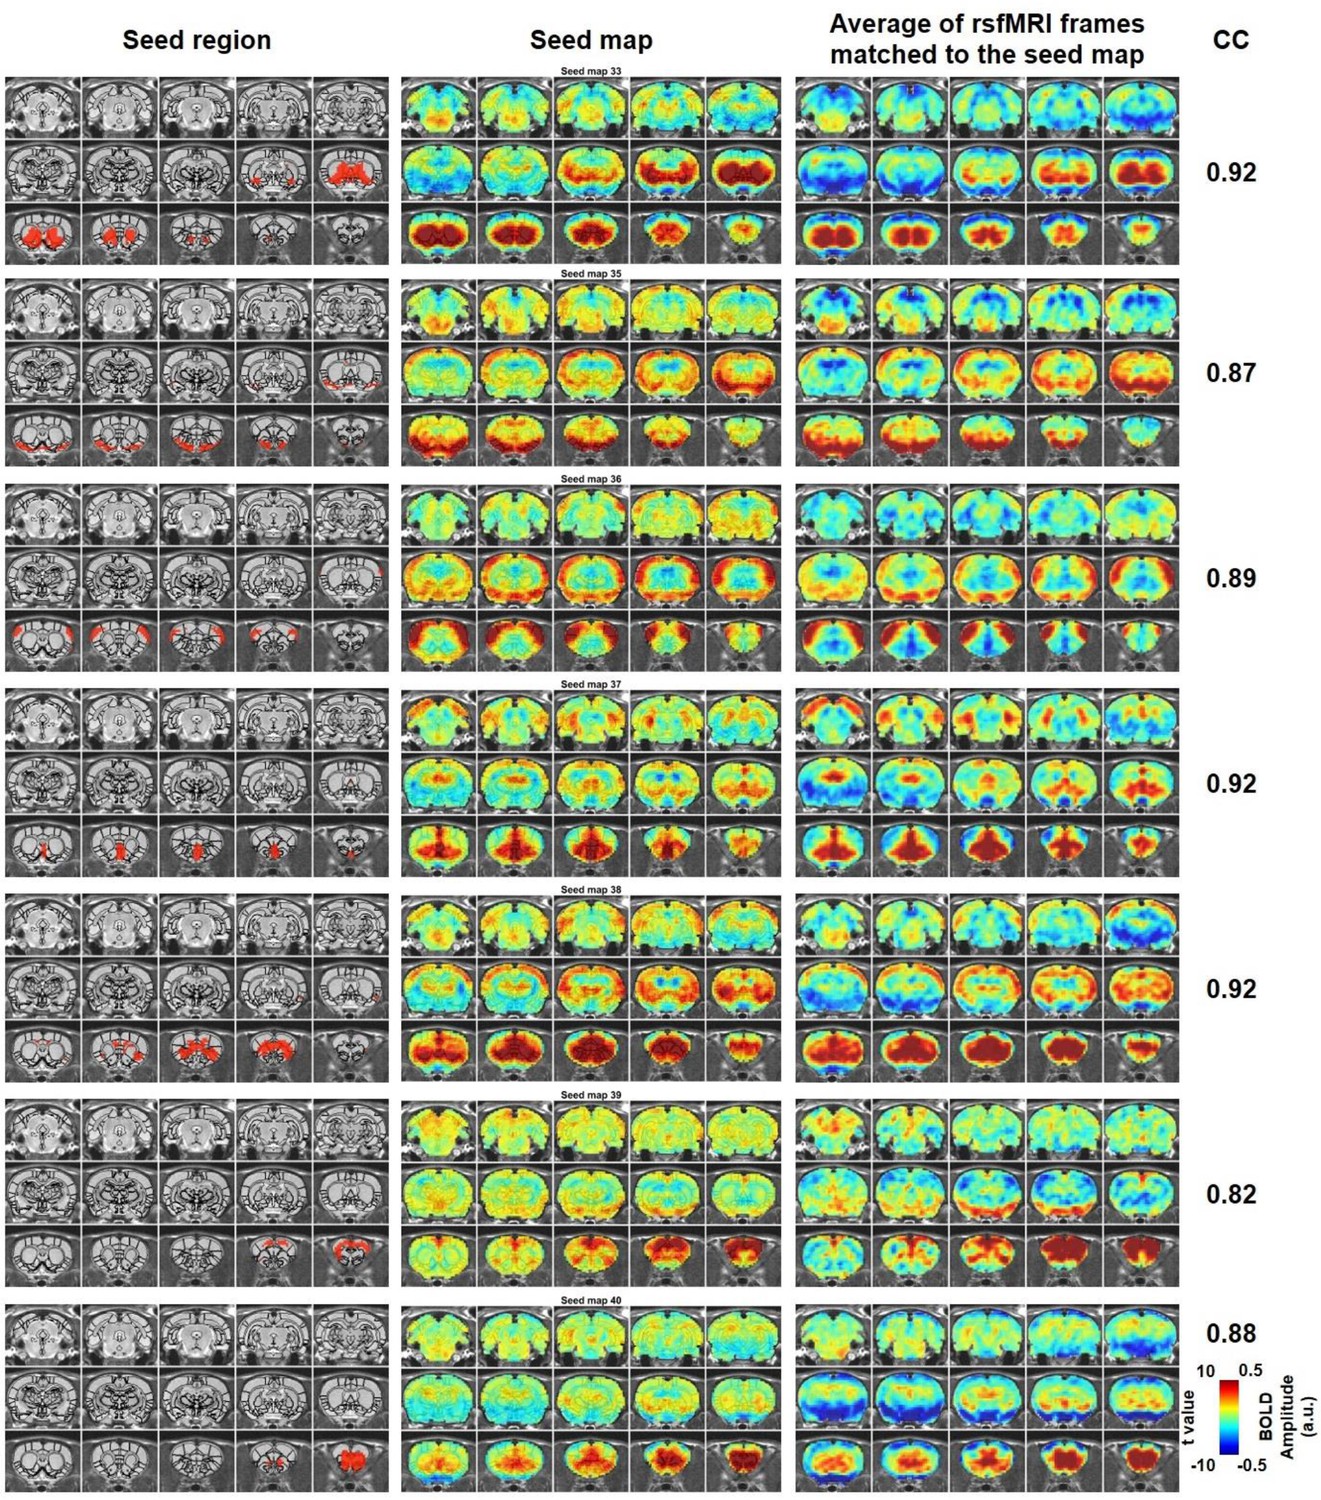
Characteristic RSFC patterns (33, 35-40) in the awake rat brain.
Left: seed region; Mid: RSFC pattern of the seed; Right: average of rsfMRI frames matched to the RSFC pattern. Distance to bregma for each slice is the same as those shown in Figure 2. CC: spatial correlation coefficient between the average of rsfMRI frames and the corresponding seed map.
Figure 3 with 3 supplements
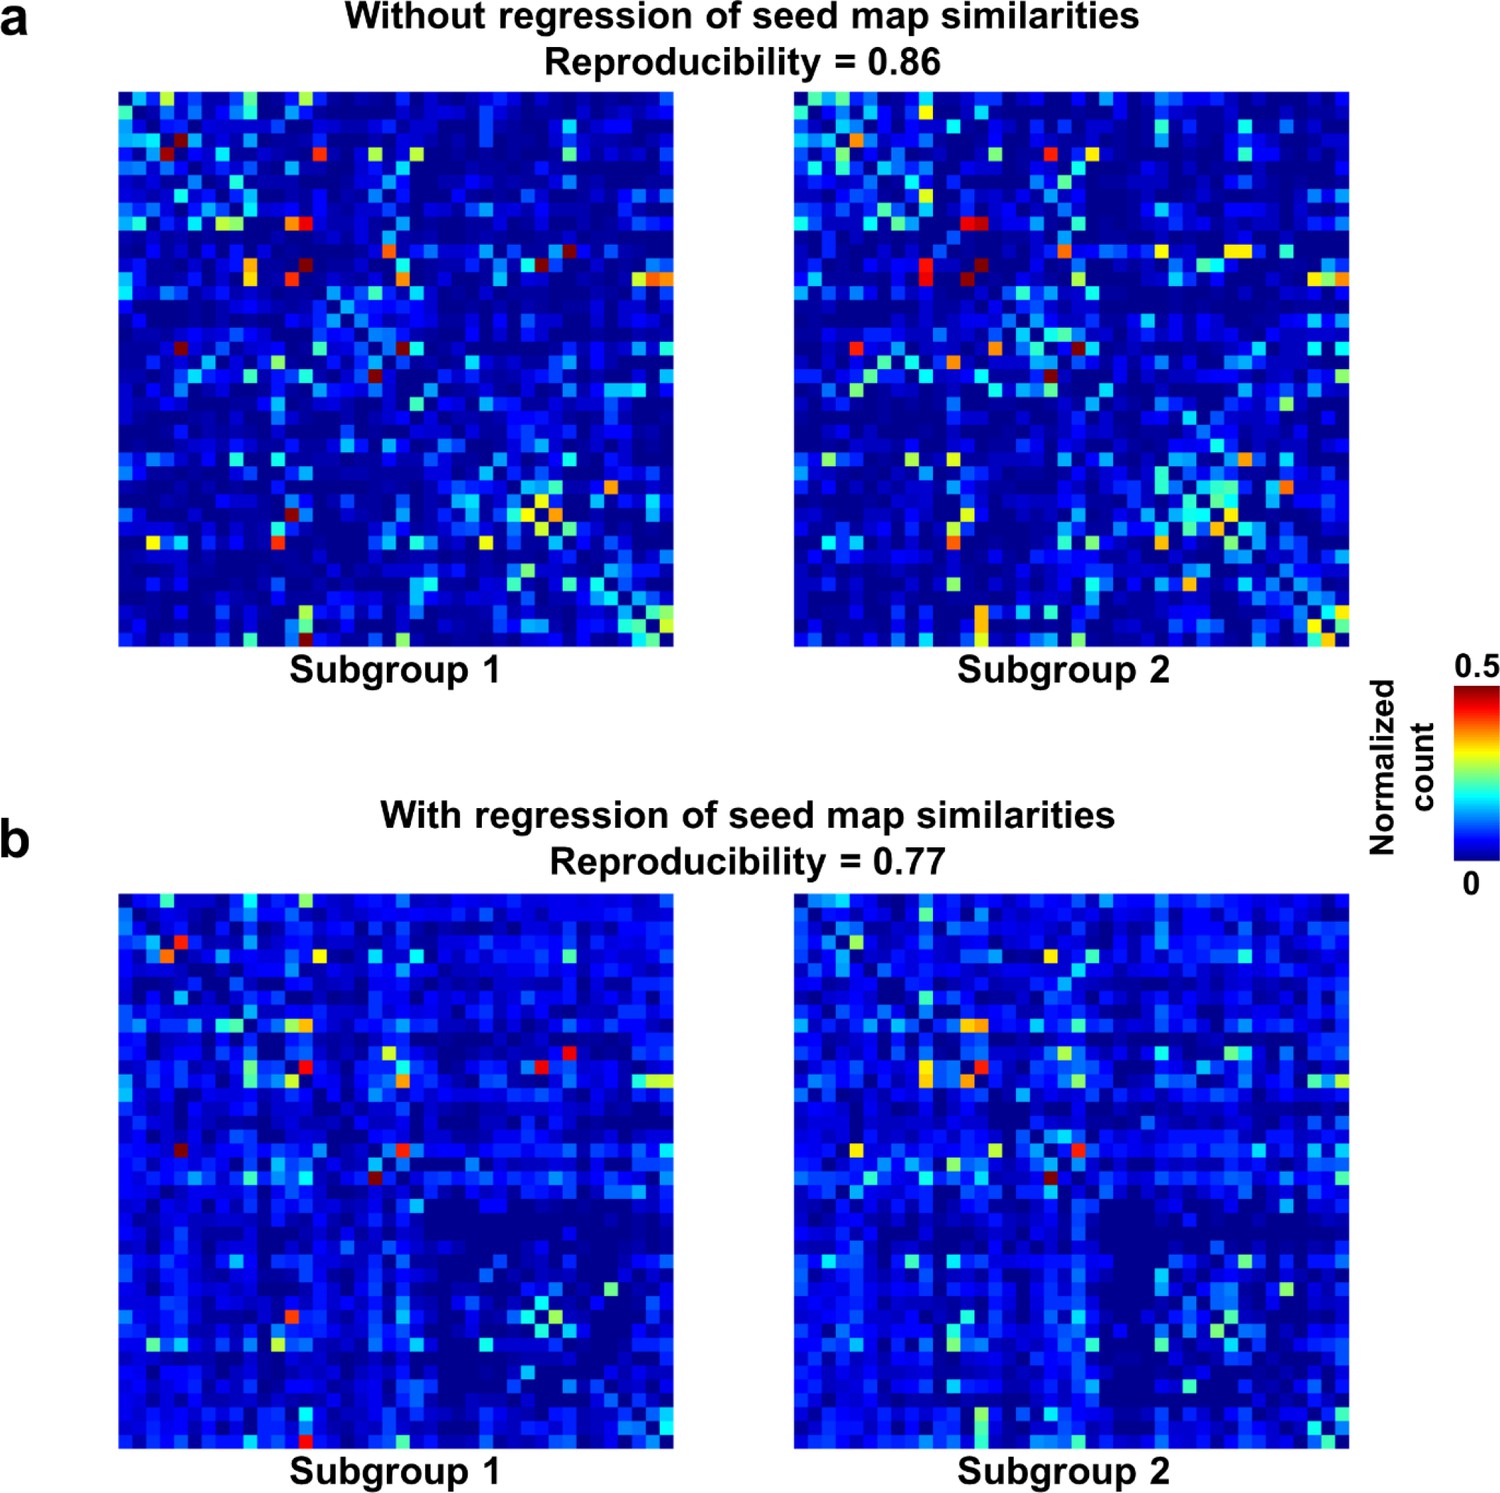
Reproducibility of the RSFC pattern transitions.
(a) RSFC pattern transition matrices of subgroups 1 and 2 without regression of spatial similarities between reference RSFC patterns. (b) RSFC pattern transition matrices of subgroups 1 and 2 with regression of spatial similarities between reference RSFC patterns. Entries in each transition matrix were normalized to the range of [0, 1].
Figure 3—figure supplement 1
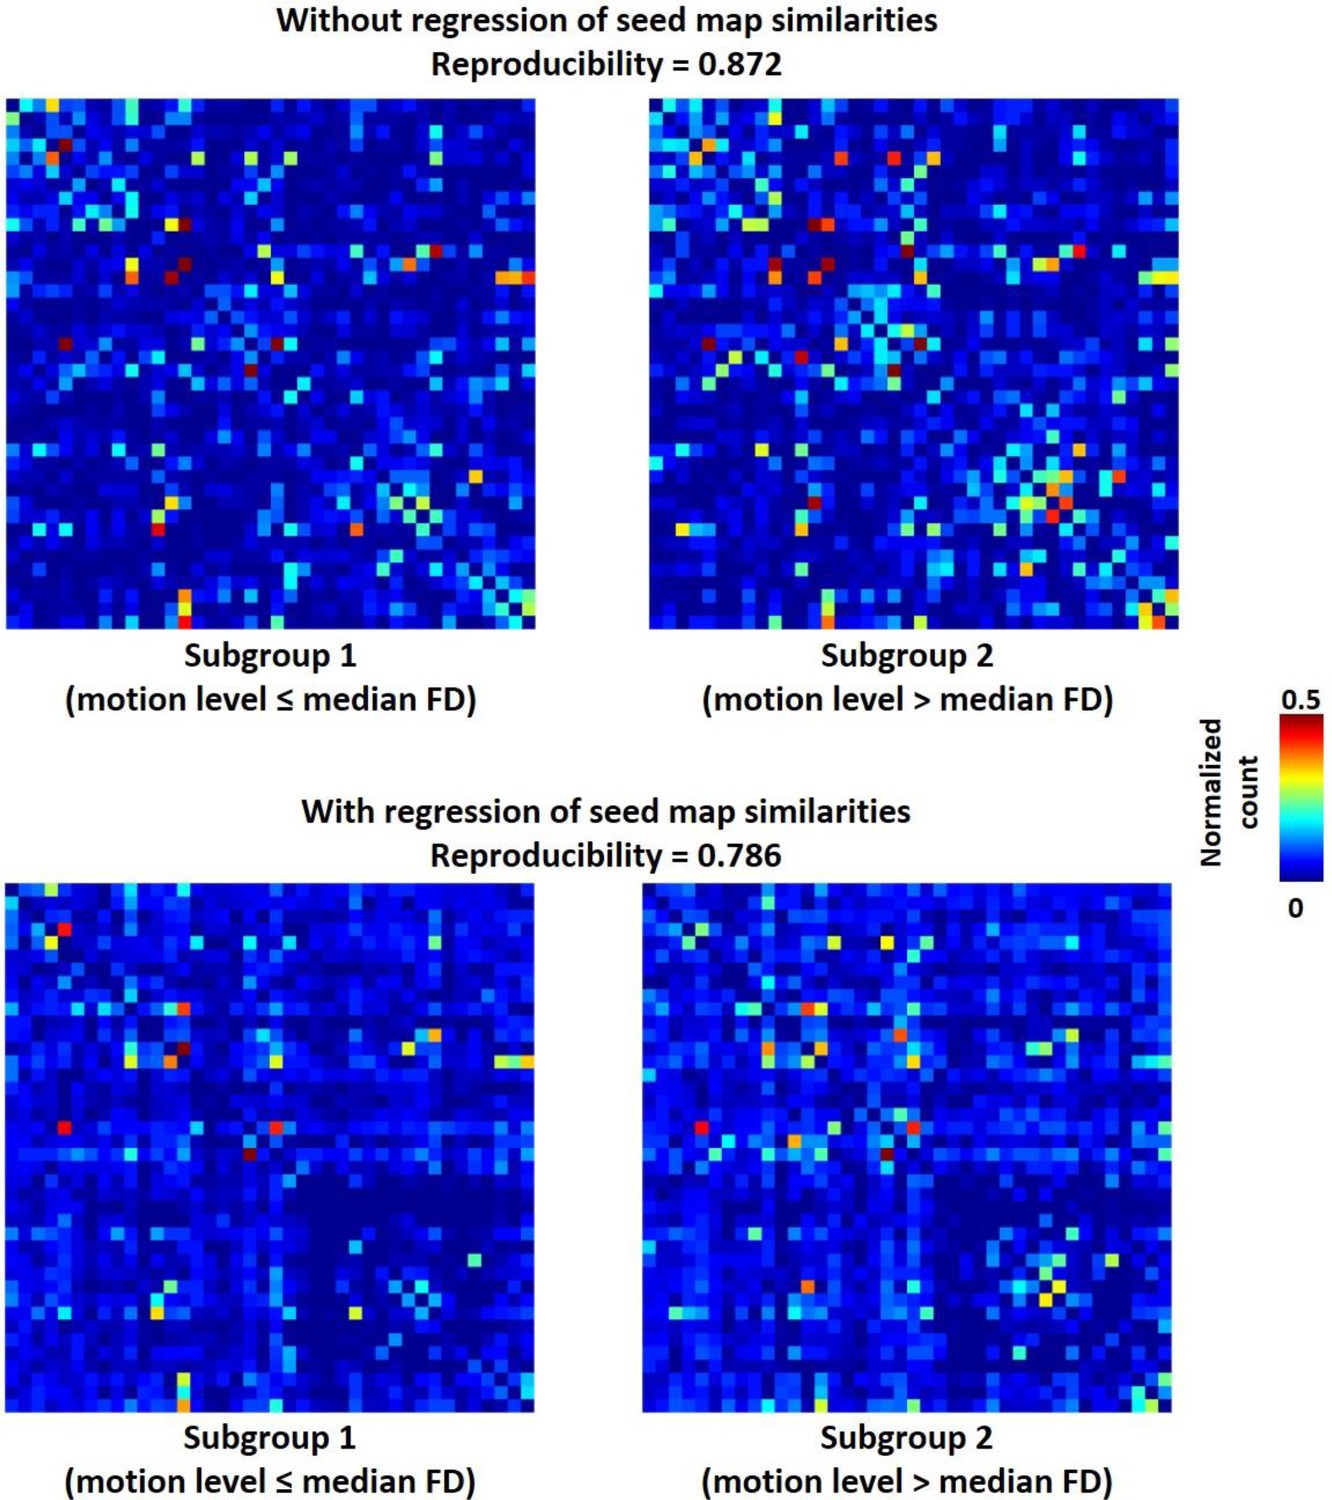
Reproducibility of RSFC pattern transitions between two subgroups of rats with relatively high (FD above median, right panels) and low (FD below median, left panels) motion levels without (top panels) and with (bottom panels) regression of RSFC pattern similarities.
https://doi.org/10.7554/eLife.33562.010
Figure 3—figure supplement 2
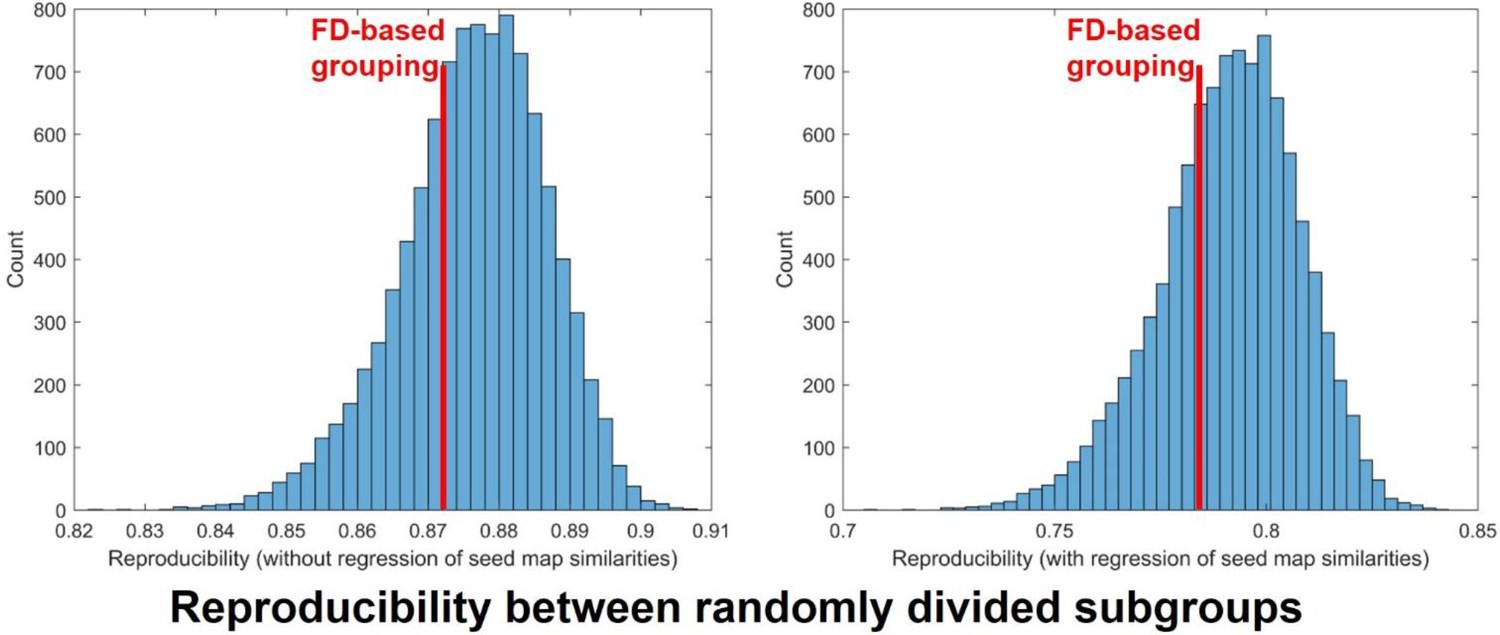
Distribution of the reproducibility of RSFC pattern transition matrices between randomly divided subgroups across 10000 trials.
Left: without regression of RSFC pattern similarities. Right: with regression of RSFC pattern similarities. Red lines: the reproducibility of RSFC pattern transition matrices between FD-based group division with (right) and without (left) regression of RSFC pattern similarities.
Figure 3—figure supplement 3
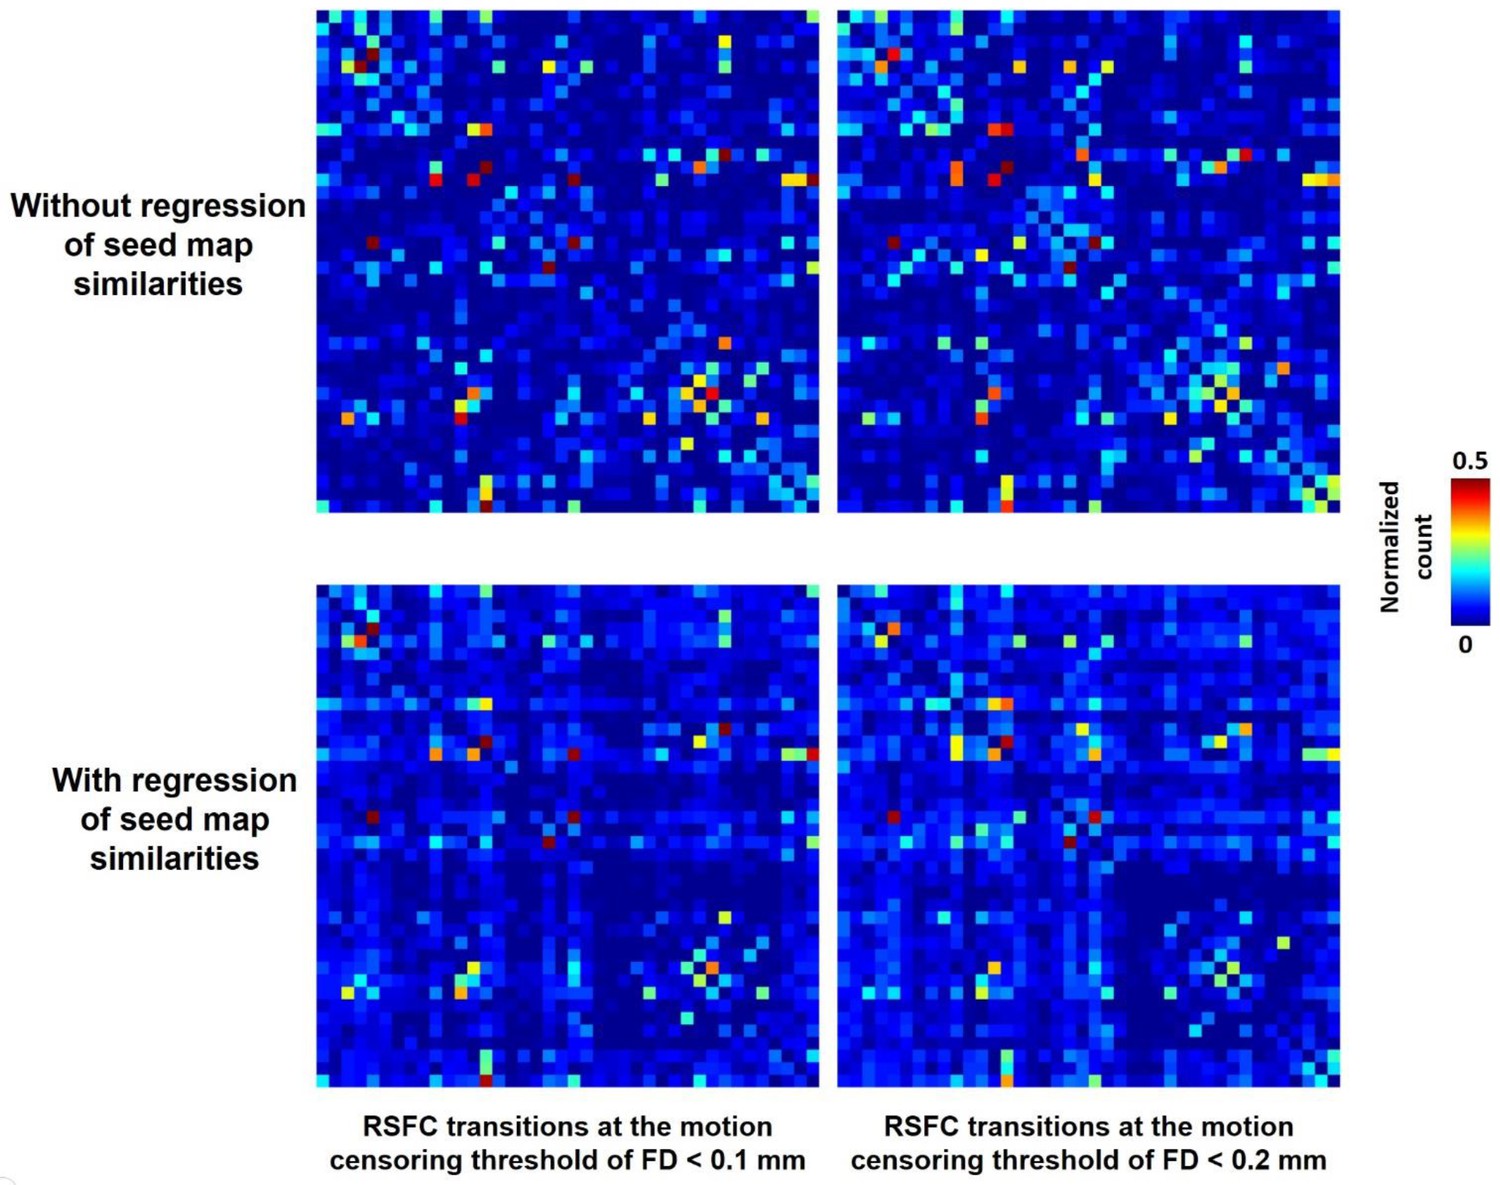
RSFC pattern transitions at different motion censoring threshold.
Left: RSFC pattern transition matrices at the motion censoring threshold of FD <0.1 mm without (top) and with (bottom) regression of RSFC pattern similarities. Right: RSFC pattern transition matrices at the motion censoring threshold of FD <0.2 mm without (top) and with (bottom) regression of RSFC pattern similarities. The correlations between the RSFC pattern transition matrices at FD <0.1 mm and those at FD <0.2 mm were 0.83 and 0.88 with and without regression of seed map similarities, respectively.
Figure 4
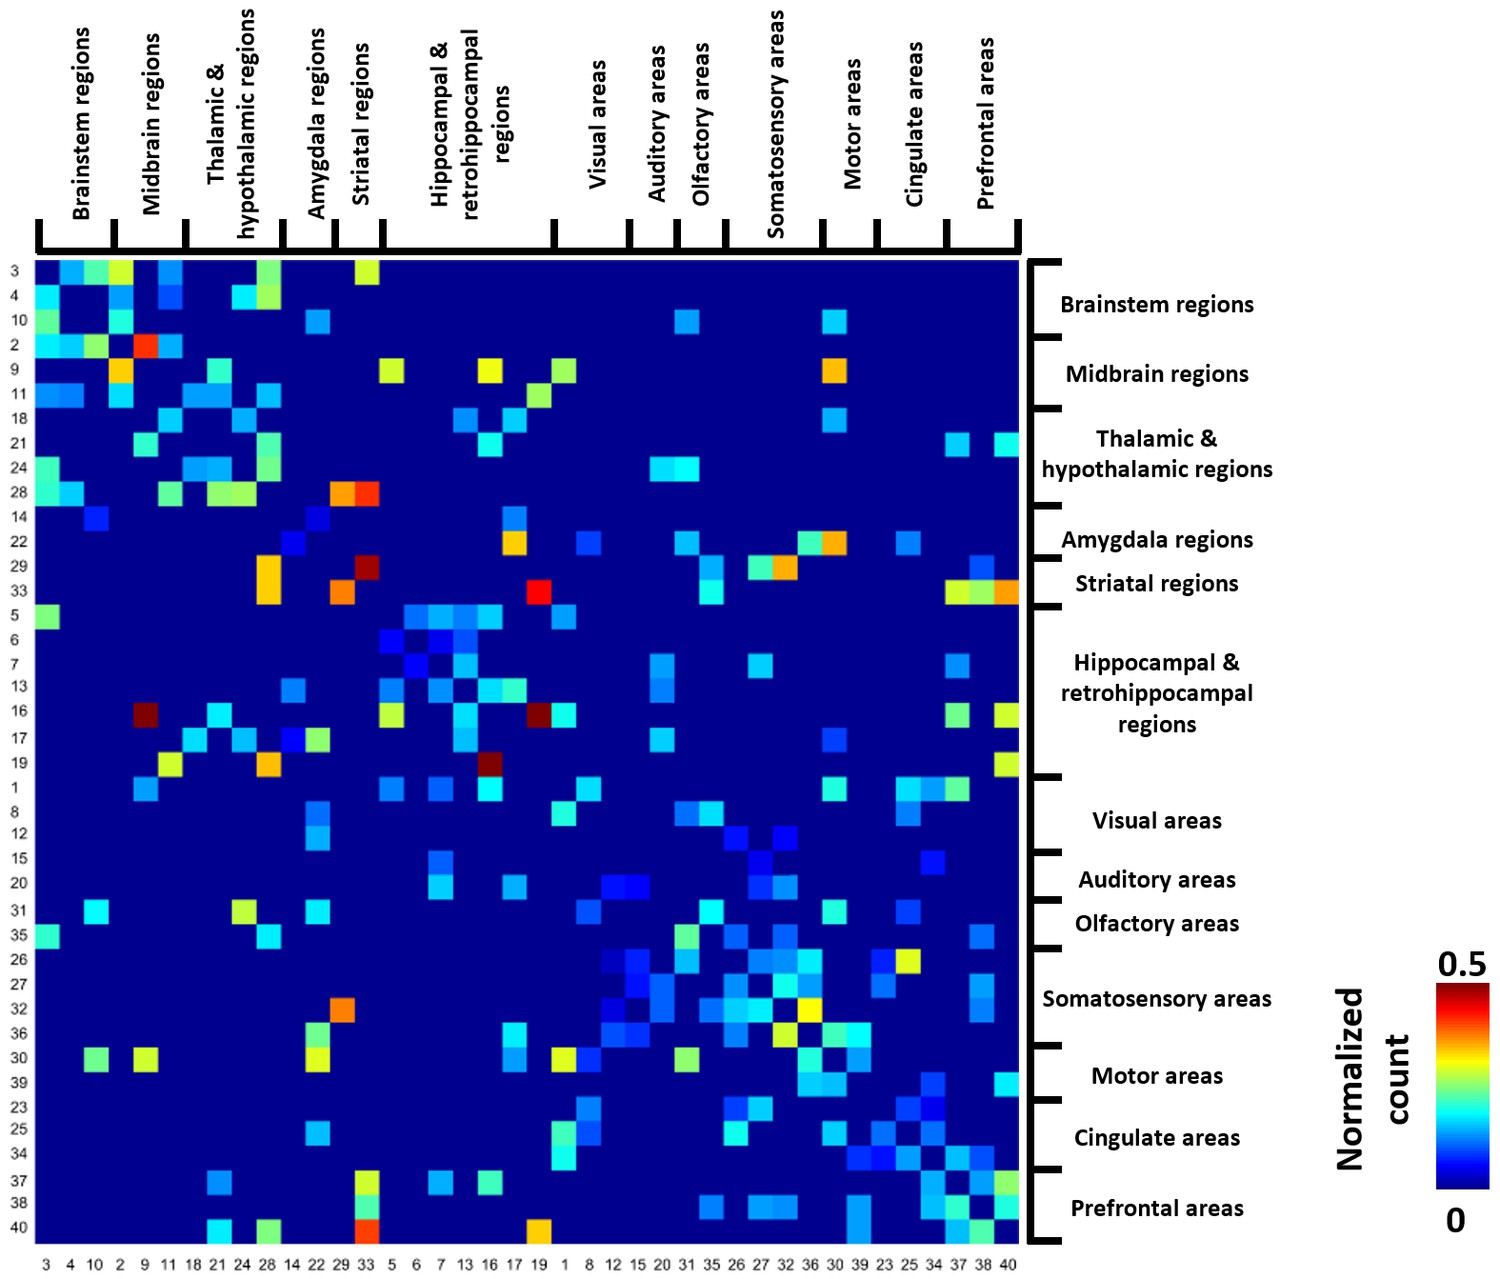
Thresholded group-level RSFC pattern transition matrix after regression of RSFC pattern similarities.
Rows/columns are arranged based on the brain system of the seed regions. Numbers next to/below rows/columns correspond to the seed map number in Figure 2 and Figure 2—figure supplement 1.
Figure 5
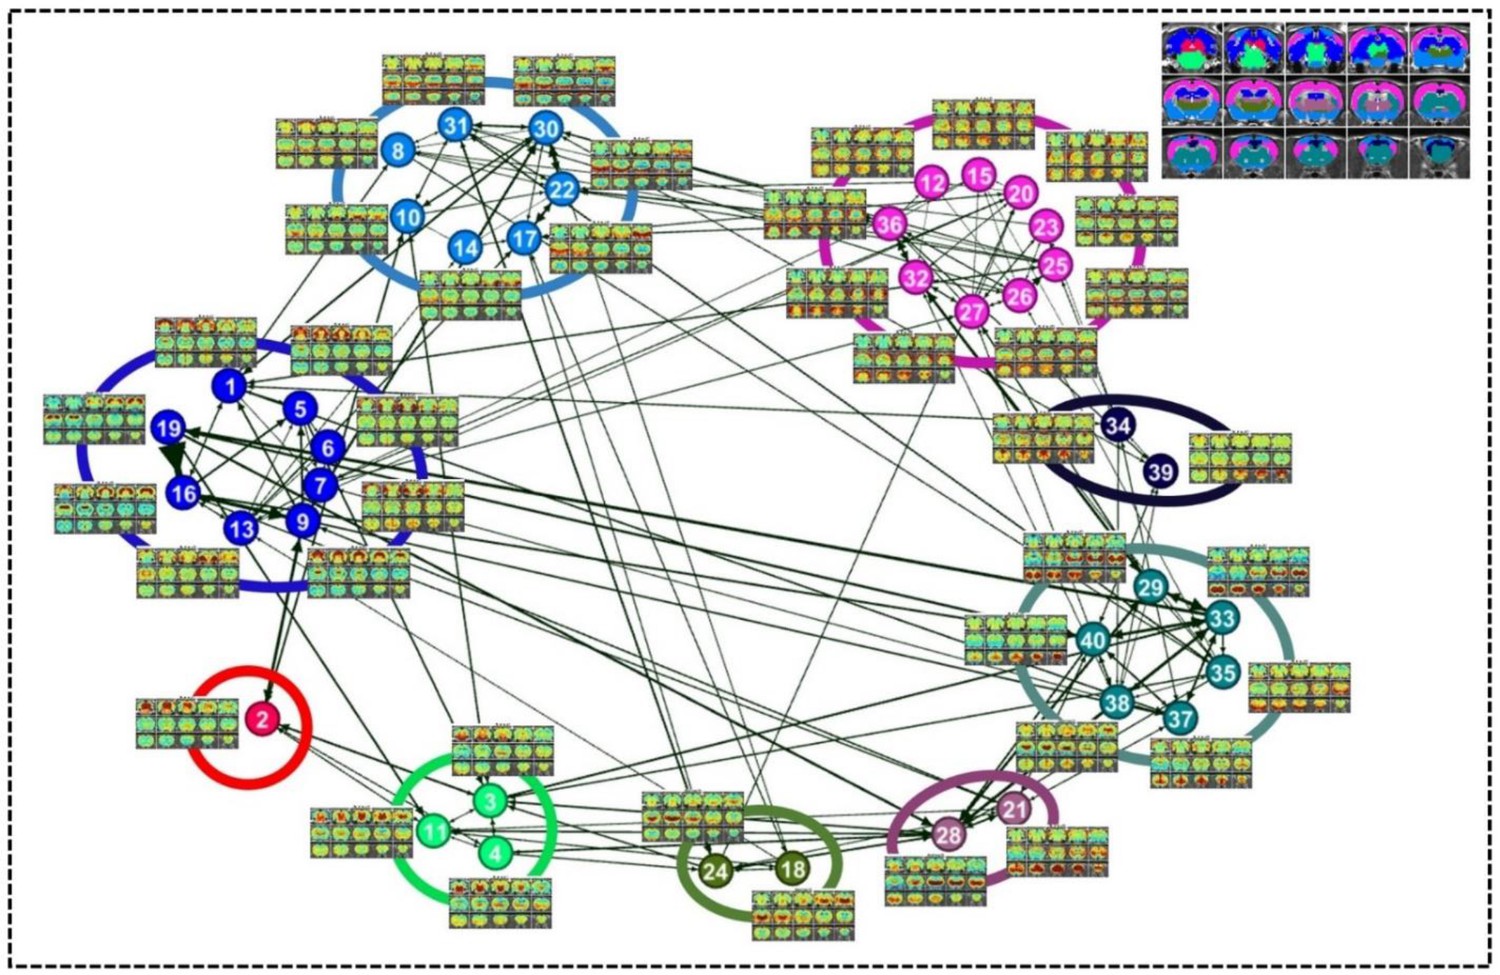
Community structures of the RSFC pattern transition network.
The thresholded transition matrix in Figure 4 was used as the adjacency matrix to generate a directed weighted graph. The layout of nodes was based on a force-field algorithm (Jacomy et al., 2014). The node number corresponds to the seed map number in Figure 2 and Figure 2—figure supplement 1—5. Inlet: seed regions of RSFC patterns colored coded based on the community affiliations of nodes (i.e. RSFC patterns).
Figure 6
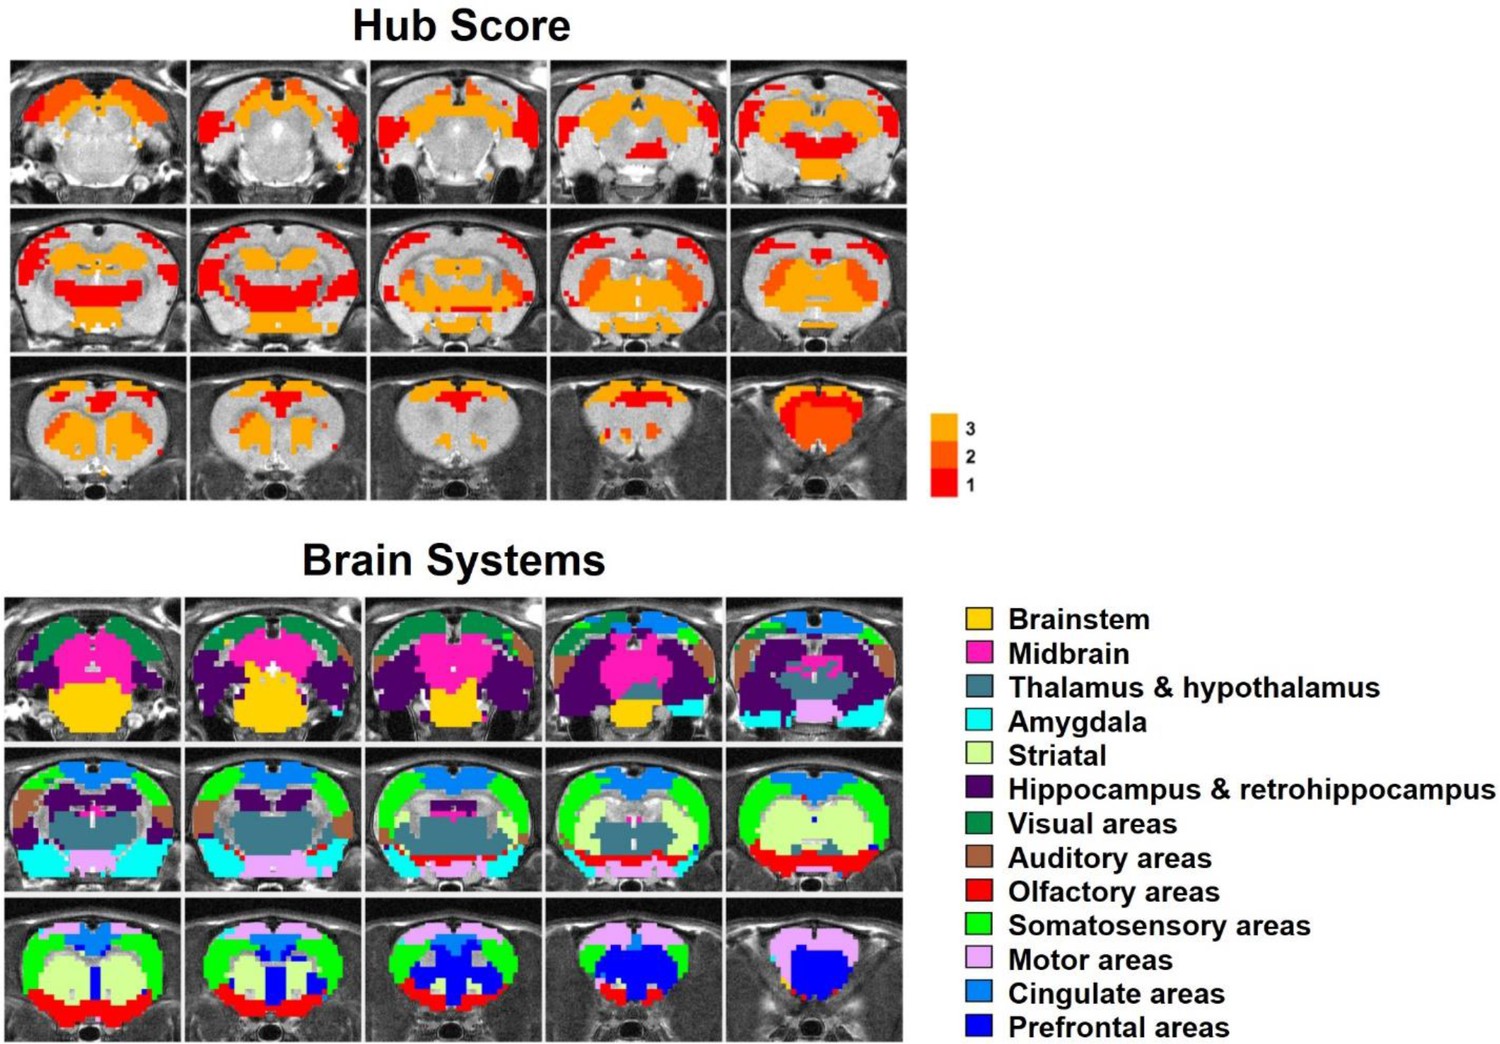
Top: Seed regions of RSFC patterns with hub score ≥1, color coded based on the hub score.
No color was given to seed regions of RSFC patterns with hub score = 0. Bottom: the brain systems of seed regions.
Figure 7
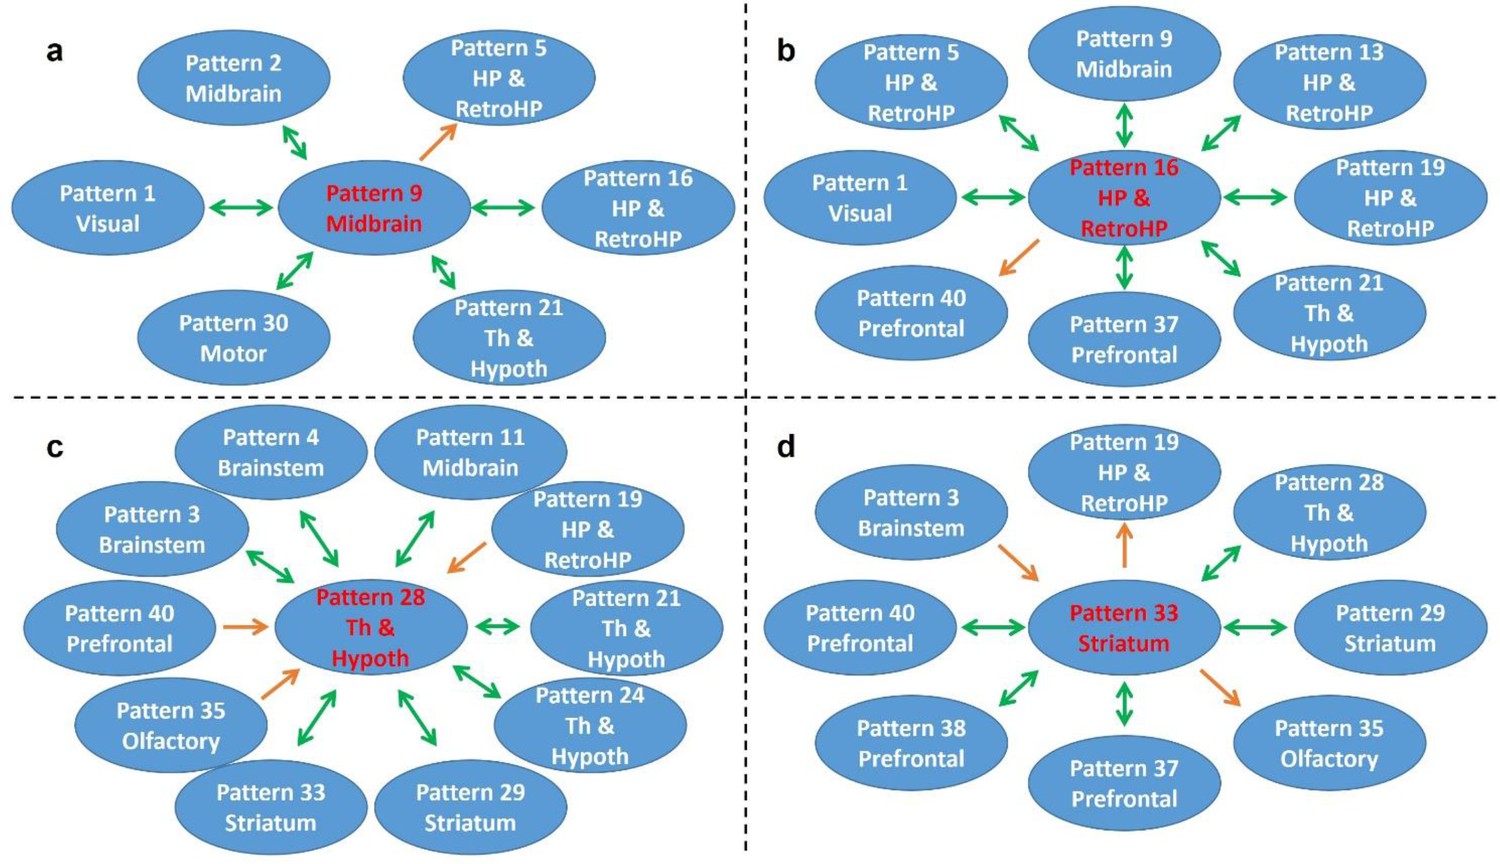
Transition patterns of hub networks.
Green arrows denote bidirectional transitions between RSFC patterns. Orange arrows denote unidirectional transitions between RSFC patterns. Pattern numbers correspond to the seed map numbers shown in Figure 2 and Figure 2—figure supplement 1—5. The brain system of the seed for each pattern is listed in the circle. Th and Hypoth, Thalamus and Hypothalamus; HP and RetroHP, Hippocampus and Retrohippocampus.
Figure 8
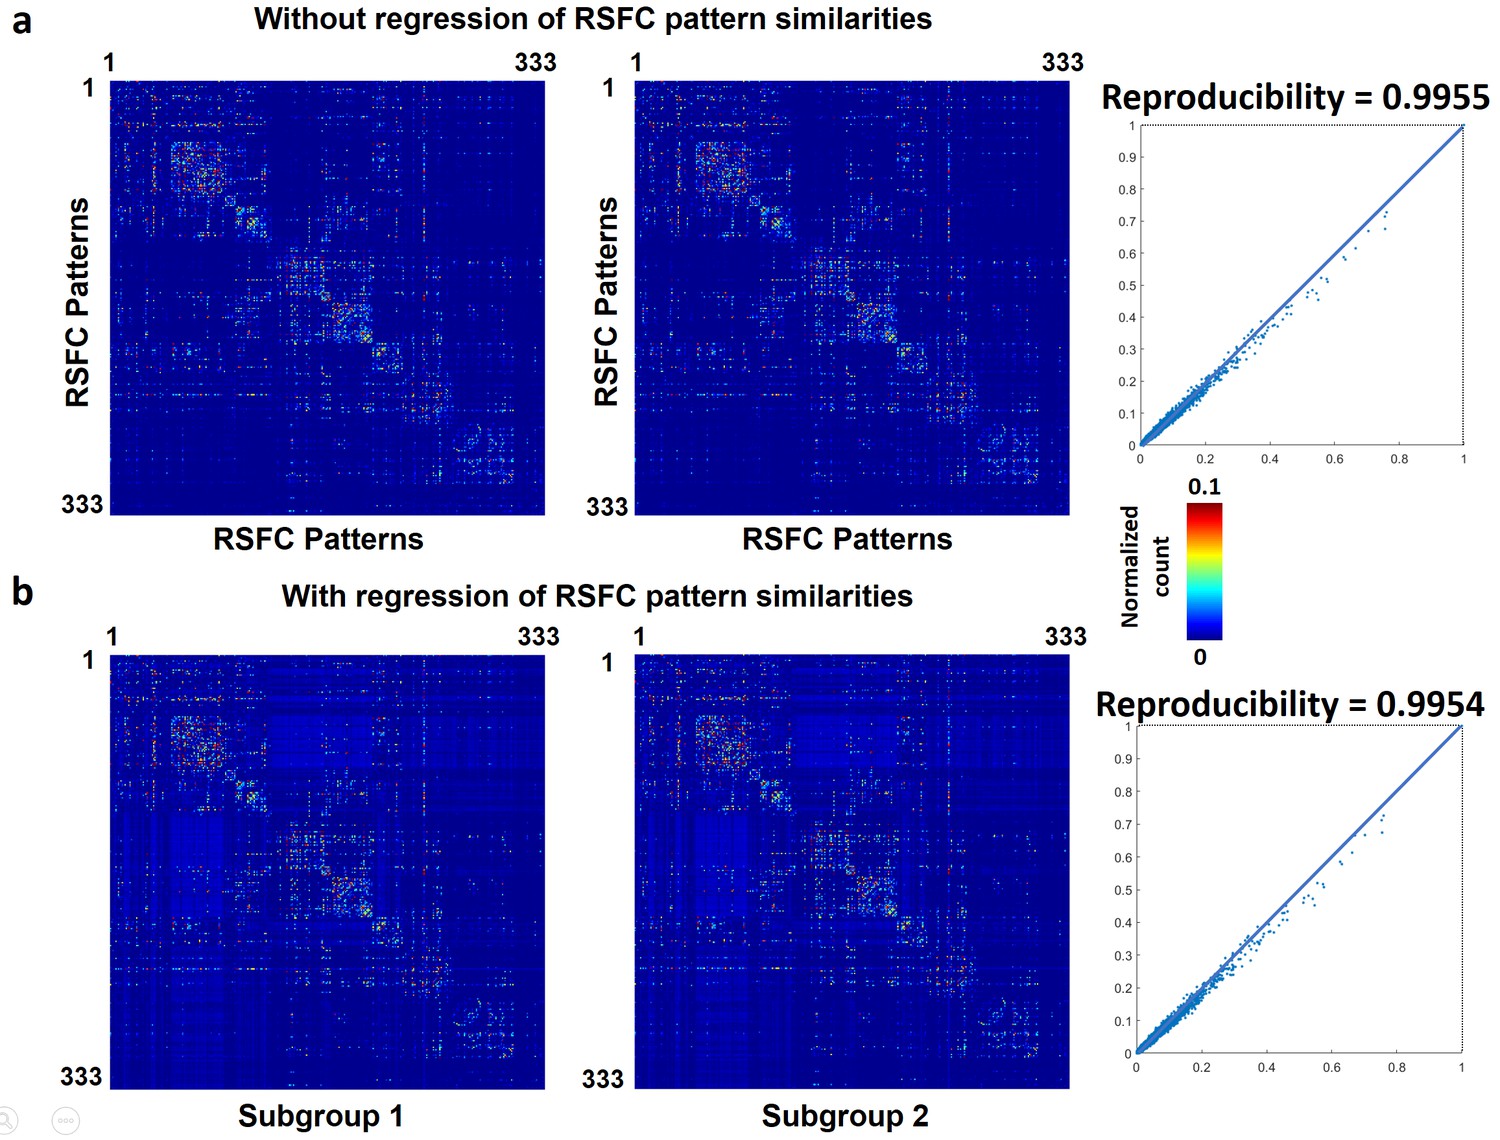
Reproducibility of temporal transitions between 333 characteristic RSFC patterns in humans.
The transition matrices of two randomly divided subgroups (a) without regression of RSFC pattern similarities (b) with the regression of RSFC pattern similarities.
Figure 9
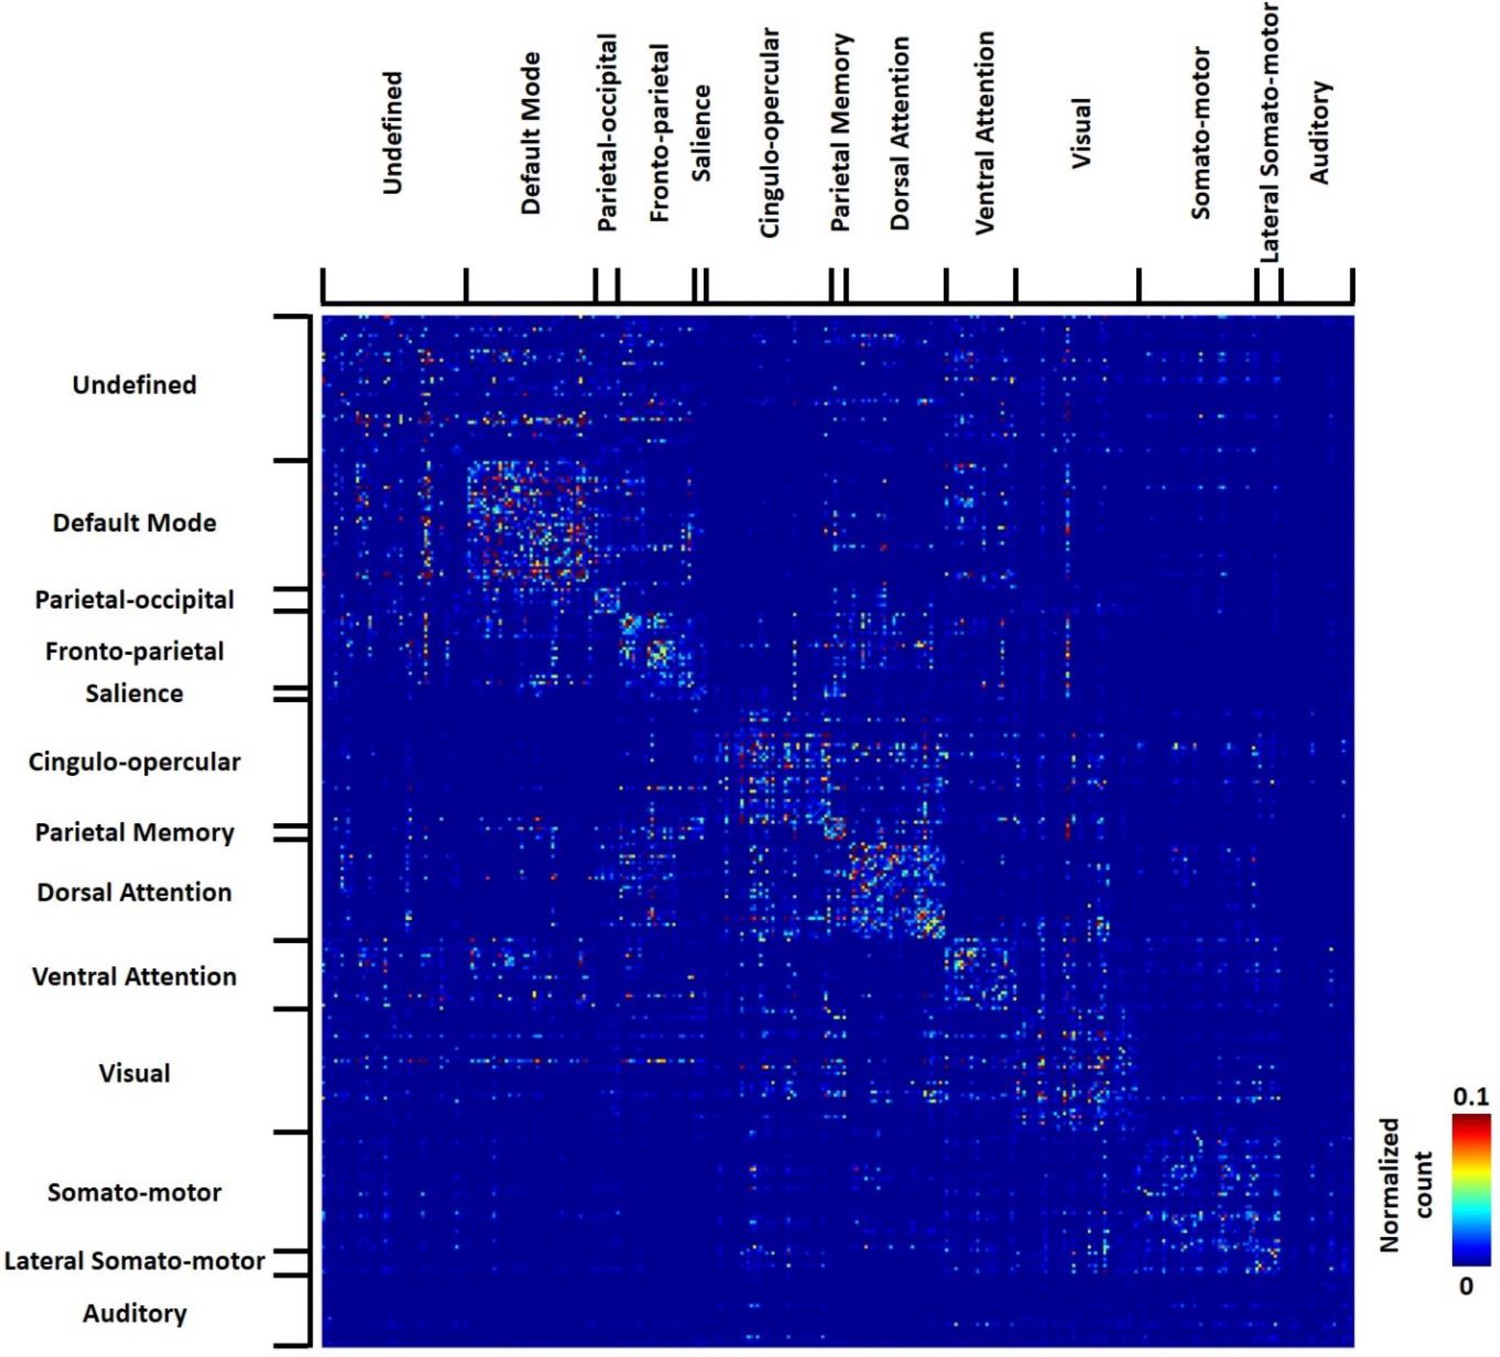
Thresholded group-level RSFC pattern transition matrix in humans (permutation test, p<0.05, FDR corrected).
Rows/columns are grouped based on the brain system of the seed.
Figure 10
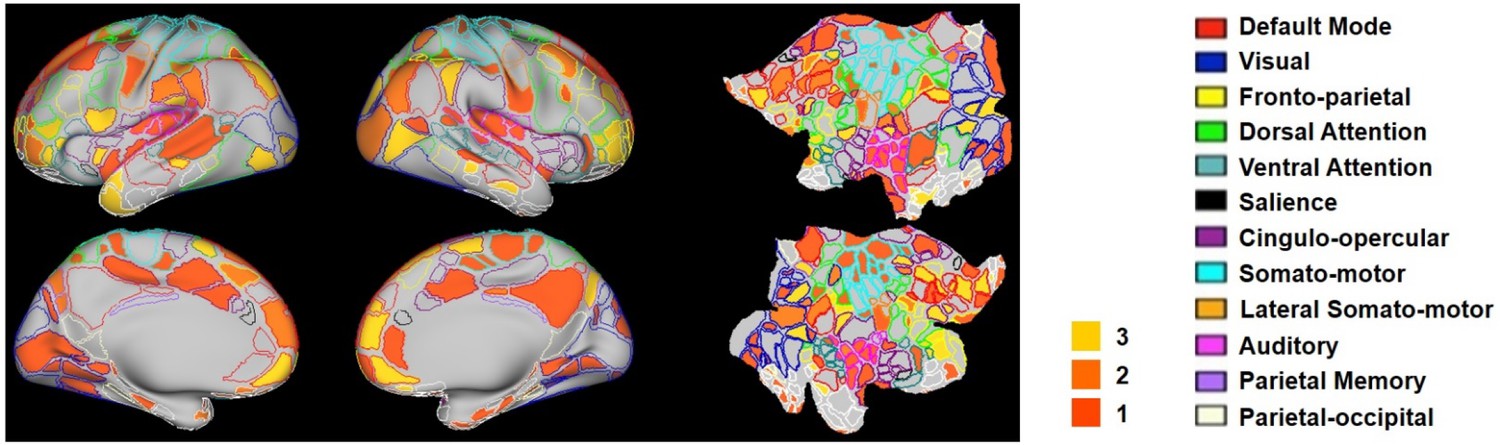
Hub scores of RSFC patterns in humans displayed on their seed regions.
The boundary of nodes was color coded based on the brain system (right). Nodes with hub score ≥3 were defined as hubs (yellow-filled nodes).
Additional files
-
Transparent reporting form
- https://doi.org/10.7554/eLife.33562.020
Download links
A two-part list of links to download the article, or parts of the article, in various formats.
Downloads (link to download the article as PDF)
Open citations (links to open the citations from this article in various online reference manager services)
Cite this article (links to download the citations from this article in formats compatible with various reference manager tools)
Temporal transitions of spontaneous brain activity
eLife 7:e33562.
https://doi.org/10.7554/eLife.33562


