Ensemble cryoEM elucidates the mechanism of insulin capture and degradation by human insulin degrading enzyme
- New York Structural Biology Center, United States
- The University of Chicago, United States
- Columbia University, United States
- University of California, San Diego, United States
- BioCAT, Argonne National Laboratory, United States
- Univ. Lille, INSERM, Institut Pasteur de Lille, France
- Harvard University, United States
- New York University School of Medicine, United States
Figures
Figure 1
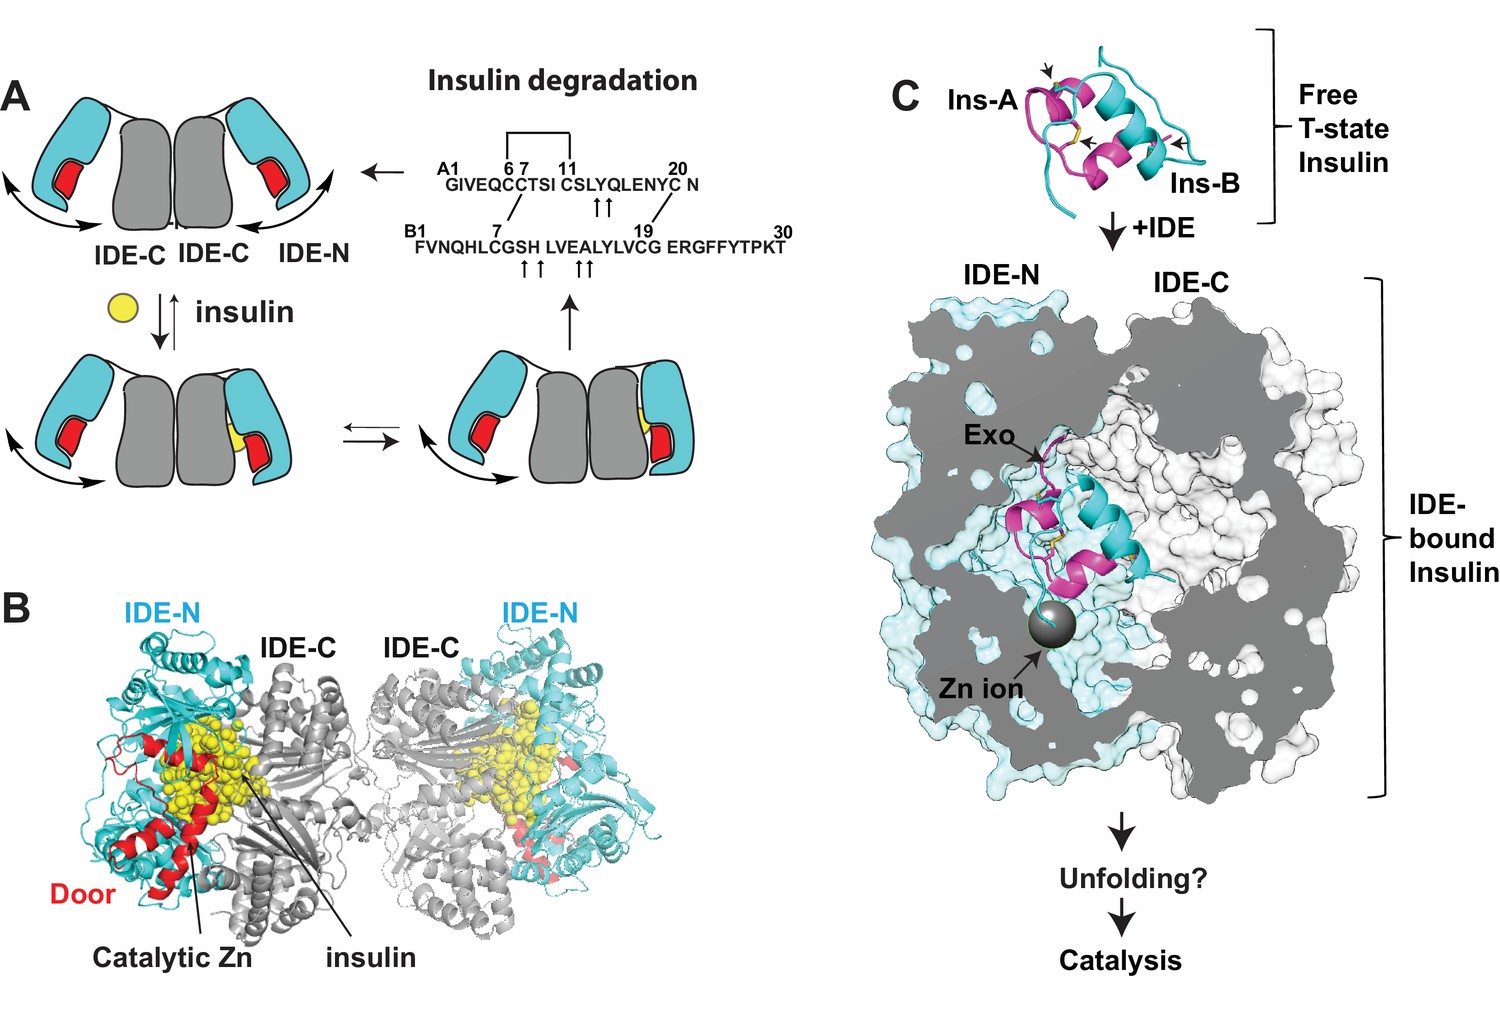
Summary of key unsolved IDE structures.
(A) Schematic diagram for the catalytic cycle of IDE. IDE is dimerized via the interaction of IDE-C domains. The open-closed transition of IDE dimer is postulated to be mediated by the rigid-body motion between IDE-N and IDE-C. The binding of substrate, e.g., insulin shifts the equilibrium from favoring the open-state IDE to predominantly closed-state IDE. Until now, the structure of open-state IDE has not been determined. (B) Ribbon representation of IDE dimer (PDB code: 2WBY). IDE-N and IDE-C are colored in cyan and grey, respectively. The IDE door subdomain that contains the catalytic zinc ion is highlighted in red and the partially unfolded insulin entrapped inside the catalytic chamber of IDE is colored in yellow. (C) The key conformational switches required for insulin unfolding and degradation by IDE. Insulin A and B chains in ribbon representation are colored in magenta and cyan, respectively. Top: Insulin alone structure where the intra- and inter-molecular disulfide bonds are marked by arrows. Middle: IDE-bound insulin structure that contains partially unfolded insulin (PDB code: 2WBY). The N-terminus binding exosite (Exo) and catalytic zinc ion are marked by arrows. Until now, the structure of IDE in complex with the fully unfolded or cleaved insulin is not determined.
Figure 2 with 10 supplements
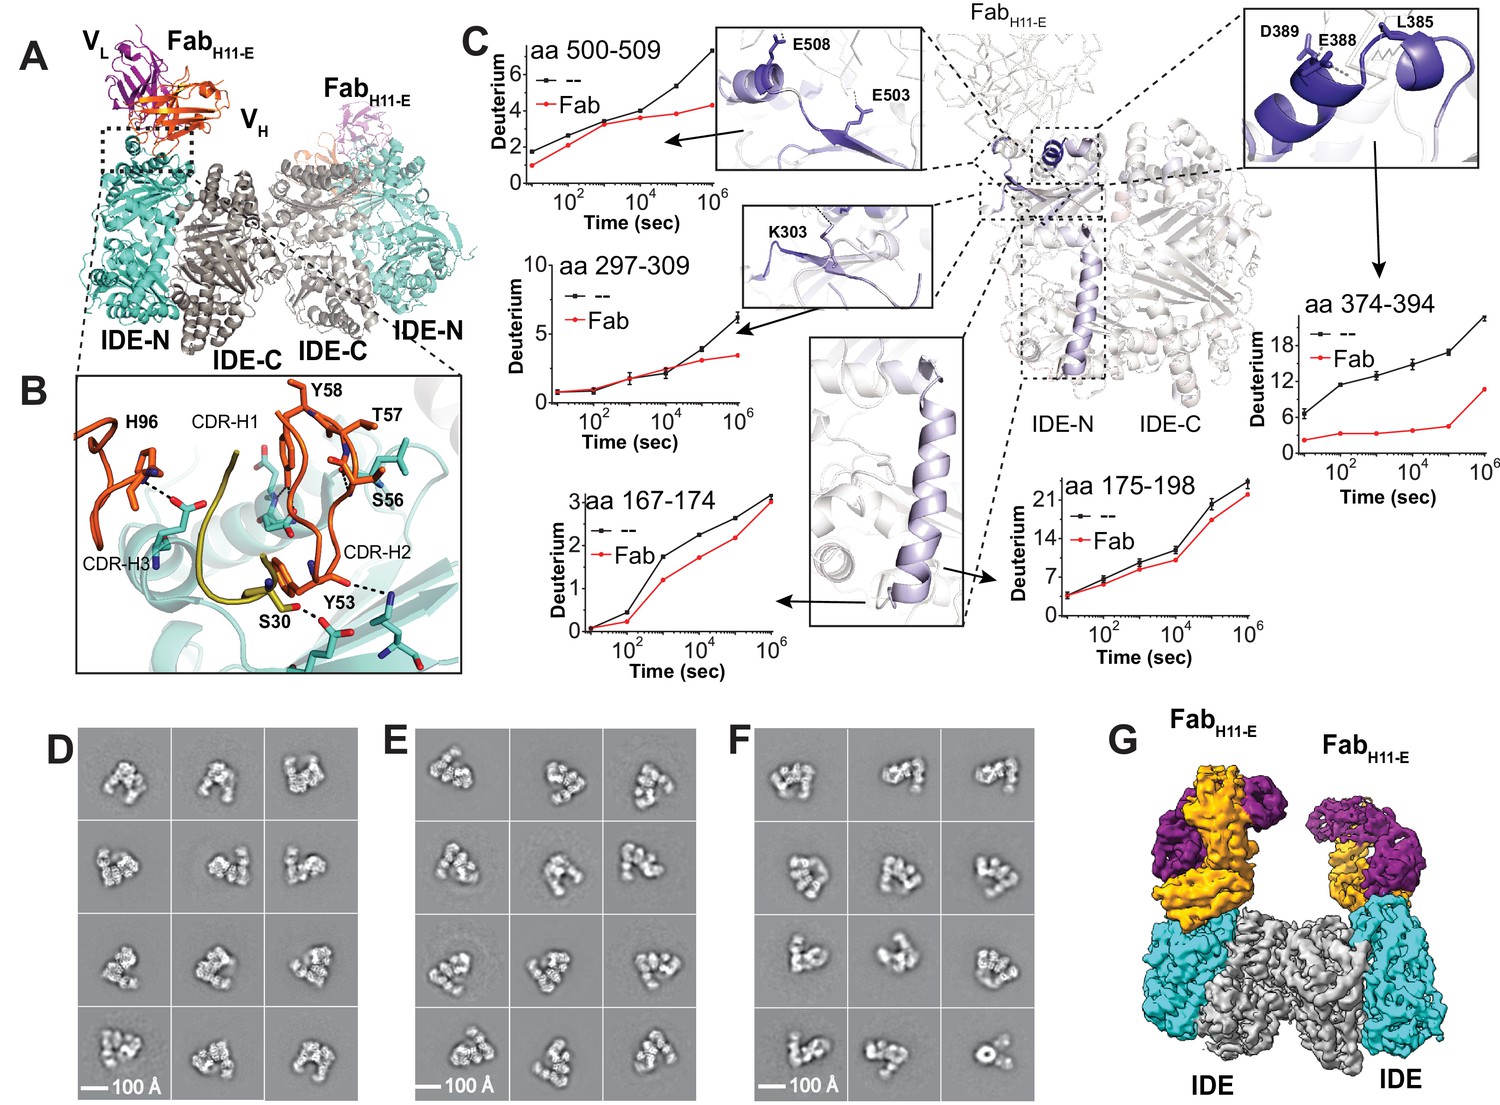
Structures of IDE-Fab(H11)-bound IDE dimer.
(A) Overall structure of FabH11-E-bound IDE dimer in ribbon representation (PDB code: 5UOE). IDE-N and IDE-C are colored in cyan and grey, respectively; The heavy and light chains of FabH11-E are colored in orange and purple, respectively. (B) Detailed interactions between IDE and FabH11-E. The key residues involved in the interaction of IDE with FabH11 were calculated using PDBePISA (Krissinel and Henrick, 2007). (C) Changes of hydrogen/deuterium exchange of IDE induced by the binding of FabH11-E. Representative 2D class averages of (D) insulin-bound IDE-FabH11-E, (E) Apo IDE-FabH11-E-bound IDE from untilted micrographs and (F) Apo IDE-FabH11-E-bound IDE from 30 degree titled micrographs. (G) Electron density map of IDE-FabH11-E-bound IDE dimer in the presence of insulin.
Figure 2—figure supplement 1
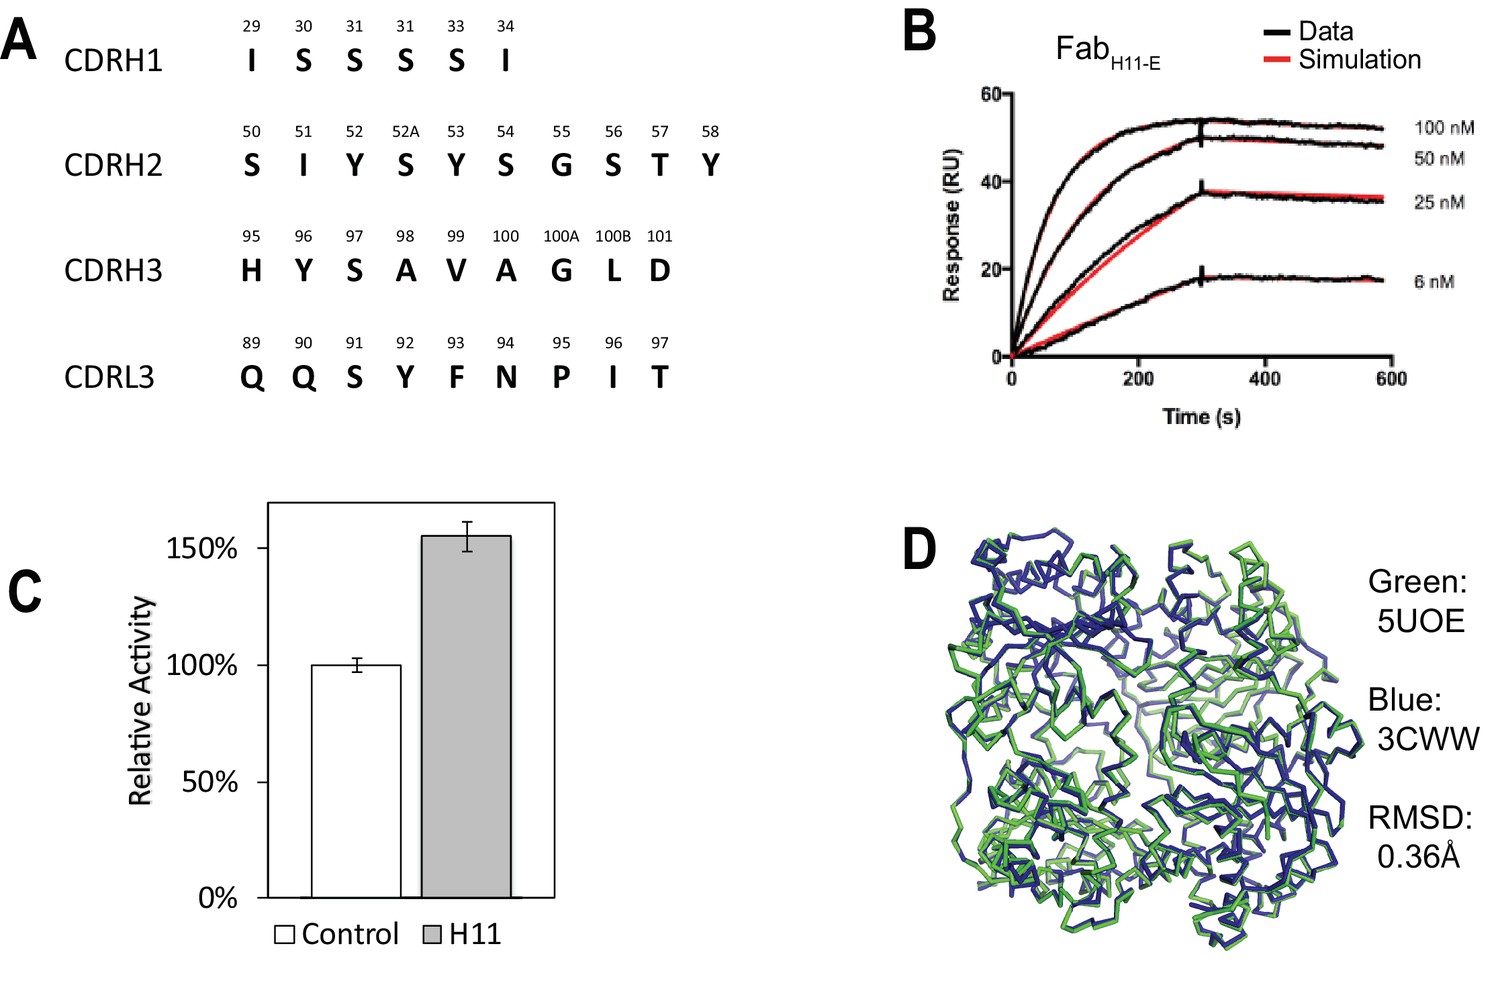
Characterization of IDE-Fab(H11).
(A) Sequence of 4 CDRs (H1, H2, H3, L3) of FabH11. (B) Representative SPR sensorgram on FabH11 binding to immobilized IDE. The kon and koff were estimated to be 1.6 × 10⁵ M−1s−1 and 1.1 × 10⁻⁴ s−1, respectively. (C) Relative catalytic activity of IDE in the presence and absence of FabH11-E using a model fluorogenic substrate, substrate V. The standard deviation is derived from three experiments. (D) Alignment of IDE from IDE-Fab(H11-E) complex (colored green; PDB code: 5UOE) with that from bradykinin-bound IDE structure (colored blue; PDB code: 3CWW). The RMSD is 0.36 Å.
Figure 2—figure supplement 2
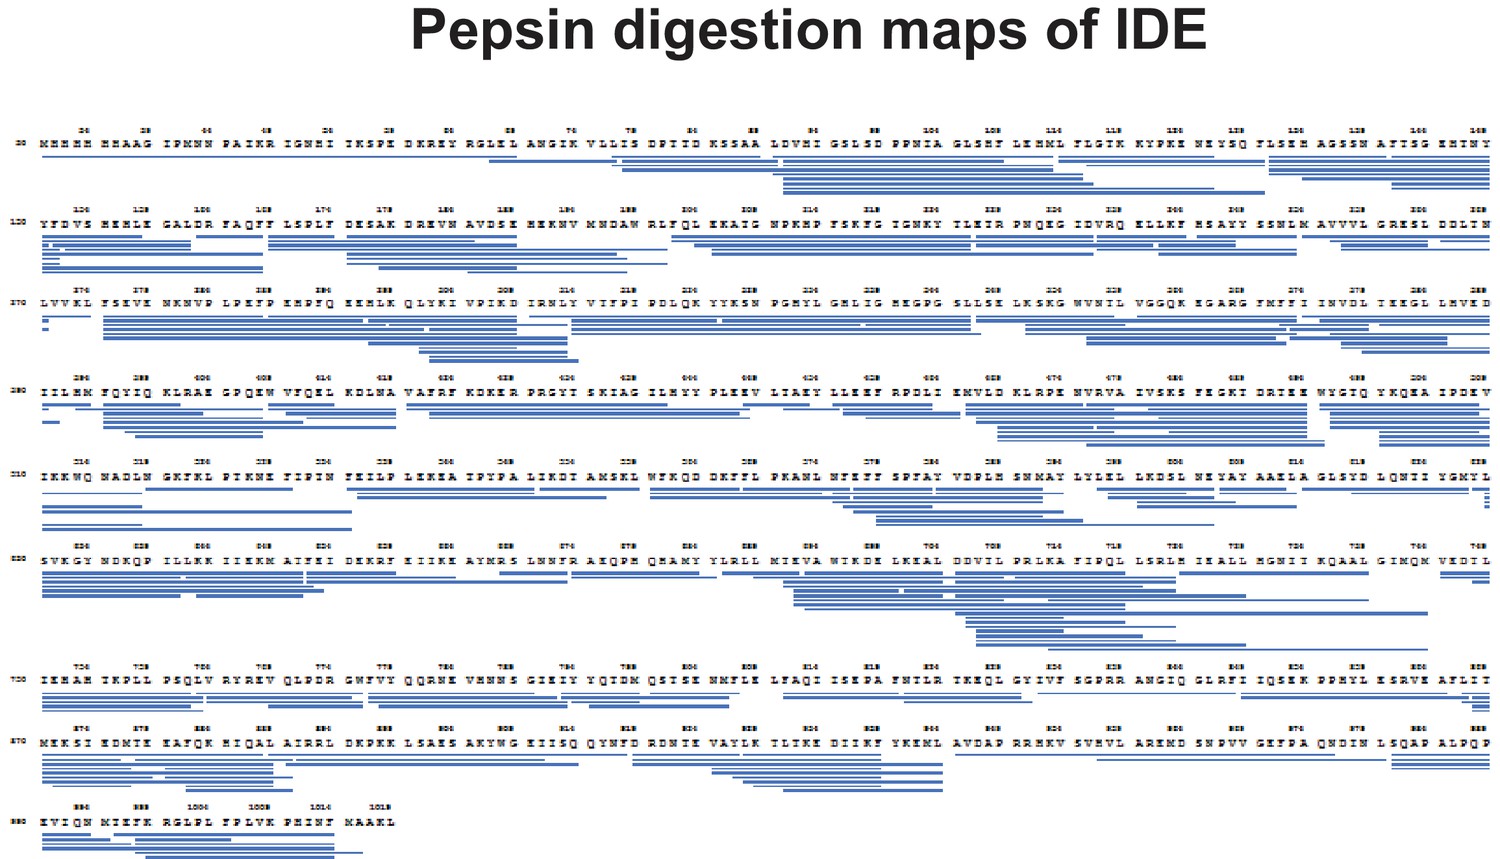
Pepsin digestion maps of IDE for HDX-MS analysis.
https://doi.org/10.7554/eLife.33572.005
Figure 2—figure supplement 3

Amide hydrogen-deuterium exchange profiles of IDE alone (A) and IDE in the presence of Fab-H11 (B).
The percentages of deuteration levels of each peptide fragment at various time points are shown as a heat map color-coded from blue (<10%) to red (>90%), as indicated at the bottom right of the figure. Each block represents a peptide segment analyzed at each of the six time points (from top to bottom: 10, 100, 1000, 10,000, 100,000, and 1000,000 s). Proline residues, and regions with no amide exchange data available are colored in gray. The structure features of IDE are shown above IDE sequences and colored according to their domains/subdomains.
Figure 2—figure supplement 4
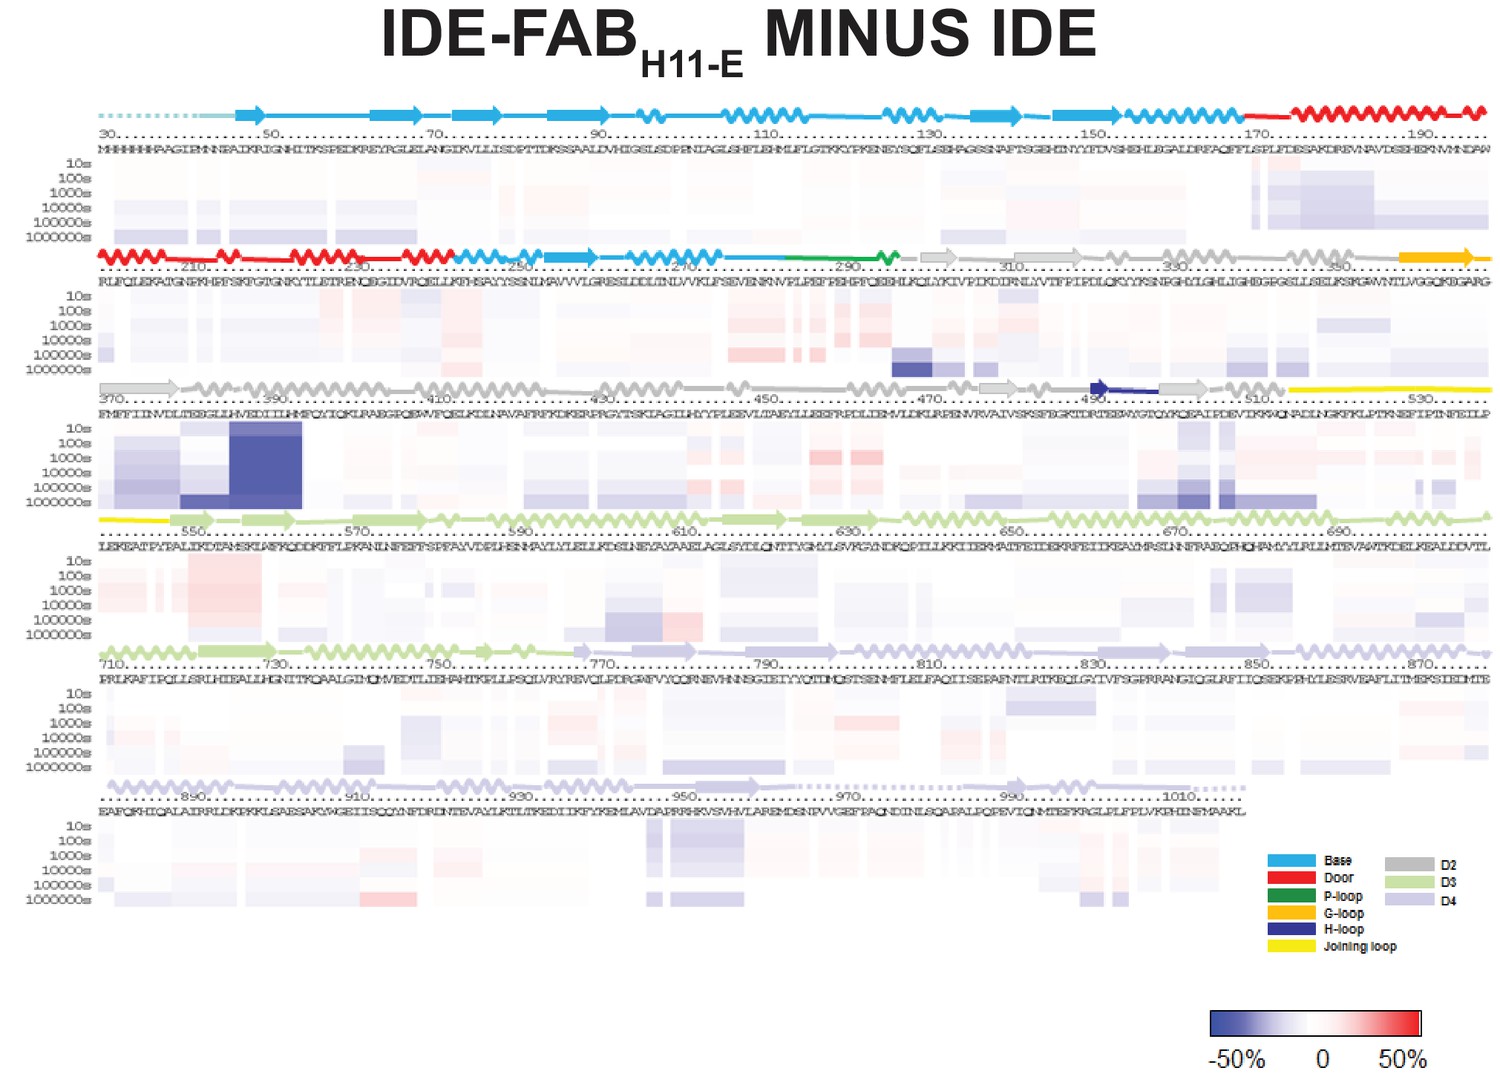
HDX-MS analysis of IDE-FabH11 interaction.
Differences in deuteration levels in the free and FabH11-bound IDE at various time points (from top to bottom: 10, 100, 1000, 10,000, 100,000, and 1000,000 s) are shown in a color-coded bar ranging from blue (−50%) to red (50%), as indicated at the bottom right of the figure. The structure features of IDE are shown above IDE sequences and colored according to their domains/subdomains.
Figure 2—figure supplement 5
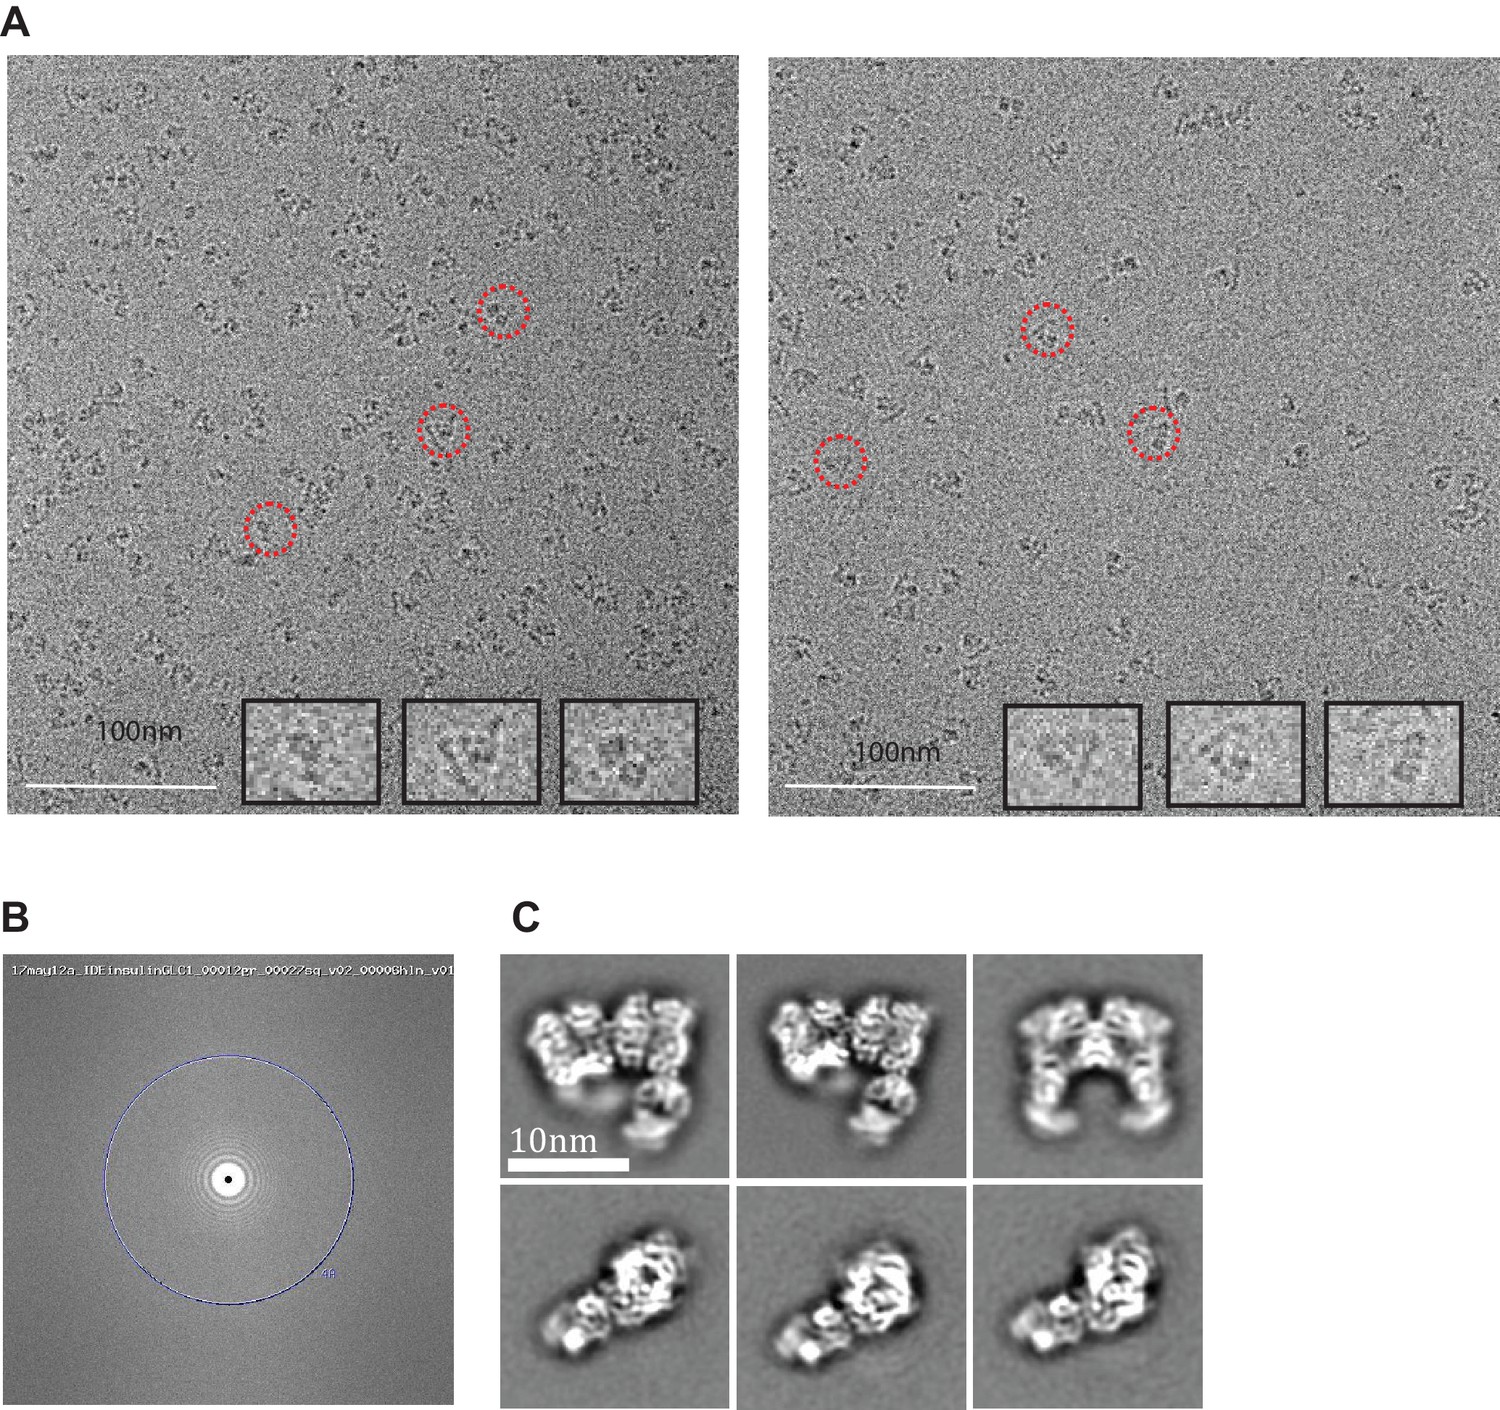
Cryo-electron micrographs and 2D class averages of insulin-bound IDE-FabH11-E.
(A) Insulin-bound IDE-FabH11-E images with 3.04 μm (left micrograph) and 3.45 μm (right micrograph) defocus. Representative particles indicated in red circles are shown at higher resolution as insets. (B) Fourier transform of the corresponding image, showing Thon rings going out to 3.1 Angstrom. (C) 2D class averages of insulin-bound IDE-FabH11-E particles using Relion2.1 and the option to ignore the CTFs until the first peak.
Figure 2—figure supplement 6
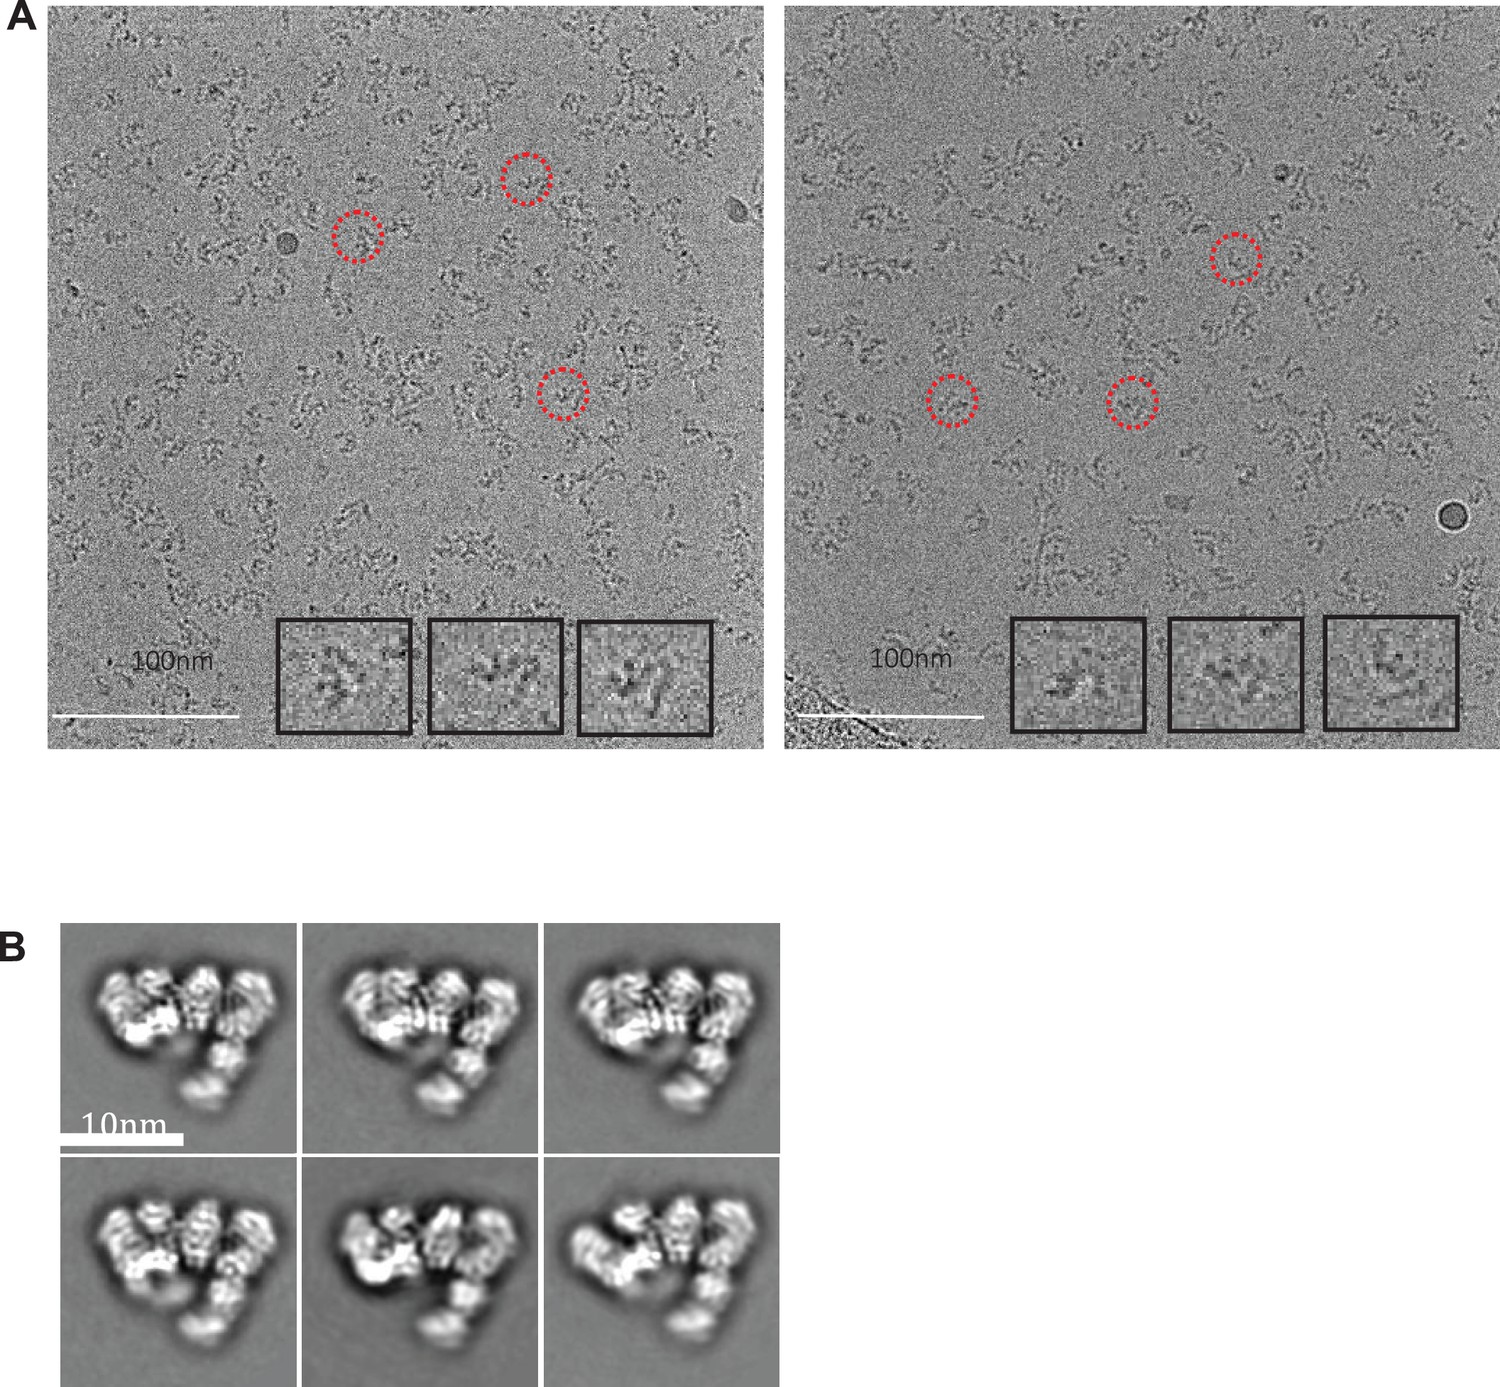
Cryo-electron micrographs and 2D class averages of untilted Apo IDE-FabH11-E.
(A) Untilted apo IDE-FabH11-E images with 2.56 μm (left micrograph) and 3.05 μm (right micrograph) defocus. (B) 2D class averages of Apo IDE-FabH11-E particles from untilted micrographs using Relion2.1 and the option to ignore the CTFs until the first peak.
Figure 2—figure supplement 7
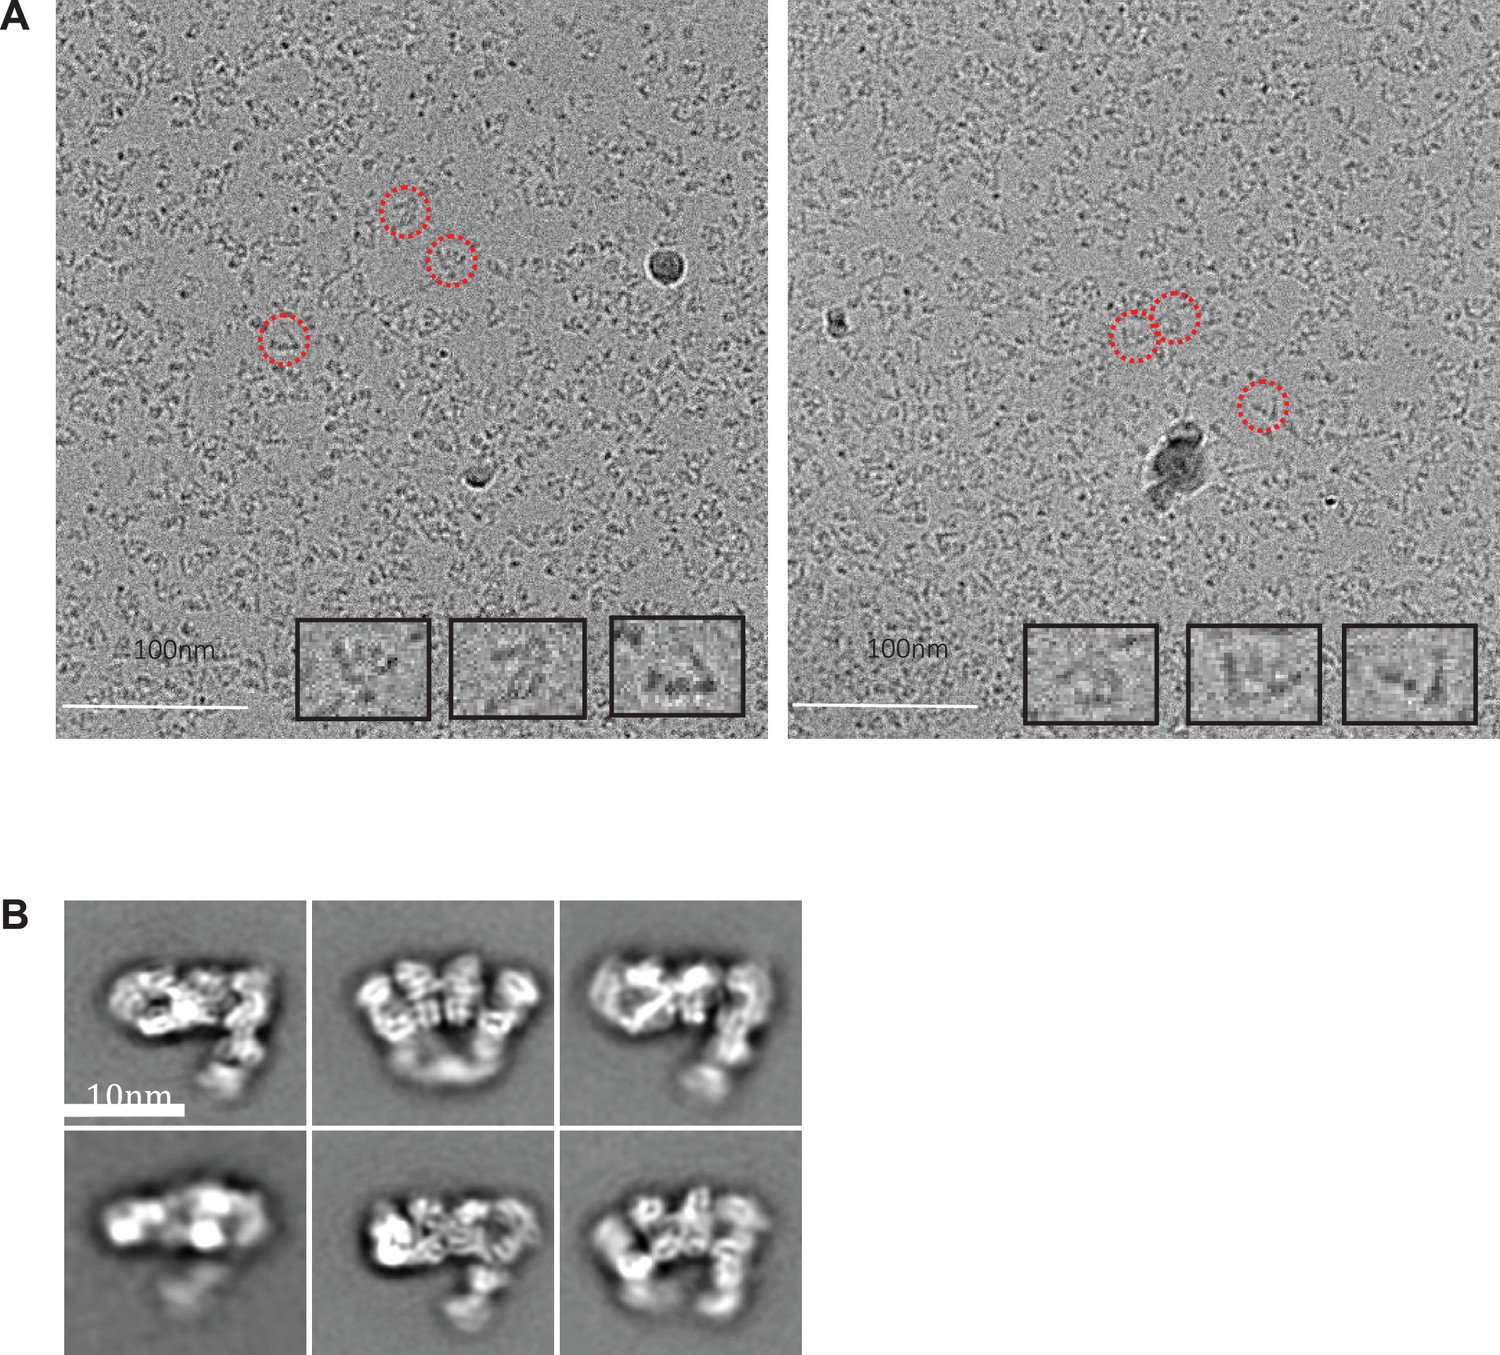
Cryo-electron micrographs and 2D class averages of tilted Apo IDE-FabH11-E.
(A) Tilted apo IDE-FabH11-E images with 3.51 μm (left micrograph) and 3.54 μm (right micrograph) defocus. (B) 2D class averages of Apo IDE-FabH11-E particles from 30 degree tilted micrographs using Relion2.1 and the option to ignore the CTFs until the first peak.
Figure 2—figure supplement 8
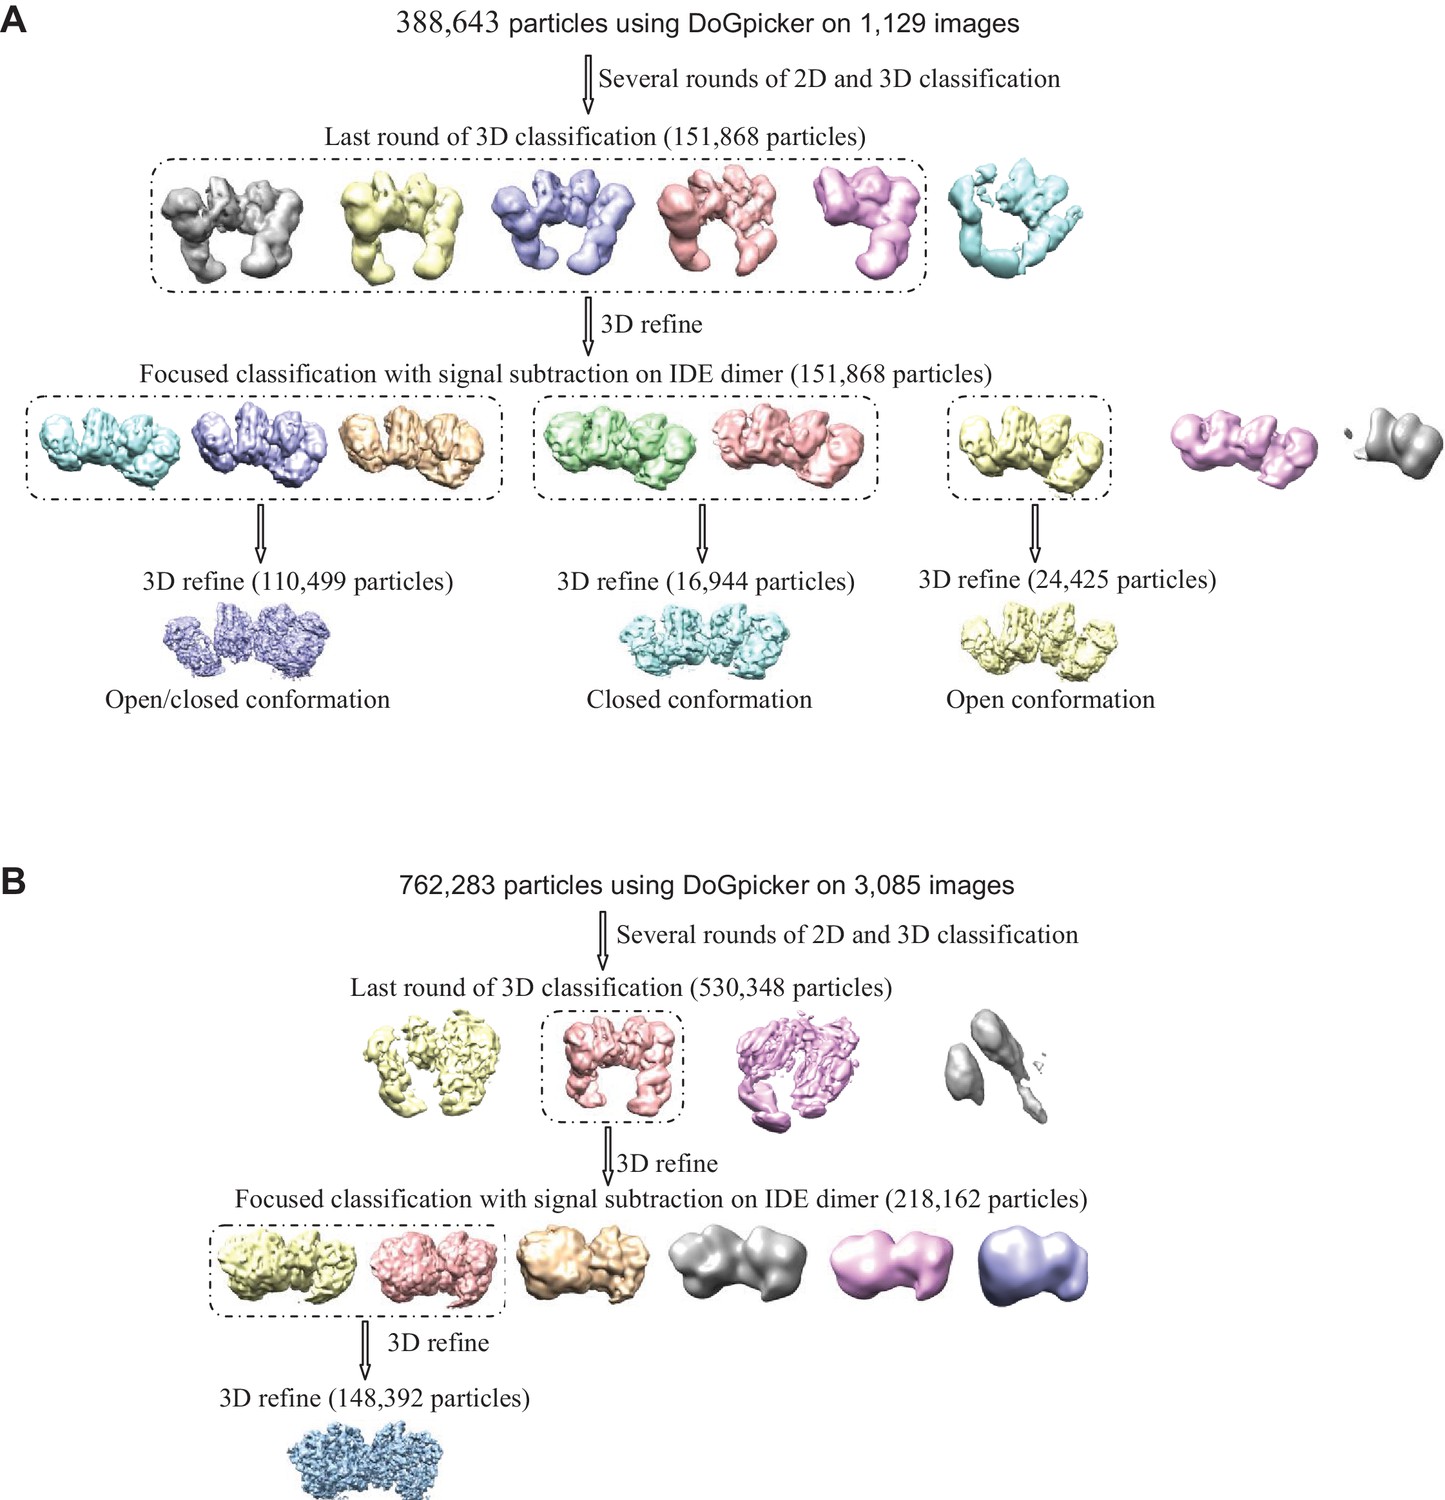
Flow chart of cryoEM data processing.
The particle numbers for the final 3D classification, focused classification with signal subtraction and final refinement are indicated. (A) Apo IDE-FabH11-E. Particles from both tilted and untilted micrographs were automatically picked using DoGpicker followed by several rounds of 2D and 3D classification using RELION2.1. Bad 2D class averages were discarded. The particles were then selected for 3D refinement followed by focused classification with signal subtraction on the IDE dimer. The classes particles having the same conformation were grouped (dashed line) into three different subsets. Each subset of particles was refined independently. (B) Insulin-bound IDE-FabH11-E. Particles were automatically picked using DoGpicker followed by several rounds of 2D and 3D classification using RELION2.1. The particles were then selected for 3D refinement followed by focused classification with signal subtraction on IDE dimer. The classes particles having the same conformation were grouped together (dashed line) and refined.
Figure 2—figure supplement 9

CryoEM statistics of apo IDE-FabH11-E and insulin-bound IDE-FabH11-E.
(A) Final refined map colored according to local resolution generated from ResMap. (B) Angular distribution plots generated from RELION2.1. (C) FSC plot and resolution estimation using the gold-standard 0.143 criterion generated from RELION2.1. (D) 3DFSC plots. The global half-map FSC (solid red line) and the spread of directional resolution values defined by ±1σ from the mean (green area encompassed by dotted green lines, left axis) and a histogram of directional FSC sampled over the 3D FSC (blue bars, right axis).
Figure 2—figure supplement 10
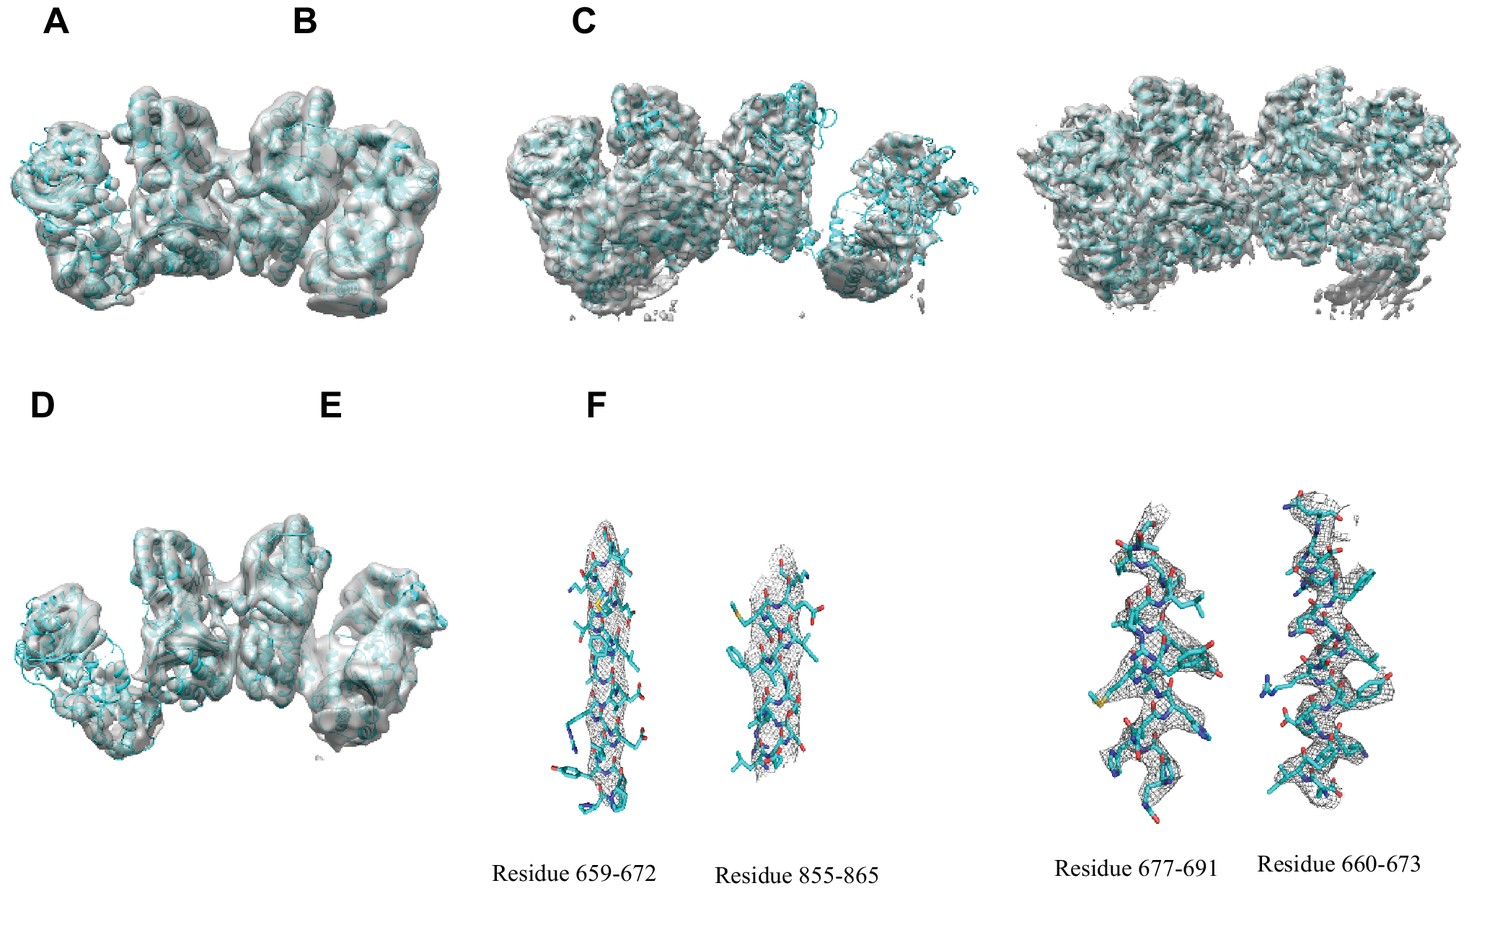
Overall fit of cryoEM density map to the structure models.
(A) Overall density maps of apo IDE in closed conformation with built structure model. (B) Overall density maps of apo IDE in open conformation with built structure model. (C) Overall density maps of apo IDE in open/closed conformation with built structure models. (D) Overall density maps of insulin-bound IDE with built structure model. (E) Representative density with built models of twoα-helixes from apo IDE in O/pO conformation (residue 659–672 and residue 855–875). (F) Representative density with built models of two α-helixes from insulin-bound IDE (residue 660–673, and residue 677–691).
Figure 3 with 1 supplement
CryoEM IDE dimer.
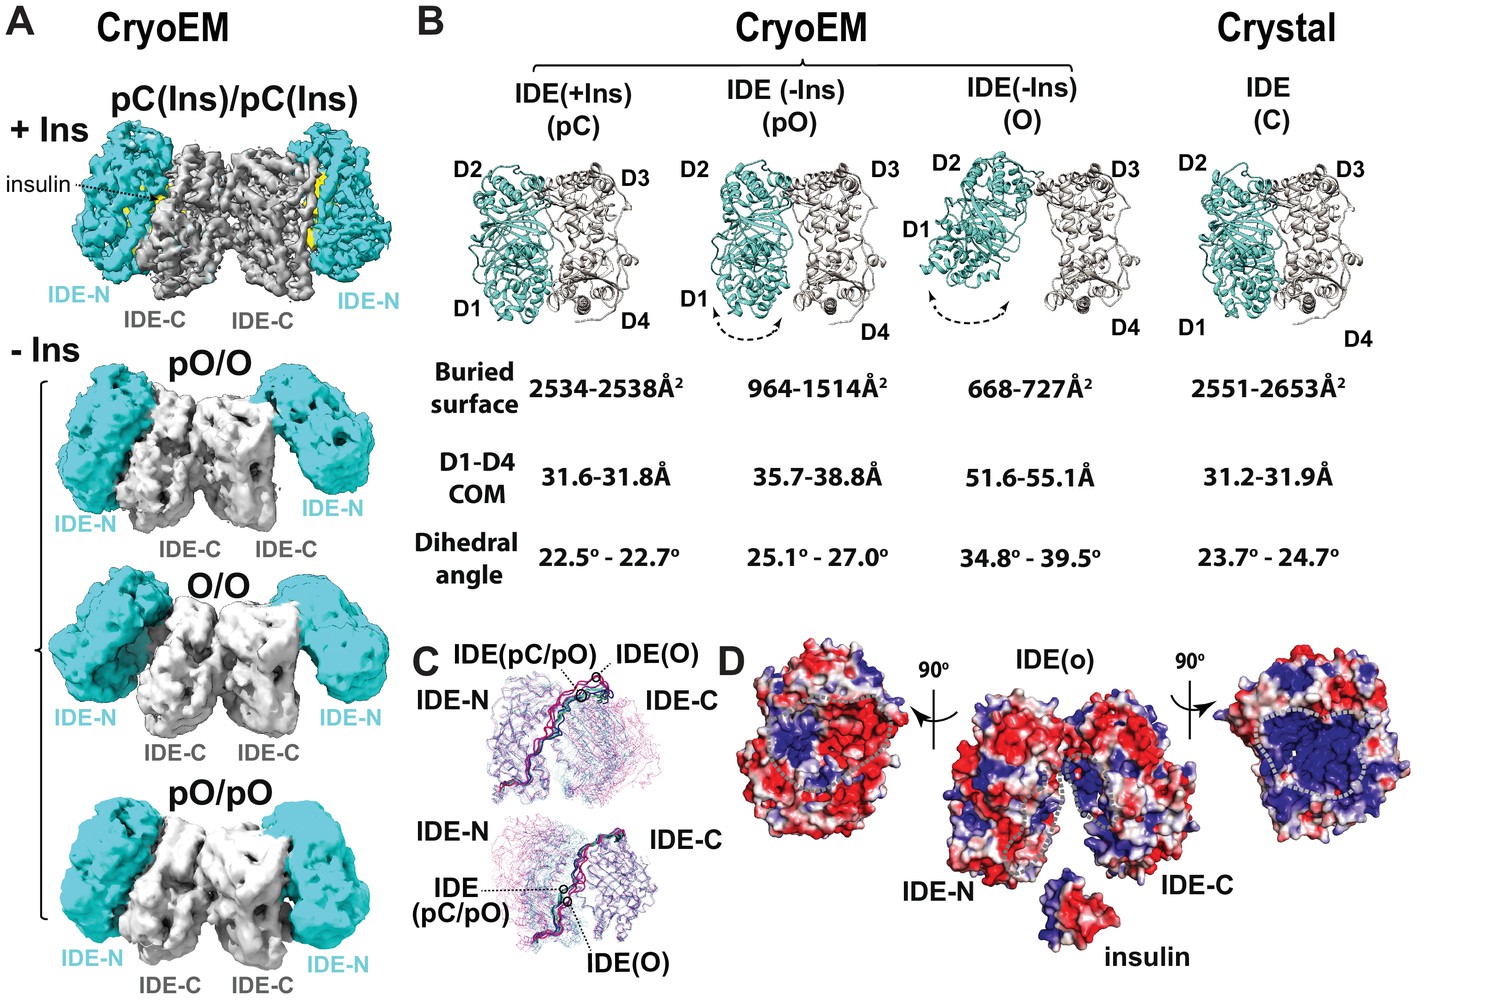
(A) Overall structures of IDE dimer in the presence and absence of insulin. Models are shown as ribbons within the electron density map. O, open state; pO, partially open state; pC, partially-closed state. IDE-N and IDE-C are colored in cyan and grey, respectively; insulin inside the catalytic chamber of IDE is colored in yellow. For simplicity, Fab is not shown. (B) Comparison of four distinct conformational states within IDE structures; two pC states in the insulin-bound cryoEM IDE structure, three pO and three O states in apo-IDE cryoEM structures, and a closed structure from previous crystallographic work (Guo et al., 2010; Malito et al., 2008b2008; Manolopoulou et al., 2009; Noinaj et al., 2011; Ren et al., 2010; Shen et al., 2006). The buried surface between IDE-N and IDE-C, distance between the center of mass (COM) of IDE D1 and D4 domains, and dihedral angles (absolute values) between COM of IDE D1-D2 and COM of D3-D4 are shown below the ribbon presentation of IDE structures. (C) Structural comparison of IDE states aligned by IDE-N (top) or IDE-C (bottom), showing rigid body motion of IDE-N and IDE-C guided by the loop connecting IDE-N and IDE-C. (D) Structural basis of IDE open structure primed to capture insulin by size and charge complementarity. The boundaries for the substrate-binding catalytic chambers of IDE-N and IDE-C are marked by a dashed line. The color scale is set from −3 kT/e (red) to 3 kT/e (blue) calculated using APBS 2.1.
Figure 3—figure supplement 1
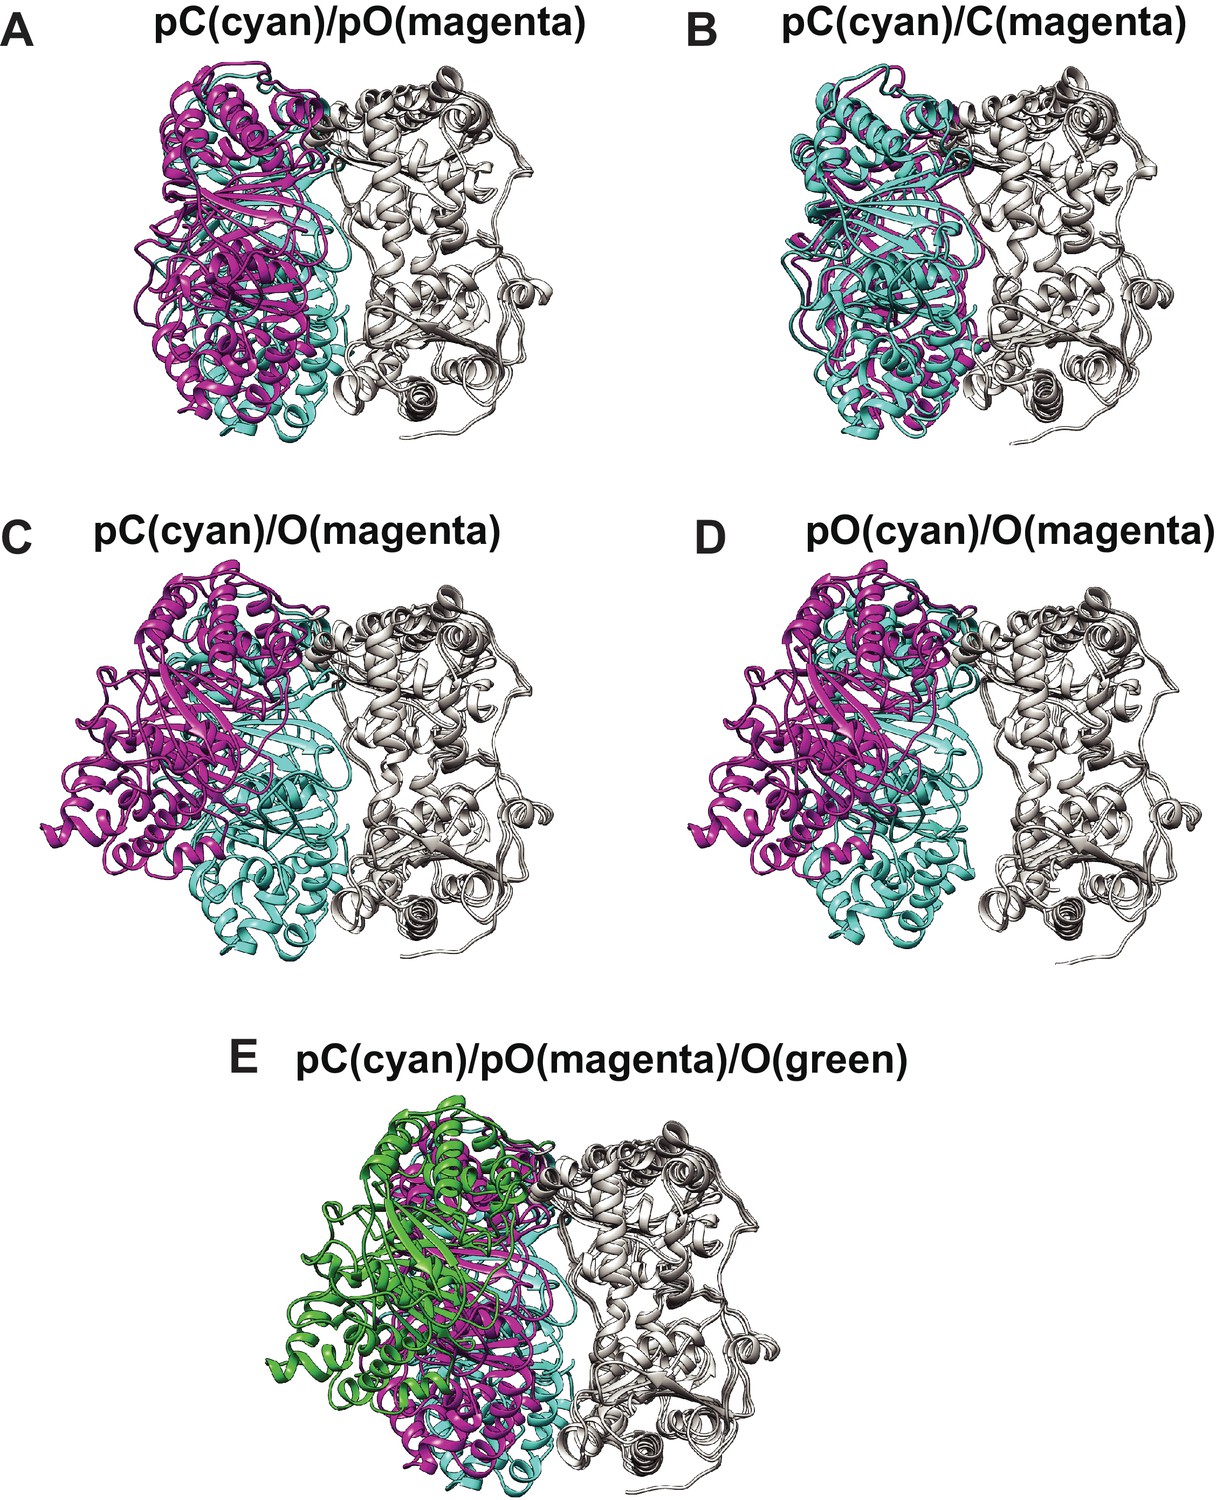
Comparison of four distinct conformers of IDE, Open (O), partially open (pO), partially closed (pC), and closed (C).
(A) The comparison of pC (cyan) with pO (magenta), (B) pC (cyan) with C (magenta), (C) pC (cyan) with O (magenta), (D) pO (purple) with O (magenta), and (E) pC (cyan), pO (magenta), and O (green). IDE is aligned by their IDE-C domain.
Figure 4 with 1 supplement
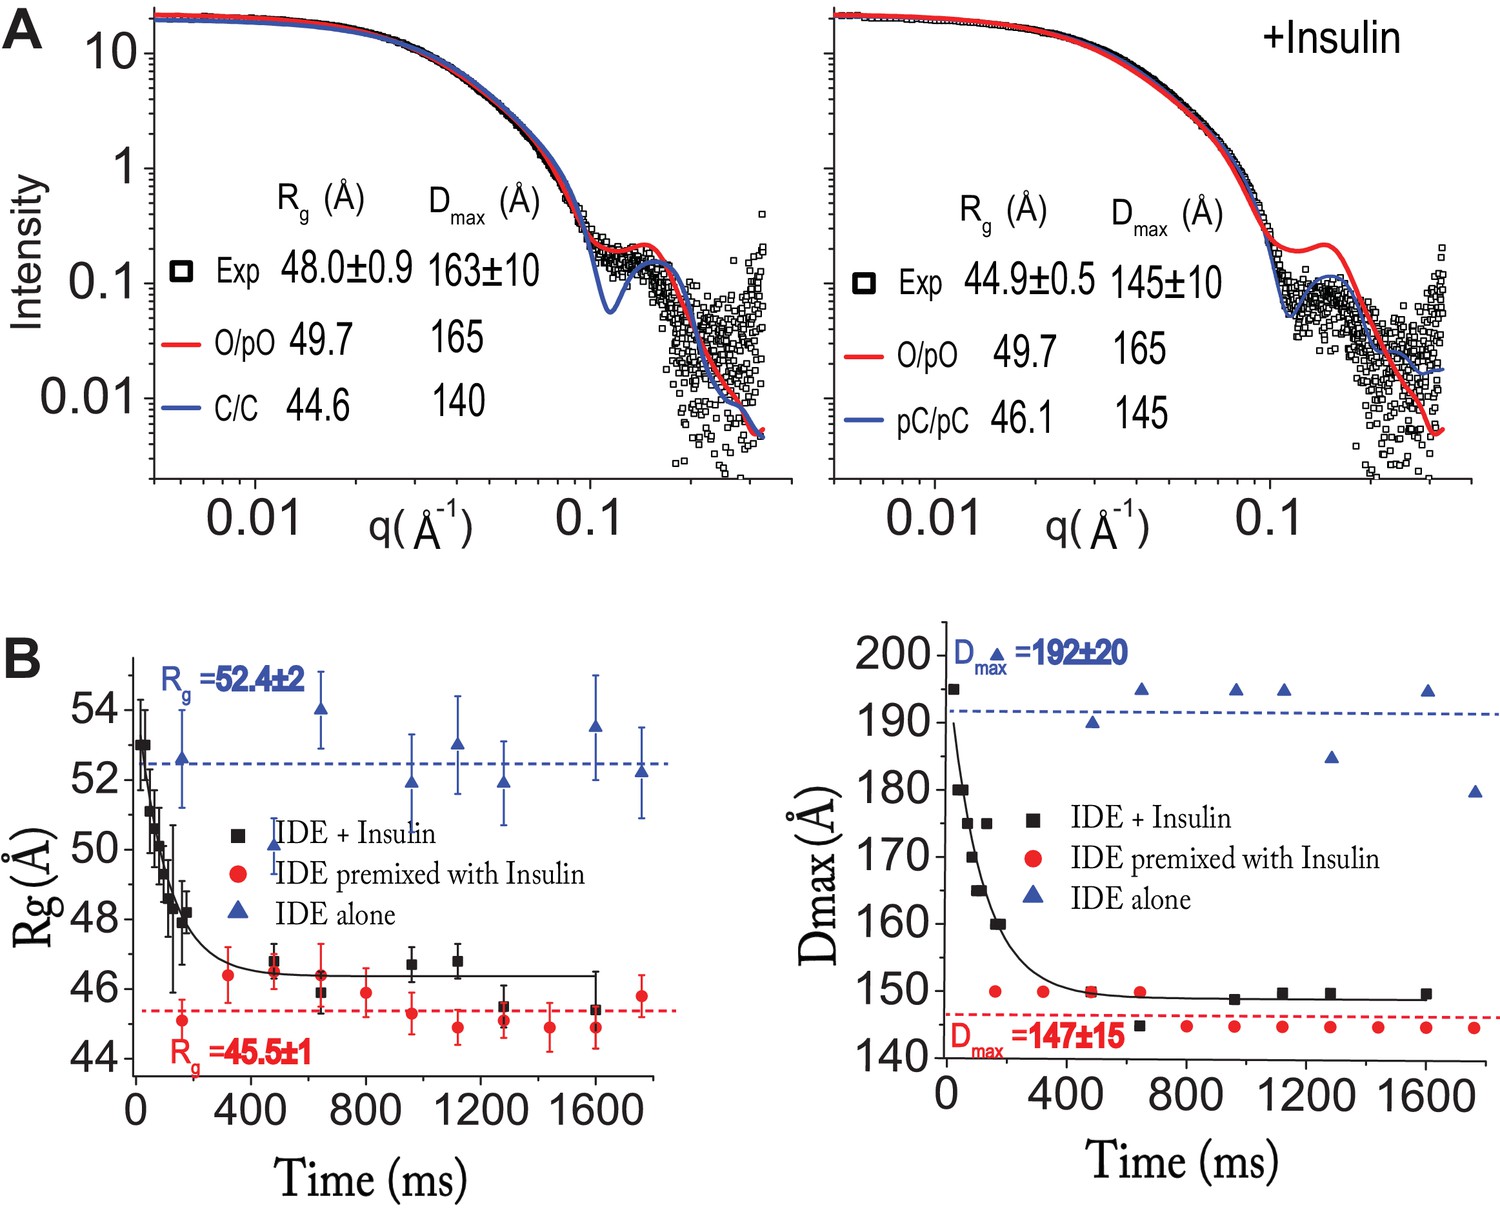
Insulin-induced conformational changes of IDE revealed by SAXS.
(A) Scattering curves from SEC-SAXS analysis using 2–3 mg IDE in the presence (left) or absence (right) of fourfold molar excess of insulin. Solid red and blue lines represent the predicted SAXS curves based on indicated IDE structures. (B) Time-resolved SAXS analysis of IDE-insulin interaction. Rapid mixing of IDE with insulin resulted in time-dependent reduction of Rg with τ = 0.1 s.
Figure 4—figure supplement 1
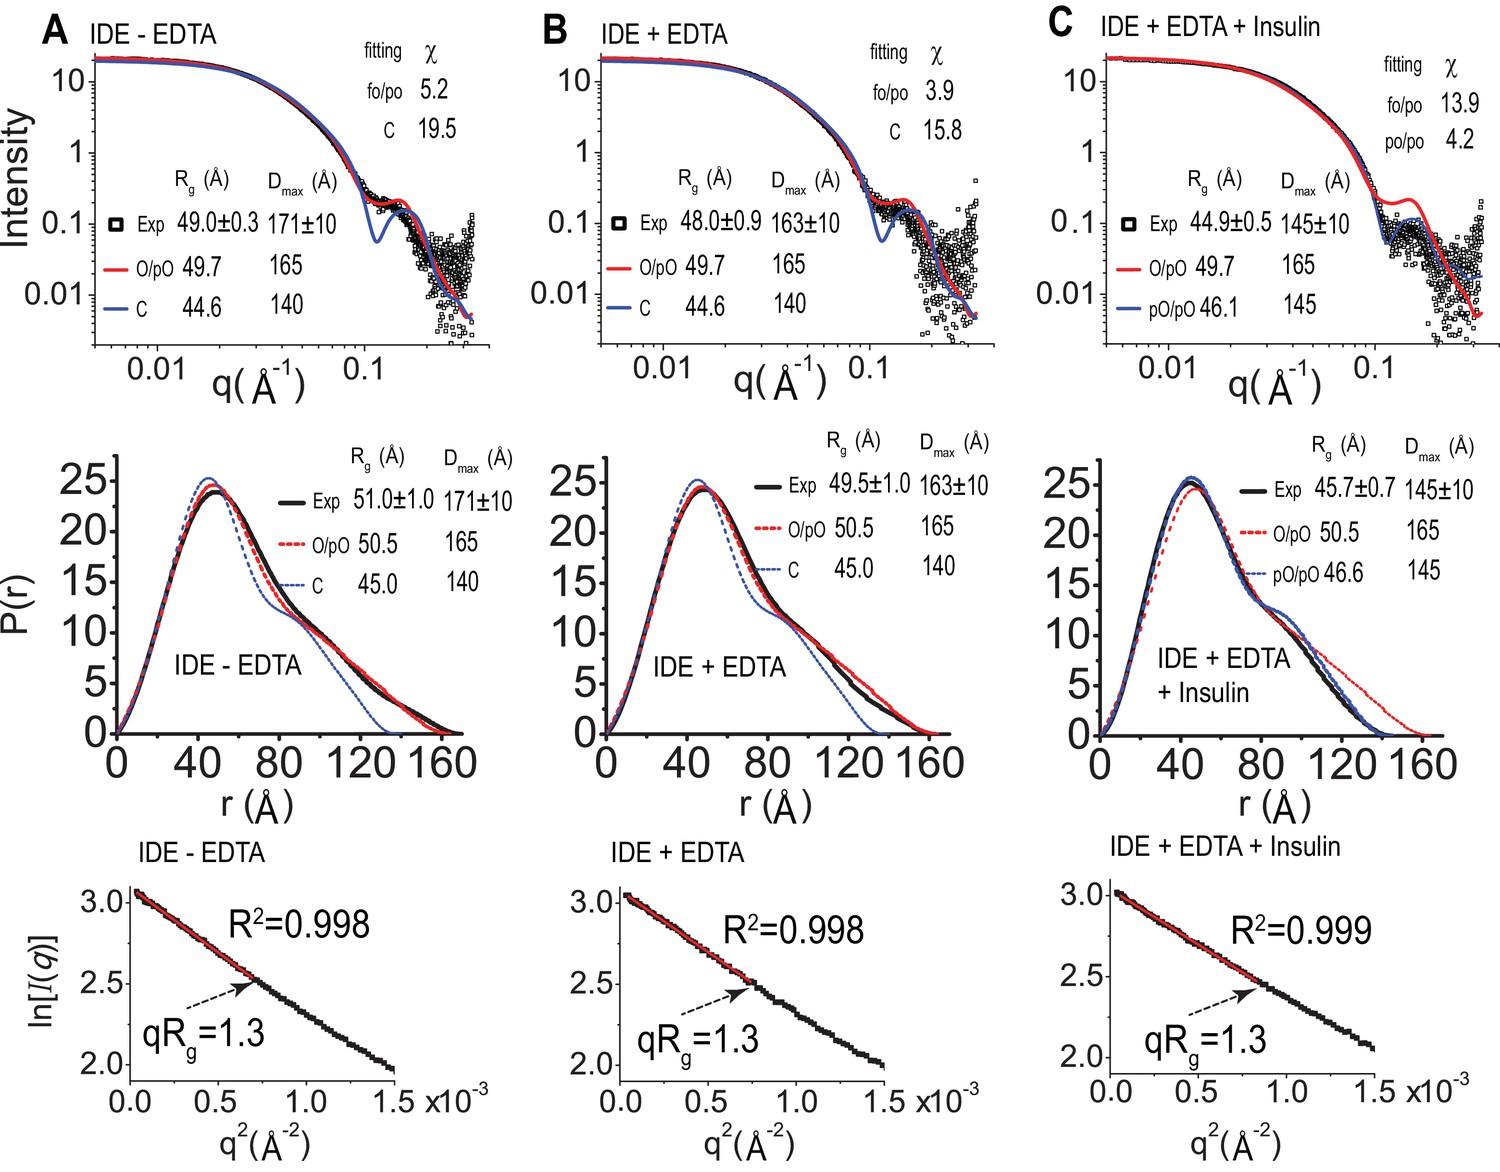
SAXS analysis of IDE.
IDE SAXS scattering profile (top), P(r) function distribution (middle), and Guinier plot (bottom) of IDE without EDTA (A), IDE with EDTA (B), and IDE with EDTA and insulin (C). The solution scattering of models is calculated and fitted to experiment data by CRYSOL. The P(r) distribution, the real space Rg, and Dmax, were calculated by GNOM. O/pO stands for cryoEM open/partial open state of IDE. C stands for IDE closed state from crystal structure, and pC/pC stands for cryoEM partial-closed/partial-closed state of IDE that is solved in the presence of insulin.
Figure 5 with 6 supplements
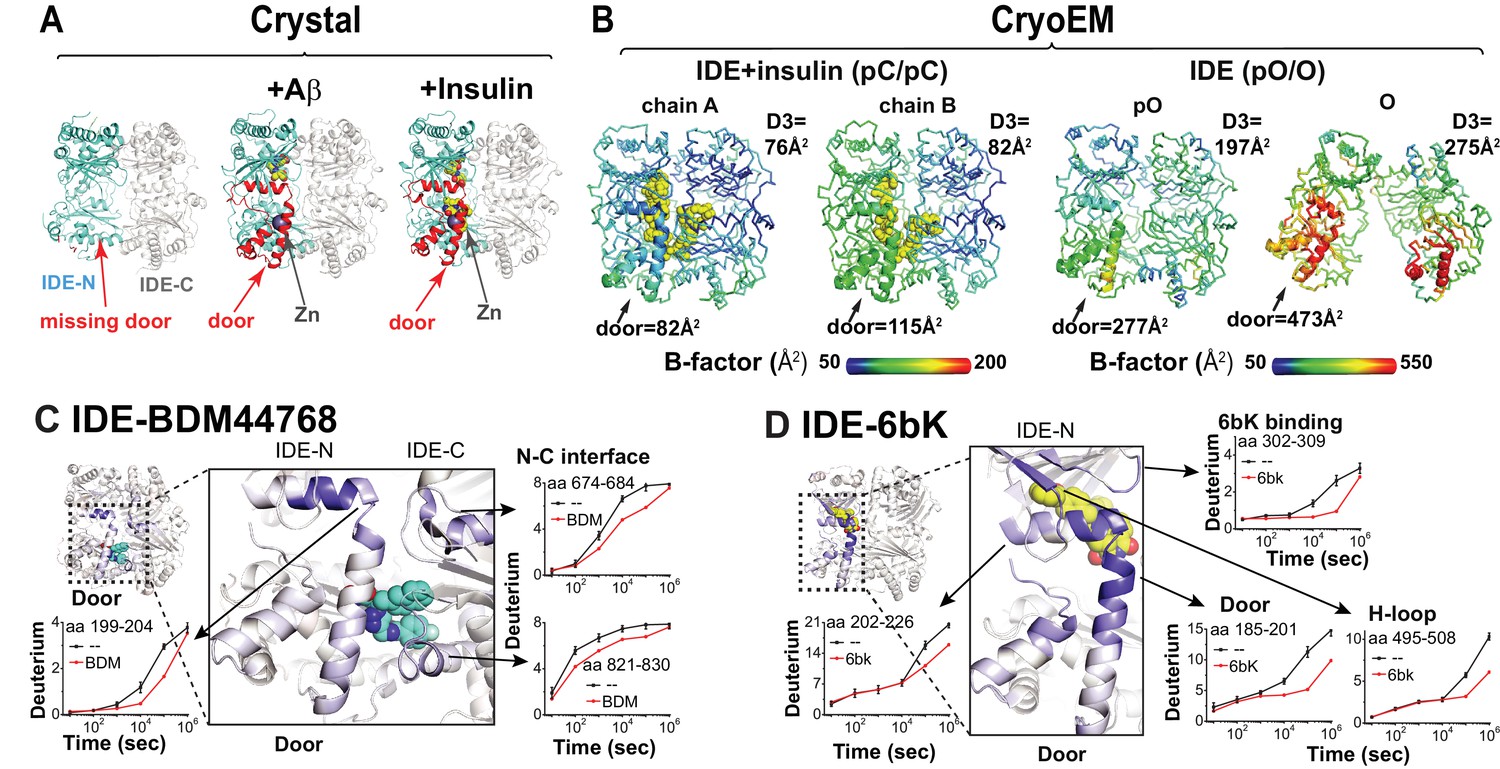
Conformational dynamics of IDE door domain.
(A) Comparison of crystal structures of Fab1-bound IDE alone (PDB code: 4IDF), Fab1- and Aβ-bound IDE (PDB code: 4MIC) and Fab1- and insulin-bound IDE (PDB code: 5WOB). For simplicity, only the subunit of the dimeric IDE that has the profound change in IDE door subdomain is shown and Fab1 is not shown. (B) Thermal B factors of two IDE subunits within cryoEM IDE dimer structures of insulin-bound pC/pC state IDE (PDB code: 6B3Q) and pO/O apo-state IDE (PDB code: 6BF8). Averaged B factors of IDE door and D3 are shown for comparison. For simplicity, FabH11-E is not shown. (C, D) Changes in H/D exchange of IDE induced by inhibitors, BDM44768 and 6bK. The changes in H/D are mapped and the progress curve of regions with significant changes are shown.
Figure 5—figure supplement 1
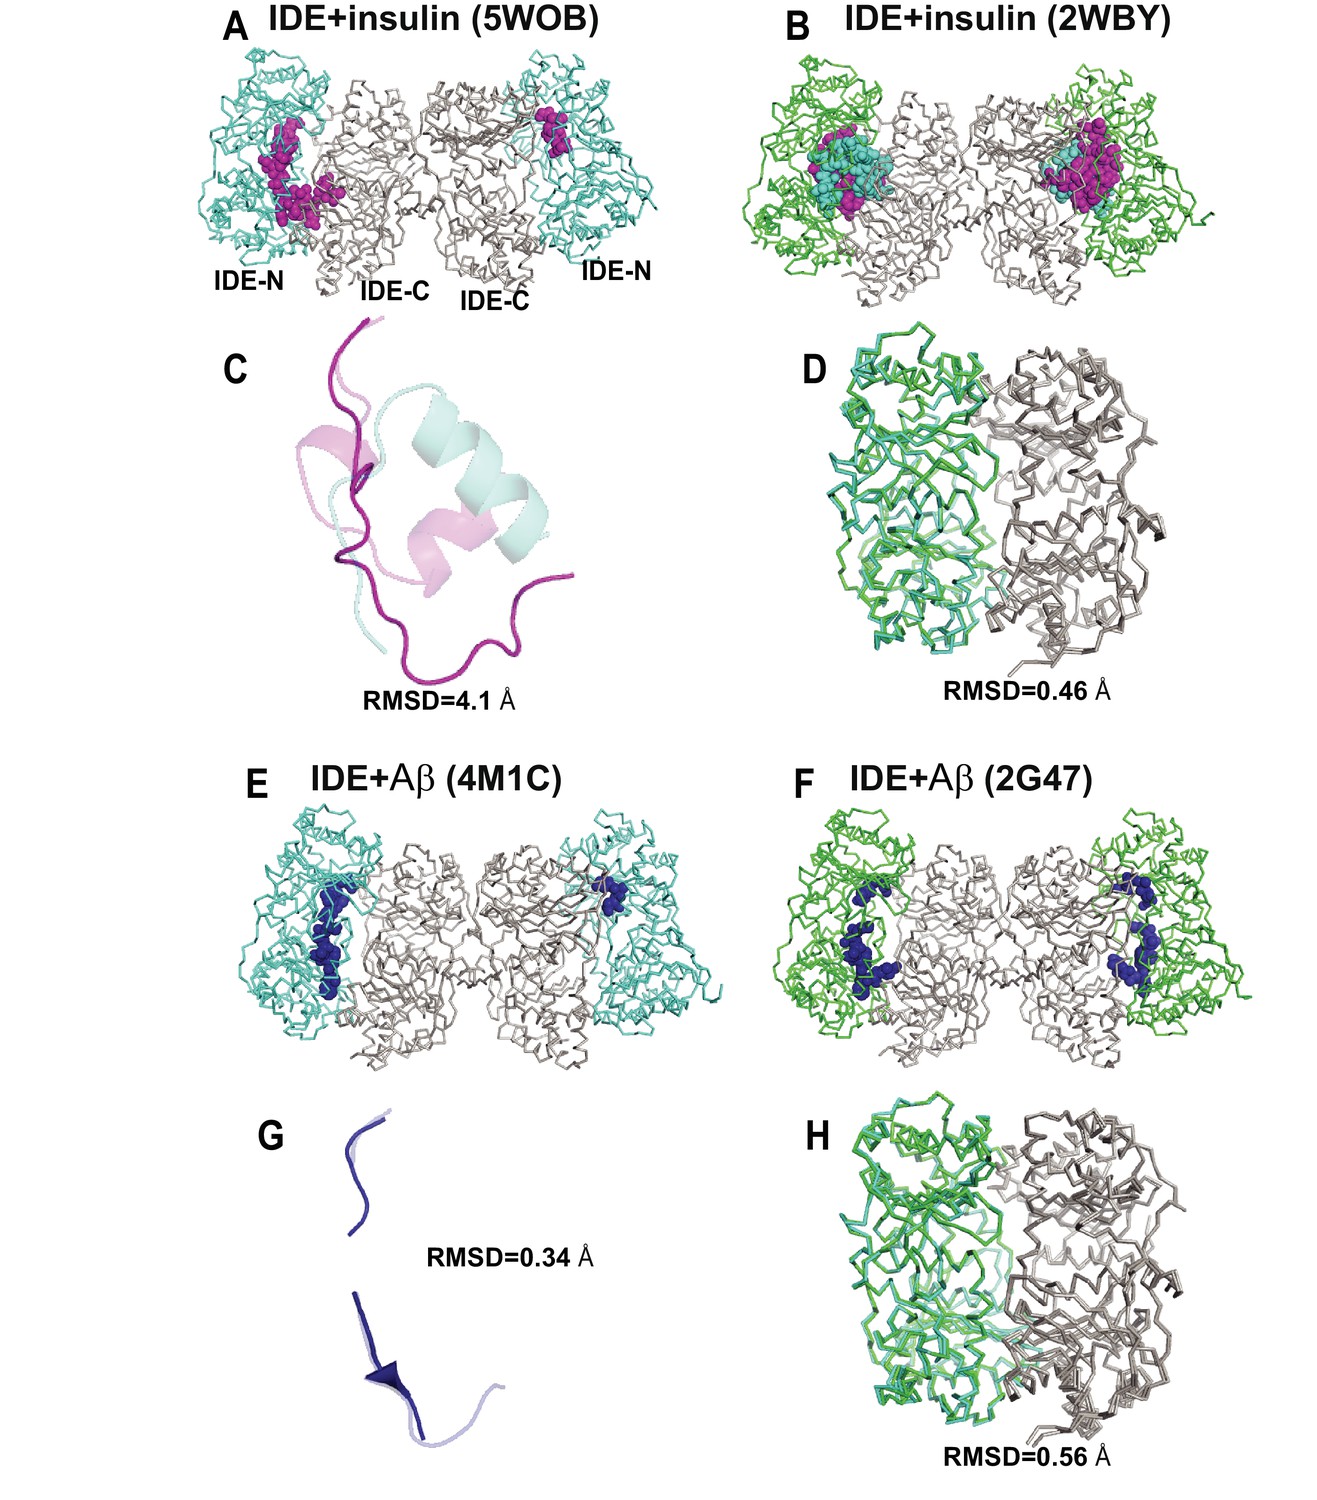
Comparison of crystal structures of insulin- or Aβ-bound IDE.
(A) Crystal structure of insulin- and Fab1-bound IDE (PDB code: 5WOB). Fab is not shown for clarity. (B) Insulin-bound IDE (PDB code: 2WBY). Alignment of the insulin (C) and IDE (D) from 5WOB and 2WBY. (E) Crystal structure of Aβ- and Fab1-bound IDE (PDB code: 4M1C). Fab is not shown for clarity. (F) Aβ-bound IDE (PDB code: 2G47). Alignment of Aβ(G) and IDE (H) from 4M1C and 2G47. IDE-C is colored in grey; IDE-N in Fab1- and substrate-bound IDE is colored in cyan; IDE-N in substrate-bound IDE is colored in green. Insulin A and B chains are colored in magenta and cyan, respectively. Aβ is colored in blue. The RMSD is calculated by PYMOL.
Figure 5—figure supplement 2
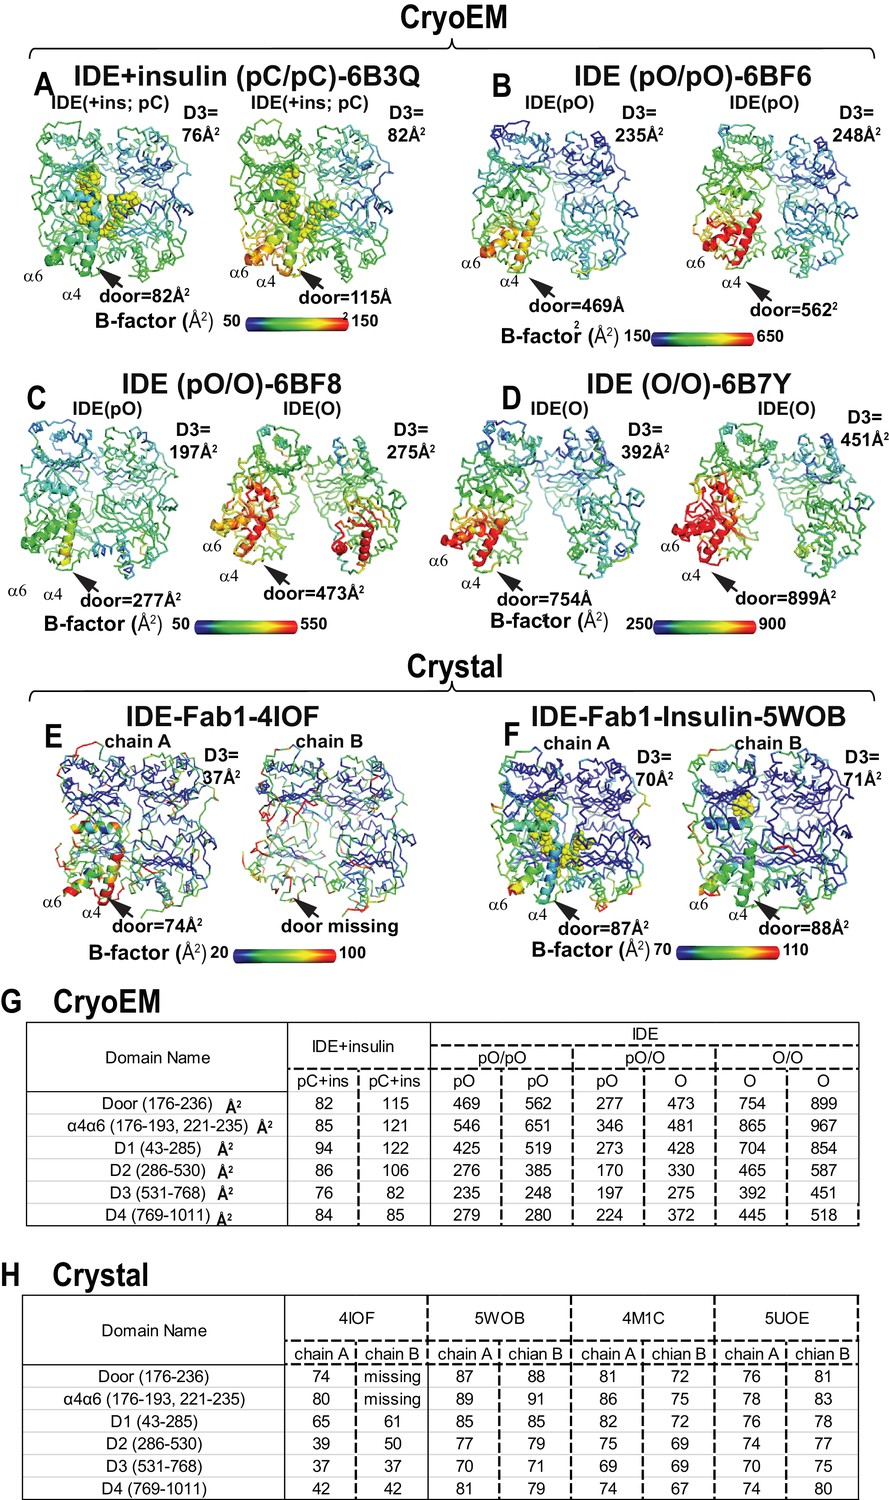
Comparison of thermal B factor distribution of four cryoEM IDE structures, and two crystal structures.
Thermal B factor distribution of cryoEM structures of FabH11-E- and insulin-bound IDE pC/pC (A), or apo IDE pO/pO (B), pO/O (C), and O/O (D) and that of crystal structures of Fab1-bound IDE in the absence (E) and presence of insulin (F). Averaged B factors of IDE door subdomain and D3 domain are shown for comparison in A-D. Only one dimer is shown in insulin- and Fab1-bound IDE structure as four IDE dimers in the asymmetric unit and are similar. Summary of average thermal B factors of various IDE domains for cryoEM structures (G) and crystal structures (H).
Figure 5—figure supplement 3
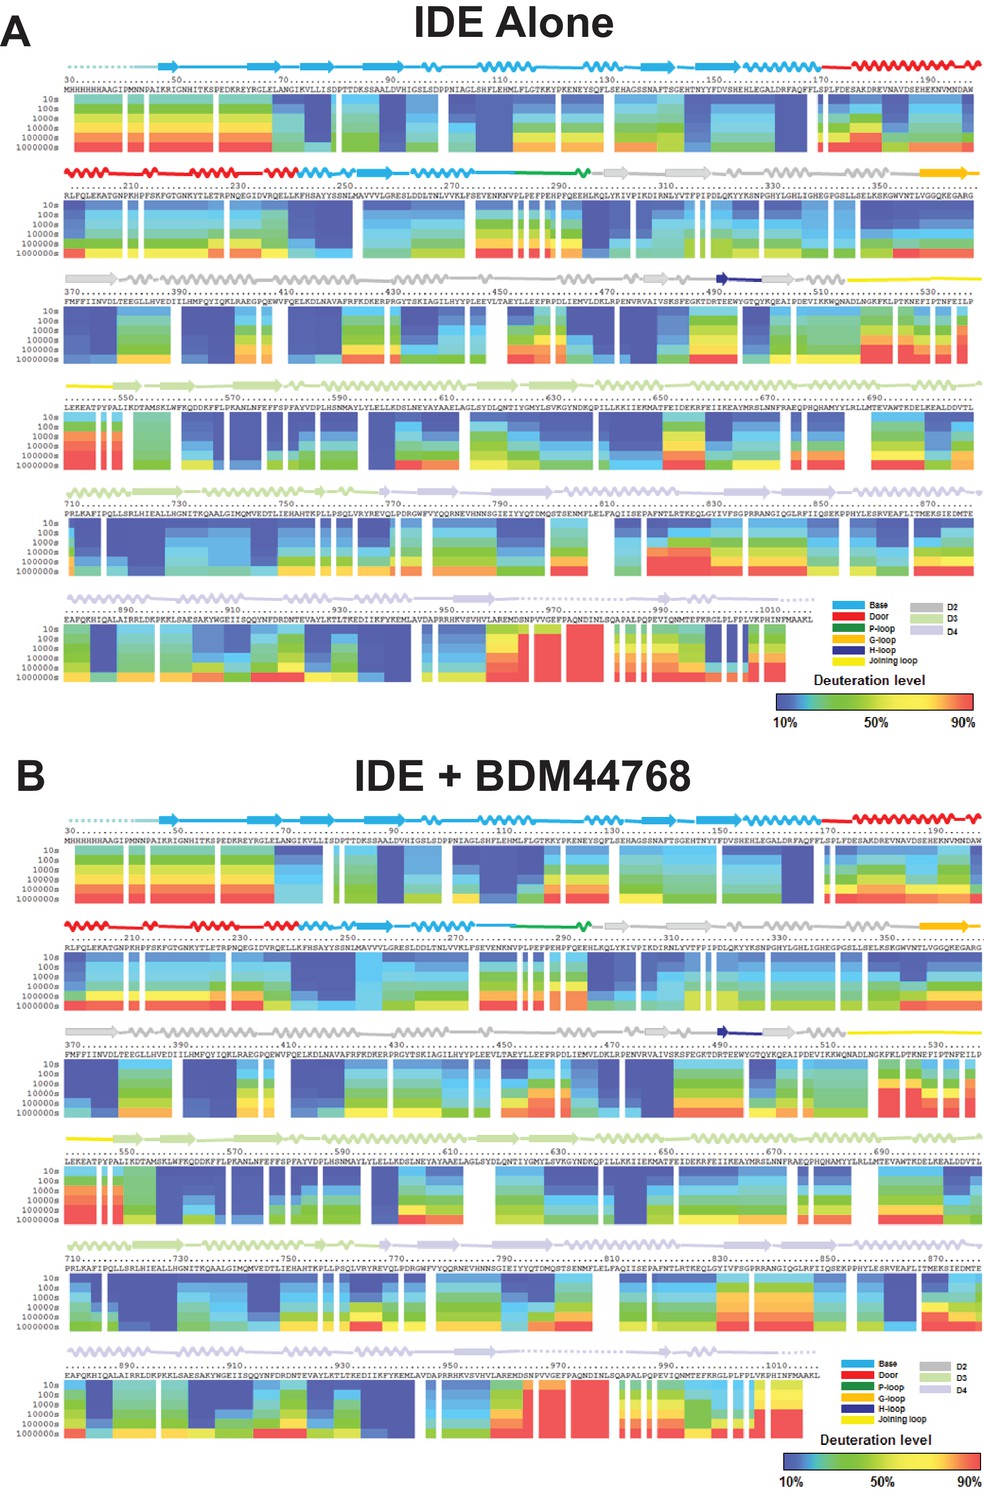
Amide hydrogen-deuterium exchange profiles of IDE alone (A) and IDE in the presence of BDM44768 (B).
The percentages of deuteration levels of each peptide fragment at various time points are shown as a heat map color-coded from blue (<10%) to red (>90%), as indicated at the bottom right of the figure. Each block represents a peptide segment analyzed at each of the six time points (from top to bottom: 10, 100, 1000, 10,000, 100,000, and 1000,000 s). Proline residues, and regions with no amide exchange data available are colored in gray. The structure features of IDE are shown above IDE sequences and colored according to their domains/subdomains.
Figure 5—figure supplement 4
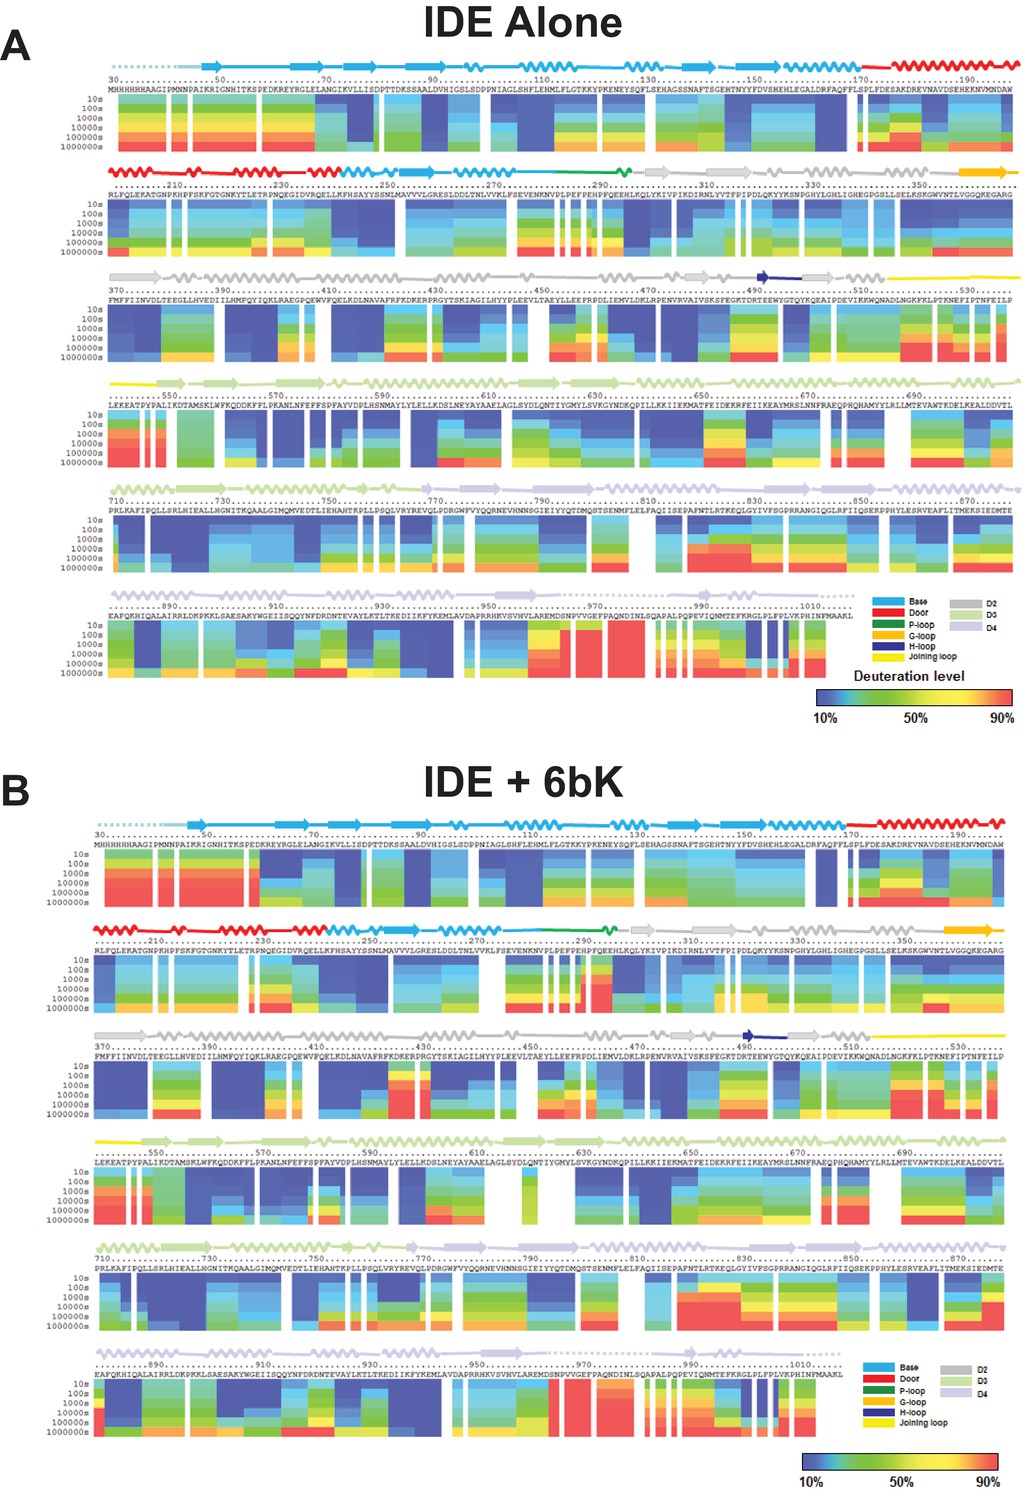
Amide hydrogen-deuterium exchange profiles of IDE alone (A) and IDE in the presence of 6bk (B).
The percentages of deuteration levels of each peptide fragment at various time points are shown as a heat map color-coded from blue (<10%) to red (>90%), as indicated at the bottom right of the figure. Each block represents a peptide segment analyzed at each of the six time points (from top to bottom: 10, 100, 1000, 10,000, 100,000, and 1000,000 s). Proline residues, and regions with no amide exchange data available are colored in gray. The structure features of IDE are shown above IDE sequences and colored according to their domains/subdomains.
Figure 5—figure supplement 5
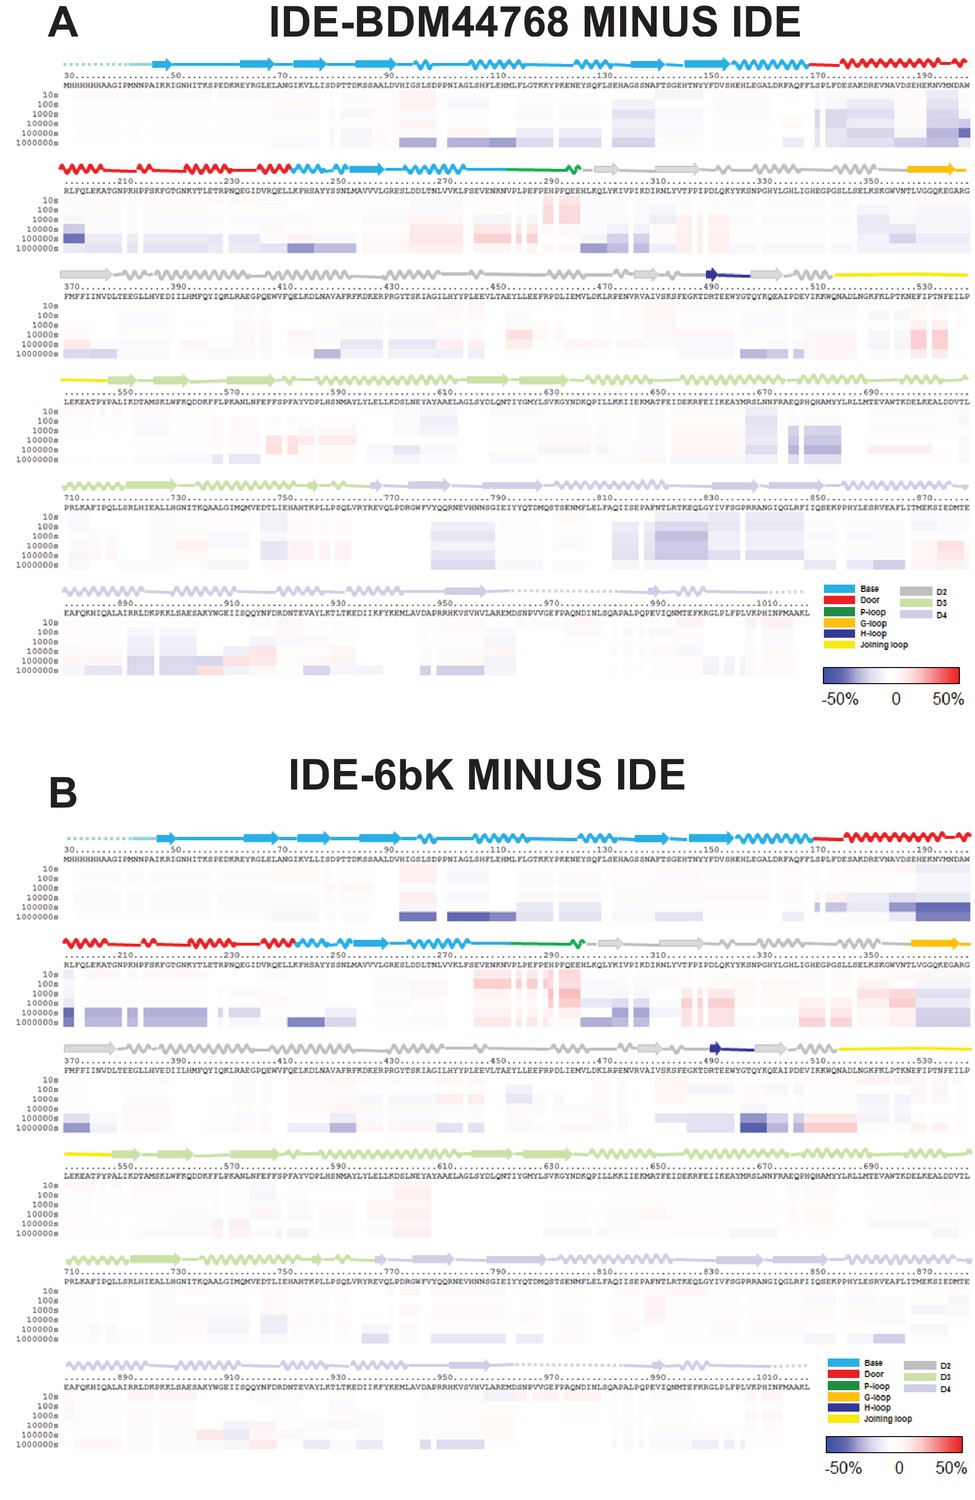
HDX-MS analysis of IDE-small molecule inhibitor interaction.
Differences in deuteration levels in the free and BDM44768-bound (A) or 6bK-bound IDE (B) at various time points (from top to bottom: 10, 100, 1000, 10,000, 100,000, and 1000,000 s) are shown in a color-coded bar ranging from blue (−50%) to red (50%), as indicated at the bottom right of the figure. The structure features of IDE are shown above IDE sequences and colored according to their domains/subdomains.
Figure 5—figure supplement 6
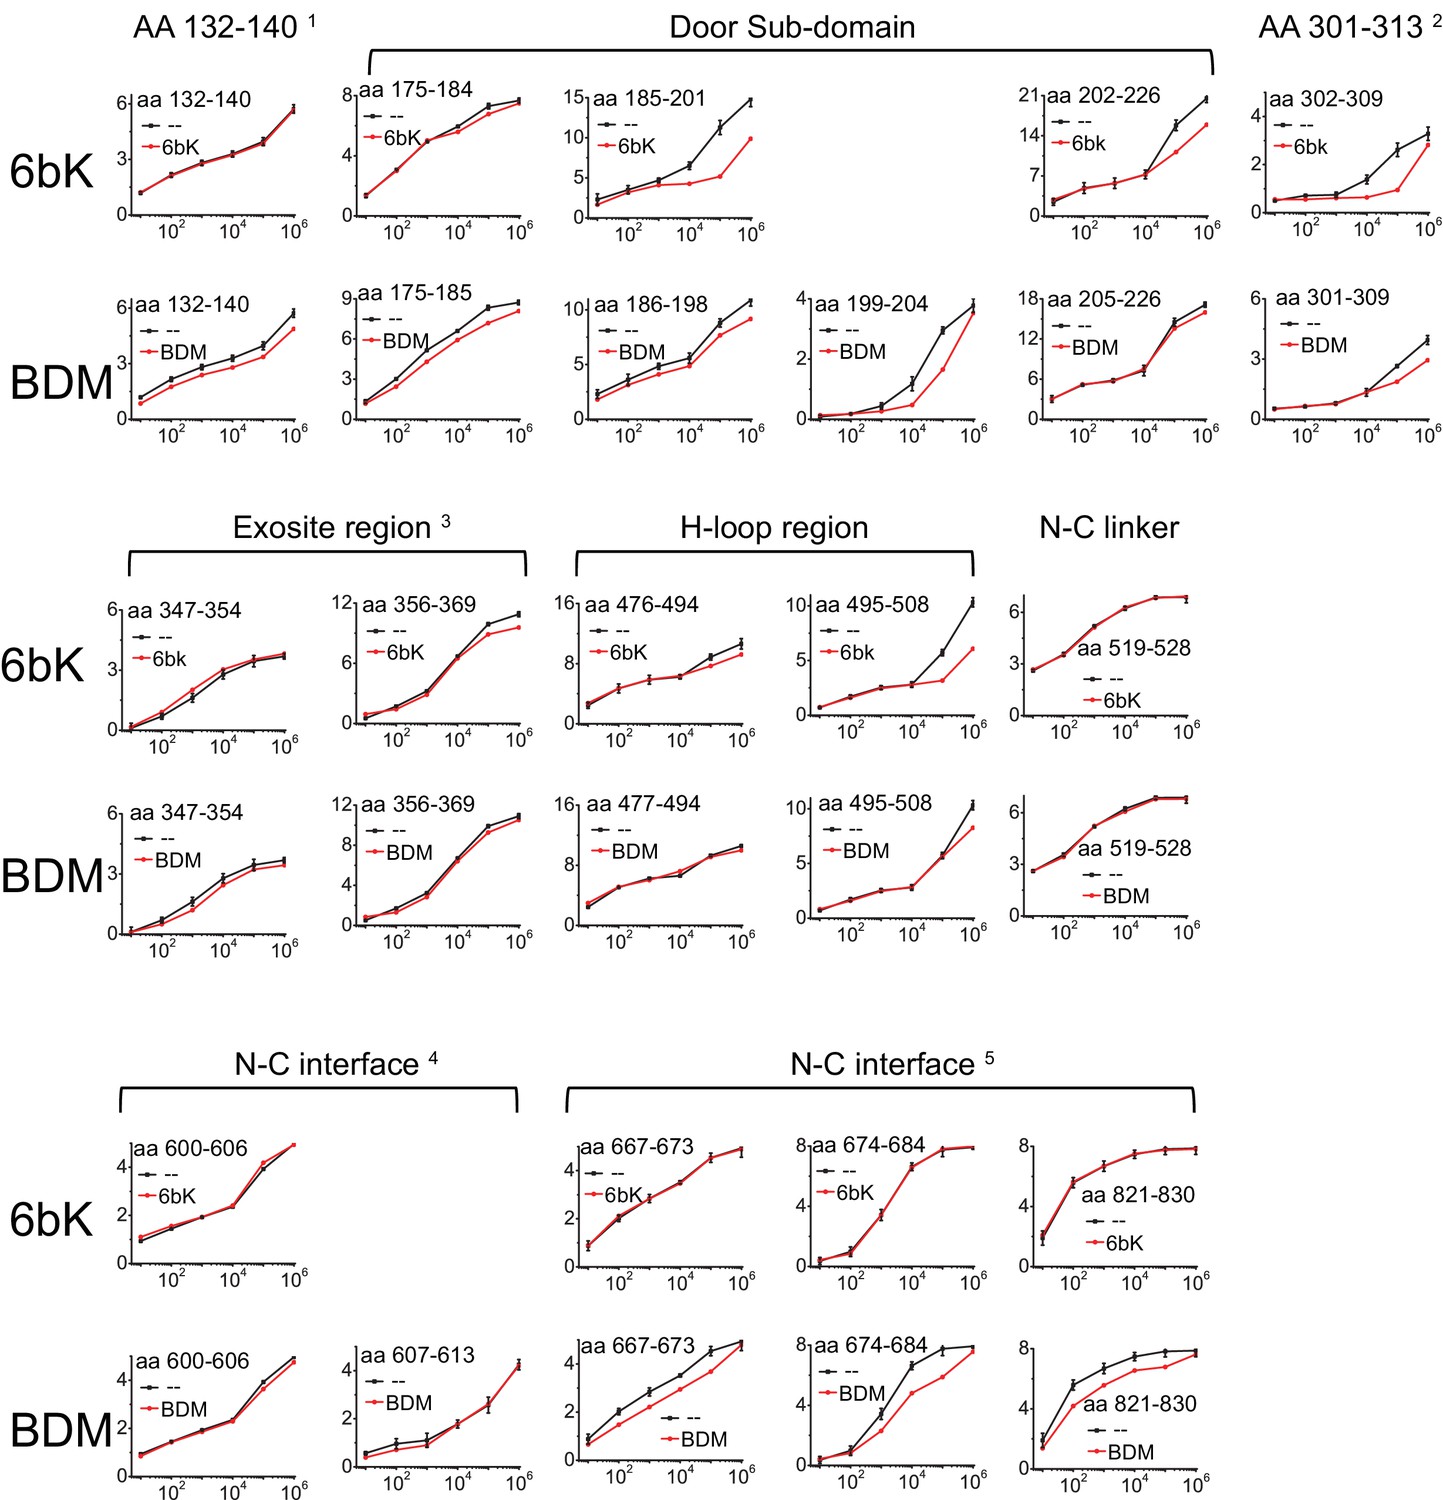
Progression curves that have the significant difference in HDX of IDE when 6bK or BDM-44768 (BDM) were present.
The standard deviation error bar to the WT IDE data is determined by three individual experiments.
Figure 6 with 4 supplements

Substrate-induced changes in H/D exchange of IDE.
(A) Major changes in H/D exchange of IDE induced by insulin. Changes in H/D are mapped onto IDE structure and the progress curve of regions with significant changes are shown. (B) Major changes in H/D exchange of IDE induced by Aβ.
Figure 6—figure supplement 1
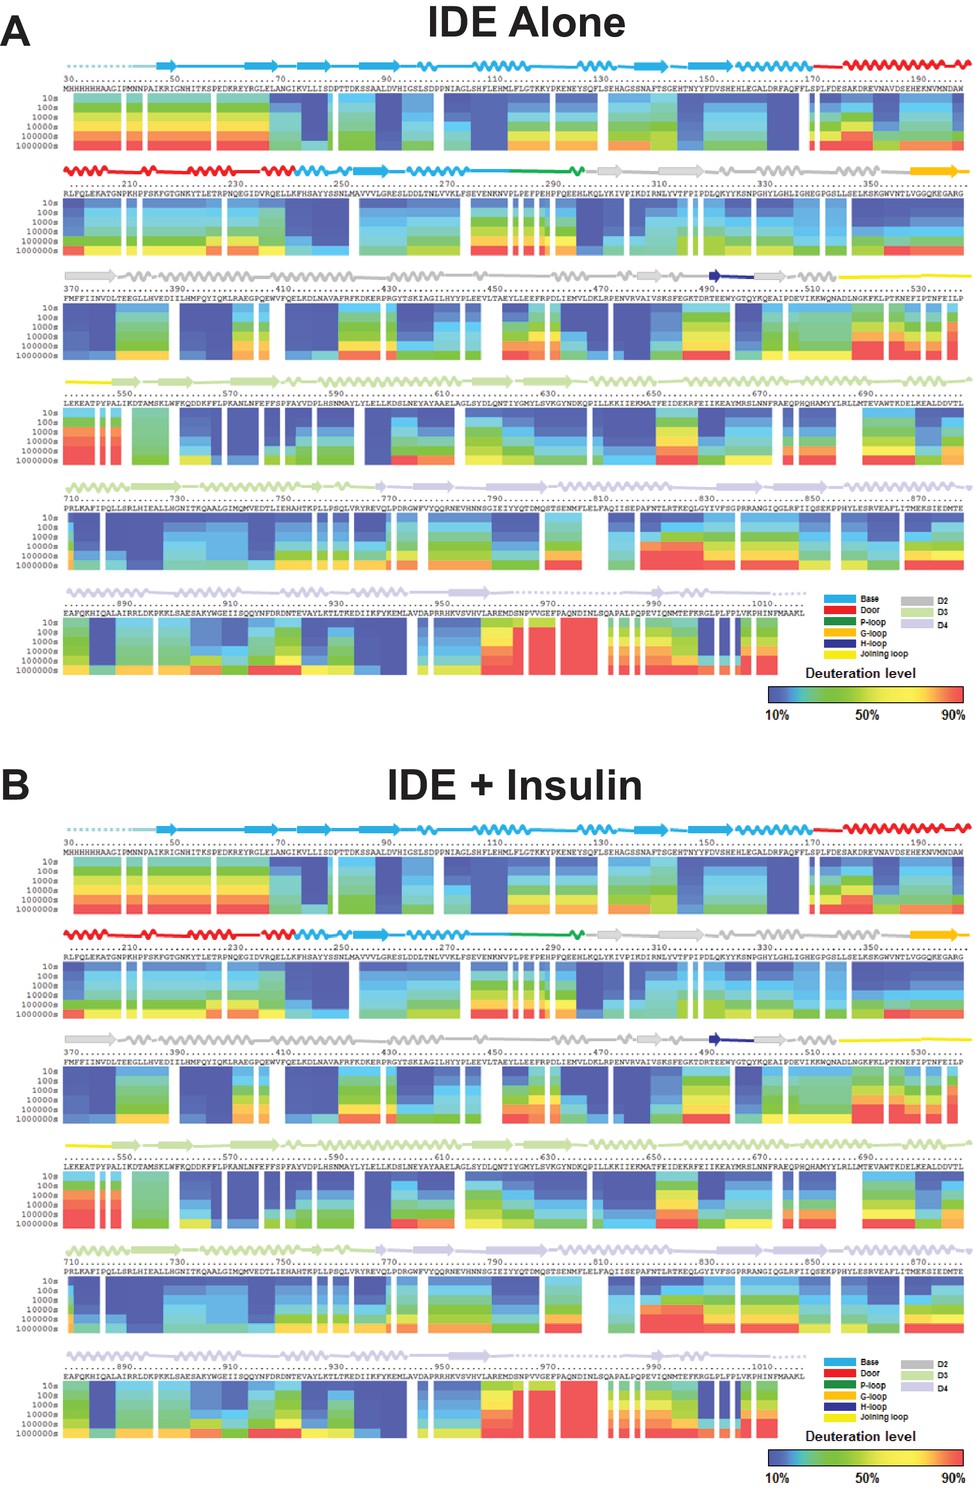
Amide hydrogen-deuterium exchange profiles of IDE alone (A) and IDE in the presence of insulin (B).
The percentages of deuteration levels of each peptide fragment at various time points are shown as a heat map color-coded from blue (<10%) to red (>90%), as indicated at the bottom right of the figure. Each block represents a peptide segment analyzed at each of the six time points (from top to bottom: 10, 100, 1000, 10,000, 100,000, and 1000,000 s). Proline residues, and regions with no amide exchange data available are colored in gray. The structure features of IDE are shown above IDE sequences and colored according to their domains/subdomains.
Figure 6—figure supplement 2
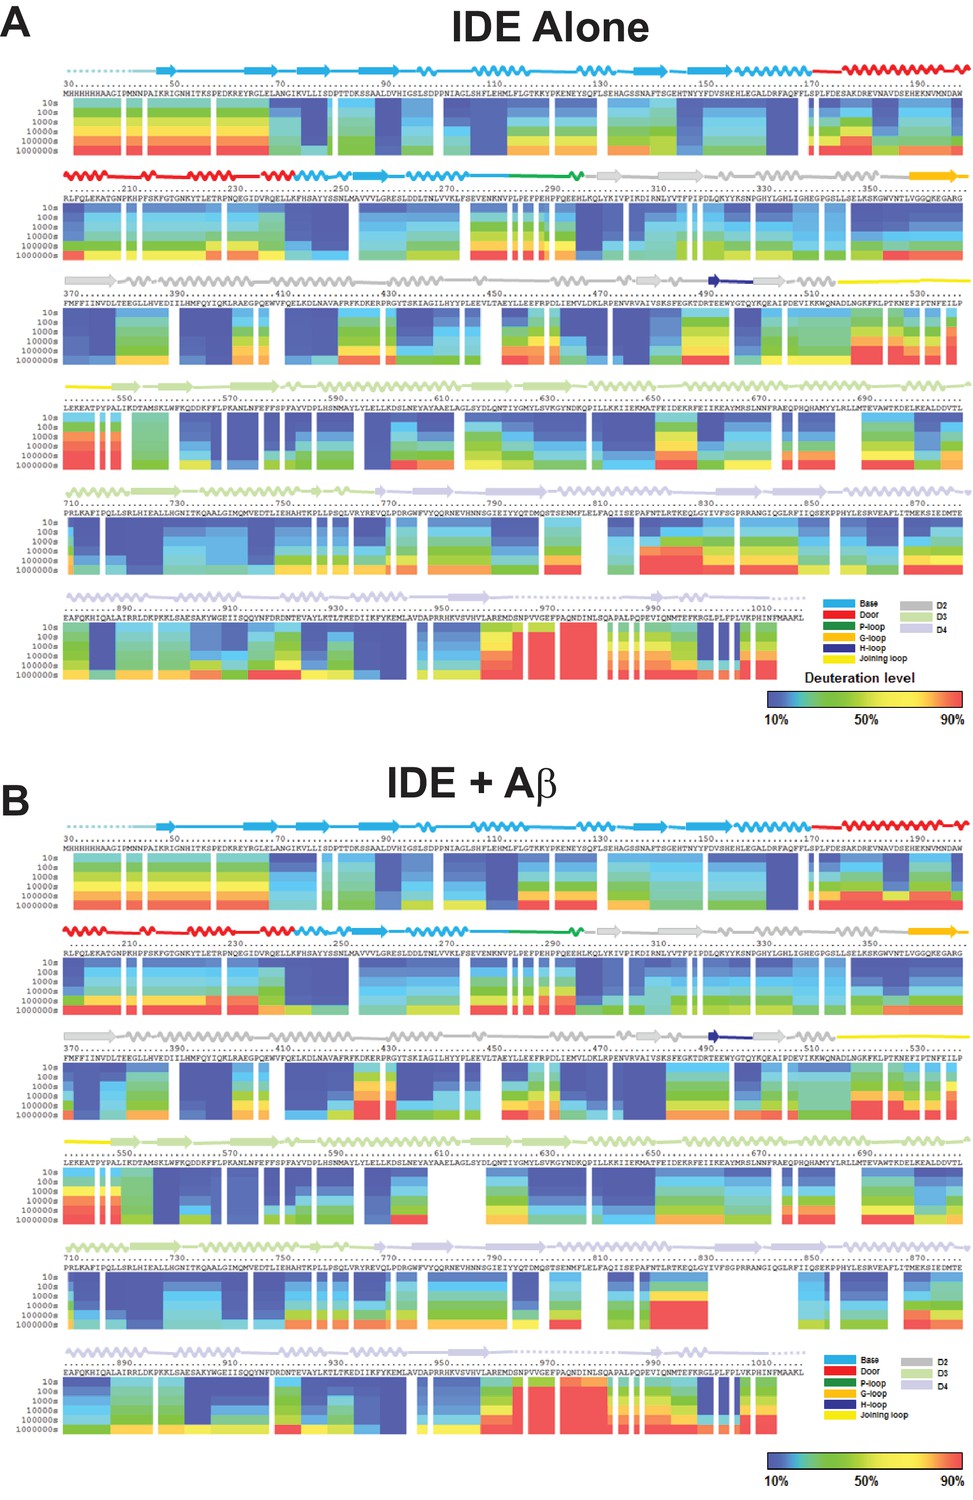
Amide hydrogen-deuterium exchange profiles of IDE alone (A) and IDE in the presence of Aβ (B).
The percentages of deuteration levels of each peptide fragment at various time points are shown as a heat map color-coded from blue (<10%) to red (>90%), as indicated at the bottom right of the figure. Each block represents a peptide segment analyzed at each of the six time points (from top to bottom: 10, 100, 1000, 10,000, 100,000, and 1000,000 s). Proline residues, and regions with no amide exchange data available are colored in gray. The structure features of IDE are shown above IDE sequences and colored according to their domains/subdomains.
Figure 6—figure supplement 3
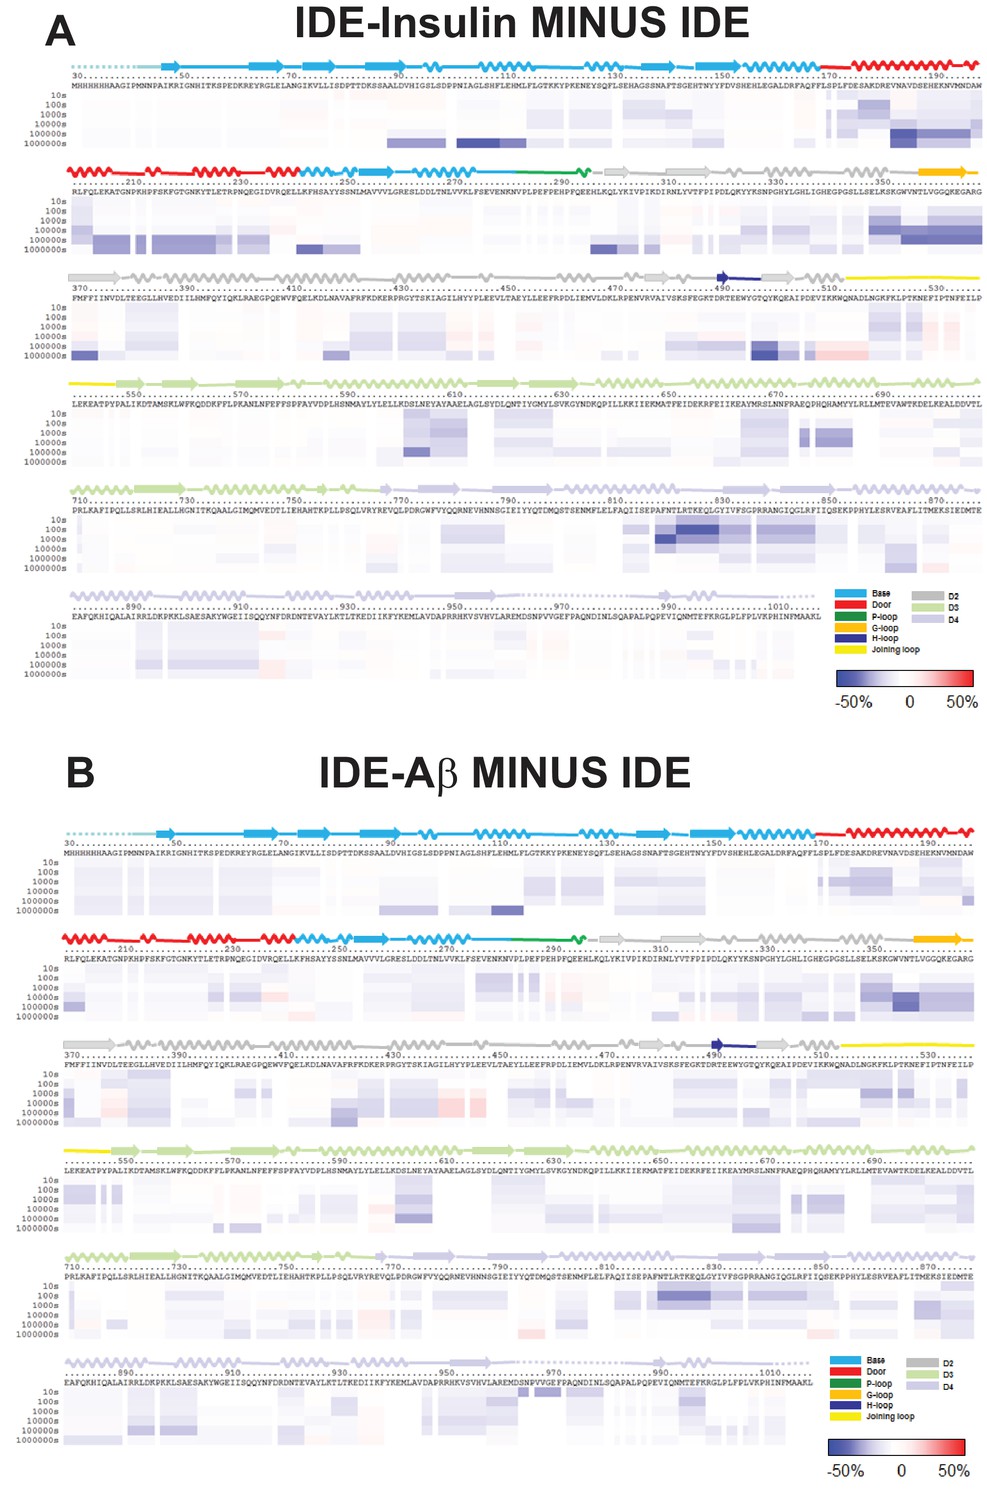
HDX-MS analysis of IDE-substrate interaction.
Differences in deuteration levels in the free and insulin-bound (A) or Aβ-bound IDE (B) at various time points (from top to bottom: 10, 100, 1000, 10,000, 100,000, and 1000,000 s) are shown in a color-coded bar ranging from blue (−50%) to red (50%), as indicated at the bottom right of the figure. The structure features of IDE are shown above IDE sequences and colored according to their domains/subdomains.
Figure 6—figure supplement 4
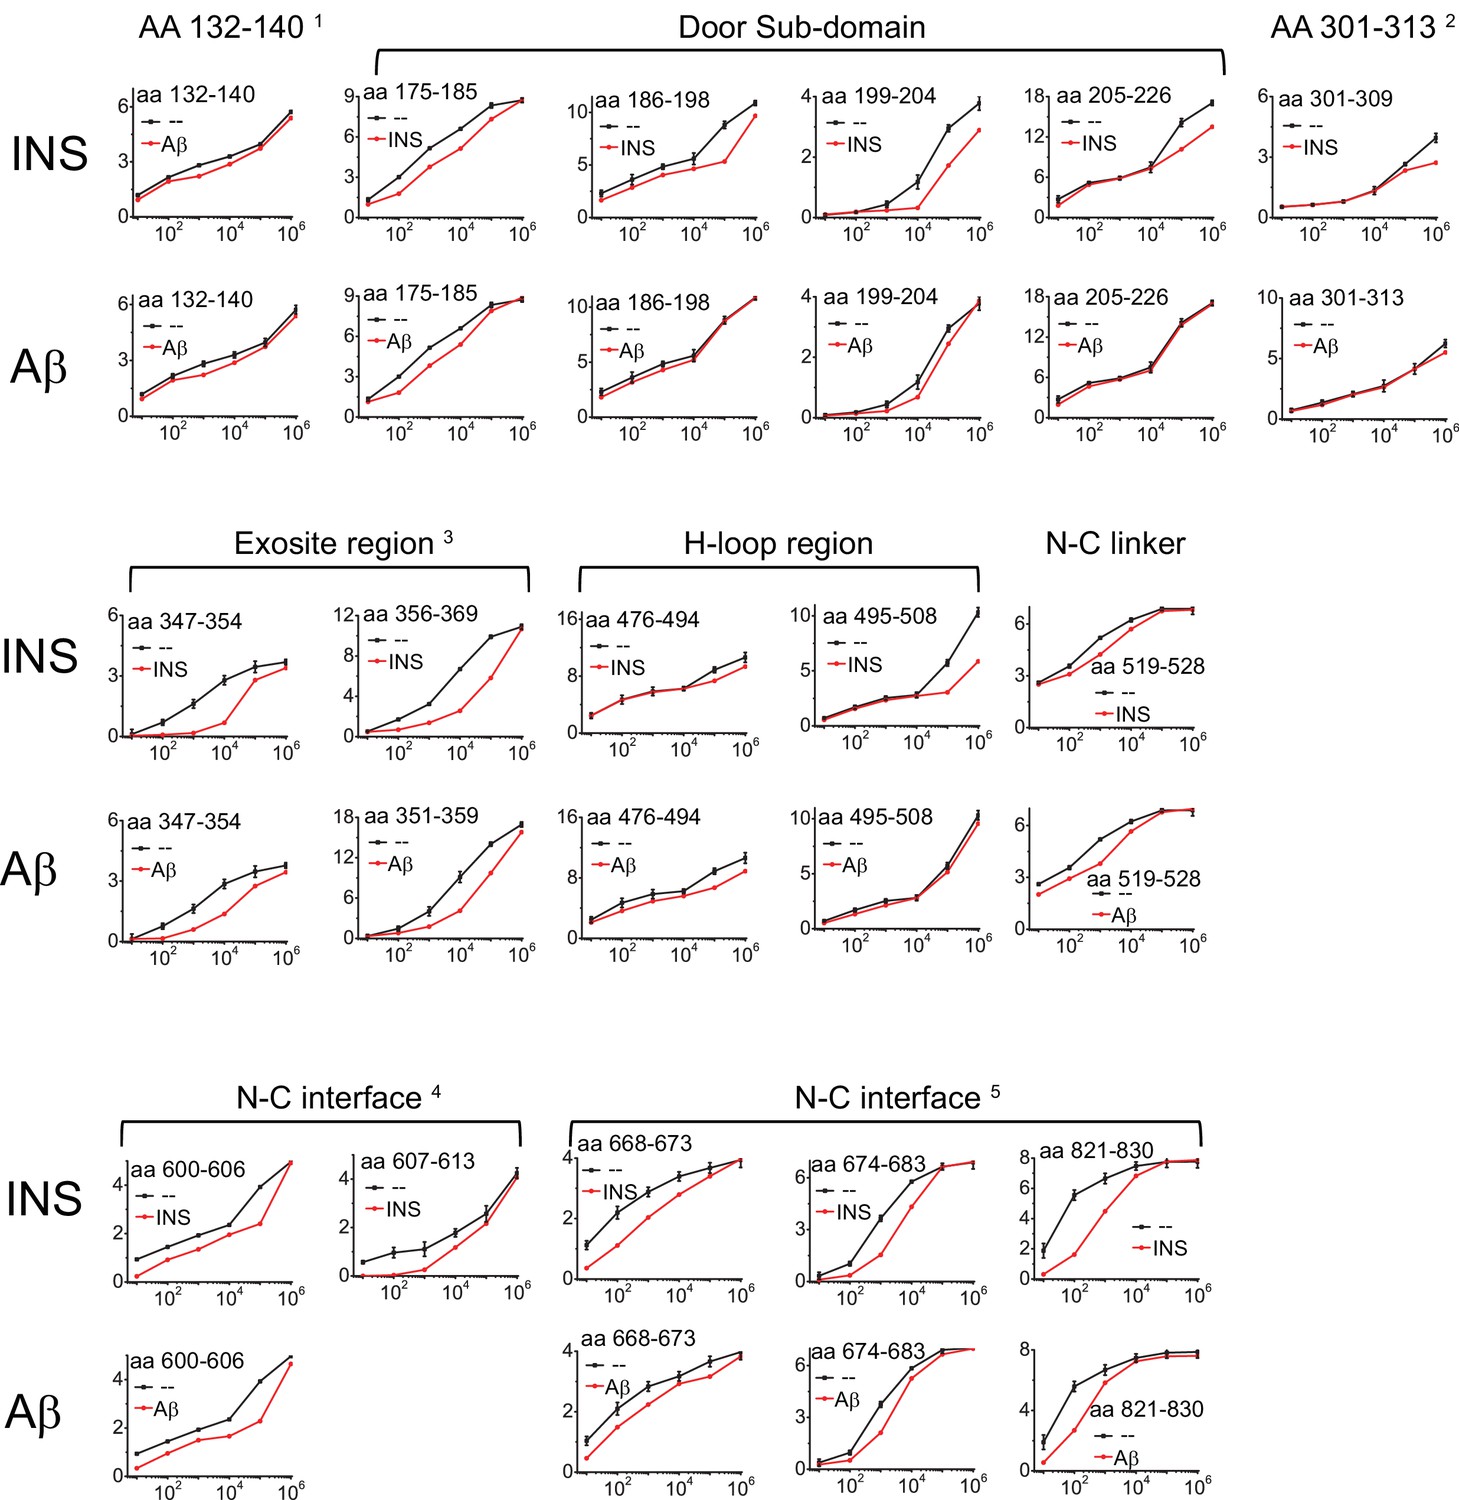
Progression curves that have the significant difference in HDX of IDE when insulin (INS) or Aβ were present.
The standard deviation error bar to the WT IDE data is determined by three individual experiments.
Figure 7 with 2 supplements
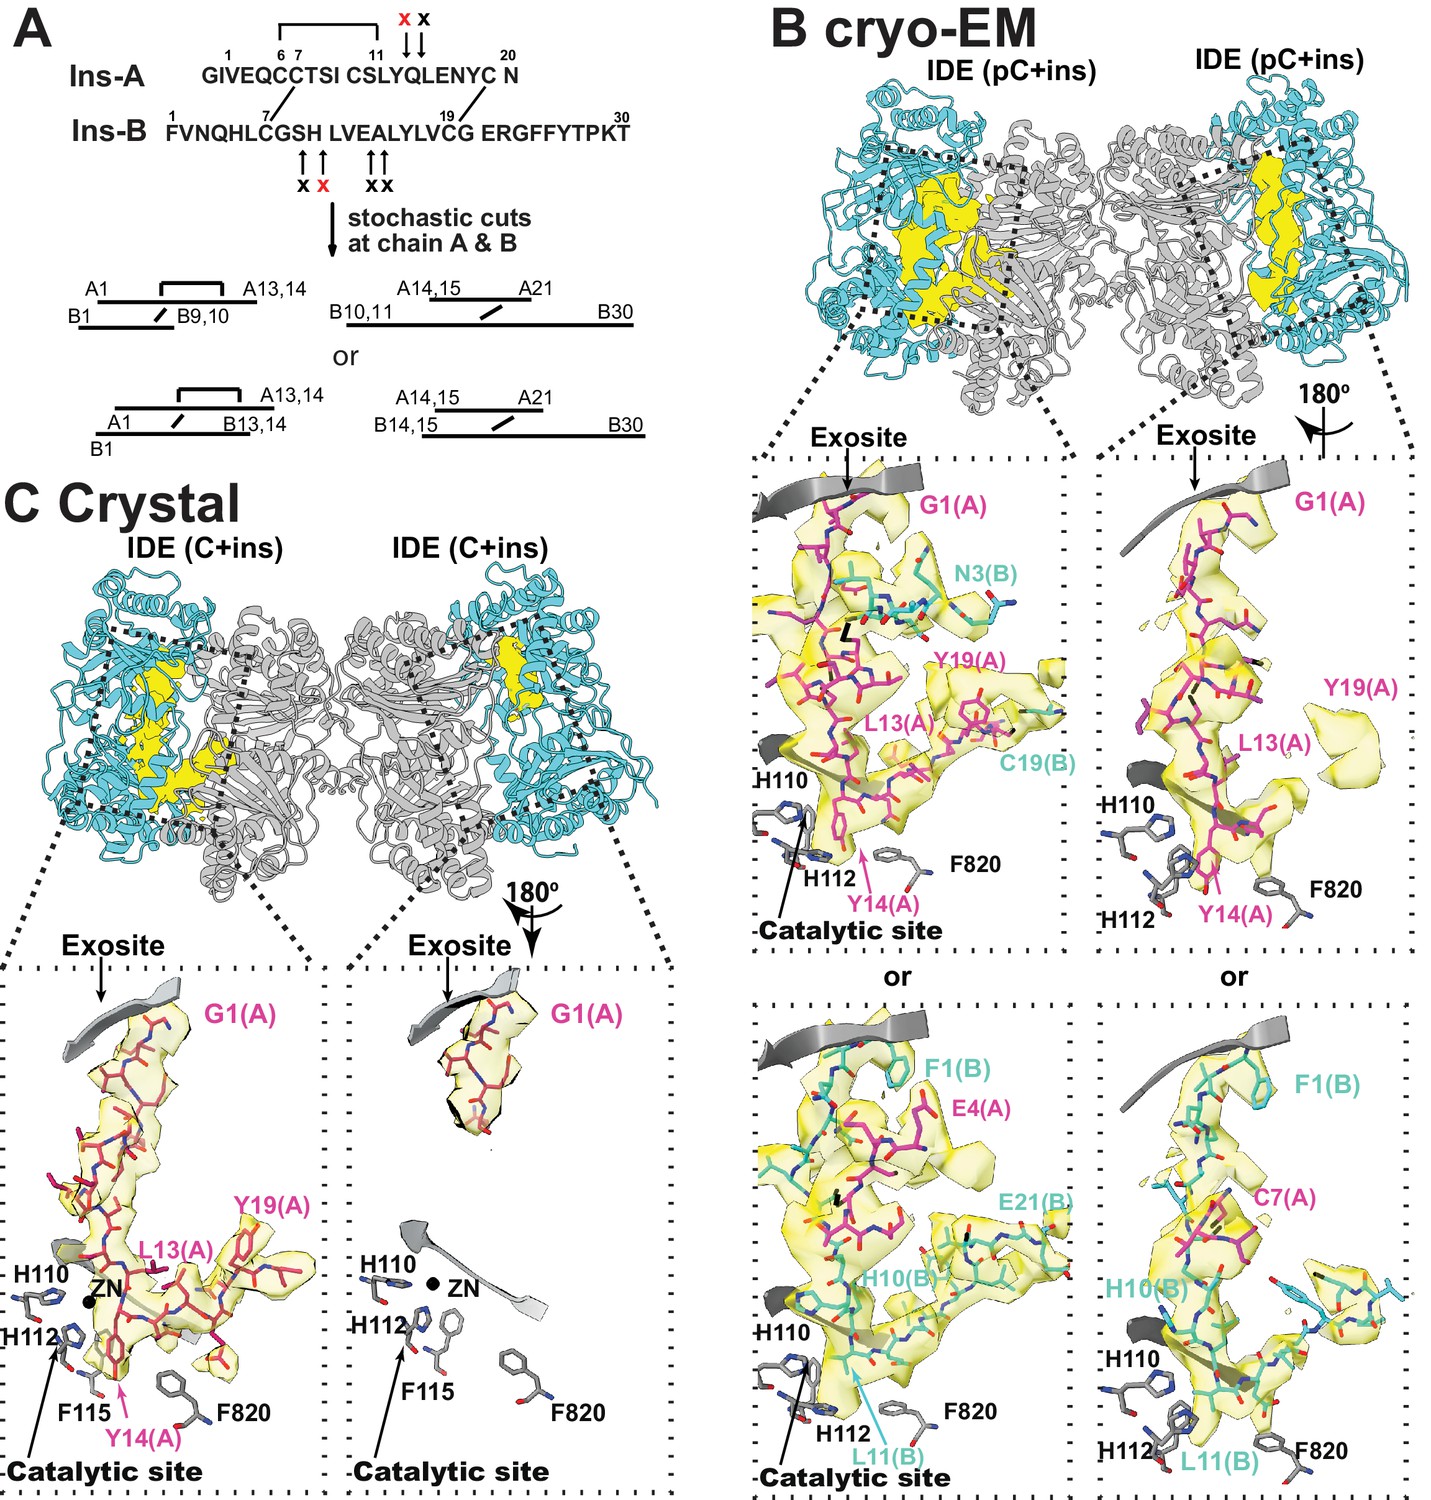
The interaction of IDE with insulin.
(A) Cleavage sites of insulin by IDE. The initial cleavages and resulting fragments are shown. The red X marks the scissile bond revealed by insulin-bound IDE structures. (B) CryoEM structure of unfolded insulin inside IDE. The fitting of electron density at the catalytic sites with either insulin A (PDB code: 6B3Q) or B chain (PDB code: 6BFC) are shown. For simplicity, FabH11-E is not shown. (C) Structure of unfolded insulin inside IDE from insulin bound IDE-Fab1 complex (PDB code: 5WOB). For simplicity, only the fitting of insulin A chain is shown.
Figure 7—figure supplement 1

Insulin binding at IDE catalytic chamber from Fab1- and insulin-bound IDE crystal structure at 3.95 Å resolution.
All eight catalytic chambers from four IDE dimers in an asymmetric unit are shown. Insulin is colored in pink stick and the electron density around insulin is colored in yellow. The secondary structures and residues crucial for insulin binding of IDE is shown in grey.
Figure 7—figure supplement 2
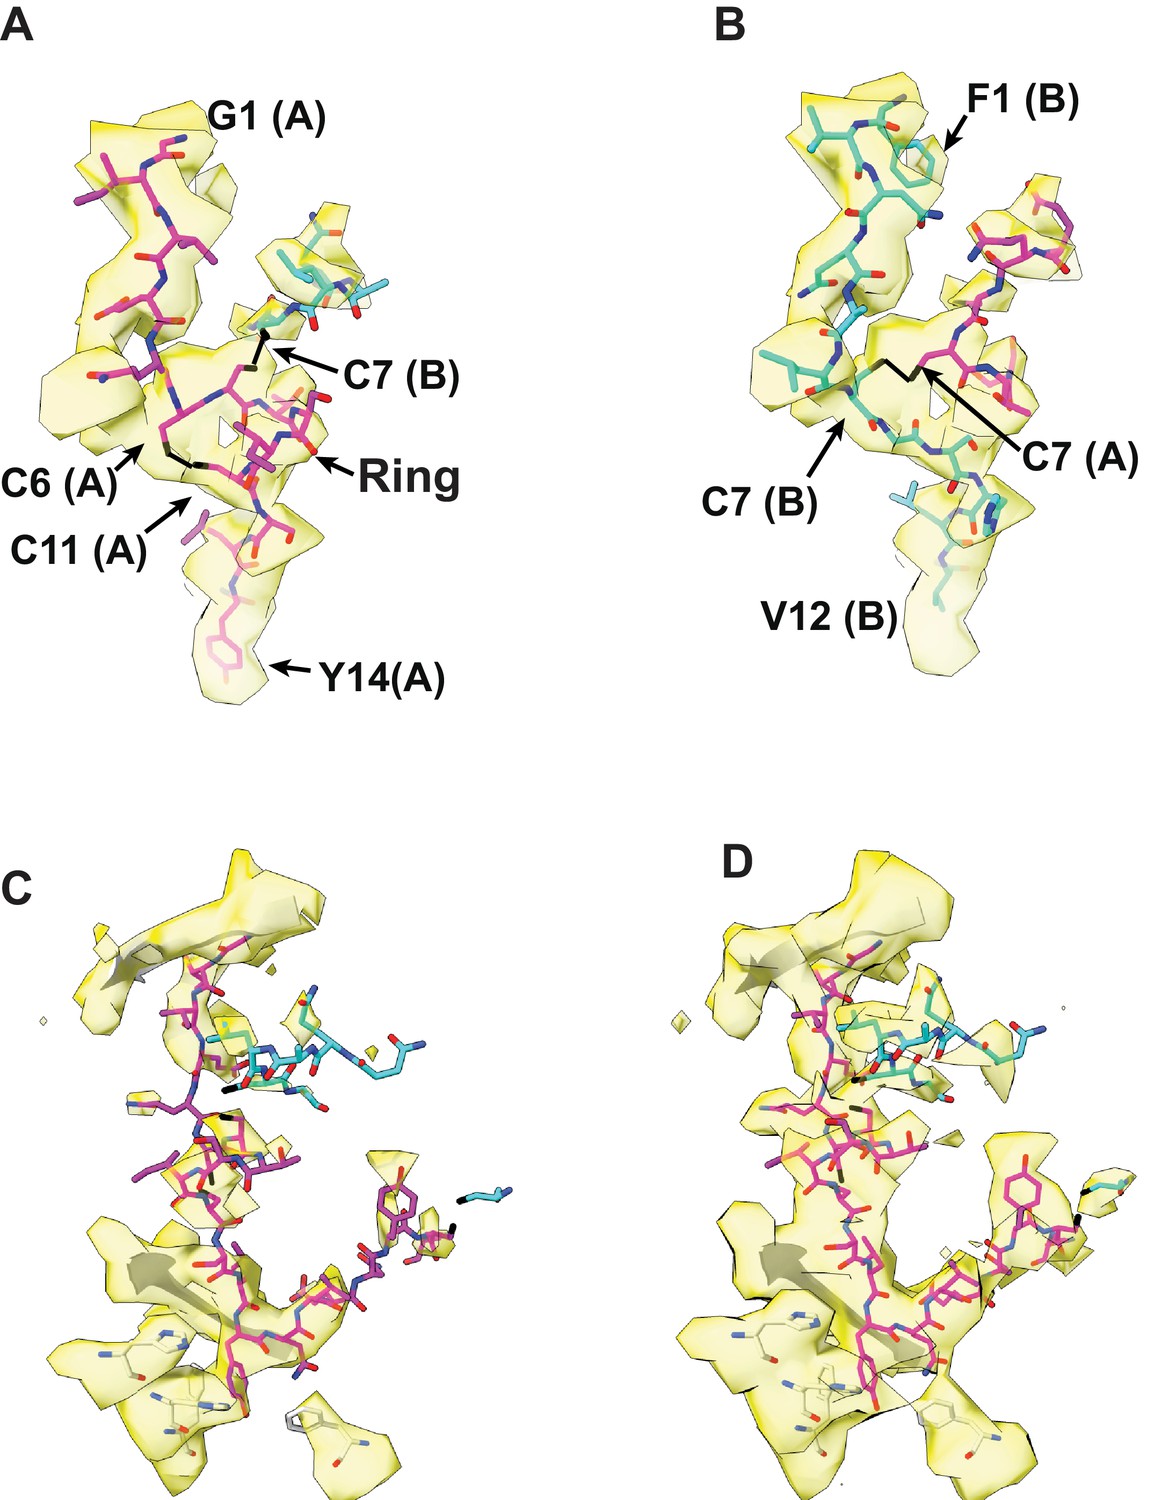
The fit of the unfolded insulin A or B chain with electron density inside the catalytic chamber of IDE from cryoEM structure of insulin-bound IDE.
(A, B) Two likely fit of either insulin A or B chain into the extra-density at the catalytic chamber of both IDE subunits. Only electron density within 3 Å around insulin are shown. The detailed features in the possible fit of extra electron density with unfolded insulin A (A) or B chain (B). The atoms were colored as N, blue; O, red; S, black; and C, magenta (insulin chain A), and C, cyan (insulin chain B). (C, D) The electron density of insulin and the surrounding residues of IDE. H110 and H112 are residues binding the catalytic Zn2+ ion while F115 and F820 form a hydrophobic pocket for the substrate binding. Electron density map is contoured to the level that the density around H110 and H112 (C) or insulin (D) is clearly visible to show the strength of the ligand density.
Figure 8
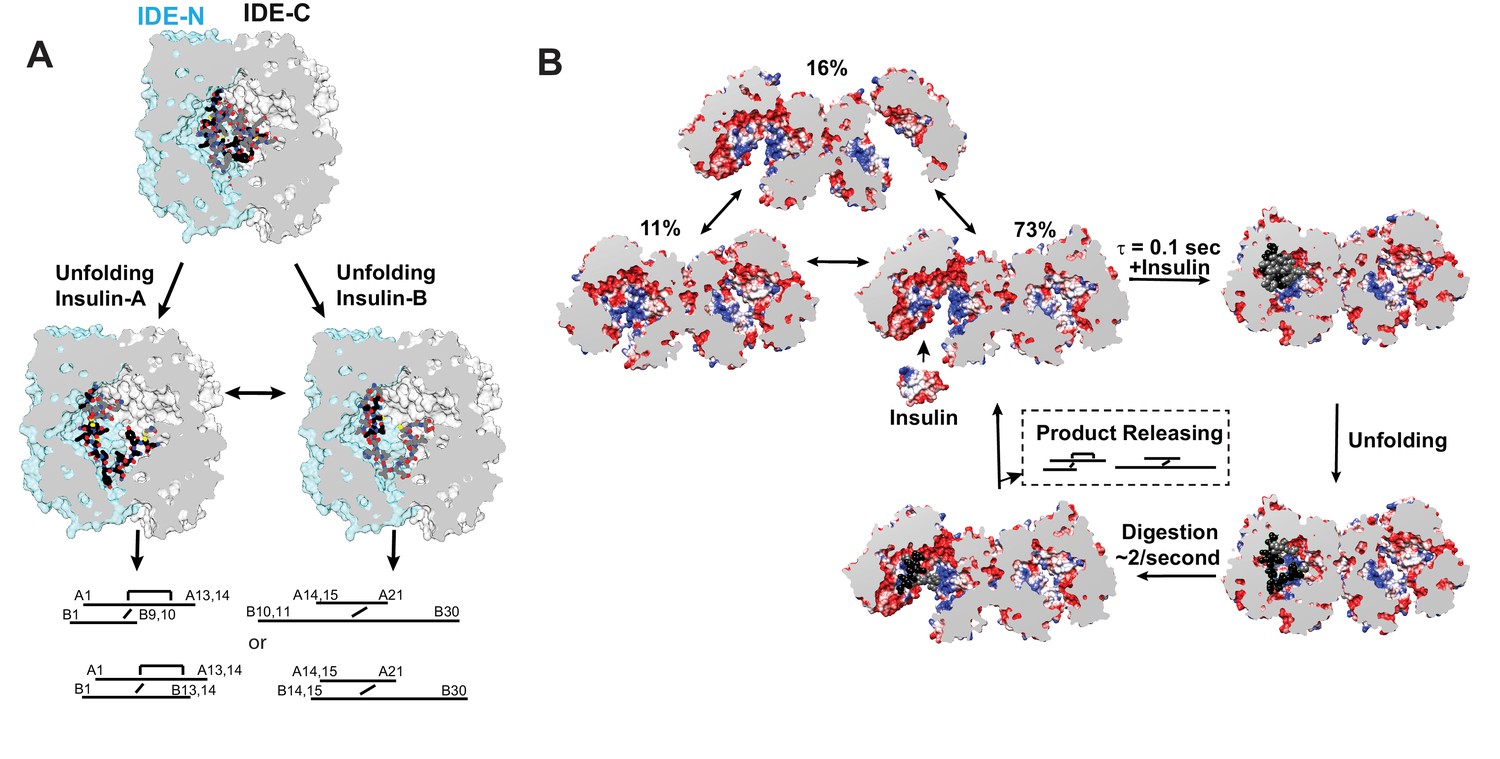
Models for IDE catalytic cycle.
(A) Model for conformational changes of insulin inside IDE chamber. Structure of partially unfolded insulin at the IDE catalytic chamber is from PDB code 2WBY while those with unfolded insulin are from PDB code 6B3Q and 6BFC for insulin A and B chain at IDE catalytic site. (B) A model for IDE conformational states relevant to substrate capture and catalysis. For simplicity, only the capture and catalysis of the dominant IDE conformational state, pO/O, is shown. The conformational change of the other IDE subunit allosterically regulated by insulin binding to the open-state IDE within an IDE dimer depicted by Video 3 is not shown. The electrostatic surface potential of IDE is set from −5 kT/e (red) to 5 kT/e (blue) and calculated by UCSF Chimera, and the section interface is colored as grey.
Videos
Video 1
Overall fit of human dimeric IDE structures with the electron density maps.
Scheme 1: CryoEM structure of human insulin-bound dimeric IDE at 3.8 angstrom resolution. Electron density map colored in grey, IDE colored in cyan and in the ribbon representation, and insulin colored in yellow. Scheme 2: Cryo EM structure of human apo-IDE at 4.1 angstrom resolution that has one subunit in the partially-open state and the other in the open state. Electron density map in grey and IDE colored in pale green and in ribbon representation. This is the dominant conformational state of apo-IDE. Scheme 3: Cryo EM structure of human apo-IDE at 5.5 angstrom resolution that has both subunits in the open state. Electron density map in grey and IDE colored in magenta and in ribbon representation. Scheme 4: Cryo EM structure of human apo-IDE at 5.9 angstrom resolution that has both subunits in the partially-open state. Electron density map in grey and IDE colored in purple and in ribbon representation.
Video 2
Fit of individual residues of an IDE subunit of insulin-bound IDE at 3.8 angstrom resolution with the electron density map.
The movie is 30 minutes long and is designed for the viewer to zip through residues by the control bar of the movie running software.
Video 3
Morph between IDE conformational states to depict the possible transition between various conformational states of IDE.
Only a few synchronized motions are depicted in such morph. Uncoordinated motions between two IDE subunits are not depicted even though they likely occur as well. Scheme 1: Morph to depict synchronized motion of IDE that one IDE subunit undergoes the transition from the open state to the partially open state while the other undergoes the transition in the opposite direction (from the partially open state to the open state). Scheme 2: Morph to depict synchronized motion of IDE that both IDE subunits undergoes the transition between the open state and the partially open state simultaneously. Scheme 3:Morph to depict synchronized motion of IDE that both IDE subunits undergoes the transition between the partially-open state and the partially closed state simultaneously. Scheme 4: Morph to depict synchronized motion of IDE that IDE subunits simultaneously undergoes the transition between the partially-open state, the closed state, and the partially closed state. We hypothesize that IDE undergoes such motion when its substrates are entrapped inside the catalytic chamber. Such motion would allow substrate unfolding, leading the substrate-assisted catalysis.
Tables
Key resources table
| Reagent type (species) or resource | Designation | Source or reference | Identifiers | Additional information |
|---|---|---|---|---|
| Antibody | Synthetic anti-IDE antibody Fab fragment (FabH11-E) | This study | NA | About 5 mg/ml for crystallization, and 0.15 mg/ml for cryoEM. |
| Antibody | Synthetic anti-IDE antibody Fab fragment Fab1Fab1 | (McCord et al., 2013) | NA | About 5 mg/ml for crystallization. |
| Recombinant protein (Human) | Cysteine-free IDE | This study | NA | Described as above. |
| Recombinant protein (Human) | Cysteine-free IDE-E111Q | This study | NA | Described as above. |
| Recombinant protein (Human) | Insulin | Sigma-Aldrich | 234-279-7 | |
| Recombinant protein (Human) | Amyloid β | (King et al., 2014) | NA | |
| Recombinant protein (Human) | Pepsin | Sigma-Aldrich | P6887-1G | |
| Chemical compound, drug | BDM44768 | (Deprez-Poulain et al., 2015a) | NA | |
| Chemical compound, drug | 6bK | (Maianti et al., 2014) | NA | |
| Chemical compound | D2O | Cambridge Isotope Laboratories, Inc. | DLM-4–1L | |
| Software, algorithm | Leginon 3.3 | (Suloway et al., 2005) | NA | http://emg.nysbc.org/redmine/projects/leginon/wiki/Leginon_Homepage |
| Software, algorithm | DoGpicker | (Voss et al., 2009) | NA | http://emg.nysbc.org/redmine/projects/software/wiki/DoGpicker |
| Software, algorithm | MotionCor2 | (Zheng et al., 2017) | NA | http://msg.ucsf.edu/em/software/motioncor2.html |
| Software, algorithm | Relion2.0 | (Scheres, 2012) | NA | http://www2.mrc-lmb.cam.ac.uk/relion/index.php/Main_Page |
| Software, algorithm | Relion2.1 | (Scheres, 2012) | NA | http://www2.mrc-lmb.cam.ac.uk/relion/index.php/Main_Page |
| Software, algorithm | 3DFSC | (Tan et al., 2017) | NA | https://github.com/nysbc/Anisotropy |
| Software, algorithm | UCSF ChimeraX | (Goddard et al., 2018) | NA | https://www.cgl.ucsf.edu/chimerax/ |
| Software, algorithm | UCSF Chimera | (Pettersen et al., 2004) | NA | https://www.cgl.ucsf.edu/chimera |
| Software, algorithm | PHENIX | (Adams et al., 2010) | NA | https://www.phenix-online.org/ |
| Software, algorithm | Phaser-MR | (McCoy et al., 2007) | NA | https://www.phenix-online.org/documentation/tutorials/mr.html |
| Software, algorithm | COOT | (Emsley et al., 2010a) | NA | https://www2.mrc-lmb.cam.ac.uk/personal/pemsley/coot |
| Software, algorithm | MolProbity | (Chen et al., 2010) | NA | http://www.ks.uiuc.edu/Research/mdff/ |
| Software, algorithm | PRIMUS | (Konarev et al., 2003) | NA | https://www.embl-hamburg.de/biosaxs/primus.html |
| Software, algorithm | CRYSOL | (Svergun et al., 1995) | NA | https://www.embl-hamburg.de/biosaxs/crysol.html |
| Software, algorithm | GNOM | (Svergun, 1992) | NA | https://www.embl-hamburg.de/biosaxs/gnom.html |
| Software, algorithm | SEQUEST/Proteome Discoverer Software | ThermoFisher Scientific | NA | https://www.thermofisher.com/order/catalog/product/OPTON-30795 |
| Software, algorithm | HDEXaminer | Sierra Analytics | NA | http://massspec.com/hdexaminer/ |
Additional files
-
Supplementary file 1
Data collection and structure refinement statistics
- https://doi.org/10.7554/eLife.33572.037
-
Supplementary file 2
CryoEM data collection and processing statistic
- https://doi.org/10.7554/eLife.33572.038
-
Supplementary file 3
CryoEM map and model refinement statistics
- https://doi.org/10.7554/eLife.33572.039
-
Supplementary file 4
Distances and angles between center of mass of different domains of IDE cryoEM and crystal structures.
- https://doi.org/10.7554/eLife.33572.040
-
Transparent reporting form
- https://doi.org/10.7554/eLife.33572.041
Download links
A two-part list of links to download the article, or parts of the article, in various formats.
Downloads (link to download the article as PDF)
Open citations (links to open the citations from this article in various online reference manager services)
Cite this article (links to download the citations from this article in formats compatible with various reference manager tools)
Ensemble cryoEM elucidates the mechanism of insulin capture and degradation by human insulin degrading enzyme
eLife 7:e33572.
https://doi.org/10.7554/eLife.33572


