VEGF signaling regulates the fate of obstructed capillaries in mouse cortex
- University of Victoria, Canada
- University of British Columbia, Canada
Figures
Figure 1 with 4 supplements
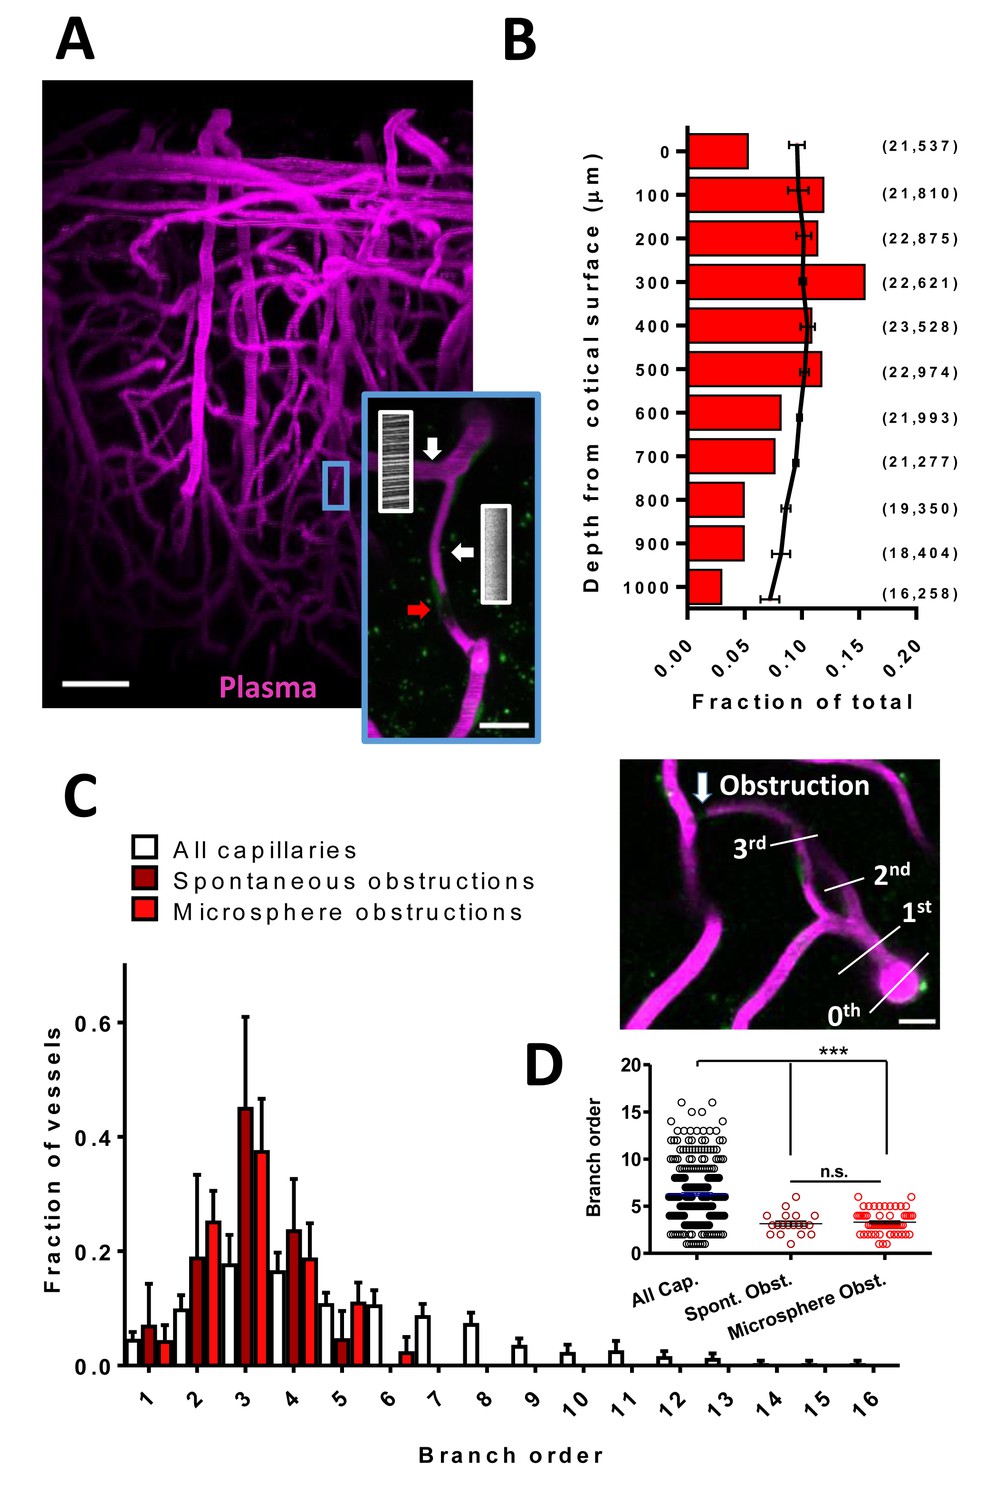
Cortical capillaries are prone to spontaneous obstruction.
(A) Side projection from in vivo two-photon imaging stack (0.027 mm3) showing pial surface at the top with labeled plasma (magenta). Insert shows a flowing (Note streaking pattern in line scans caused by RBC movement) and obstructed capillary (no streaks). Red arrow indicates occluding debris/cells. Scale bars are 50 µm and 15 µm for inset. (B) Distribution of microsphere obstructed capillaries as it relates to depth from the pial surface determined by confocal imaging from post-mortem brain sections. Red bars indicate the relative amount of microsphere obstructions for each depth expressed as a fraction of total obstructions. Black line indicates fraction of total capillaries by depth (error bars are 95% CI) as well as raw numbers of capillaries/ mm3 by depth are provided in parentheses. Note 0.04 obstructions occurred below 1000 μm from cortical surface but are not shown. (C) Distribution showing spontaneous and microsphere obstructed capillaries expressed as a function of arteriole branch order and relative to the distribution of all capillaries [n(all)=3 mice, 285 capillaries; n(spont.)=5 mice, 21 obstructions; n(micro.)=5 mice, 59 obstructions). Note that lower order capillaries are more susceptible to obstruction. Inset illustrates branch order which started with the penetrating arteriole (0 order branch). Scale bar 15 µm. (D) Mean branch order of spontaneous or microsphere-induced capillary obstructions ([one way ANOVA F(2,360)=32.36, p<0.0001, all capillaries compared to spontaneous obstructions unpaired t-test t(302)=4.180, p<0.0001, or microsphere obstructions unpaired t-test t(342)=6.95, p<0.0001; spontaneous vs microsphere obstructions t(76)=0.46, p=0.65]. ***p<0.001, n.s. = not significant. Error bars are S.E.M.
Figure 1—figure supplement 1
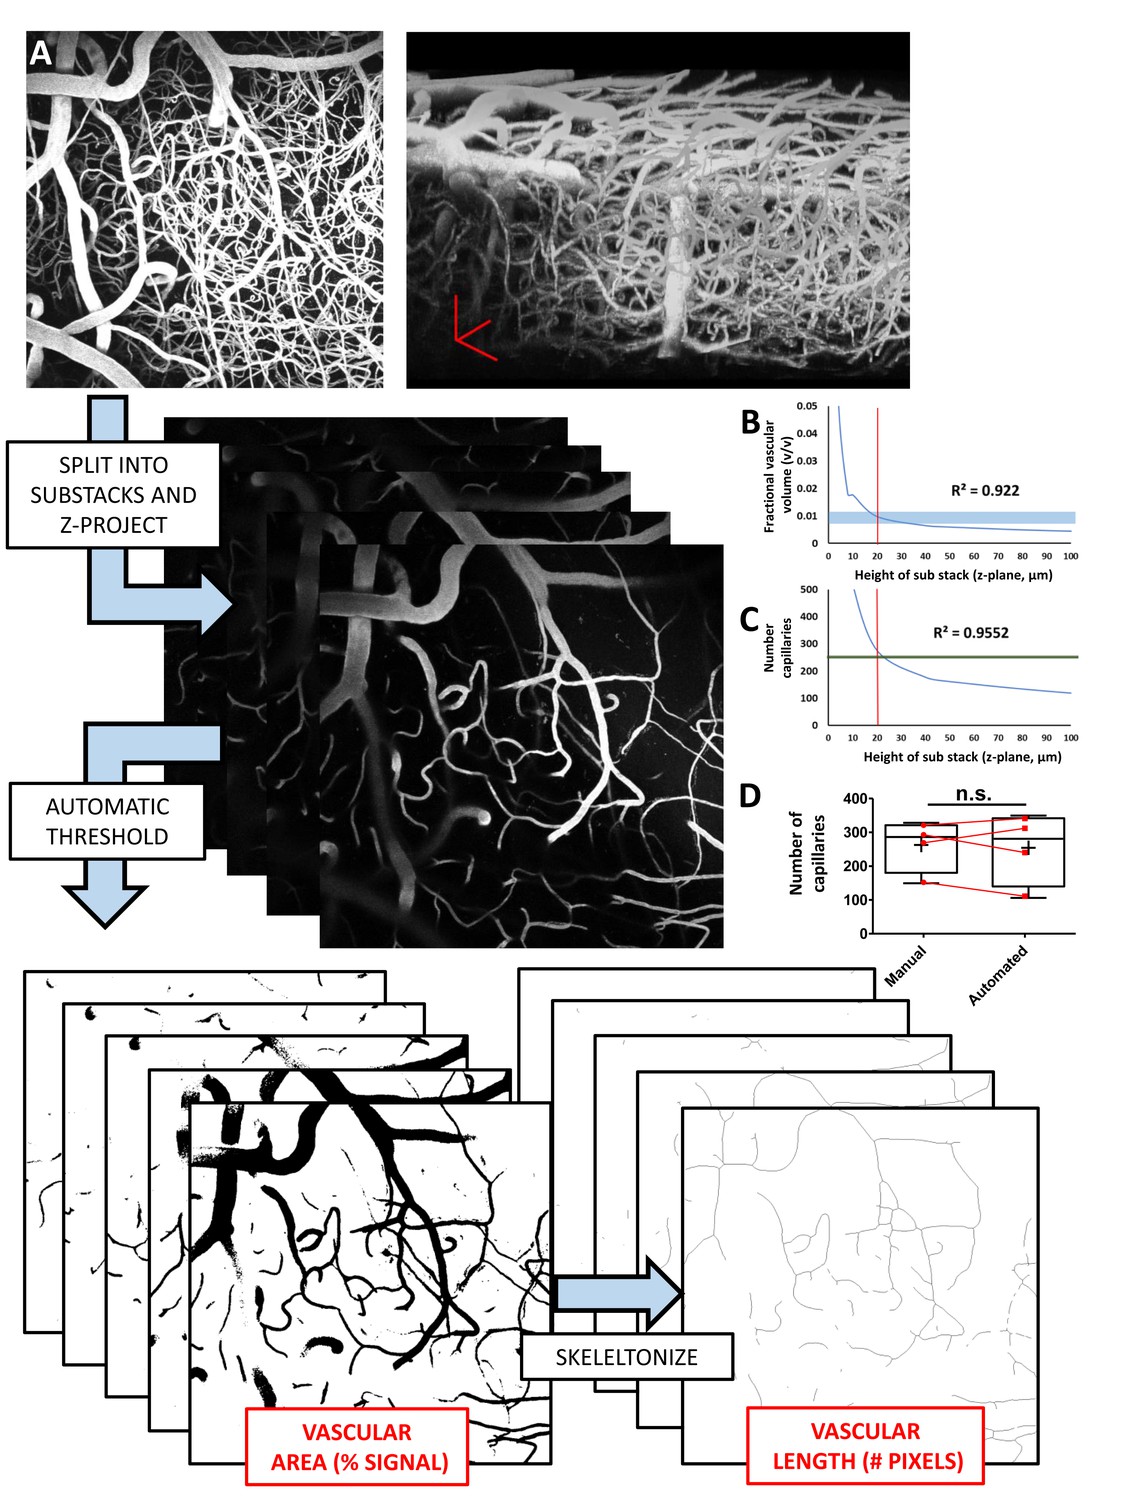
Work flow and validation of automated estimates of vessel density.
A) To provide an automated, unbiased approach for estimating vessel densities, we wrote and validated a custom macro in FIJI (Schindelin et al., 2012). In vivo imaging stacks of dye filled cortical vessels (see maximum z-projection in top left and side view projection of image stack in top right) were manually split into sub-stacks of 10 images (2 µm z-steps between images). Sub stacks were then each maximally projected in the z plane, and each automatically thresholded using the built in ImageJ threshold function Triangle (Zack et al., 1977), which was determined to best capture vascular signal through trial and error. The area and fractional vascular volume of vascular signal (number of black pixels after thresholding) was measured for each sub-stack image projection after applying a median filter (radius of 2 pixels) to eliminate speckling. Thresholded sub-stacks were then binarized and skeletonized using built in functions (Arganda-Carreras et al., 2010) and total vascular length was taken as the number of skeleton pixels. From the vascular length, average vessel width (w = A/L) was also calculated. (B–C) Graphs show that both the fractional vascular volume (v/v) and the estimated number of capillaries per imaging stack (0.02 mm3 volume) were sensitive to the volume of images projected. For fractional vascular volume, projecting 20 µm sub-stacks led to estimates of ~0.01% vascular volume which closely matches published data (Blinder et al., 2013; Schmid et al., 2017). As for capillary number, we validated 20 µm sub-stack z projections by comparing automated estimates with those derived from blinded manual counts (data from four mice, two imaging areas per animal). (D) Box and whisker plots (+is mean) showing close agreement between manual and automated estimates of capillary number per imaging stack [paired t-test t(3)=0.33, p=0.76]. Error bars are S.E.M.
Figure 1—figure supplement 2
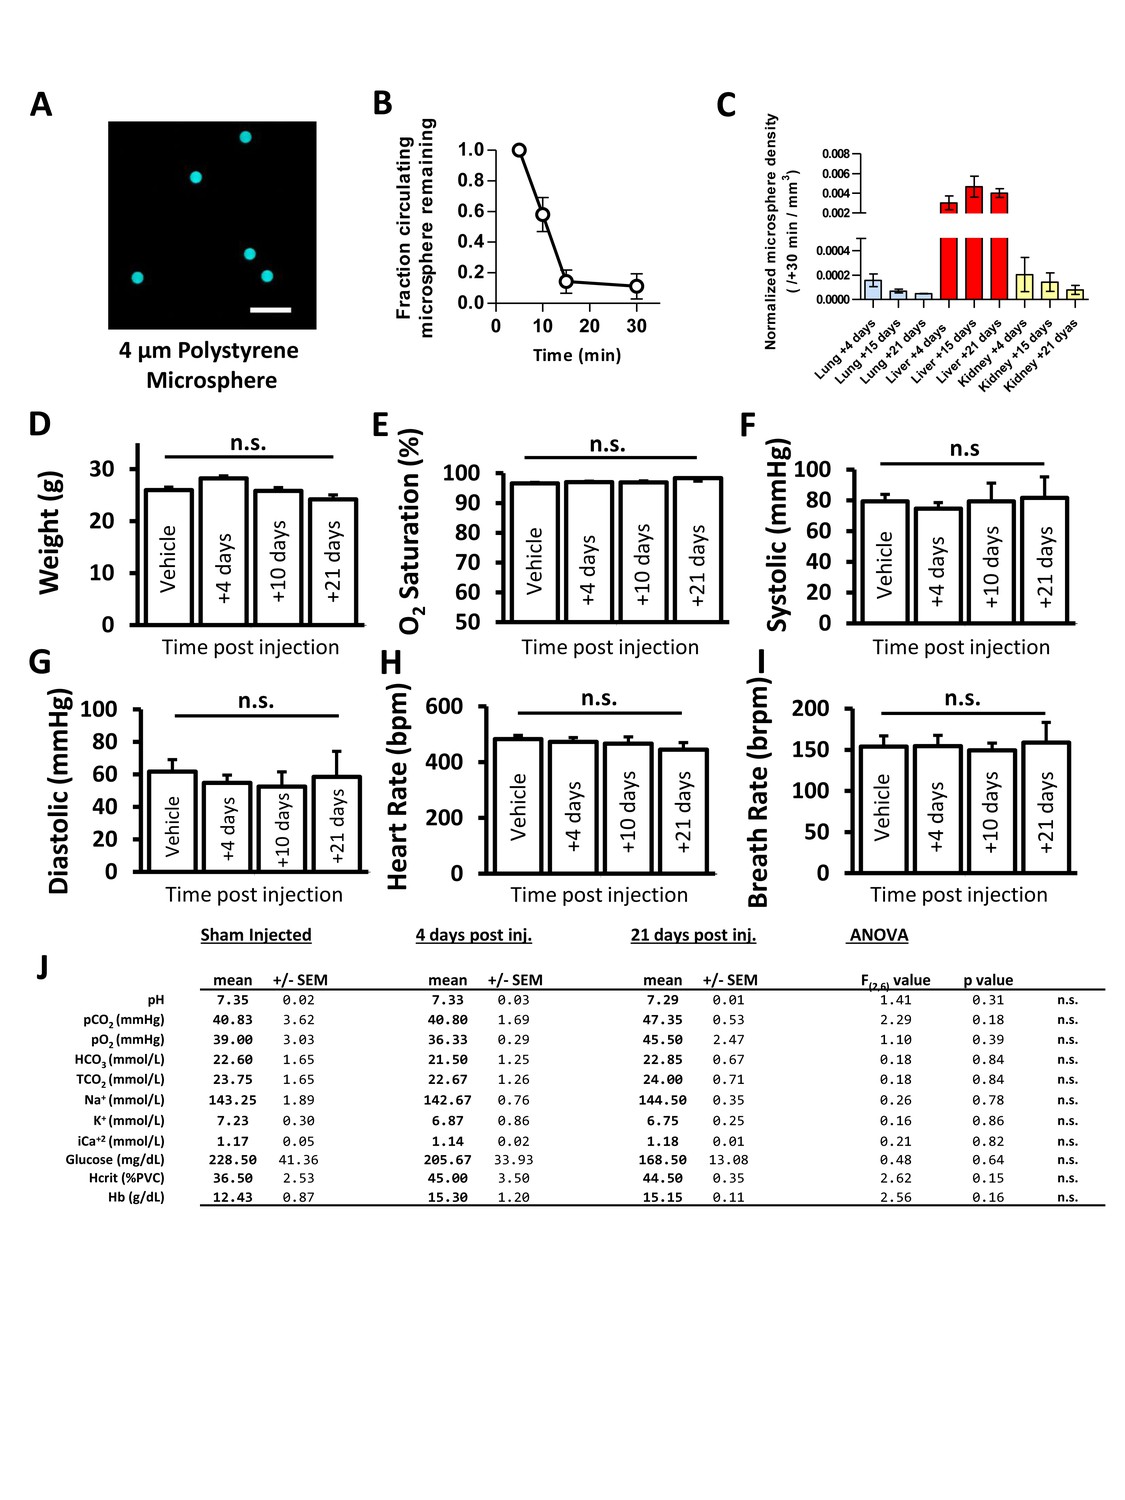
Fluorescent microspheres as a model of spontaneous naturally occurring capillary obstructions.
Given the relative rarity of spontaneous microvascular obstructions, and the experimental challenges of capturing and following a spontaneous event we developed an inducible model of capillary obstructions that allowed us control over the timing of obstruction and the ability to standardize, with low variability, the number of obstructions between experimental groups (A) Image of fluorescently labelled (580/605 nm excite/emit) 4 µm diameter polystyrene microspheres. (B) Quantification of microspheres in blood after i.v. injection. By 30 min, microspheres were reduced to 11% of starting concentration and undetectable by 60 min (n = 5 mice per timepoint). C) Presence of microspheres in other organs at 4, 15 and 21 days after injection (n = 3–14 mice). D–J) To rule out any systematic effects on the cardiovascular system, we assessed body weight (D), tissue oxygenation (measured at thigh, (E), systolic and diastolic blood pressure (F, G), heart rate (H), and breath rate (I). All parameters were unaffected by microsphere injection (n = 4 mice, oneway ANOVA, all p>0.05) (J) No effect of microsphere injection on blood gases, electrolytes, glucose or hematocrit (n = 3 sham and four mice per time point). Error bars are S.E.M.
Figure 1—figure supplement 3
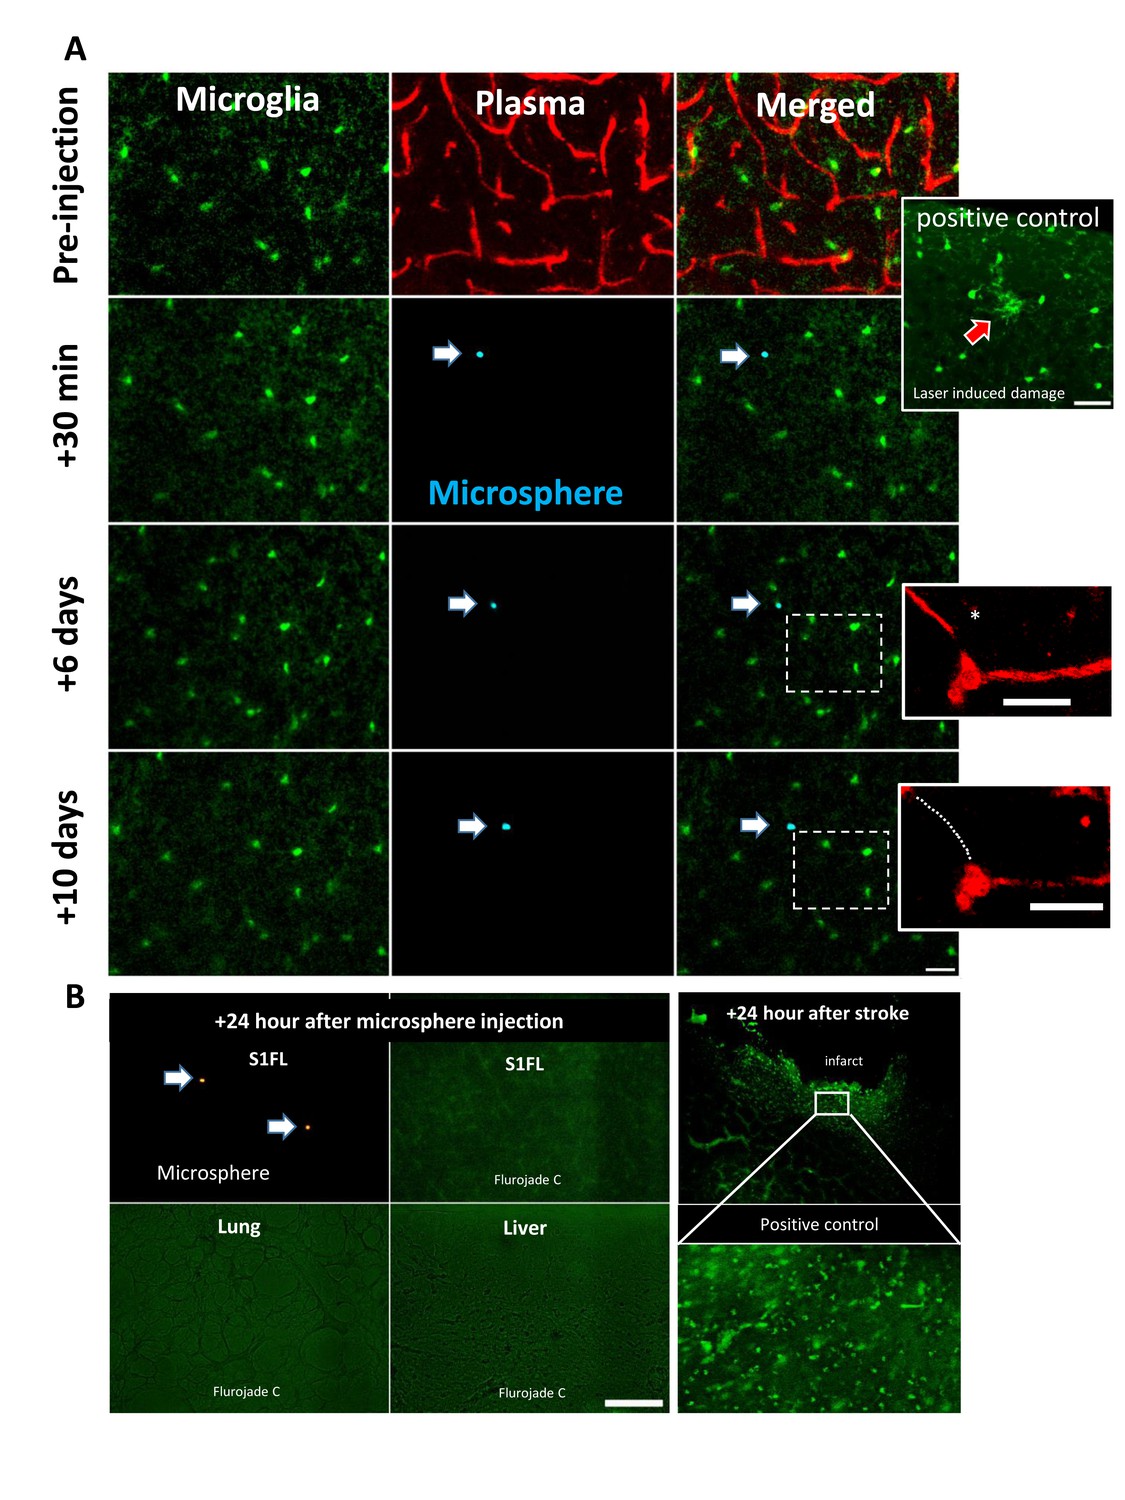
Microsphere based obstruction and pruning did not induce a microglial response or cell death.
A) In vivo time lapse imaging of microglia (green) and blood flow (labeled with 4% Rhodamine dextran) in CX3CR1+/GFP mice. Microglia were not responsive to the capillary obstruction at any time point, in any mice (n = 6 mice, 2–3 areas per mouse), even when the segment was pruned between 6 and 10 days. Inset shows microglial accumulation following laser ablation as a positive control. Scale bars 25 µm. (B) Fluorojade C staining in the cortex, liver or lung 24 hr after injection did not reveal any detectable cell degeneration or death (n = 3 mice). A positive control illustrating cell death following ischemia is shown for comparison. Sections were stained with FJC as previously described (Reeson et al., 2015). Scale bar 100 µm.
Figure 1—figure supplement 4
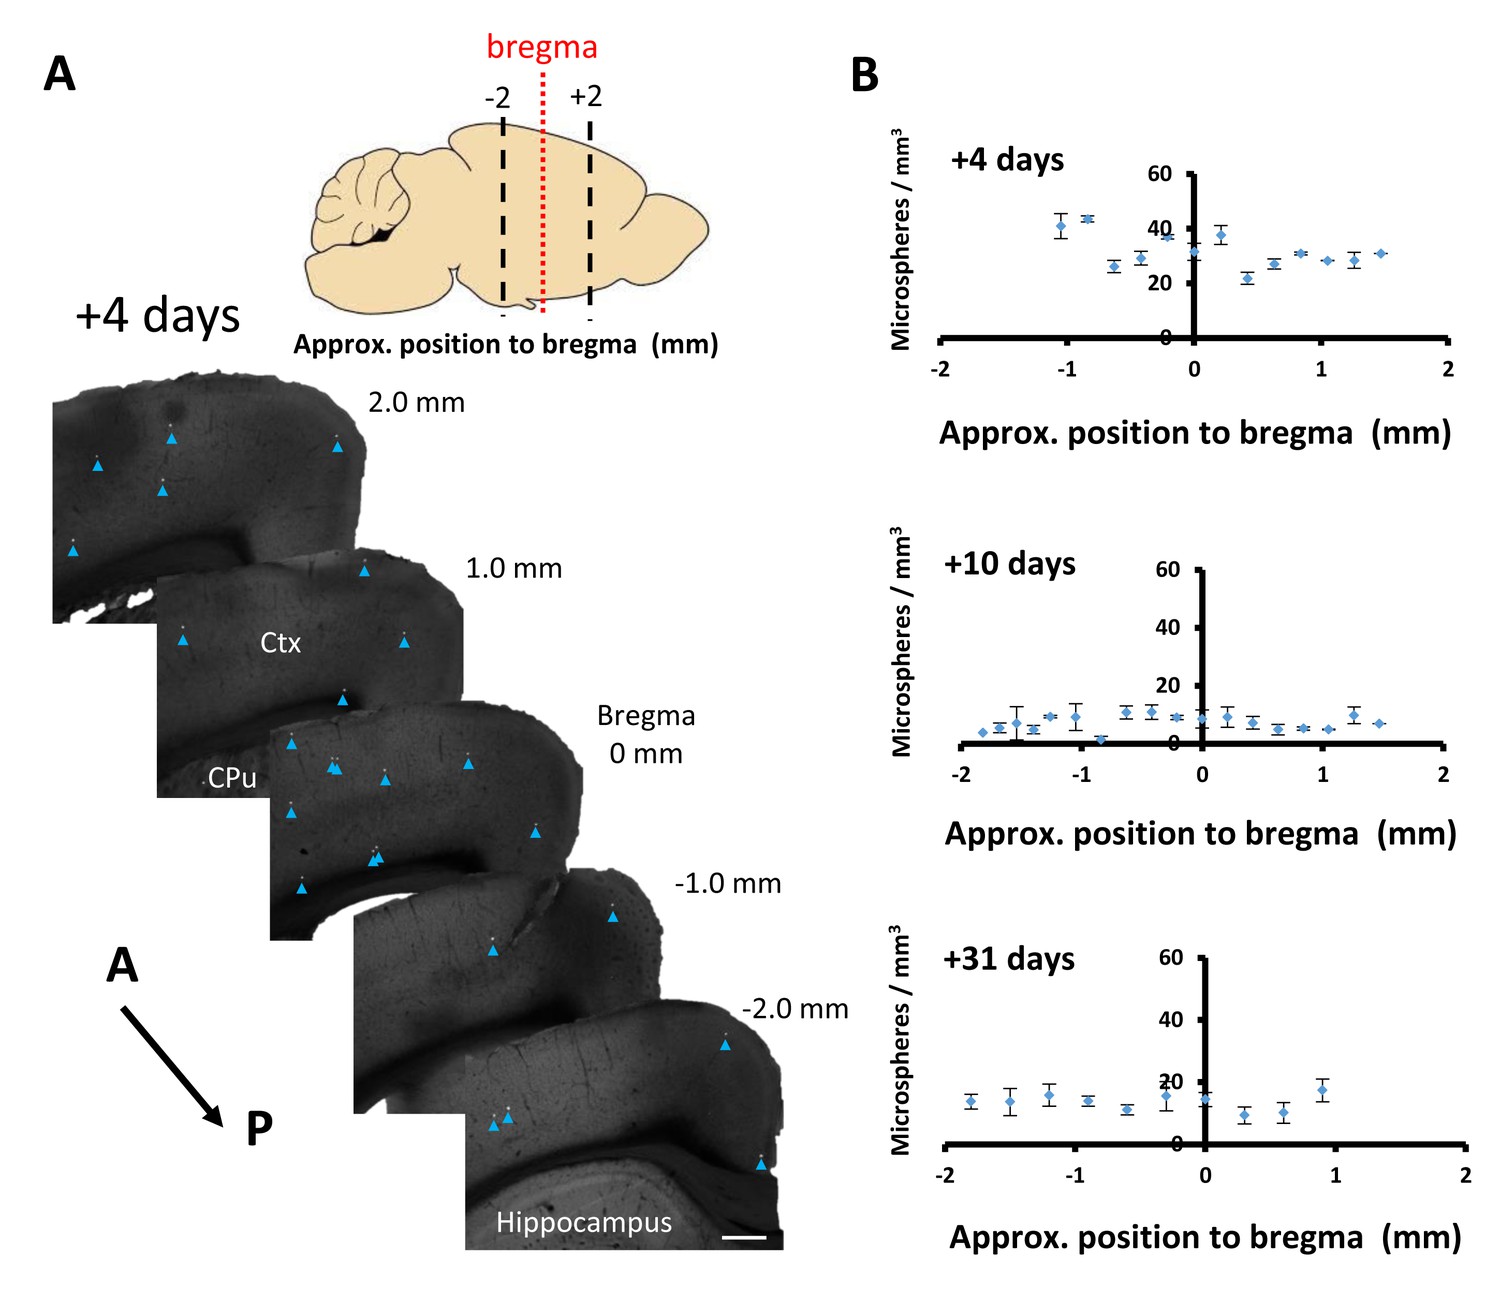
Microsphere obstructions are distributed across major cerebral vascular territories.
(A) Representative images of cortical obstructions (see blue arrowheads) 4 days after microsphere injection in coronal sections ordered relative to bregma. Scale bar 250 µm. (B) Average microsphere density (microspheres /mm3) as a function of time after injection and position relative to bregma. There were no significant main effects of position relative to bregma at any time studied [+4 days: F(10,22)=0.17, p=0.99, +10 days: F(10,22)=0.77, p=0.65, +31 days: F(10,33)=0.26, p=0.98]. Error bars are S.E.M.
Figure 2 with 7 supplements
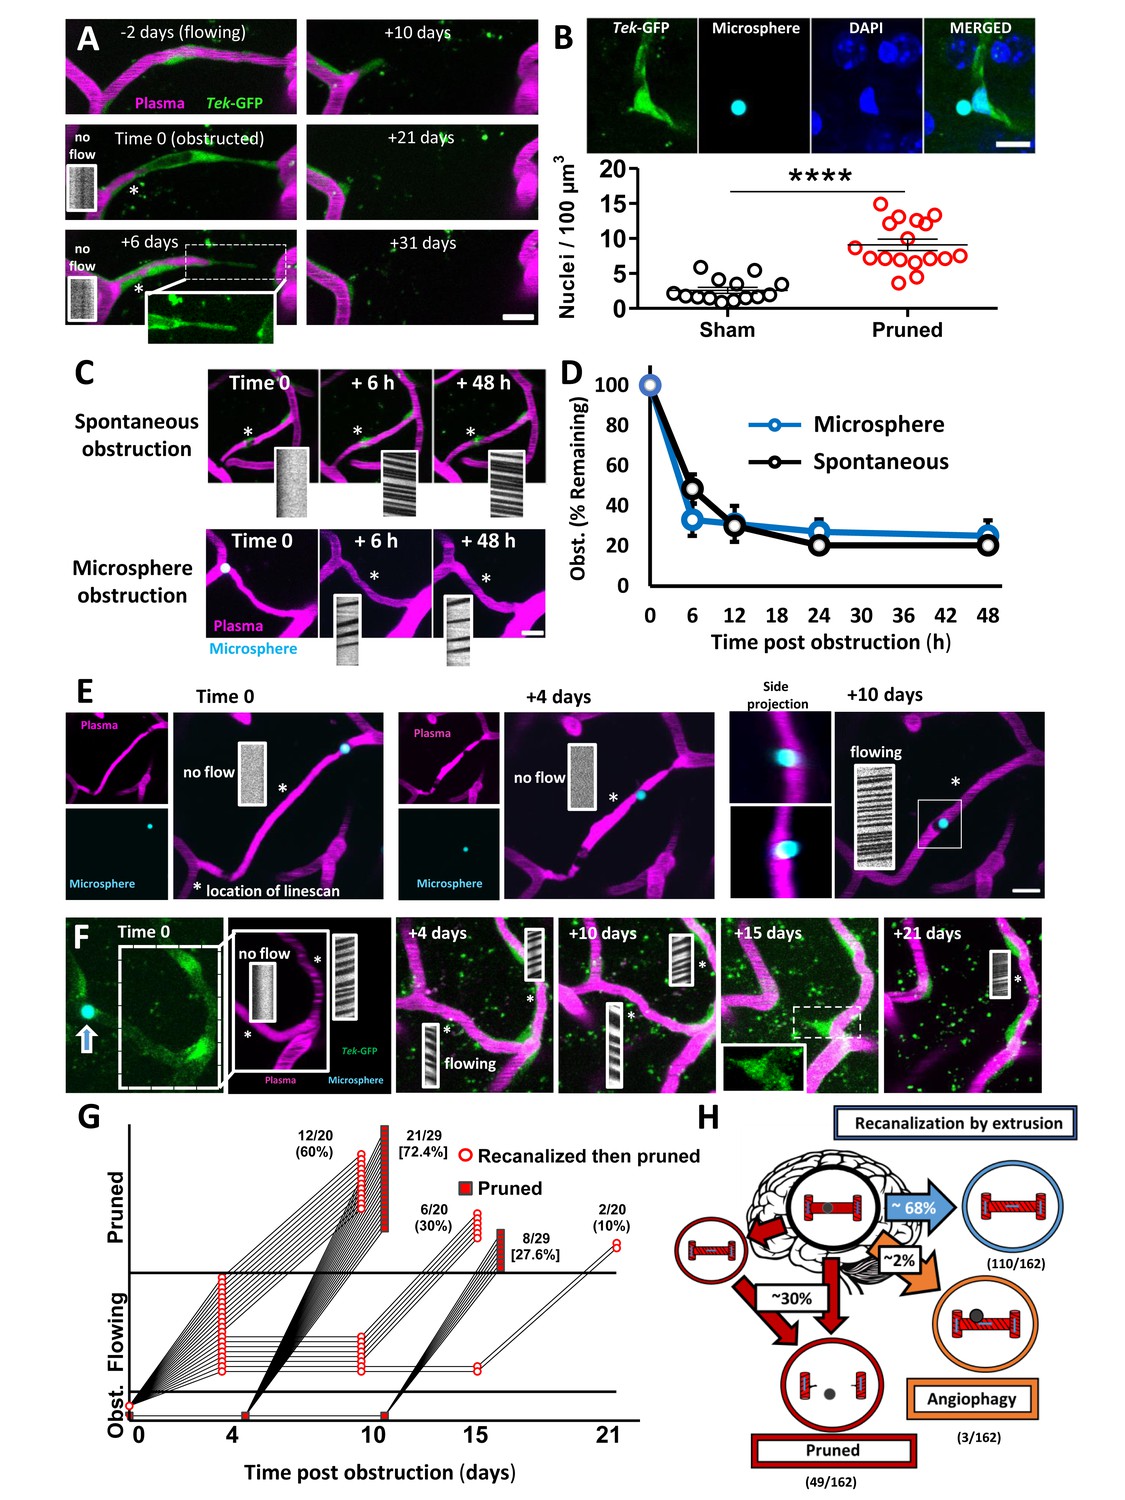
Fates of obstructed cortical capillaries.
A) Longitudinal imaging of a spontaneously obstructed capillary (time 0) that failed to recanalize and was subsequently pruned over 31 days. The endothelium is shown in green (Tek-GFP) and blood plasma in magenta. Asterisk shows location of linescan. (B) Top: Confocal images show endothelial cell nuclei at a branching point adjacent to a presumptively obstructed and pruned capillary segment. Bottom: Pruning of capillaries was associated with a local (within 10 µm) increase in endothelial cell nucleus density [n = 4 mice, unpaired t(29)=6.625, ****p<0.0001]. Average 4.6 capillaries per mouse, range 3–6. (C) Time lapse images of spontaneous or microsphere-induced capillary obstructions, both of which were cleared within 48 hr. D) Clearance of spontaneous (black) or microsphere-induced (blue) capillary obstructions over 48 hr as percent of obstructions at time 0. Recanalization rates were not significantly different between the two types of obstruction [two-way ANOVA, main effect of group: F(1,40)=0.06, p=0.99; n(spont.)=5 mice, 36 obstructions, n(micro.)=4 mice, 35 obstructions]. (E) Example of a capillary that recanalized by extruding the obstruction through the vessel wall, also known as angiophagy. Note the return of blood flow at +10 days and the displacement of the microsphere in side image projections (also see 3D reconstruction, Figure 2—video 2). (F) Time lapse images reveal that some capillaries regain blood flow only to be eliminated at a later time. G) Time course of all capillaries that failed to recanalize and were pruned (square) compared to those that recanalized and were later pruned (circle). H) Summary of microsphere obstructed capillary fates 21 days after injection (n = 14 mice, 162 obstructions). Numbers in parentheses indicate how many capillaries out of 162 total capillaries underwent pruning, angiophagy or recanalized by extrusion. Average 11 capillaries per mouse, range 6–26. Scale bars = 10 µm. Error bars are S.E.M.
Figure 2—figure supplement 1

Capillary pruning does not alter adjoining capillary position.
(A) Example of a capillary being pruned following recanalization. At time 0 the capillary is obstructed by a microsphere (red, blue arrowhead, asterisk shows position of linescan). Dashed line shows distance between secondary connected capillaries measured. By +21 days the capillary was pruned, dashed line shows again the distance between previously connected capillaries measured. (B) Inter capillary distance for control (no obstruction or pruning, still connected) or pruned vessels at time 0 and +21 days. There was no significant difference between timepoints for control [paired t-test, t(18)= 1.76, p=0.1] and pruned capillaries [paired t-test, t(32)= 1.86, p=0.07]. Error bars are S.E.M..
Figure 2—figure supplement 2
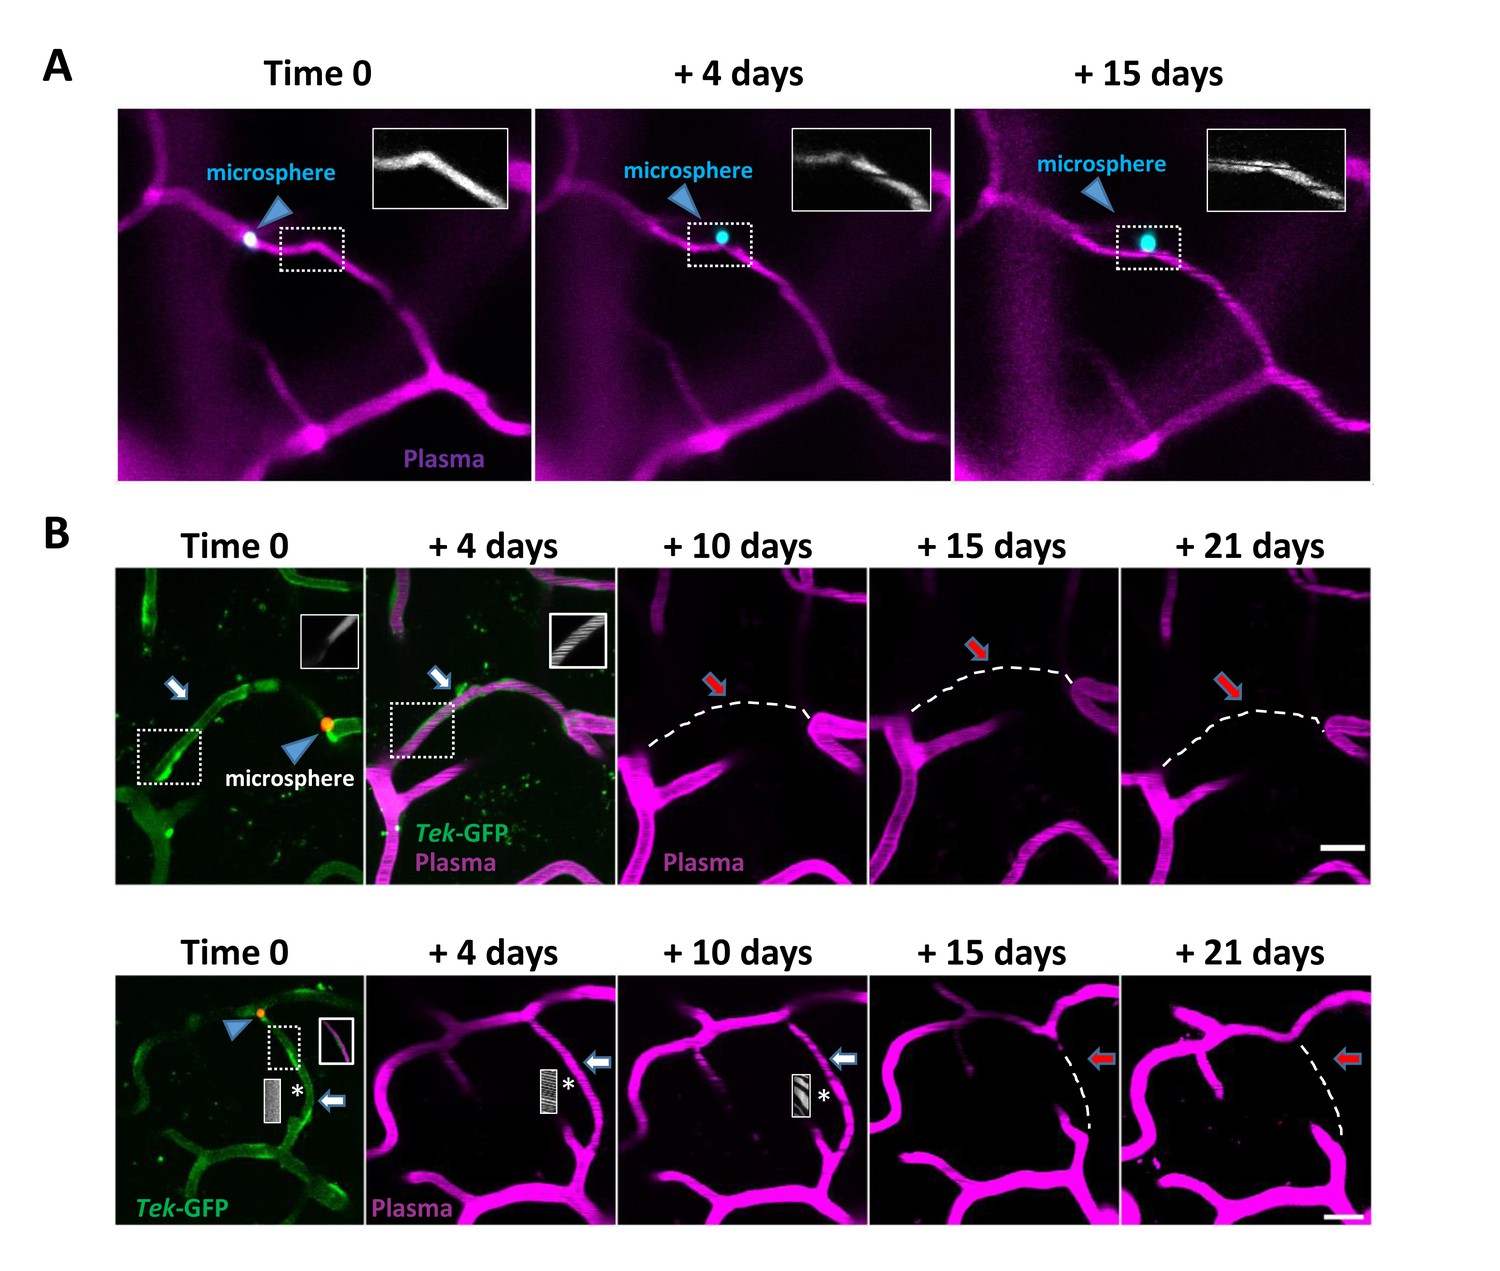
Additional examples of capillary recanalization and pruning.
(A) Recanalization through Angiophagy. At time 0 a microsphere (blue arrow head) obstructs flow in the capillary (insert shows plasma with no RBC streaks). At +4 days and +15 days the microsphere has been displaced adjacent to the capillary, and blood flow has returned (insert shows plasma with RBC streaks). Scale bar = 15 μm. (B) Additional examples of capillaries that recanalized but were still subsequently pruned. In both cases at time 0 the capillary (white arrow, GFP labelled endothelium shown) is obstructed with a microsphere (red, blue arrowhead). By 4 days the microsphere has been extruded back into the circulation and flow has been restored (magenta plasma, inserts show RBC streaks). By +10 days (top) or +15 days (bottom) the flowing capillary has been pruned (dashed line, red arrow). Both Scale bars 15 μm.
Figure 2—figure supplement 3
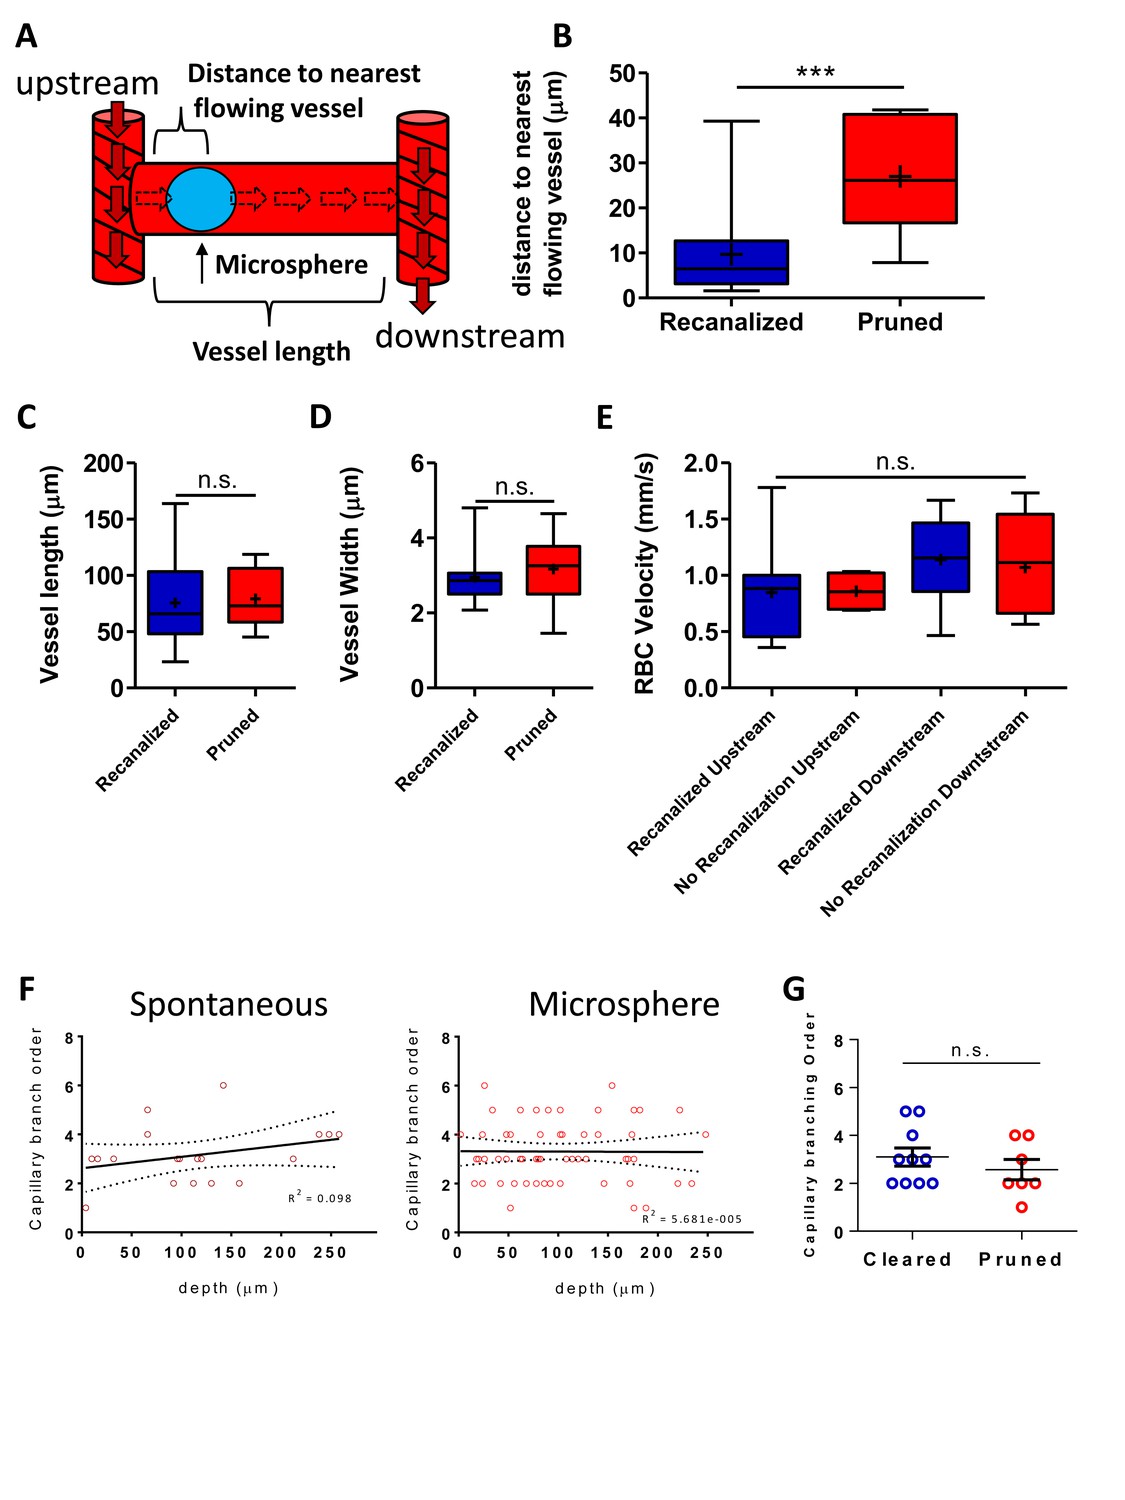
Recanalization correlates with obstruction location but not Local blood flow.
(A) Diagram of an occluded capillary and nomenclature. Measurements were recorded at time 0 and related with capillary outcome (recanalized or pruned) determined at the following imaging session (B) Box and whisker plots (+indicates mean) showing distance to nearest flowing capillary (closest branch point) at time 0 for obstructed capillaries that either recanalized or pruned [unpaired t-test t(40)=4.228, p<0.0001, n = 10 mice] C) Primary vessel length for recanalized or pruned capillaries (unpaired t-test t(43)=0.21, p=0.82, n = 10 mice). (D) Primary vessel width for recanalized or pruned capillaries (unpaired t(39)=0.96, p=0.33, n = 10 mice). (E) RBC velocity for capillaries upstream or downstream of obstructed vessel [one-way ANOVA, F(3,24)=0.90, p=0.45]. (F) Plot of branching order of spontaneous and microsphere obstructed capillaries versus depth from the pial surface. Branching order was invariant by depth [spontaneous obstructions: n = 18 capillaries, R2 = 0.098, F(1,17)=1.85, p=0.19; microsphere obstructions: n = 58 capillaries; R2 = 5.7×10⁻⁵, test of non zero slope: F(1,57)=0.003, p=0.95]. Dashed lines are 95% CI. (G) Obstructed capillary branch order was not different between recanalized and pruned capillaries [n = 10 and 7 obstructions per group; unpaired t(15)=0.91, p=0.37]. ***p<0.001, n.s. = not significant, p>0.05. Error bars are S.E.M.
Figure 2—figure supplement 4
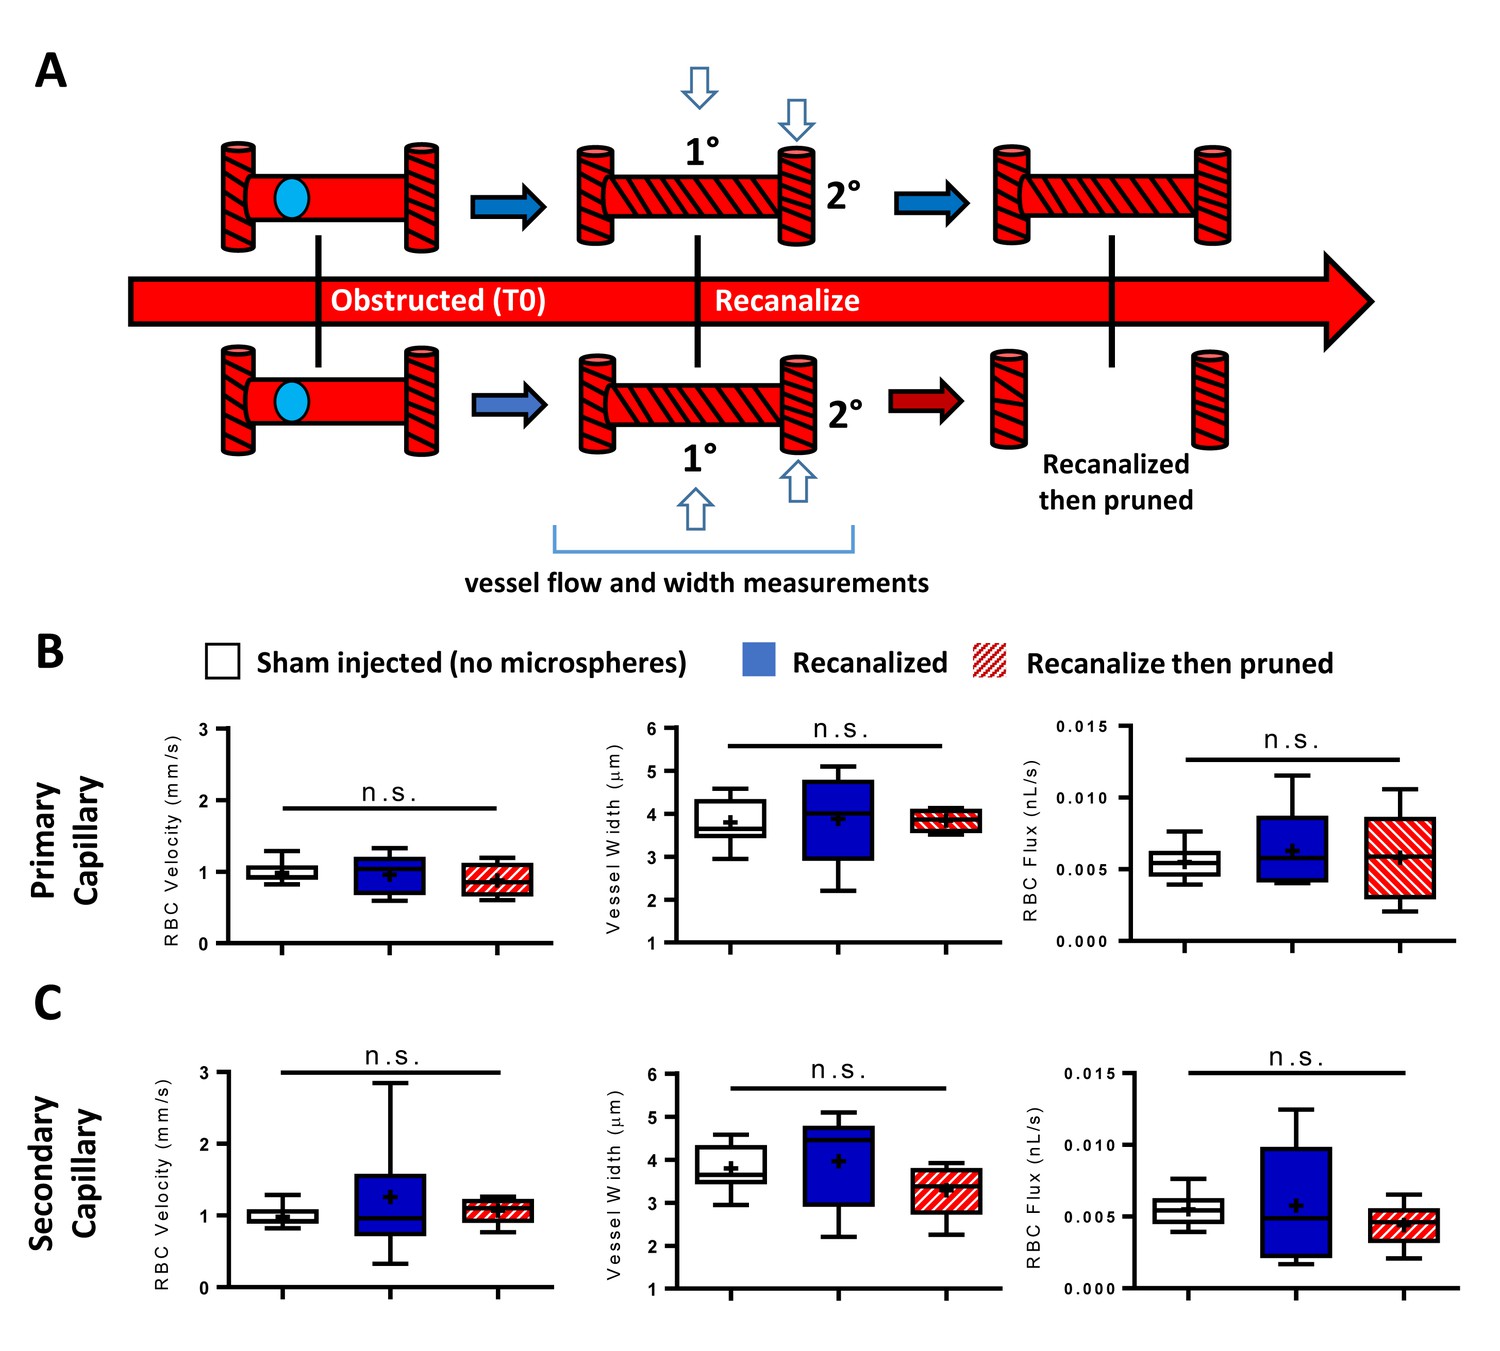
Blood flow in recanalized capillaries does not predict later pruning.
(A) Diagram summarizing the timing and location of measurements in primary and adjacent secondary capillaries. (B) Box and whisker plots (+is mean) for RBC velocity (left), vessel width (middle) and RBC flux (right) for primary capillaries (n = 4–10 vessels, one-way ANOVA all p>0.05). (C) RBC velocity (left), vessel width (middle) and RBC flux (right) for secondary capillaries (n = 6–15 vessels, 1 Way ANOVA all p>0.05). n.s. = not significant. Error bars are S.E.M.
Figure 2—figure supplement 5
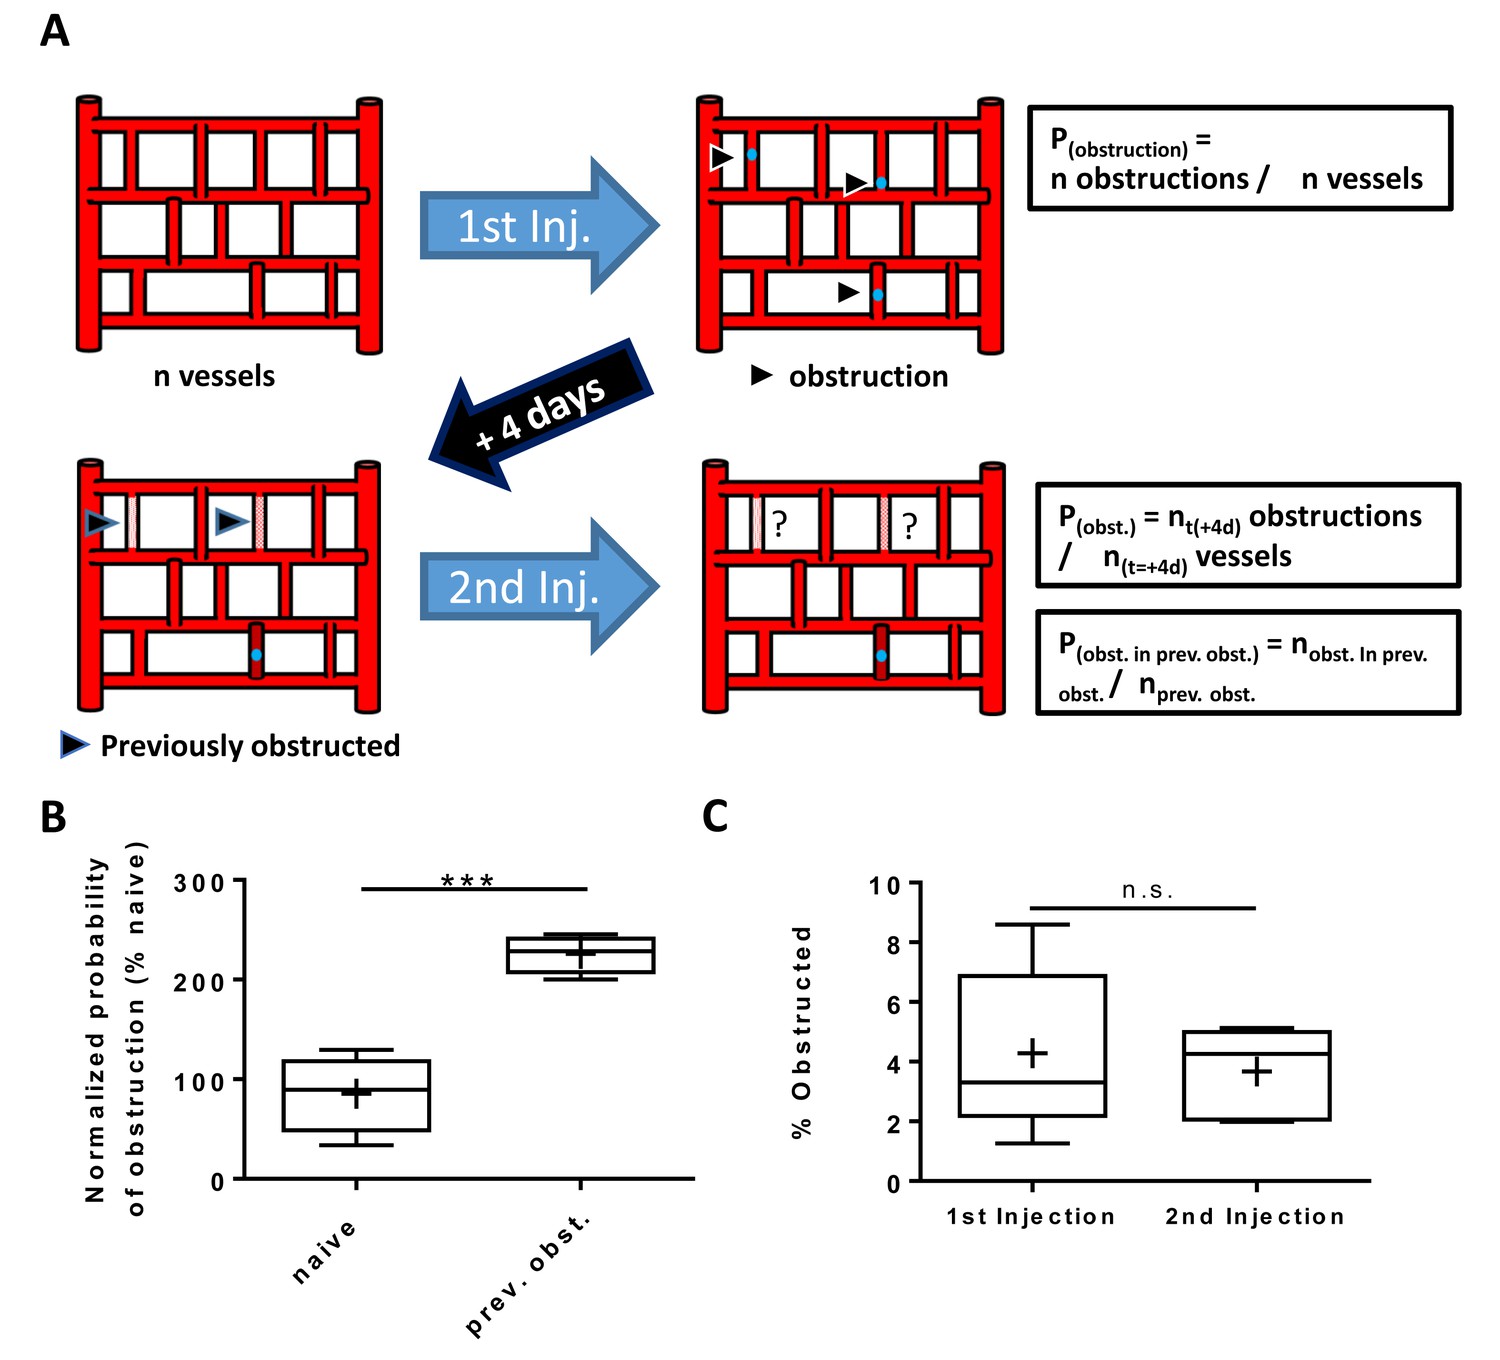
Obstructed capillaries that recanalized had a higher risk for subsequent obstruction.
(A) Cartoon summarizing experiment to determine if capillaries that were obstructed but regained blood flow were more likely to become obstructed following a second injection of microspheres, relative to naive unobstructed capillaries. (B) Box and whisker plot (plus sign is mean) show that the risk of obstruction in previously obstructed capillaries was over double that of naïve capillaries [n = 5 mice, 1–2 imaging areas. unpaired t-test t(10)=6.38, p=0.0007]. (C) Graph shows that both injections obstructed an equivalent number of capillaries. Average 1523 capillaries per mouse, range 739–2368. [Unpaired t(10)=0.42, p=0.68]. ***p<0.001, n.s. = not significant. Error bars are S.E.M.
Figure 2—video 1
Capillary recanalization through extruding microsphere back into the circulation.
Two-photon in vivo Imaging was done through chronically implanted cranial window (see Materials and methods) under urethane anesthetics, continuously in a single plane for up to 6 hr (40x NA = 0.8, 158.02 × 158.02 µm, 0.198 µm/pixel, 3.6 s per frame). Time stamp is from injection of microspheres (time 0).
Figure 2—video 2
Capillary recanalization through angiophagy.
3D projection of microsphere emboli extruded through the vessels wall (see Figure 2E) 10 days after microsphere injection. Microspheres is cyan, labeled flowing plasma is magenta.
Figure 3
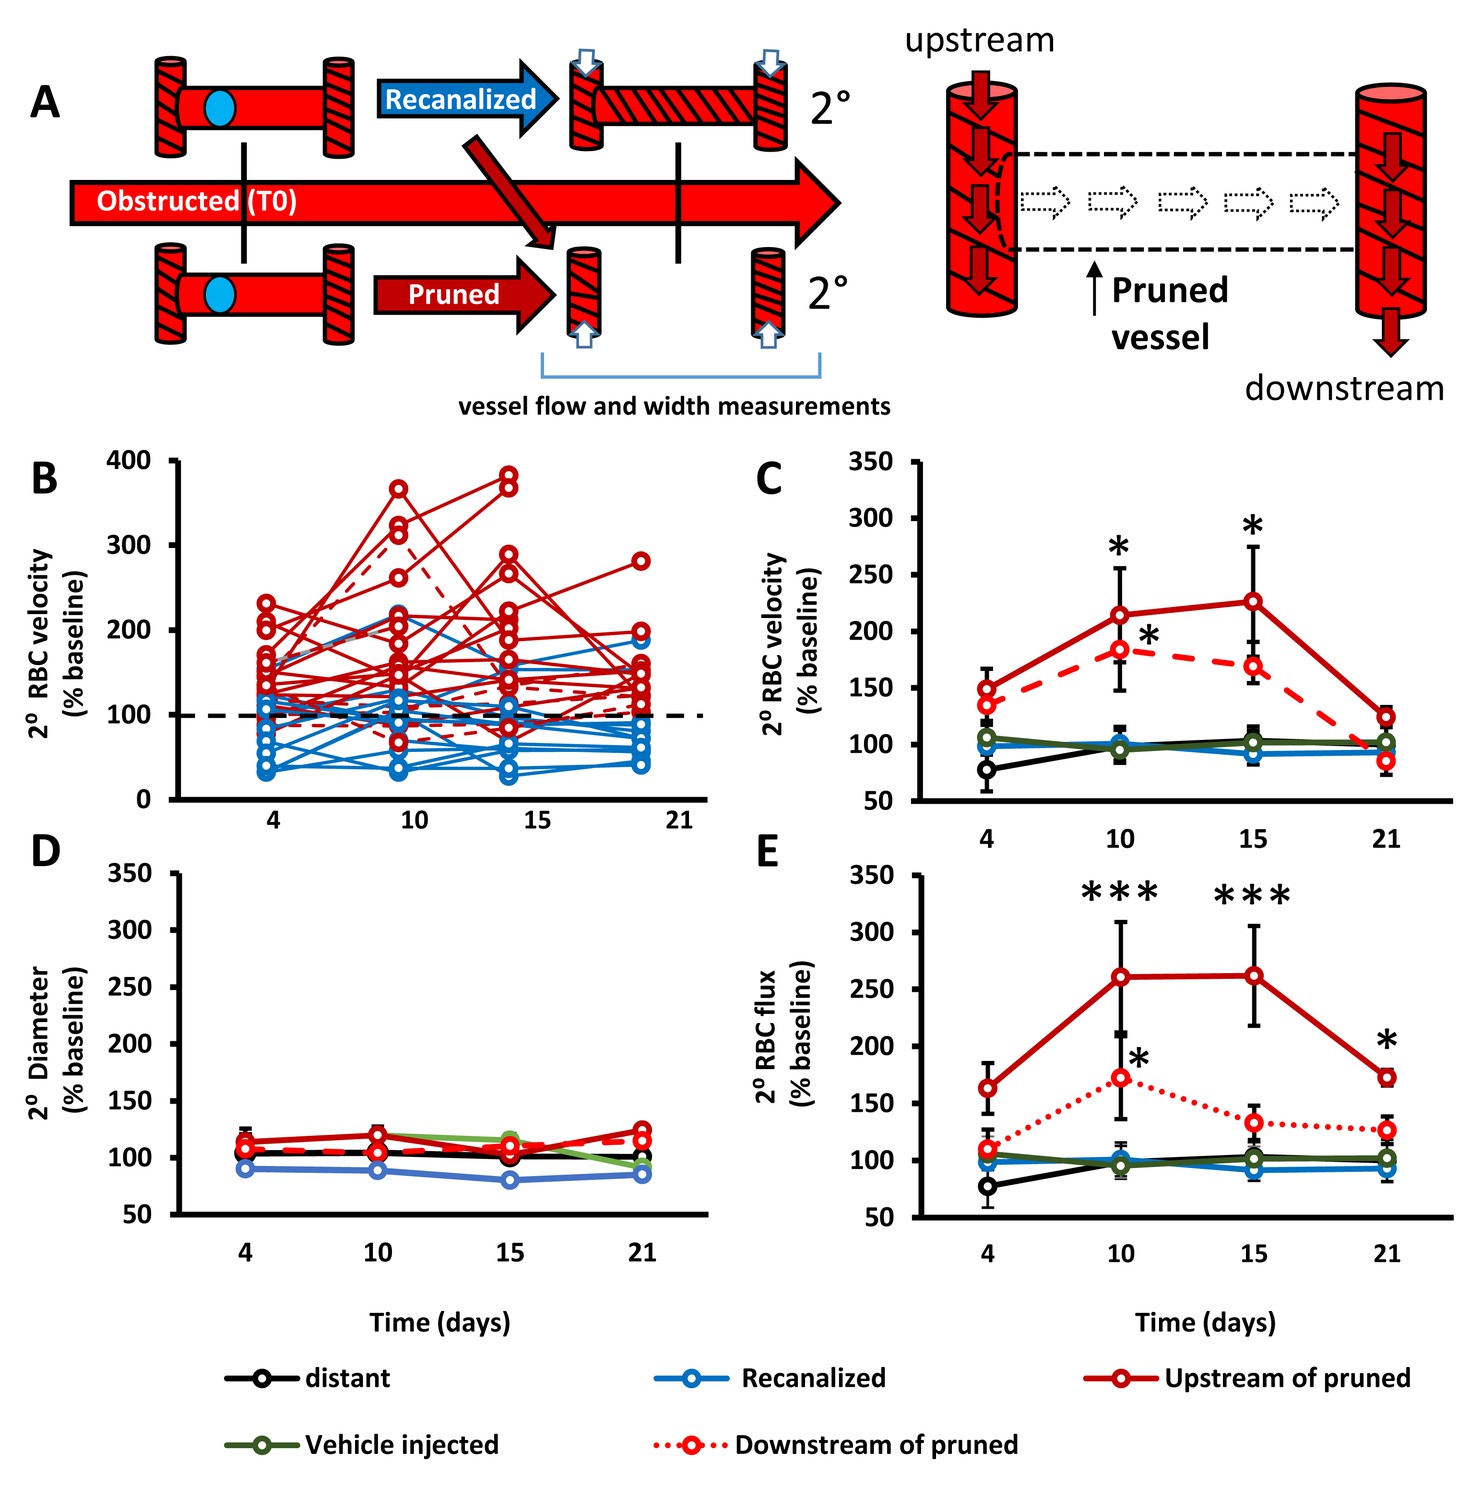
Capillary pruning leads to altered blood flow in adjacent connected capillaries.
A) Diagram summarizing measurements taken from secondary/adjacent (2°⁰) capillaries. (B) Plots show normalized RBC velocity from individual secondary capillaries after the primary segment recanalized (blue) or was pruned (solid or dashed red). C– -E) Graphs show mean normalized secondary RBC velocity (C); Main effect of Group F(4,151)=10.27, p<0.0001), diameter (D); Main effect of group F(4,118)=2.31, p=0.08) and RBC flux (E); Main effect of group F(4,68)=3.53, p=0.03) in the 5 groups of capillaries studied. Note that ‘vehicle injected’ refers to capillaries tracked from mice injected with just vehicle solution and no microspheres (green) and ‘distant vessels’ refers to capillaries that were distant to any microsphere obstructed capillaries (black) (defined as minimum of 2 branching points away from obstruction). n = 14 mice, 6–20 vessels per group. Average 11 capillaries per mouse, range 4–20. Individual time points followed up with unpaired t-test. *p<0.05 compared to vehicle injected, **p<0.01, ***p<0.001. Error bars are S.E.M.
Figure 4 with 1 supplement

Lower capillary density in aged mice is predicted by obstruction and pruning rates.
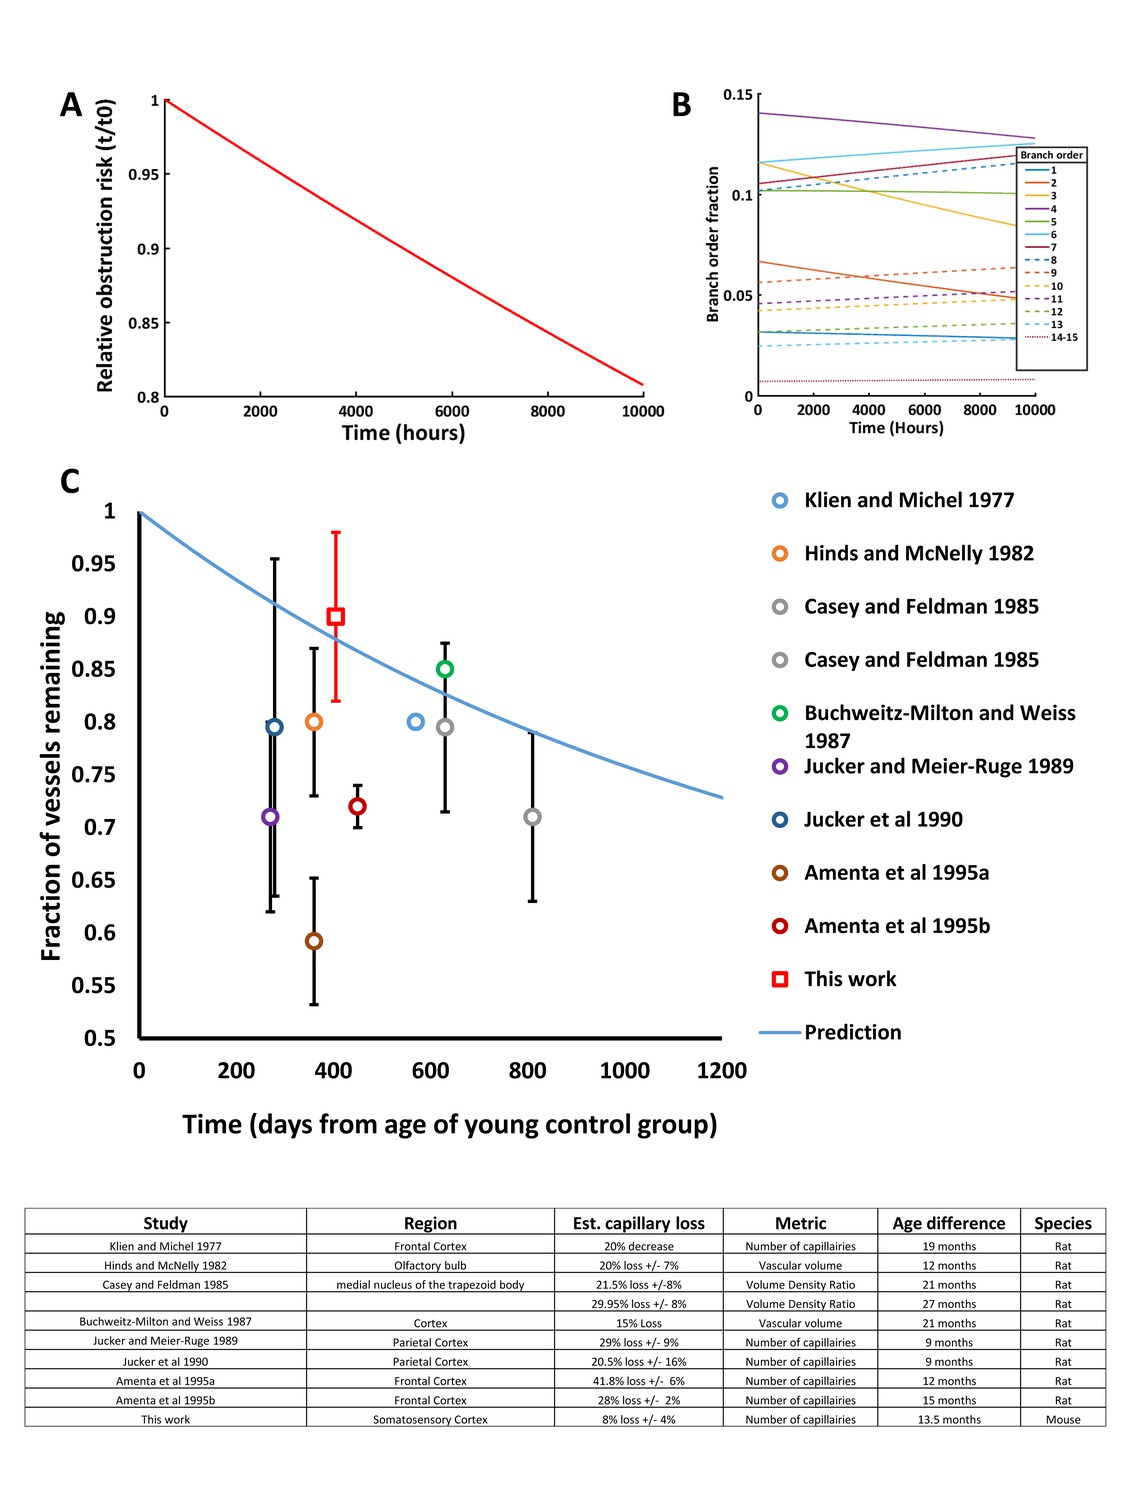
(A) Representative confocal images of Evans blue filled blood vessels in somatosensory cortex of young (3–4 month) and aged (15–18 month) mice. Scale bar 200 µm. (B) Box and whisker plot of capillary density (+denotes mean) across all cortical layers for 3–4 and 15–18 month old Tek-GFP mice (n = 6–7 mice; unpaired t(11)=2.47, p=0.03). Error bars are S.E.M. (C) Box and whisker plot of normalized cortical capillary density for 3–4 or 15–18 month old Tek-GFP mice (n(3-4month)=6, n(16-18month)=7 mice, unpaired t(11)=2.47, p=0.03). Error bars are S.E.M. (D) Predicted capillary loss over time (blue line) based on measured rates of spontaneous obstructions and pruning (see Materials and methods, Figure 4—figure supplement 1). Red data points and mean (±SEM) represent measured capillary loss in 15–18 month old aged mice normalized to 3–4 month old mice. Predicted capillary loss closely matched experimentally measured loss in aged mice (unpaired t-test, p=0.52).
Figure 4—figure supplement 1
Modeling capillary loss over time.
We modeled a hypothetical set of 100,000 capillaries, applying the proportional risk of obstruction (by branch order) and global risk (30%) of subsequent pruning every 2 hr. (A) Plot showing the relative risk of capillary obstruction decreased over time as at-risk capillaries were lost, leaving a higher proportion of less frequently obstructed capillaries (usually of higher branch orders). Note that this ignores possible changes in branch order due to pruning as capillaries were modeled independently with fixed branch orders. (B) Relative fraction of each capillary branch order over time. Over 10,000 hr the fraction of frequently obstructed capillaries were reduced while the number of rarely obstructed capillaries stayed constant and thus comprised a greater fraction over time. (C) Comparing our predicted and experimentally derived estimate of capillary loss to previous aging studies in rodents. Note that some previous studies used histochemical markers to label vasculature such as alkaline-phosphatase, which might decrease in aged animals’ independent of actual vessel less, leading to over-estimates of capillary loss. Data shown was calculated from published numbers in each study, ±S.D. when available.
Figure 5 with 2 supplements
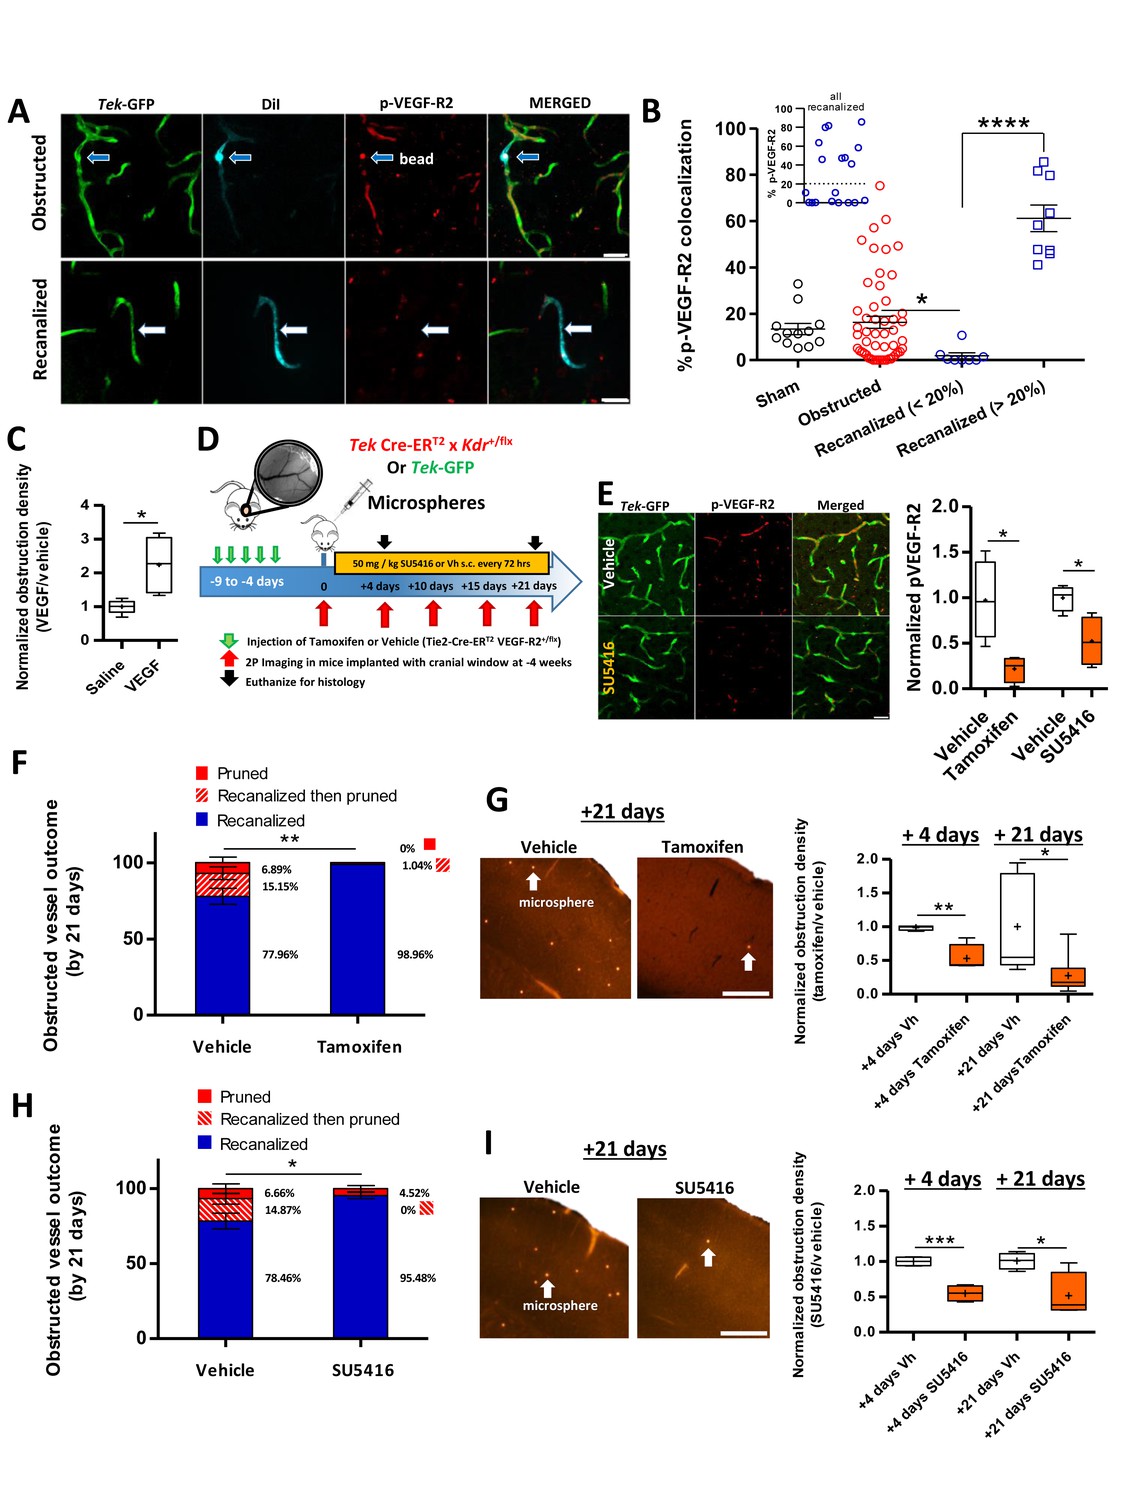
VEGF-R2 signaling dictates capillary recanalization.
(A) Confocal images show phosphorylated VEGF-R2 (Y1175) immunolabeling in an obstructed capillary (top row, see DiI-coated microsphere) and one that recanalized (bottom row, note DiI labeling of GFP-labeled endothelium without presence of microsphere). (B) Histogram shows % pVEGF-R2 colocalization with endothelium at the site of an obstructed or recanalized capillary 3 hr after microsphere injection. Sham capillaries were measured from mice injected with vehicle solution but without microspheres. Inset shows the distribution of pVEGF-R2 colocalization values for all recanalized capillaries. Based on this distribution, we used a 20% cut off (dotted line) to separate the two distinct populations. Average eight capillaries per mouse, range 5–11. Note that recanalized capillaries exhibit significantly higher or lower pVEGF-R2 colocalization. n = 83 vessels total with 3 sham and seven injected mice, one way ANOVA F(3,77)=22.93, p<0.0001, unpaired t-test to compare groups. *p<0.05, ****p<0.0001. (C) Box and whisker plots (+denotes mean) show normalized density of microspheres in the cortex of saline and VEGF injected (i.c.v.) mice 24 hr after microsphere injection. n = 5 mice per group, unpaired t-test. *p<0.05. Microsphere density: Vehicle 7.97 ± 1.3 per mm3 versus VEGF injected 22.27 ± 2.1 per mm3. (D) Summary and timeline of VEGF-R2 knockdown or inhibition experiments. E) Left: Immunolabeling for pVEGF-R2 in Tek-GFP mice shows reduced vascular expression 3 hr after injection of 50 mg/kg SU5416. Right: Quantification of vascular pVEGF-R2 in Tamoxifen-treated TekCreERT2 X Kdr+/fl mice [four mice per group; unpaired t-test, t(6)=3.32, p=0.01] or Tek-GFP mice injected with SU5416 [four mice per group; unpaired t-test t(6)=3.17, p=0.02]. (F) Capillary fates 21 days after obstruction in vehicle or tamoxifen treated Tek CreERT2 X Kdr+/fl mice based on in vivo time lapse imaging (n = 6 mice per group, vehicle = 75 capillaries, Tamoxifen = 81 capillaries, Average 10 capillaries per mouse, range 5–16). Unpaired t-test to compare % recanalized, t(10)=3.88, p=0.003.**p<0.01. G) Left: Representative images of cortical microspheres in coronal brain sections from vehicle or Tamoxifen-injected Tek CreERT2 X Kdr+/fl mice 21 days after microsphere injection. Scale bar 500 µm. Right: Normalized density of microspheres in the cortex of vehicle and Tamoxifen-injected mice at 4 and 21 days after microsphere injection (n = 4–9 mice; unpaired t-test at 4 days t(6)=4.43, p=0.004; and 21 days t(12)=2.74, p=0.017.+is mean. *p<0.05, **p<0.01). Microsphere densities (/mm3) at +4 days: Vehicle 16.2 ± 1.5, Tamoxifen injected 10.3 ± 5, +21 days: Vehicle 6.38 ± 3, Tamoxifen injected 1.5 ± 0.4. (H) In vivo determination of capillary fates after 21 days in vehicle or SU5416 injected Tek-GFP mice [n = 4 mice per group at 4 days, n = 5 for vehicle and n = 9 for tamoxifen injected at 21 days, vehicle = 84 capillaries; SU5416 = 90 capillaries; Average 20 capillaries per mouse, range 16–30, unpaired t(7)=2.73, p=0.03]. I) Left: Images show cortical microspheres in brain sections from vehicle and SU5416 treated Tek-GFP mice 21 days after microsphere injection. Scale bar 500 µm. Right: Normalized density of microspheres in the cortex of vehicle or SU5416 injected mice at 4 and 21 days [n = 4 mice per group; unpaired t-test at 4 days t(6)=6.97, p=0.004, and 21 days t(6)=2.92, p=0.02]. Microsphere densities (/mm3) at +4 days: Vehicle 69.2 ± 1.4, SU5416 injected 31.94 ± 4.2, +21 days: Vehicle 21.59 ± 5.3, SU5416 injected 12.21 ± 1.33. *p<0.05, **p<0.01, and ***p<0.001 compared to vehicle injected. Error bars are S.E.M.
Figure 5—figure supplement 1

Vascular-specific knockdown of VEGF-R2 does not affect cardiovascular health or blood flow.
(A) Left: Representative western blot of cortical VEGF-R2 levels in Tek CreERT2 X Kdr+/fl mice 4 days after the final injection of vehicle (Vh) or Tamoxifen (Tam). Right: Quantification of VEGF-R2 normalized to vehicle with β-Actin as a loading control [unpaired t-test t(8)=2.91, p=0.02; n = 5 mice per group]. (B–E) Measurements of heart rate (B), blood pressure (C), oxygen saturation (D) and breath rate (E) from control and Tamoxifen-treated Tek CreERT2 X Kdr+/fl mice. Since there was no main effect of time in any of these cardiovascular measurements, data collected at 8 and 21 days were pooled [n = 4 mice per group; one-way RM ANOVA p>0.05 for all measurements]. (F–H) Plots show RBC velocity in Tamoxifen or vehicle-treated Tek CreERT2 X Kdr+/fl mice in 3 types of capillaries: distant capillaries (F, ie. more than two branching points away from an obstructed capillary; Repeated Measures two way ANOVA: F(1,12)=4.44, p=0.06), recanalized capillaries [(G); Repeated Measures two way ANOVA: F(1,12)=0.27, p=0.61] and capillaries adjacent (secondary) to one that was recanalized [(H; Repeated Measures two way ANOVA: F(3,26)=1.61, p=0.21]. four mice per group, 8–17 vessels per group. *p<0.05. n.s. = not significant. Error bars are S.E.M.
Figure 5—figure supplement 2
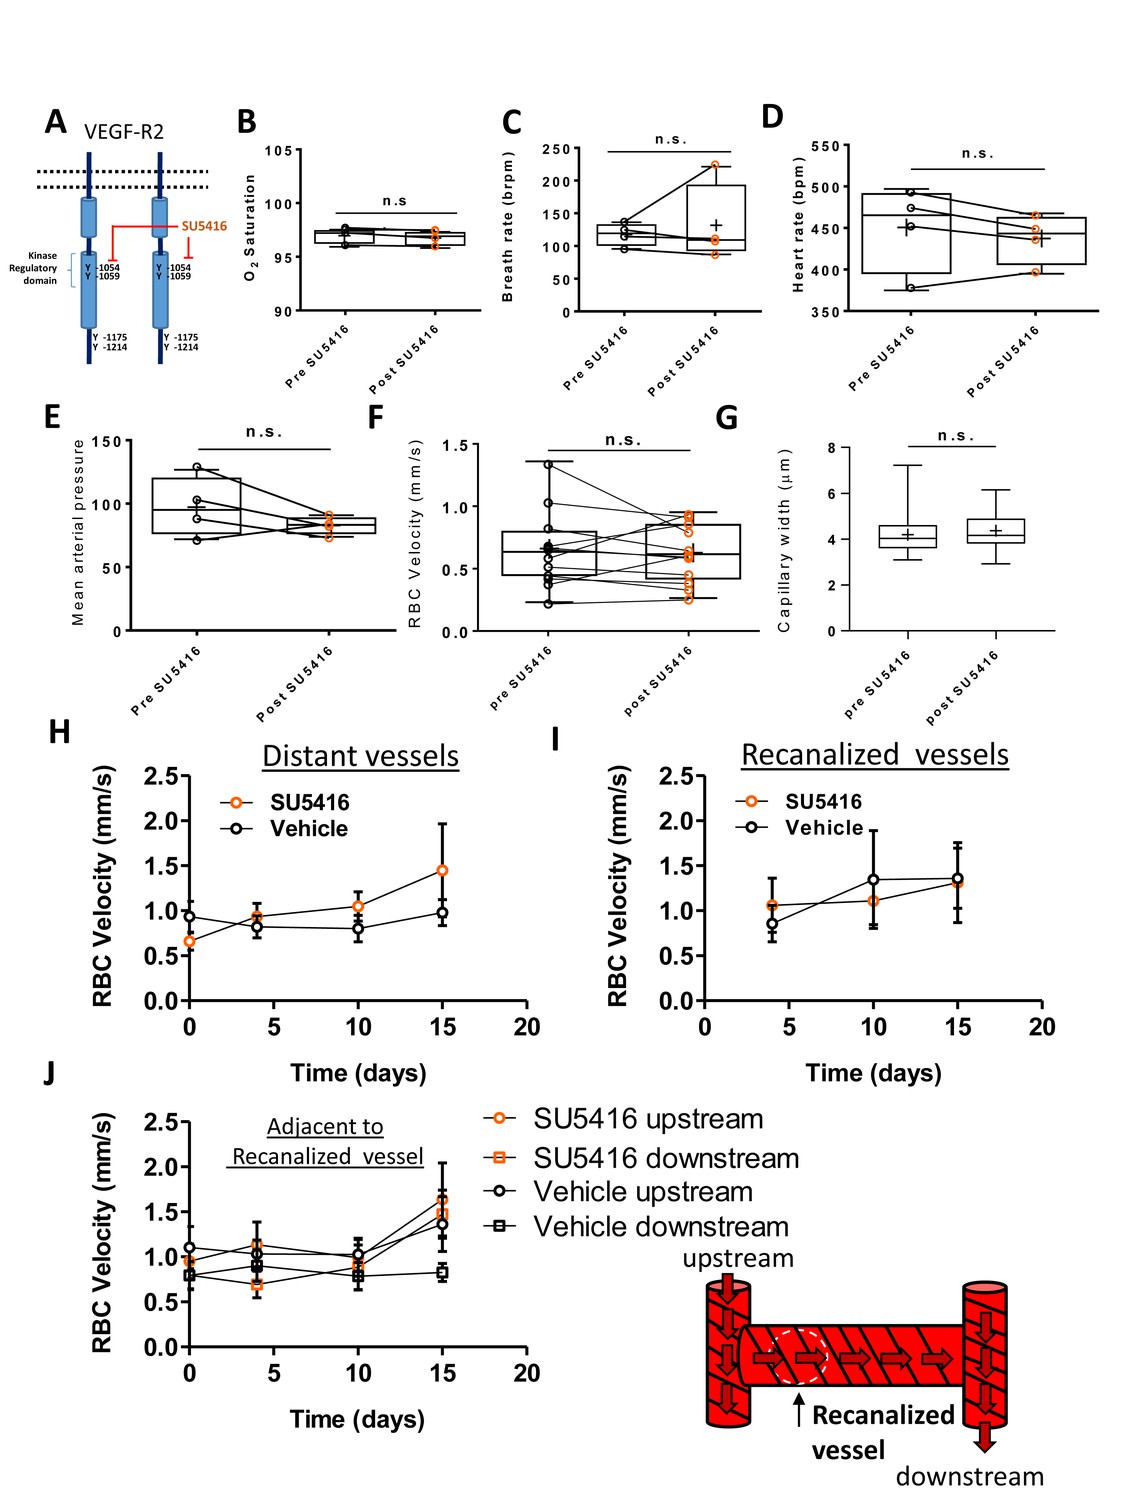
Inhibition of VEGF-R2 signaling with SU5416 did not affect cardiovascular health or blood flow.
(A) Schematic of VEGF-R2 dimer with phosphorylation sites shown and special emphasis on those inhibited by SU5416 (Olsson et al., 2006; Mendel et al., 2000). (B–F) SU5416 did not significantly alter oxygen saturation, breath rate, blood pressure, RBC velocity, or heart rate when measured 90 min after injection (n = 4–9 mice; all p>0.05 based on paired t-tests). (G:): Capillary width was not significantly different when comparing baseline values to 90 mins post-SU5416 injection. ( H–J) Plots show RBC velocity in SU5416 or vehicle injected mice in distant capillaries [(H; more than two branching points from an obstructed capillary; Main effect of Group based on repeated measures two-way ANOVA: F(1,15)=0.31, p=0.59], recanalized capillaries [(I); Main effect of group based on repeated measures two way ANOVA: F(1,16)=0.00, p=0.95] and those adjacent to a recanalized capillary [(J); Main effect of group based on repeated measures two-way ANOVA: F(3,75)=0.77, p=0.52]. Four mice per group, 8–11 vessels per group. Error bars are S.E.M.
Author response image 1
Tables
Key resources table
| Reagent type (species) or resource | Designation | Source or reference | Identifiers | Additional information |
|---|---|---|---|---|
| Gene | NA | |||
| Strain, strain background (Mus musculus) | Tek-GFP | The Jackson Laboratory | Tie2-GFP_JacksonLab:003658 (IMSR Cat# JAX:003658, RRID:IMSR_JAX:003658) | 2–4 month-old males, and 16–18 month old males and females used |
| Strain, strain background (M. musculus) | Kdrfl/fl | Drs. Jane Rossant and Andras Nagy (Forde et al., 2002) | 2–4 month-old males | |
| Strain, strain background (M. musculus) | Tek-CreERT2 | EMMA | Tie2-CreERT2_EMMA:00715 | 2–4 month-old males |
| Genetic reagent (M. musculus) | Tek-CreERT2 X Kdr+/fl | in house breeding (Mendel et al., 2000) | Tek-CreERT2 mice (Langdon et al., 2017) (EMMA 00715) bred with Kdrfl/fl line (Forde et al., 2002) | |
| Cell line | ||||
| Transfected construct | ||||
| Biological sample | ||||
| Antibody | pVEGF-R2 | Cell Signaling | 19A10 Rabbit mAb #2478 | (1:300) For IHC |
| Antibody | Cy5 conjugated secondary | Invitrogen | A10523 | (1:400) For IHC |
| Antibody | VEGF-R2 | Cell Signaling | CS2479s | (1:1000) For WB |
| Antibody | β-actin | Sigma | A-5441 | (1:2000) For WB |
| Antibody | Goat anti-rabbit IgG-HRP | Cell Signaling | 7074S | (1:1000) For WB |
| Antibody | goat anti-mouse IgG-HRP | KPL | (Riddle et al., 2003; Kleinfeld et al., 1998; Santisakultarm et al., 2014; Villringer et al., 1994;Erdener et al., 2017; Gould et al., 2017; Mann et al., 1986;Klein and Michel, 1977;Hinds and McNelly, 1982;Casey and Feldman, 1985; Buchweitz-Milton and Weiss, 1987;Jucker et al., 1990; Amenta et al., 1995a; Tong and Hamel, 2015;Reeson, 2018) | (1:1000) For WB |
| Recombinant DNA reagent | ||||
| Sequence-based reagent | floxed Kdr Wildtype | Integrated DNA Technologies (IDT) | 5’-TGG-AGA-GCA-AGG-CGC-TGC-TAG-C-3’ | 30 μM |
| Sequence-based reagent | floxed Kdr Flx | Integrated DNA Technologies (IDT) | 5’-CCC-CCT-GAA-CCT-GAA-ACA-TA-3’ | 30 μM |
| Sequence-based reagent | floxed Kdr Common | Integrated DNA Technologies (IDT) | 5’-CTT-TCC-ACT-CCT-GCC-TAC-CTA-G-3’ | 30 μM |
| Sequence-based reagent | Cre Fwd | Integrated DNA Technologies (IDT) | 5’-CGA-GTG-ATG-AGG-TTC-GCA-AG-3’ | 30 μM |
| Sequence-based reagent | Cre Rev | Integrated DNA Technologies (IDT) | 5’-TGA-GTG-AAC-GAA-CCT-GGT-CG-3’ | 30 μM |
| Peptide, recombinant protein | VEGF165 protein | Sigma | V4512 | 1 µL of 25 ng in artificial cerebrospinal fluid |
| Commercial assay or kit | BCA protein assay | Pierce | #23225 | 562 nm absorbance |
| Chemical compound, drug | BioRad Clarity Western ECL Substrate | BioRad | Cat# 107–5061 | |
| Chemical compound, drug | microspheres (4 μm diameter) | Life Technologies | F8858 | 2% solids; peak emission 605 nm |
| Chemical compound, drug | Rhodamine B dextran | Sigma | R9379 | 4%, average molecular weight 70,000, in 0.9% saline |
| Chemical compound, drug | FITC dextran | Sigma | 46945 | 4%, average molecular weight 70,000, in 0.9% saline |
| Chemical compound, drug | Evans blue | Sigma | E2129 | 2% in 0.9% saline |
| Chemical compound, drug | Tamoxifen | Sigma | T5648 | five daily intraperitoneal injections of 125 mg/kg dissolved in corn oil, Sigma, C8267 |
| Chemical compound, drug | SU5416 | Tocris | Cat# 3037 | 50 mg/kg, 0.5% w/v carboxy methyl cellulose, 0.9% sodium chloride, 0.4% polysorbate, 0.9% benzyl alcohol in dH2O |
| Chemical compound, drug | Hoechst 33342 | Thermoscientific | CA#62249 | (1/10,000) |
| Chemical compound, drug | DiI | Thermoscientific | CA#D282 | 30 mg DiI dissolved in 5 mL 100% EtOH |
| Software, algorithm | Fluoview | Olympus | FV10-ASW 4.2 | |
| Software, algorithm | FIJI | Max Planck Institute of Molecular Cell Biology and Genetics 58) | (Fiji, RRID:SCR_002285) | |
| Software, algorithm | ImageJ | Wayne Rasband, NIH USA | ImageJ 1.47 v (National Center for Microscopy and Imaging Research: ImageJ Mosaic Plug-ins, RRID:SCR_001935) | |
| Software, algorithm | MATLAB | Mathworks | R2017a (MATLAB, RRID:SCR_001622) | Institutional Licence |
| Software, algorithm | VesselNumEst | This paper | Source code 1 | Runs as macro in ImageJ, available at https://github.com/ preeson/eLIFE2018-Software (copy archived at https://github.com/elifesciences-publications/eLIFE-2018-Software-Reeson) |
| Software, algorithm | Capillary Loss Modeling | This paper | Source Code 2 | Runs in MATLAB with Database S1 as input, available at https://github.com/ preeson/eLIFE2018-Software (copy archived at https://github.com/elifesciences-publications/eLIFE-2018-Software-Reeson) |
| Other |
Additional files
-
Source code 1
Macro to estimate number of capillaries in 2 P imaging stacks.
Code can be executed in either Fiji or ImageJ. It is run on imaging groups of stacks of vasculature in the horizontal plane (x,y,z, stacks). Output is file with % of vascular pixels for each sub stack as well as number of vascular length pixels.
- https://doi.org/10.7554/eLife.33670.021
-
Source code 2
Modelling of capillary loss over time based on experimental data.
Code is run in Matlab. Program opens an excel sheet (Data Reeson, 2018) with branch order distribution and assigned risk of obstruction (see methods, Figure 4 and Figure 4—figure supplement 1). Output is capillary numbers (by branch order), absolute and relative risk of obstruction and fractional distribution of branch orders, over time.
- https://doi.org/10.7554/eLife.33670.022
-
Supplementary file 1
Mod_data excel file, loads into Source Code two to model obstruction risk across branch orders based on the experimentally determined distribution of spontaneous obstructed capillaries.
- https://doi.org/10.7554/eLife.33670.023
-
Supplementary file 2
PDF instructions relating to Source code 2.
- https://doi.org/10.7554/eLife.33670.024
-
Transparent reporting form
- https://doi.org/10.7554/eLife.33670.025
Download links
A two-part list of links to download the article, or parts of the article, in various formats.
Downloads (link to download the article as PDF)
Open citations (links to open the citations from this article in various online reference manager services)
Cite this article (links to download the citations from this article in formats compatible with various reference manager tools)
VEGF signaling regulates the fate of obstructed capillaries in mouse cortex
eLife 7:e33670.
https://doi.org/10.7554/eLife.33670


