Control of endothelial cell polarity and sprouting angiogenesis by non-centrosomal microtubules
- Utrecht University, Netherlands
- University of Liège, Belgium
Figures
Figure 1 with 2 supplements
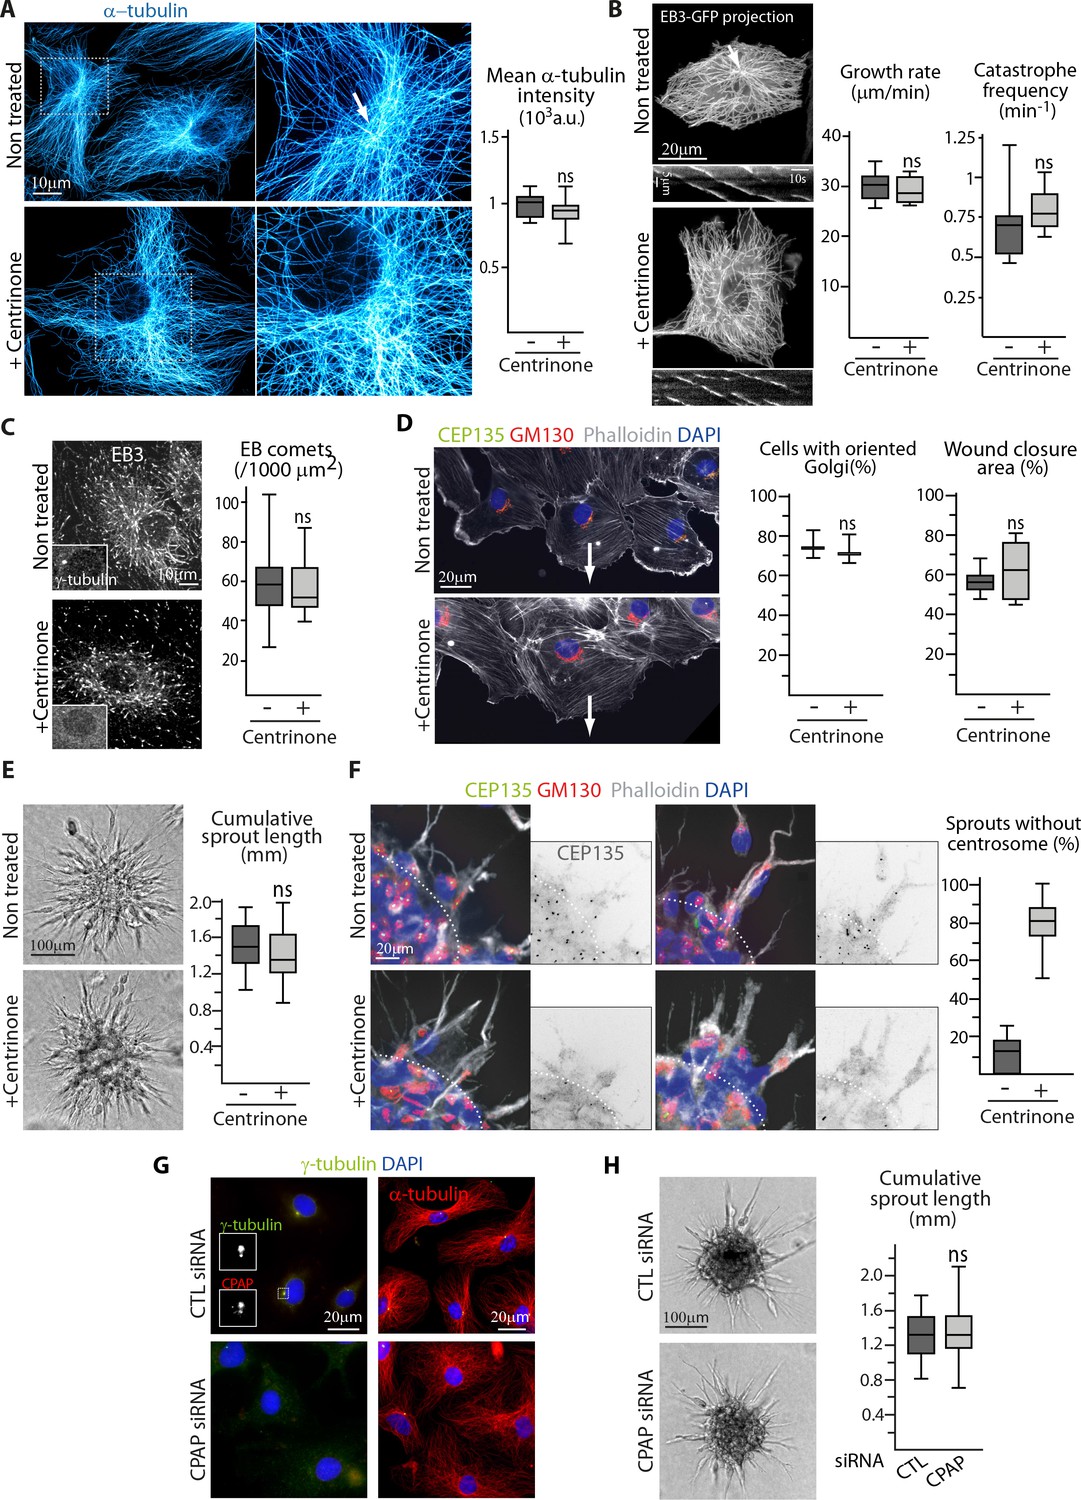
The centrosome is not essential for angiogenic migration and sprouting.
(A) Imaging of control or centrinone-treated HUVECs stained for MT (α-tubulin, cyan hot) using STED microscopy. Arrow points toward the centrosome and the plot shows the average fluorescence intensity of α-tubulin, n = 25 cells for each condition. (B,C) Analysis of MT plus ends in control or centrinone-treated HUVECs illustrated by maximum intensity projections and kymographs of EB3-GFP live fluorescence imaging (B) and EB3 staining (C). Plots show MT growth rate and catastrophe frequency, n = 96 tracks in 8 cells per condition (B), and the density of EB3 comets, n = 19 and 20 cells (C). Arrow points toward the centrosome. (D,F) Controlorcentrinone-treated HUVECs during a 2D monolayer wound healing assay (D) or during sprouting from a 3D spheroid (F) in the presence of thymidine, stained for the centriolar marker CEP135 (green), Golgi marker GM130 (red), F-actin (phalloidin, white) and DNA (DAPI, blue). Arrows point toward the wound in (D), and the dashed line indicates the position of the spheroid body in (F). Z-maximum projections of confocal images are shown on the left; the plot shows the proportion of cells with oriented Golgi, defined as being contained in the 90˚ sector facing the wound, n = 3 experiments including 158 and 132 cells in total, and quantification of the percentage of wound closure after 8 hr, n = 8 fields in two independent experiments for each condition (D) or the proportion of cellular sprouts devoid of centrosome, n = 10 spheroids representing 60 and 47 sprouts (F). (E,H) Spheroid sprouting assay with control, centrinone- (E) or CPAP siRNA-treated HUVECs (H) in the presence of thymidine. Representative micrographs are shown on the left; the plot shows quantification of the cumulative length of all sprouts per spheroid, n = 59 and 61 spheroids in four independent experiments (E) and n = 62 spheroids per condition in three independent experiments (H). (G) Staining of HUVECs transfected with control or CPAP siRNA for γ-tubulin (green), CPAP (red, left), MT (α-tubulin, red, right) and DNA (DAPI, blue). Data are shown using box plots; ns, no significant difference using Mann-Whitney U test (A,B,C, right plot in D) E or Student’s unpaired two-tailed t-test (left plot in D).
-
Figure 1—source data 1
An Excel sheet with numerical data on the quantification of the effect of centrinone treatment on the EC mean intensity of α-tubulin signal, MT dynamics parameters, EB comet number, the polarization of Golgi during migration, the efficiency of wound closure, the cumulative length of spheroid sprouts and the proportion of sprouting ECs with centrosome as well as the effect of CPAP depletion on the cumulative length of spheroid sprouts represented as plots in Figure 1A–F,H.
- https://doi.org/10.7554/eLife.33864.006
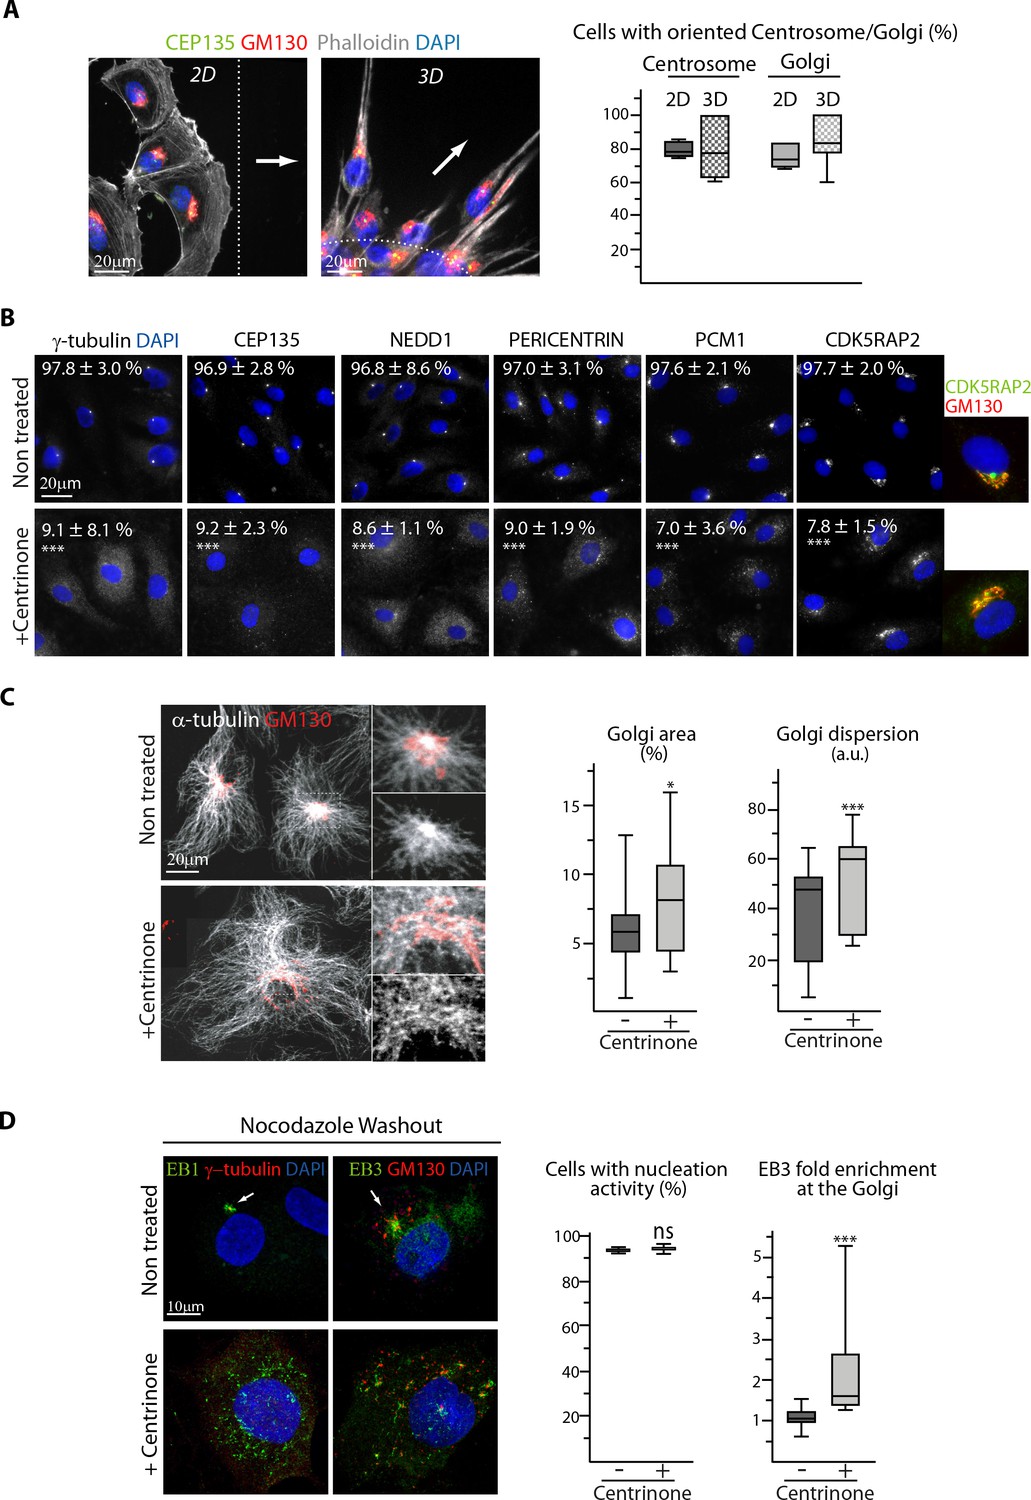
Figure 1—figure supplement 1
The centrosome is not essential for angiogenic migration and sprouting.
(A) Staining of HUVECs during wound healing assay (2D, wide-field fluorescence image) and spheroid sprouting (3D, Z-maximum projection of confocal fluorescence images) for the centriolar marker CEP135 (green), Golgi marker GM130 (red), F-actin (phalloidin, white) and DNA (DAPI, blue). Arrows represent the direction of migration or sprouting and the dashed line underlines the position of the wound or the spheroid body, the plot shows the proportion of cells with oriented centrosome or Golgi, defined as being contained in the 90˚ sector facing the wound in 2D and as having their centrosome positioned further away than the half of the nucleus or their Golgi jutting out more than 50% of their surface area in front of the nucleus in 3D. n = 4 and 6 experiments including 43 and 248 cells in total for 2D, and n = 13 and 19 spheroids including 70 and 112 sprouts for 3D. The data for the centrosome in control 2D cells are the same as in Figure 5—figure supplement 1A, and the Golgi in control 2D cells are pooled control data represented in Figure 1D and Figure 6—figure supplement 1D. (B) Staining for centriolar and PCM proteins (white) and DNA (DAPI, blue) in control or centrinone-treated HUVECs. Co-staining for Golgi (GM130, red) is additionally shown for CDK5RAP2. The proportion of centrosome-containing HUVECs based on each staining is indicated, n = 4 independent experiments including 156 and 134 cells (γ-tubulin), and three experiments including 94 and 77 cells (CEP135), 80 and 89 cells (NEDD1), 91 and 87 cells (Pericentrin), 92 and 93 cells (PCM1) and 84 and 90 cells (CDK5RAP2). (C) Staining of control or centrinone-treated HUVECs for α-tubulin (white) and GM130 (red). Z-maximum projections of confocal images and quantification of Golgi area (proportion of Golgi-occupied cell area) and dispersion (the standard deviation of GM130 signal normalized to the square root of the average signal) are shown, n = 35 and 33 cells in two independent experiments. (D) Staining of control or centrinone-treated HUVECs for EB1 or EB3 (green), centrosome or Golgi (γ-tubulin or GM130, red) and DNA (DAPI, blue) 1.5 min after nocodazole washout. Z-maximum projections of confocal images and quantification of the proportion of cells with visible EB1 and EB3 signal, n = 89 and 85 cells in three independent experiments, and the fold enrichment (ratio between the average EB3 intensity around Golgi mini-stacks and the average EB3 intensity in the cytoplasm) of EB3 at the Golgi are shown, n = 20 cells for each condition. Arrows point the centrosome. Data are shown using box plots and mean ±SD for B; Mann-Whitney U test (C,D-right plot), Student’s unpaired two-tailed t-test (B, D-left plot, E): ***p<0.001, *p<0.05, ns, no significant difference.
-
Figure 1—figure supplement 1—source data 1
An Excel sheet with numerical data on the quantification of the polarization of Golgi and centrosome during 2D migration and 3D sprouting as well as of centrosome removal efficiency using different (peri)centriolar markers, Golgi area and dispersion and MT nucleation activity and EB3 Golgi enrichment after nocodazole washout after centrinone treatment represented as plots (or as mean value ± SD for 1B) in Figure 1—figure supplement 1A–D.
- https://doi.org/10.7554/eLife.33864.007
Figure 1—figure supplement 2
The centrosome is not essential for angiogenic migration and sprouting.
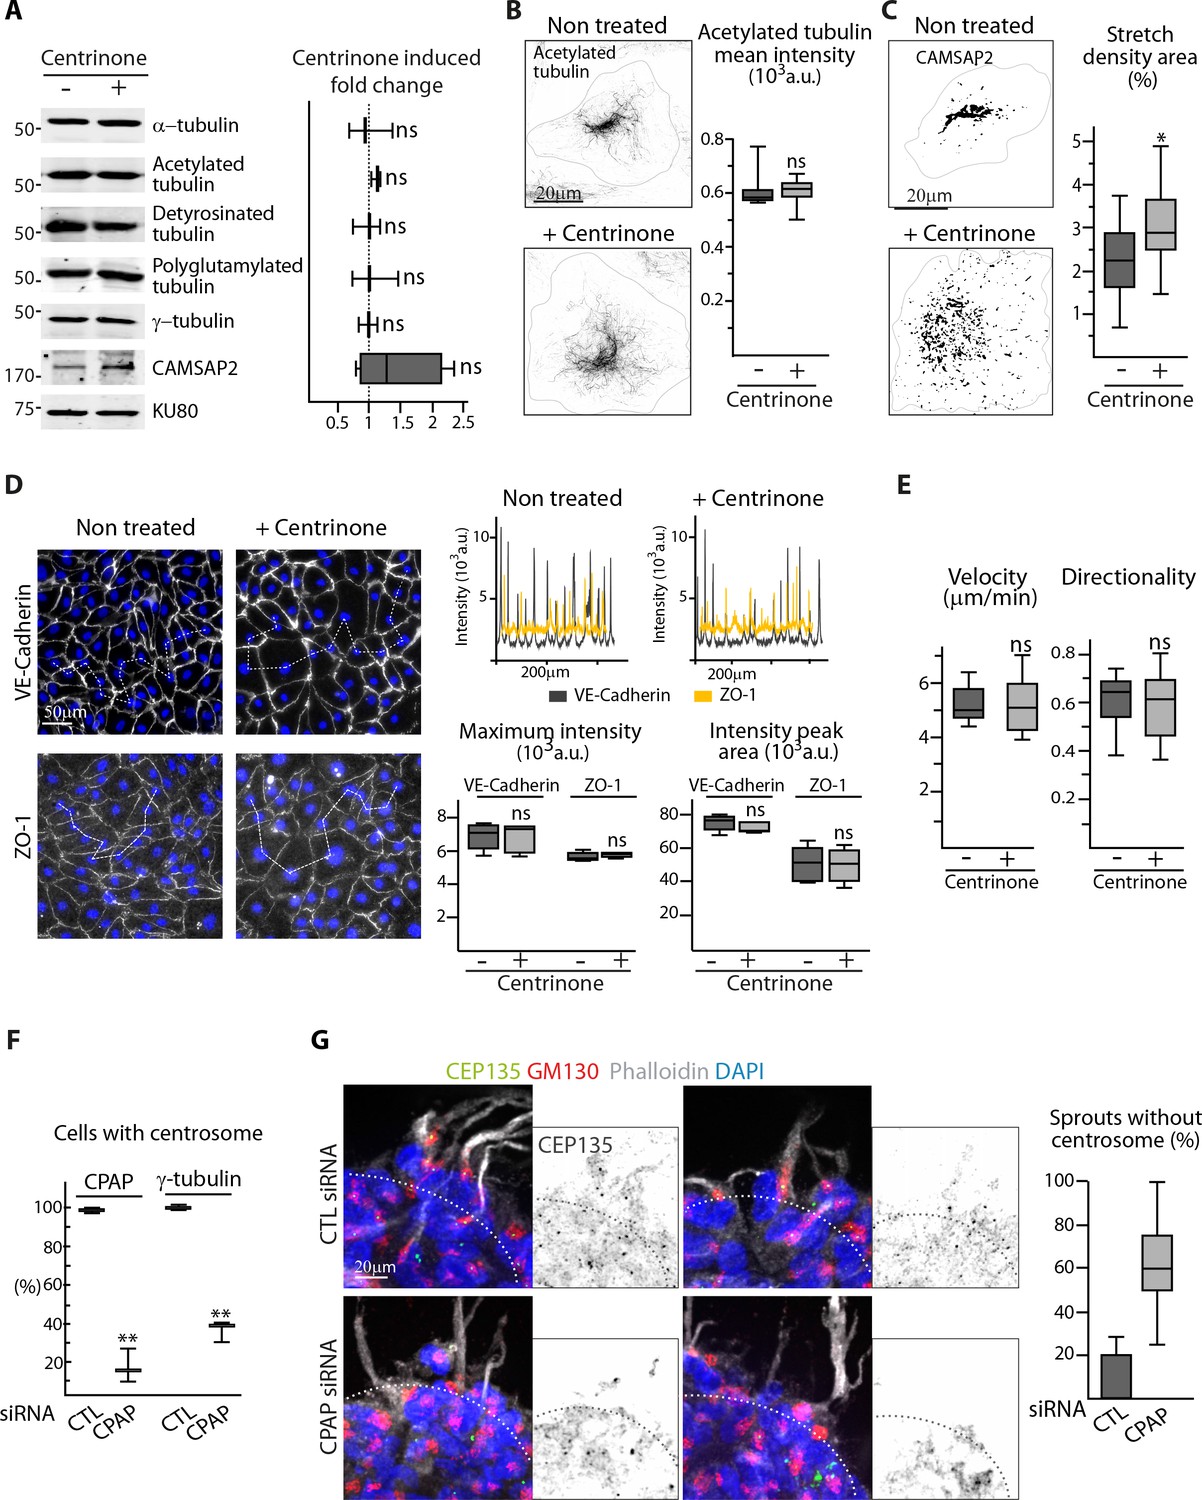
(A) Western blots of total extract from HUVECs treated or not treated with centrinone were used to quantify the levels of α-tubulin and CAMSAP2 protein expression as well as of tubulin post-translational modifications (acetylated, detyrosinated and polyglutamylated tubulin); Ku80 antibody was used as loading control, n = 3 independent experiments and n = 4 for CAMSAP2. (B,C) Staining of control or centrinone-treated HUVECs for acetylated MT (B) or CAMSAP2 (C). Z-maximum projections of STED (B) or thresholded (C) confocal images and quantification of the average fluorescence intensity of acetylated tubulin (B), n = 25 cells for each condition, and of the proportion of CAMSAP2-occupied cell area (C), n = 20 cells for each condition, are shown. (D) VE-Cadherin and ZO-1 stainings were used for analyzing cell-cell junctions in control or centrinone-treated HUVECs. Fluorescence intensity profiles across cell-cell junctions (dashed line) were plotted (one example is shown in the top right for VE-Cadherin in grey and ZO-1 in yellow) and used to quantify the average maximum signal intensity and peak area, n = 307 and 326 junctions (VE-Cadherin) and 222 and 159 junctions (ZO-1) in five different fields. (E) Cell tracking analysis was performed on phase-contrast live images to quantify the velocity and the directionality of cell movement during wound healing assay with control or centrinone-treated HUVECs, n = 20 cells in two independent experiments for each condition. (F) The proportion of centrosome-containing HUVECs was calculated in cells transfected with control or CPAP siRNA (as in Figure 1G) based on CPAP or γ-tubulin staining in 89 and 84 cells (CPAP) and 593 and 485 cells (γ-tubulin) in three independent experiments. (G) Control or CPAP siRNA-treated HUVECs during sprouting from a 3D spheroid in the presence of thymidine stained for the centriolar marker CEP135 (green), Golgi marker GM130 (red), F-actin (phalloidin, white) and DNA (DAPI, blue). Z-maximum projections of confocal images are shown on the left, the dashed line indicates the position of the spheroid body; the plot shows the proportion of cellular sprouts devoid of centrosomes, n = 9 and 15 spheroids representing 53 and 64 sprouts. Data are shown using box plots; Mann-Whitney U test (B,C,D,E), Student’s unpaired two-tailed t-test (A, F): ***p<0.001, *p<0.05, ns, no significant difference.
-
Figure 1—figure supplement 2—source data 1
An Excel sheet with numerical data on the quantification of the effect of centrinone treatment on the expression of CAMSAP2 and various post-translationally modified tubulin in ECs, the mean intensity of acetylated tubulin signal, the density of CAMSAP2 stretches, the intensity of VE-Cadherin and ZO-1 signal at cell junctions, the velocity and directionality of cell migration during scratch-wound assays, as well as the effect of CPAP depletion on centrosome removal efficiency and the proportion of 3D sprouting ECs with centrosome represented as plots in Figure 1—figure supplement 2A–G.
- https://doi.org/10.7554/eLife.33864.008
Figure 2 with 2 supplements
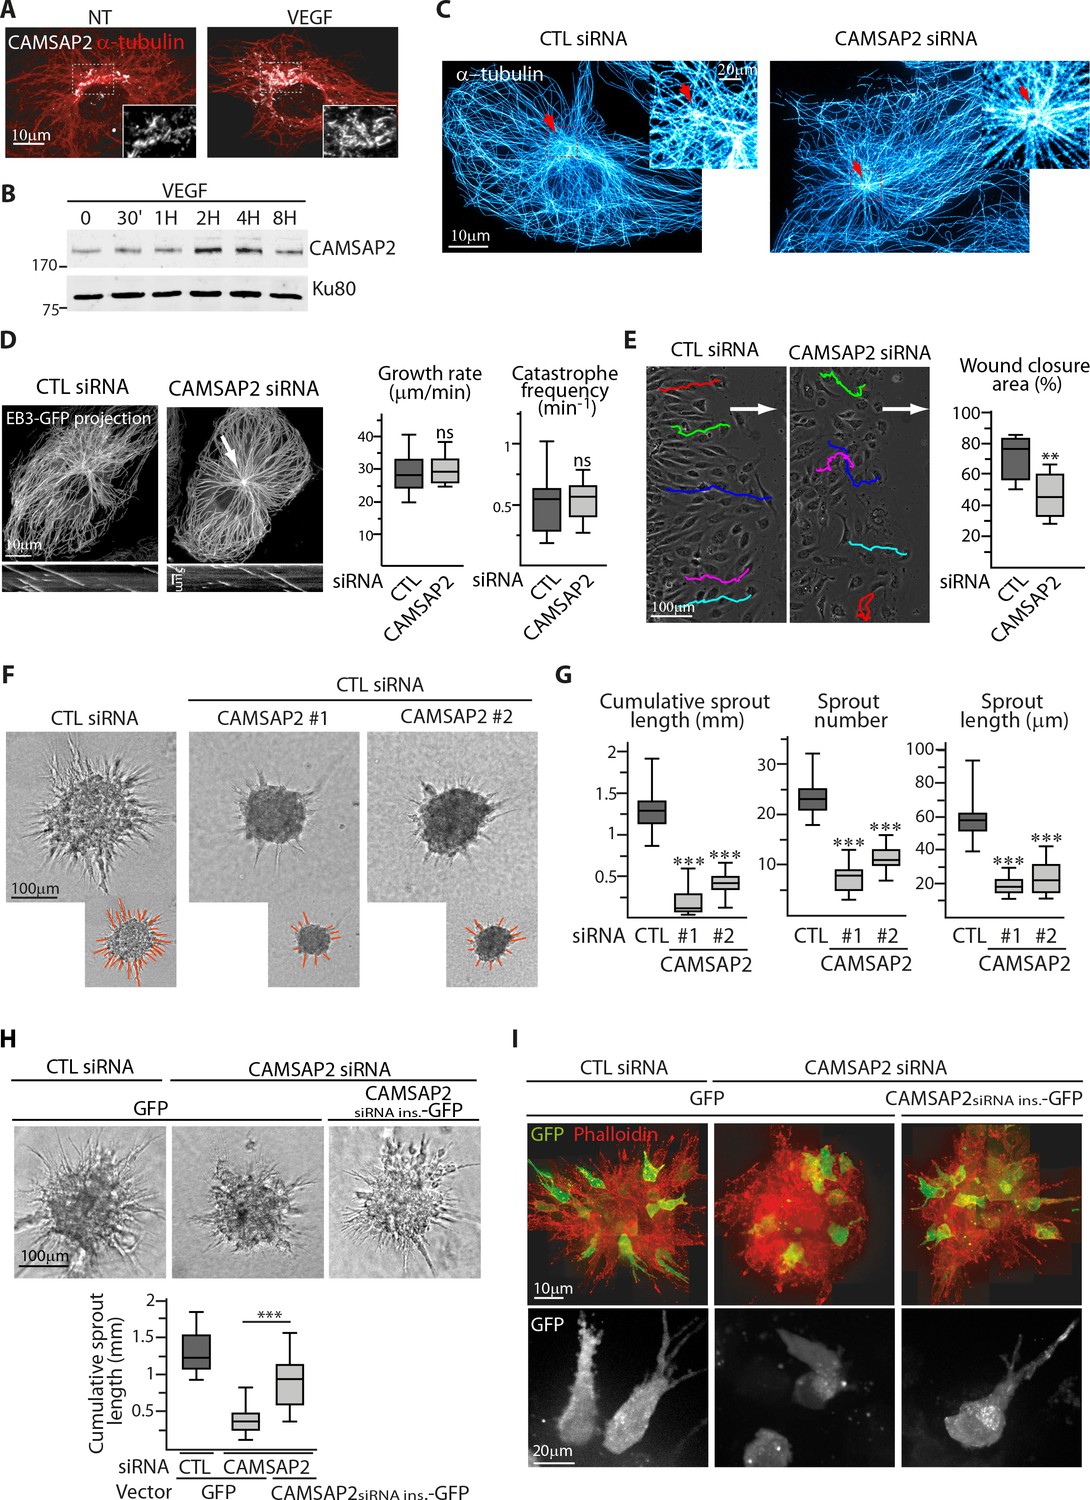
CAMSAP2 is required for maintaining non-centrosomal MTs and EC migration.
(A) Staining of CAMSAP2 (white) and α-tubulin (red) in serum-starved HUVECs before or after a 2 hr treatment with VEGF. Wide-field fluorescence images are shown. (B) Western blots of total extracts of HUVECs during a VEGF stimulation experiment using antibodies against CAMSAP2 and Ku80 as loading control. (C) Imaging of control or CAMSAP2 siRNA-transfected HUVECs stained for MTs (α-tubulin, cyan hot) using STED microscopy. Arrows point toward the centrosome. (D) Analysis of MT dynamics in control or CAMSAP2 siRNA transfected HUVECs illustrated by maximum intensity projections and kymographs of EB3-GFP live fluorescence images. Plots show MT growth rate and catastrophe frequency, n = 132 tracks in 11 cells for each condition. Arrow points toward the centrosome. (E) Overlay of end-point phase-contrast images with the result of cell tracking after 12 hr of migration in a wound healing assay in control and CAMSAP2-depleted HUVECs. The arrows point the direction of migration into the wound. Plots show quantification of wound closure area after 8 hr of migration, n = 12 fields in three independent experiments. (F,G) Spheroids of HUVECs transfected with control or two independent siRNAs against CAMSAP2 were subjected to a sprouting assay for 24 hr. Bright-field micrographs (F) were used to quantify cumulative length of all sprouts per spheroid, their number and length (G); n = 65, 57 and 38 spheroids in three independent experiments. (H,I) HUVECs were co-transfected with control or CAMSAP2 siRNAs together with a GFP-tagged siRNA-insensitive mutant of CAMSAP2 or GFP alone. Quantification of sprouting was performed using bright-field micrographs (H), n = 39, 32 and 33 spheroids in two independent experiments. Live GFP imaging using confocal microscopy (bottom, Z-maximum projection) and phalloidin staining (top, Z-maximum projection) were performed 12 hr after spheroid sprouting (I). Data are shown using box plots; Mann-Whitney U test: ***p<0.001, **p<0.01, *p<0.05, ns, no significant difference.
-
Figure 2—source data 1
An Excel sheet with numerical data on the quantification of the effect of CAMSAP2 silencing on MT dynamics parameters, the efficiency of wound closure, the cumulative length of spheroid sprouts, their number and average length, and the cumulative length of spheroid sprouts re-expressing CAMSAP2 represented as plots in Figure 2D,E,G,H.
- https://doi.org/10.7554/eLife.33864.012
Figure 2—figure supplement 1

CAMSAP2 is required for maintaining non-centrosomal MTs and cell migration in ECs.
(A) Plots showing the number per cell and length of CAMSAP2 stretches in HUVECs treated and stained as in Figure 2A, n = 30 cells per condition. (B) Western blots of total extracts of HUVECs 48 hr after transfection with control or two independent siRNAs against CAMSAP2 using antibodies against CAMSAP2 and Ku80 as loading control. (C) Quantification of the average fluorescence intensity of α-tubulin, n = 25 cells per condition, and of the density of EB3 comets, n = 19 and 21 cells, based on staining in control and CAMSAP2-silenced HUVECs. Data for control condition are the same as in Figure 1A and C. (D) Staining for α-tubulin (white/red) and centrosome (γ-tubulin, green) in HUVECs after transfection with control or CAMSAP2 siRNAs. Overlays for the boxed regions are shown. Heat maps corresponding to the radial and non-radial MT network were built as described in the Methods based on the orientation of the MTs in relation to the centrosome. (E) Western blots of extracts of HUVECs treated as in (D) were used to quantify the levels of α-tubulin and CAMSAP2 expression and the levels of tubulin post-translational modifications (acetylated, detyrosinated and polyglutamylated tubulin); Ku80 antibody was used as loading control, n = 3 independent experiments. (F) Staining of HUVECs treated as in (D) for EB1 or EB3 (green), centrosome or Golgi (γ-tubulin or GM130, red) and DNA (DAPI, blue) 1.5 min after nocodazole washout. Z-maximum projections of confocal images and quantification of the proportion of cells with visible EB1 and EB3 signal, n = 194 and 229 cells in three independent experiments, and the fold enrichment (ratio between the average EB1 intensity around the centrosome or EB3 intensity around Golgi mini-stacks and the average EB1 and EB3 intensity in the cytoplasm, respectively) of EB1 at the centrosome or EB3 at the Golgi are shown, n = 20 cells per condition. (G) Staining for CAMSAP2 (white/green), γ-tubulin (red) and DNA (DAPI, blue) in HUVECs. (H) KIF13B trafficking parameters after CAMSAP2 silencing. Automatic tracking of KIF13B-GFP-positive particles was used to quantify the number, speed and length of KIF13B movements, n = 20 cells in two independent experiments for each condition. Tracks resulting from automatic processing are shown. (I) Plots showing quantification of cell velocity in a wound healing assay in control and CAMSAP2-depleted HUVECs (as in Figure 2E) based on cell tracking analysis, n = 60 cells in two independent experiments. Data are shown using box plots; Mann-Whitney U test (A,C, right plot in F,H,I), Student’s unpaired two-tailed t-test (E, left plot in F): ***p<0.001, *p<0.05, ns, no significant difference.
-
Figure 2—figure supplement 1—source data 1
An Excel sheet with numerical data on the quantification of CAMSAP2 stretch number and length after VEGF treatment, as well as the effect of CAMSAP2 depletion on the EC mean intensity of α-tubulin signal, EB comet number, the expression of CAMSAP2 and various post-translationally modified tubulin, MT nucleation activity and EB3 Golgi and centrosome enrichment after nocodazole washout, the number, speed and length of KIF13B tracks and the velocity of cell migration during scratch-wound assays represented as plots in Figure 2—figure supplement 1A,C,E,F,H,I.
- https://doi.org/10.7554/eLife.33864.013
Figure 2—figure supplement 2

CAMSAP2 is required for maintaining non-centrosomal MTs and cell migration in ECs.
(A) Quantification of mitotic index, based on a phalloidin/DAPI staining, and of doubling time, based on manual counting with trypan blue, 48 hr after transfection with the indicated siRNAs in three independent experiments. (B) Spheroid sprouting assay after CAMSAP2 silencing in the presence of thymidine. Representative micrographs and quantification of sprouting from spheroids of HUVECs transfected with control or CAMSAP2 siRNAs in the presence or absence of thymidine, n = 20 spheroids for each condition. (C,D) Sprouting assays with spheroids of HUVECs transfected with control, CAMSAP2 and CAMSAP3 siRNAs, alone or in combination. Bright-field micrographs (C) were used for quantification of the sprouting in the different conditions (D), n = 74, 78, 67 and 43 spheroids in four independent experiments. (E) Western blot of total HUVEC extracts 40 hr after transfection as in panel C, using antibodies against CAMSAP3 and Ku80 as loading control. Data are shown using box plots; Mann-Whitney U test: ***p<0.001, ns, no significant difference.
-
Figure 2—figure supplement 2—source data 1
An Excel sheet with numerical data on the quantification of the EC mitotic index and doubling time after CAMSAP2 depletion, the cumulative length of spheroid sprouts after CAMSAP2 depletion and treatment with thymidine and after CAMSAP2 and CAMSAP3 depletion represented as plot in Figure 2—figure supplement 2A,B,D.
- https://doi.org/10.7554/eLife.33864.014
Figure 3 with 1 supplement

CAMSAP2 is required for stabilization of one major cell protrusion.
(A) Staining for F-actin (phalloidin, green), α-tubulin (red) and DNA (DAPI, blue) in control or CAMSAP2-depleted sprouting spheroids. Z-maximum projections of confocal images are shown. (B,C) Staining for F-actin (phalloidin, green) and DNA (DAPI, blue) in 3D cultured control or CAMSAP2-depleted HUVECs. Z-maximum projections of confocal fluorescence images (left) were used to create binary cell masks using ImageJ (right) that were analyzed with ImageJ; plots show the inverse of circularity (representing the ratio between cell area and perimeter) (B), the total number of protrusions per cell and the length of the longest protrusion (C) in both conditions, n = 23 and 21 cells in three independent experiments. (D) Spatial distribution of protrusions in control and CAMSAP2-silenced 3D-cultured HUVECs. Polarity index was calculated as described in Materials ans methods to measure protrusion alignment with the major cellular axis: the index is close to one when the protrusions are polarized and align with the axis of the longest protrusion (small angle) and close to 0 when protrusions are dispersed (angle close to 90˚), n = 23 and 21 cells in three independent experiments. (E) Live phase-contrast images of 3D protrusion dynamics in control and CAMSAP2-depleted HUVECs. Time is indicated in hr:min. (F) Radial resliced representation of the time-lapse described in (E). Signals indicate positions of protrusions at specific time points at specific radial positions. Plot shows quantification of the persistence of 3D protrusions formed by control or CAMSAP2-depleted HUVECs per 20 min interval. Data are mean from 12 cells in both conditions. (G) Staining for α-tubulin in 3D cultured control or CAMSAP2-depleted HUVECs. Z-maximum projections of confocal fluorescence images are shown using a color look-up table (LUT) and were used to calculate the average α-tubulin intensity ratio between the longest protrusion and the other ones, n = 18 cells for each condition. Data are shown using box plots; Mann-Whitney U test: ***p<0.001, ns, no significant difference.
-
Figure 3—source data 1
An Excel sheet with numerical data on the quantification of the effect of CAMSAP2 depletion on the 3D elongation of ECs, the number of their 3D protrusions and the length of the longest one, their polarity index (protrusion organization), the persistence of the protrusions over time and the enrichment of α-tubulin signal in the longest protrusion represented as plots in Figure 3B,C,D,F,G.
- https://doi.org/10.7554/eLife.33864.017
Figure 3—figure supplement 1
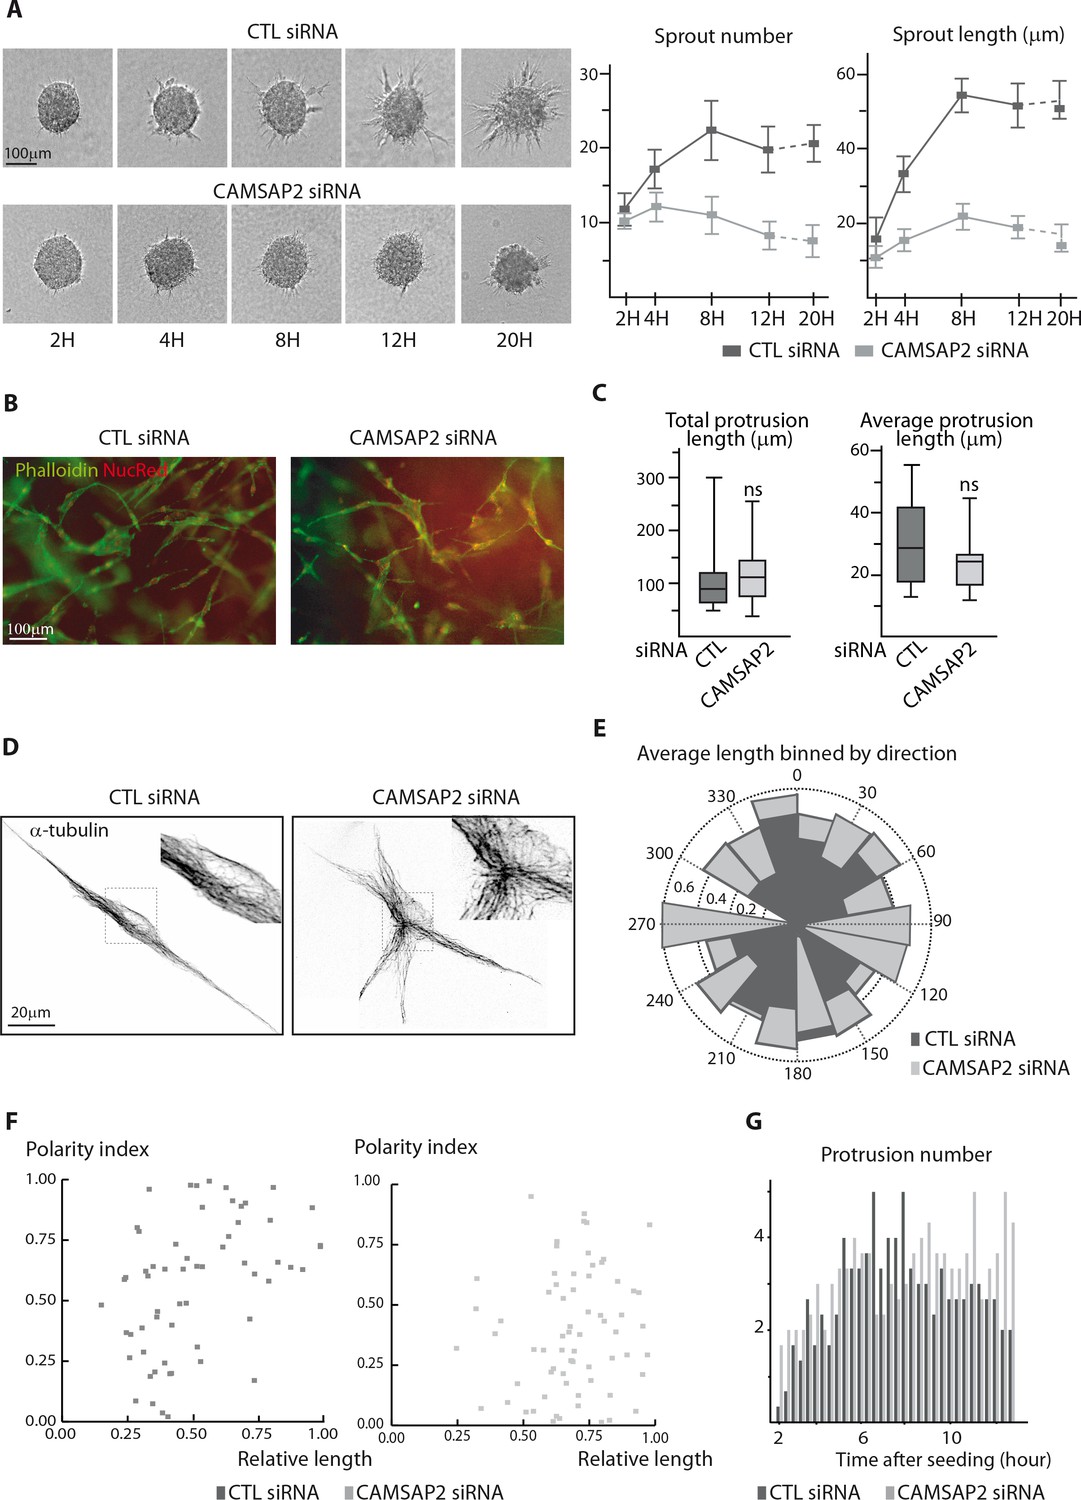
CAMSAP2 is required for stabilization of one major cell protrusion.
(A) Bright-field micrographs of a time-course sprouting experiment from spheroids of control or CAMSAP2-depleted HUVECs and quantification of the number and length of the sprouts, n = 20 spheroids per condition. (B) Staining of 3D single-cell HUVEC dense seeding experiment after CAMSAP2 depletion. Wide-field fluorescence images show the tubular network (phalloidin, green); NucRed live probe (red) labels nucleus. (C) Quantification of HUVEC 3D morphology after transfection with control or CAMSAP2 siRNAs. Binary cell masks were made as shown in Figure 3B and used for quantification of the cumulative length of all protrusions per cell and their average length, n = 23 and 21 cells in three independent experiments. (D) Staining for α-tubulin in 3D-seeded HUVECs transfected with control or CAMSAP2 siRNAs. Z-maximum projections of confocal images are shown after Huygens deconvolution. (E) Angular distribution of protrusions in control and CAMSAP2-silenced 3D-cultured HUVECs in relation to their length. Each protrusion was normalized to the longest protrusion for their length and angle. Polar plot shows the average relative protrusion length (represented as the radius) associated with a given direction (within a 20˚ angular sector) in control and CAMSAP2-depleted 3D-cultured HUVECs. The longest protrusions were omitted from the plot. (F) Dependence of the protrusion polarity index, described in Figure 3D and in Materials and methods, on the relative protrusion length (normalized to the longest protrusion) in control and CAMSAP2-depleted 3D-cultured HUVECs. (G) Quantification of the number of 3D protrusions formed by control or CAMSAP2-depleted HUVECs per 20 min interval as described in Figure 3F. Data are mean from 12 cells in both conditions. Data are shown using box plots; Mann-Whitney U test: ns, no significant difference.
-
Figure 3—figure supplement 1—source data 1
An Excel sheet with numerical data on the quantification of the effect of CAMSAP2 depletion on the number and length of spheroid protrusions over time, the total and average length of the 3D protrusions of isolated ECs, the binning of the average protrusion length by their direction, the polarity index of the 3D protrusions in relation to their length and the number of 3D protrusions over time represented as plots in Figure 3—figure supplement 1A,C,E–G.
- https://doi.org/10.7554/eLife.33864.018
Figure 4 with 2 supplements
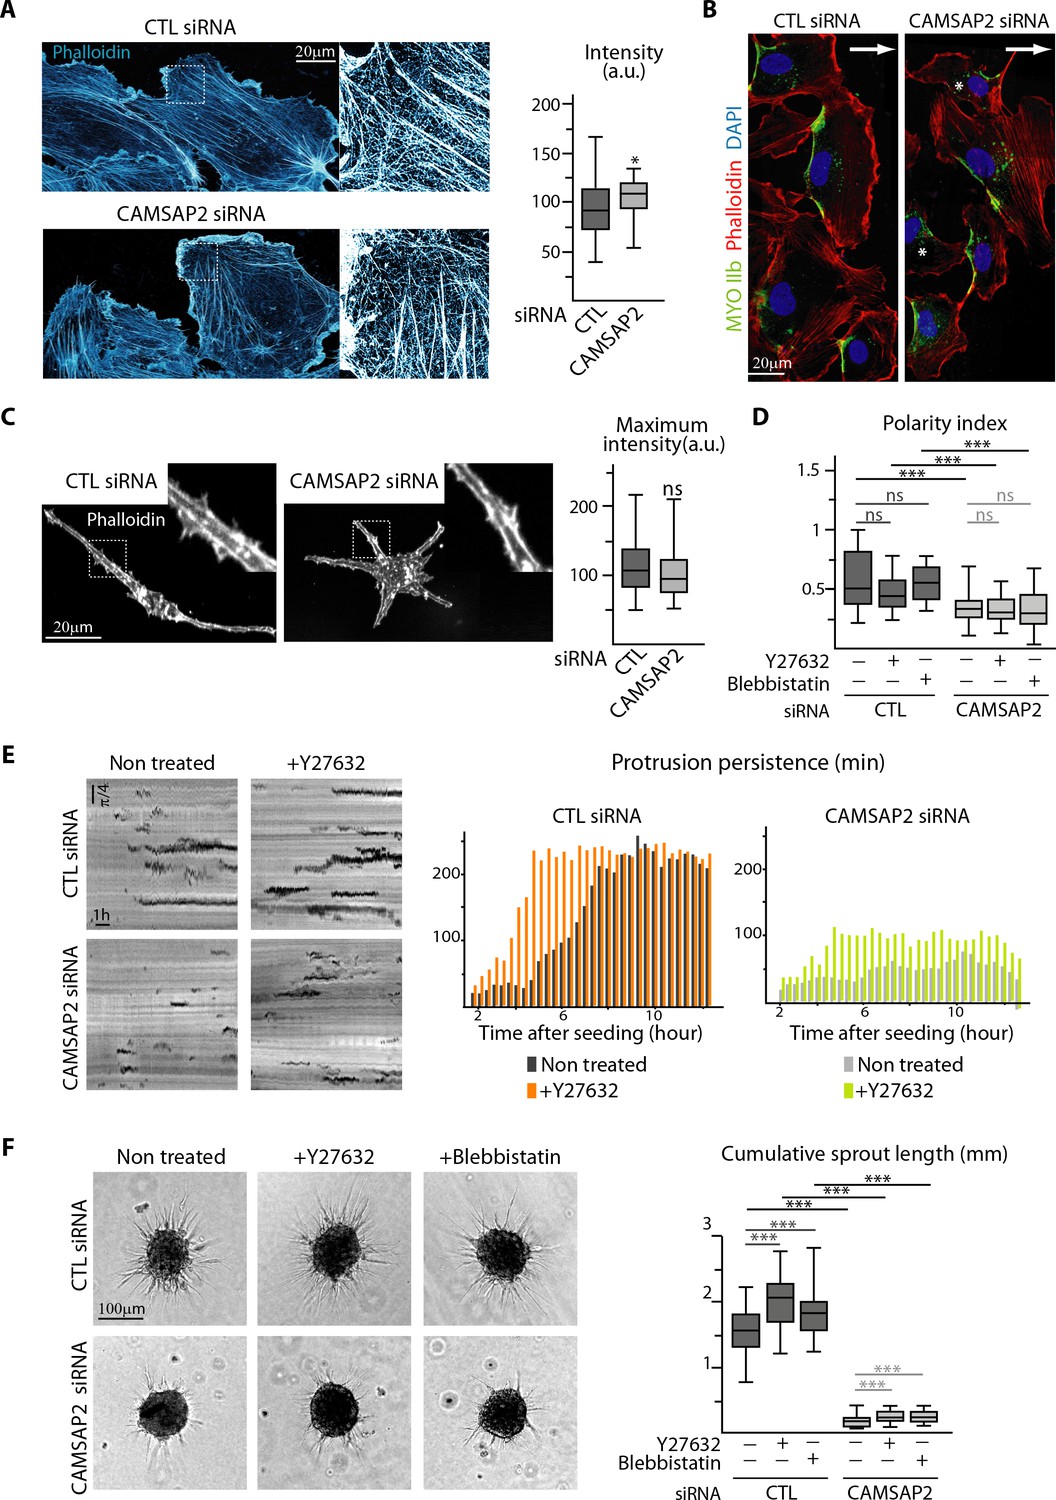
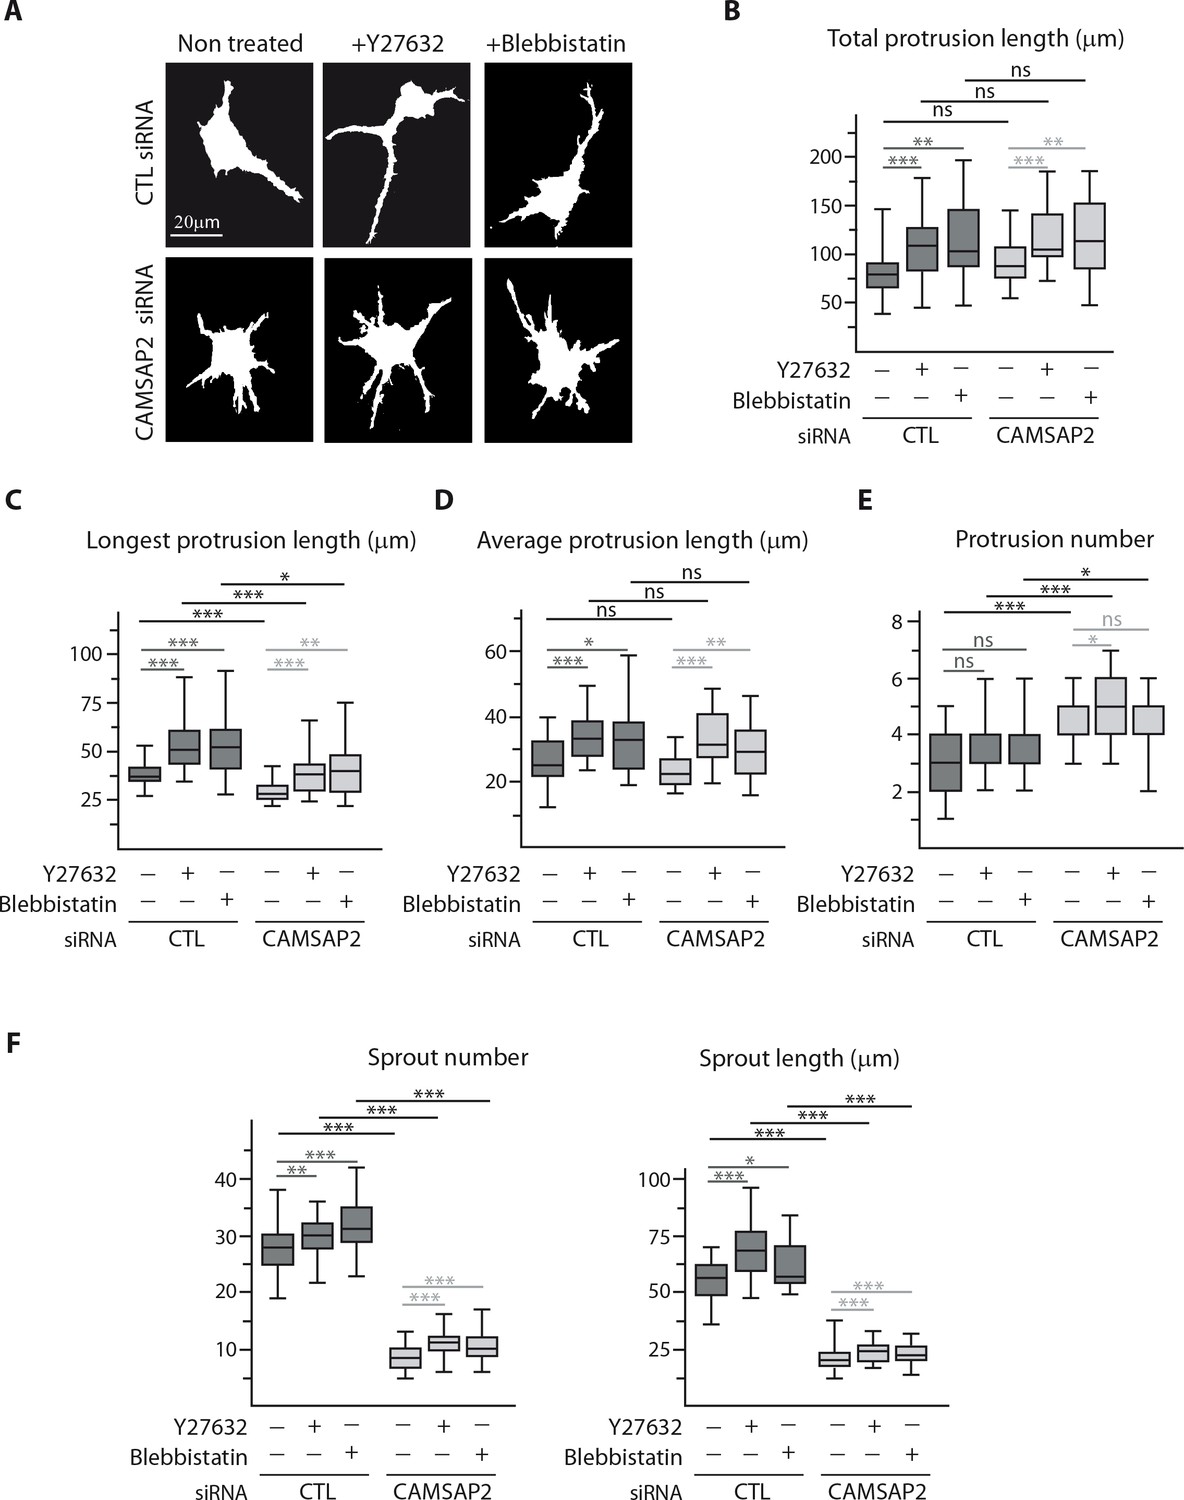
CAMSAP2 depletion phenotypes cannot be explained by changes in the actin cytoskeleton and cell contractility.
(A) Imaging of control or CAMSAP2 siRNA-treated HUVECs during 2D wound healing assay stained for F-actin (phalloidin, cyan hot) using STED microscopy. The plot shows the average fluorescence intensity of phalloidin, n = 30 cells in two independent experiments for each condition. (B) HUVECs during 2D wound healing assay stained for Myosin IIb (MYOIIb, retracting edge marker, green), F-actin (phalloidin, red) and DNA (DAPI, blue). Z-maximum projections of confocal images are shown; the arrow points toward the wound and asterisks show disoriented HUVECs. (C) Staining for F-actin (phalloidin, white) in 3D cultured control or CAMSAP2-depleted HUVECs. Z-maximum projections of confocal fluorescence images are shown and fluorescence intensity profiles across protrusions were used to quantify the maximum intensity of phalloidin in protrusion (plot) as described in the Materials and methods, n = 40 cells in three independent experiments per condition. (D) Spatial distribution of protrusions in control and CAMSAP2-silenced 3D-cultured HUVECs treated or not treated with the contractility inhibitors Y-27632 or blebbistatin. Polarity index was calculated as described in Materials and methods to measure protrusion alignment with the major cellular axis, n = 26 cells in two independent experiments, except for blebbistatin treatment, where n = 20 cells. (E) Radial resliced representation of 3D protrusion dynamics in control and CAMSAP2-depleted HUVECs treated or not with Y-27632. Signals indicate positions of protrusions at specific time points at specific radial positions. Plot shows quantification of the persistence of the 3D protrusions. Data are mean from 12 cells in two independent experiments in both conditions. (F) Spheroids of HUVECs treated as in (D) were subjected to a sprouting assay for 24 hr. Bright-field micrographs are shown and were used to quantify cumulative length of all sprouts per spheroid; n = 43, 45, 47, 54, 51 and 54 spheroids in two independent experiments. Data are shown using box plots; Mann-Whitney U test: ***p<0.001, *p<0.05, ns, no significant difference.
-
Figure 4—source data 1
An Excel sheet with numerical data on the quantification of the effect of CAMSAP2 depletion on the intensity of phalloidin signal in 2D (mean intensity) and in 3D (maximum intensity) ECs, as well as on the EC polarity index, the persistence of the protrusions over time and the cumulative length of spheroid sprouts after Y27632 and blebbistatin treatment represented as plots in Figure 4A,C–F.
- https://doi.org/10.7554/eLife.33864.022
Figure 4—figure supplement 1
CAMSAP2 depletion phenotypes cannot be explained by changes in the actin cytoskeleton and cell contractility.
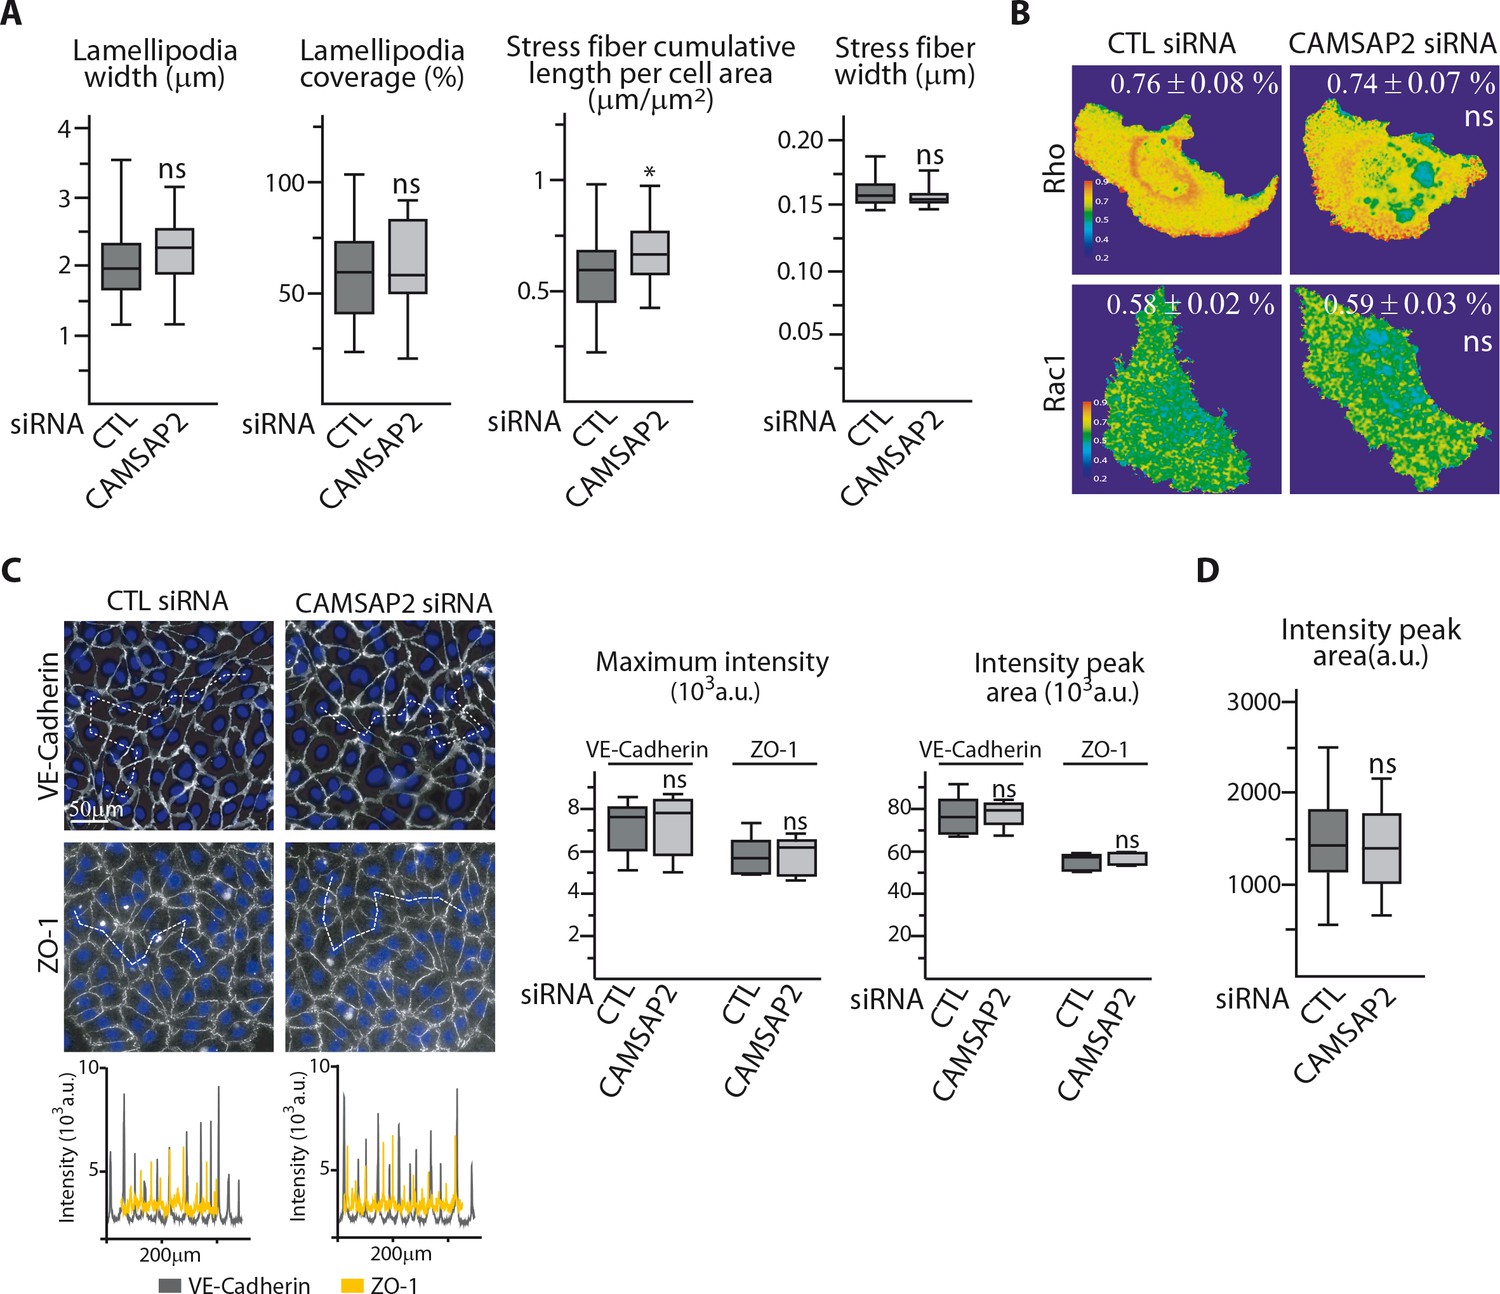
(A) Phalloidin stainings of control or CAMSAP2 siRNA-treated HUVECs shown in Figure 4A were used to quantify the width of the lamellipodia, the percentage of the leading edge covered with lamellipodia ; the cumulative length of stress fibers per cell area and their width was measured using an ImageJ plugin for automatic line traces as described in the Materials and methods, n = 30 cells in two independent experiments for each condition. (B) Ratiometric representation of RhoA and Rac1 biosensor activation from FRET imaging of control or CAMSAP2 siRNA-transfected migrating HUVECs; the average FRET ratio is indicated, n = 25 (RhoA) and 24 cells (Rac1) per condition. (C) VE-Cadherin and ZO-1 stainings were used for analyzing cell-cell junctions in control or CAMSAP2 siRNA-transfected HUVECs. Fluorescence intensity profiles across cell-cell junctions (dashed line) were plotted (one example is shown for VE-Cadherin in grey and ZO-1 in yellow) and used to quantify the average maximum signal intensity and peak area, n = 272 and 325 junctions (VE-Cadherin) and 110 and 112 junctions (ZO-1) in five different fields. (D) Phalloidin stainings of control or CAMSAP2 siRNA-treated HUVECs in 3D shown in Figure 4C were used to plot fluorescence intensity profiles across protrusions to quantify the peak area as described in the Materials and methods, n = 40 cells in three independent experiments per condition. Data are shown using box plots; Mann-Whitney U test: *p<0.05, ns, no significant difference.
-
Figure 4—figure supplement 1—source data 1
An Excel sheet with numerical data on the quantification of the effect of CAMSAP2 depletion on the proportion of coverage and the width of lamellipodia, the cumulative length and the width of stress fibers in 2D migrationg ECs, the activation level of Rho and Rac1 GTPases, the intensity of VE-Cadherin and ZO-1 signal at cell junctions and the intensity of phalloidin signal in 3D represented as plots (or mean value ± SD for 1B) in Figure 4—figure supplement 1A–D.
- https://doi.org/10.7554/eLife.33864.023
Figure 4—figure supplement 2
CAMSAP2 depletion phenotypes cannot be explained by changes in actin cytoskeleton and cell contractility.
(A–E) Staining for F-actin in 3D cultured control or CAMSAP2-inactivated HUVECs treated or not treated with Y-27632 or blebbistatin (as in Figure 4D) were used to create binary cell masks using ImageJ (A) that were analyzed with ImageJ; plots show the cumulative length of all protrusions per cell (B), the length of the longest protrusion (C), the average length of protrusion (D) and total number of protrusions per cell (E) in each condition, n = 26 cells in two independent experiments, except for blebbistatin treatment, where n = 20 cells. (F) Quantification of the number and length of the sprouts formed by spheroids of HUVECs treated as in Figure 4F; n = 43, 45, 47, 54, 51 and 54 spheroids in two independent experiments. Data are shown using box plots; Mann-Whitney U test: ***p<0.001, **p>0.01, *p<0.05, ns, no significant difference.
-
Figure 4—figure supplement 2—source data 1
An Excel sheet with numerical data on the quantification of the effect of CAMSAP2 depletion and Y632 or blebbistatin treatment on the cumulative and average length of 3D protrusions from isolated EC, their number and the length of the longest ones as well as on the number and length of spheroid sprouts represented as plot in Figure 4—figure supplement 2B–F.
- https://doi.org/10.7554/eLife.33864.024
Figure 5 with 1 supplement
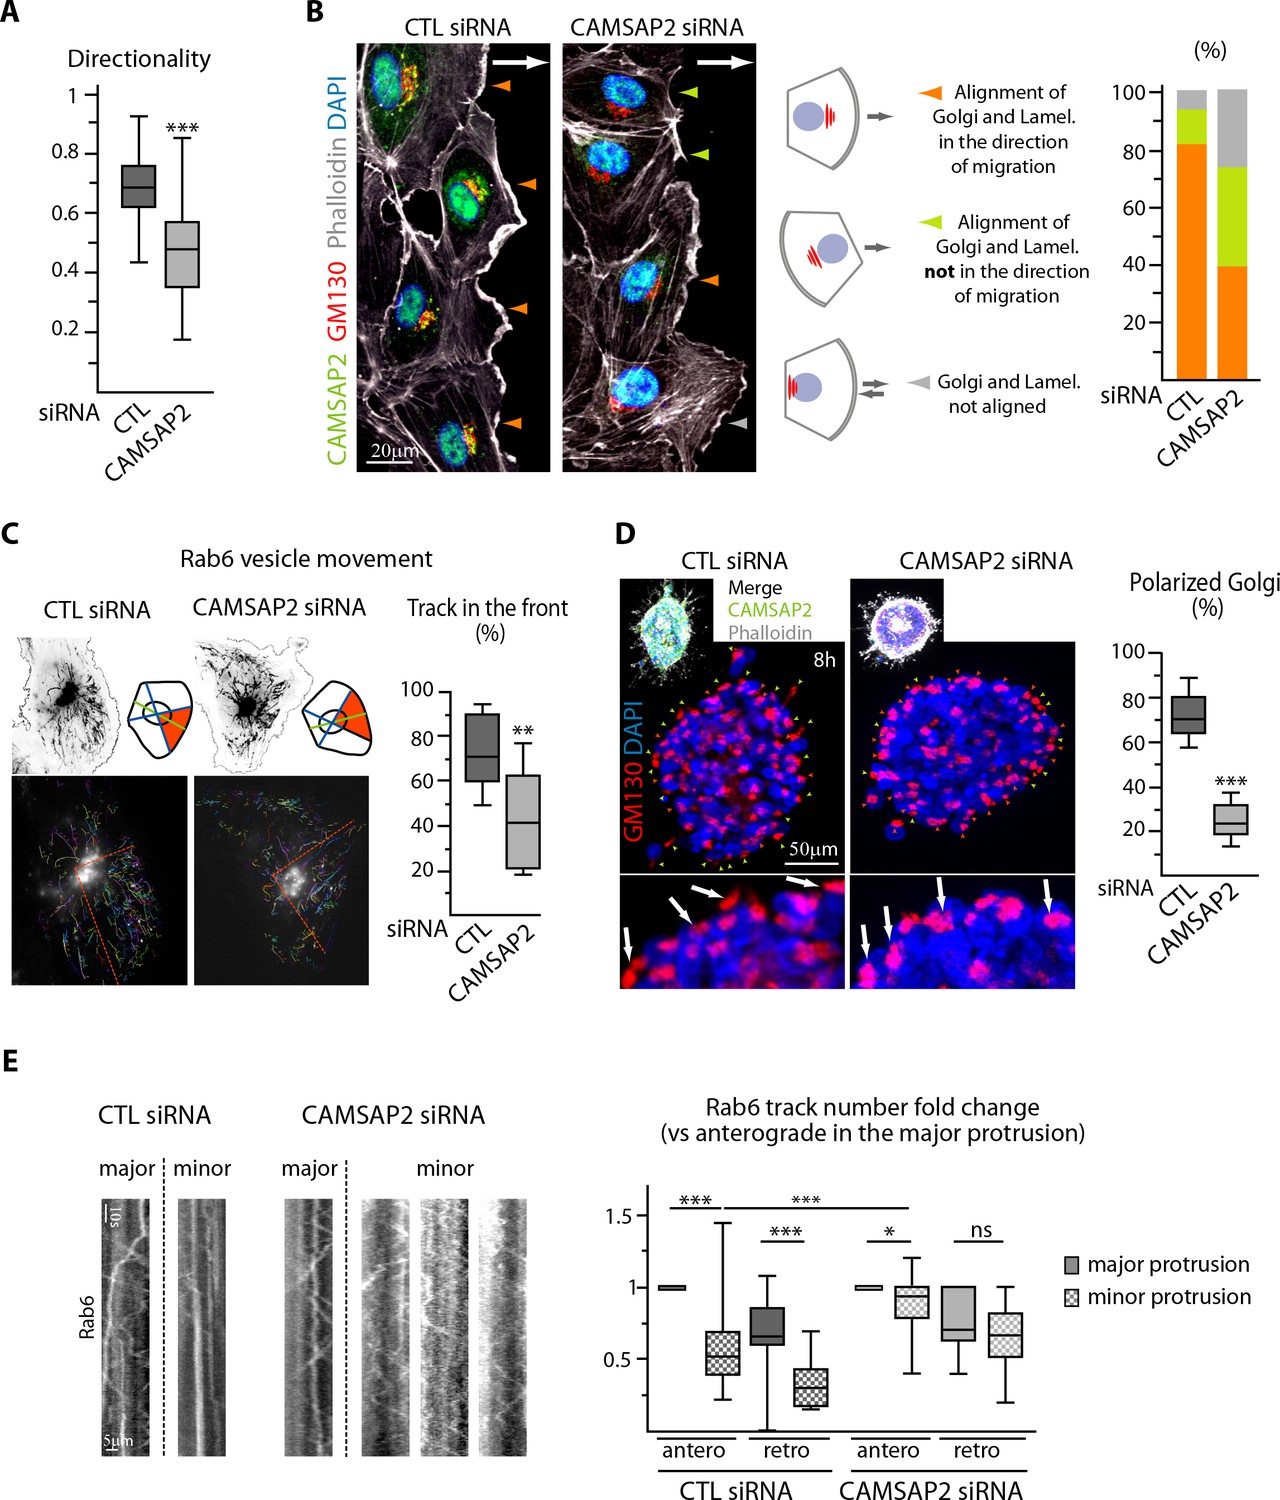
CAMSAP2 participates in Golgi polarization during 2D migration and 3D sprouting.
(A) Directionality of cell movement (distance between the start and end point of migration divided by the total distance travelled) during a phase-contrast time-lapse recording of a wound healing assay after CAMSAP2 knockdown, n = 60 cells in two independent experiments per condition. (B) HUVECs during 2D wound healing assay stained for CAMSAP2 (green), Golgi (GM130, red), F-actin (phalloidin, white) and DNA (DAPI, blue). Z-maximum projections of confocal images are shown; the arrow points toward the wound. Colored arrowheads show distinct cell behaviors quantified in the plot on the right, n = 70 and 79 cells in two independent experiments. Orange arrowhead, lamellipodia and the Golgi face the wound, green arrowhead, lamellipodia do not face the wound but align with the Golgi, grey arrowhead, lamellipodia and Golgi not aligned. (C) Rab6 vesicle tracks in HUVECs transfected with control or CAMSAP2 siRNA. Fluorescence time-lapse TIRF images of GFP-Rab6A at the front cell row in a wound healing assay were tracked automatically. Maximum intensity projections of the acquired signal (black, top) and tracks resulting from automatic processing (multicolor, bottom) are shown. The front of the cell was defined according to the front-rear cell morphology (the orange area in the scheme and the dashed orange line in the bottom images), and the proportion of tracks in this area was quantified, n = 12 cells per condition. (D) Staining for Golgi (GM130, red) and DNA (DAPI, blue) in control or CAMSAP2-depleted HUVEC spheroids 8 hr after 3D spheroid embedding. Upper images display additional CAMSAP2 (green) and F-actin (phalloidin, white) staining. Z-maximum projections of confocal images are shown; in the zoomed images, arrows point to the Golgi positioned in the direction of sprouting in control cells and behind the nuclei in CAMSAP2-depleted cells. Plot shows the proportion of cells at the spheroid periphery with polarized Golgi (defined as having their Golgi jutting out more than 50% of their surface area in front of the nucleus); the green and orange arrowheads point to cells containing polarized or non-polarized Golgi, respectively; n = 10 spheroids per condition. (E) Kymographs illustrating transport of exocytotic vesicles labeled with GFP-Rab6A in the major (longest) and the other (minor) protrusions in control or CAMSAP2-depleted HUVECs. The number of anterograde and retrograde tracks in the major and minor protrusion(s) was quantified for each condition and normalized by the anterograde track number in the major protrusion (plot), n = 20 and 17 cells in two independent experiments. Data are shown using box plots; Mann-Whitney U test (: ***p<0.001, **p<0.01, *p<0,05, ns, no significant difference.
-
Figure 5—source data 1
An Excel sheet with numerical data on the quantification of the effect of CAMSAP2 depletion on the directionality of EC migration, the correlation between the position of the lamellipodia, Golgi and wound during migration, the proportion of Rab6 tracks in the front of migrating ECs, the polarization of Golgi in sprouting ECs and the proportion of Rab6 tracks (anterograde and retrograde) in the 3D longest protrusion represented as plots in Figure 5A–E.
- https://doi.org/10.7554/eLife.33864.027
Figure 5—figure supplement 1

CAMSAP2 participates in Golgi polarization during 2D migration and 3D sprouting.
(A) Staining for γ-tubulin (green), Golgi (GM130, red) and DNA (DAPI, blue) in HUVECs transfected with control or CAMSAP2 siRNAs during a 2D wound healing assay. Z-maximum projections of confocal images are shown. The arrows point the direction of migration, the wound edge is indicated by the dashed line. The proportion of cells with oriented centrosome, defined as being contained in the 90˚ sector facing the wound, was calculated (plot), n = 4 experiments including 43 and 51 cells in total. (B) Rab6 trafficking parameters after CAMSAP2 silencing. Automatic tracking of GFP-Rab6A-labeled vesicles was used to quantify the speed, duration and length of vesicle movements (see also Figure 5C), n = 12 cells for each condition. (C) Staining for CAMSAP2 (white/green), Golgi (GM130, red), F-actin (phalloidin, white) and DNA (DAPI, blue) in HUVEC spheroid sprouting 14 hr after 3D spheroid embedding. Z-maximum projections of confocal images are shown; arrows show polarized Golgi co-localizing with CAMSAP2 stretches and the dashed line indicates the position of the spheroid body. Data are shown using box plots; Student’s unpaired two-tailed t-test (A), Mann-Whitney U test (B): *p<0.05, ns, no significant difference.
-
Figure 5—figure supplement 1—source data 1
An Excel sheet with numerical data on the quantification of the effect of CAMSAP2 depletion on the polarization of the centrosome during migration and the speed, duration and length of Rab6 tracks in 2D migrating ECs represented as plots in Figure 5—figure supplement 1A,B.
- https://doi.org/10.7554/eLife.33864.028
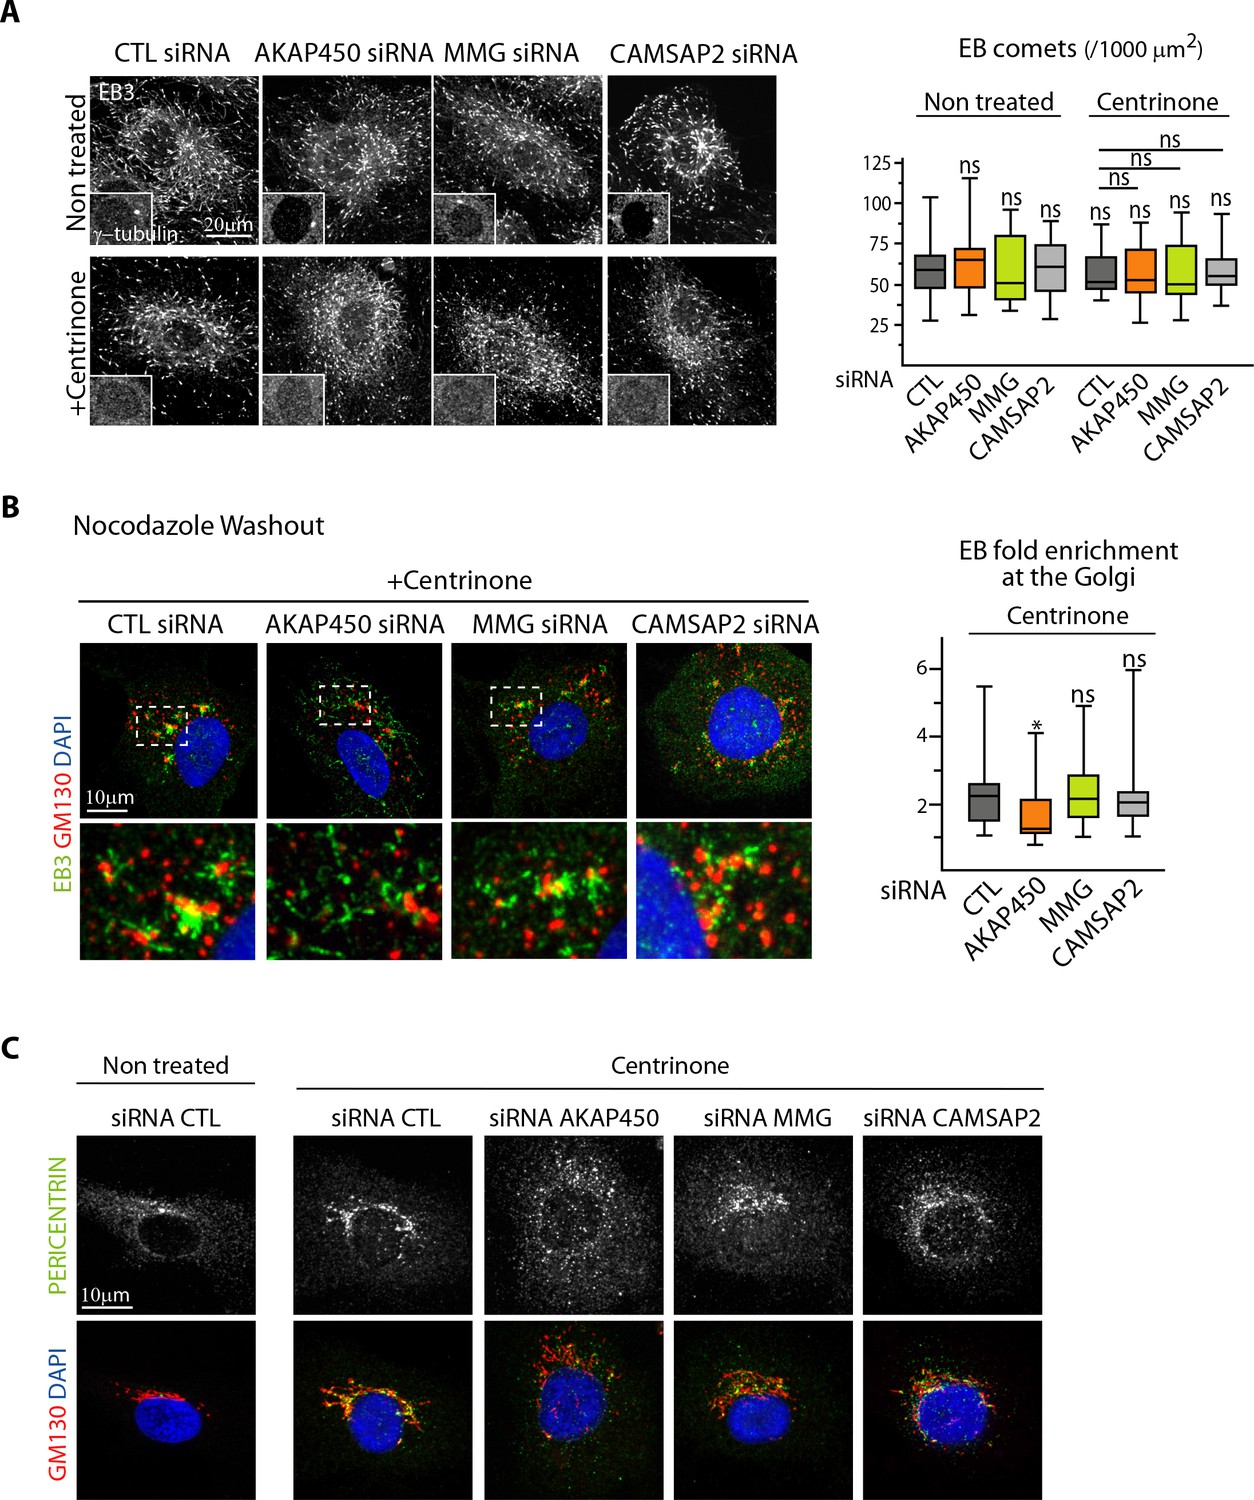
Figure 6 with 1 supplement
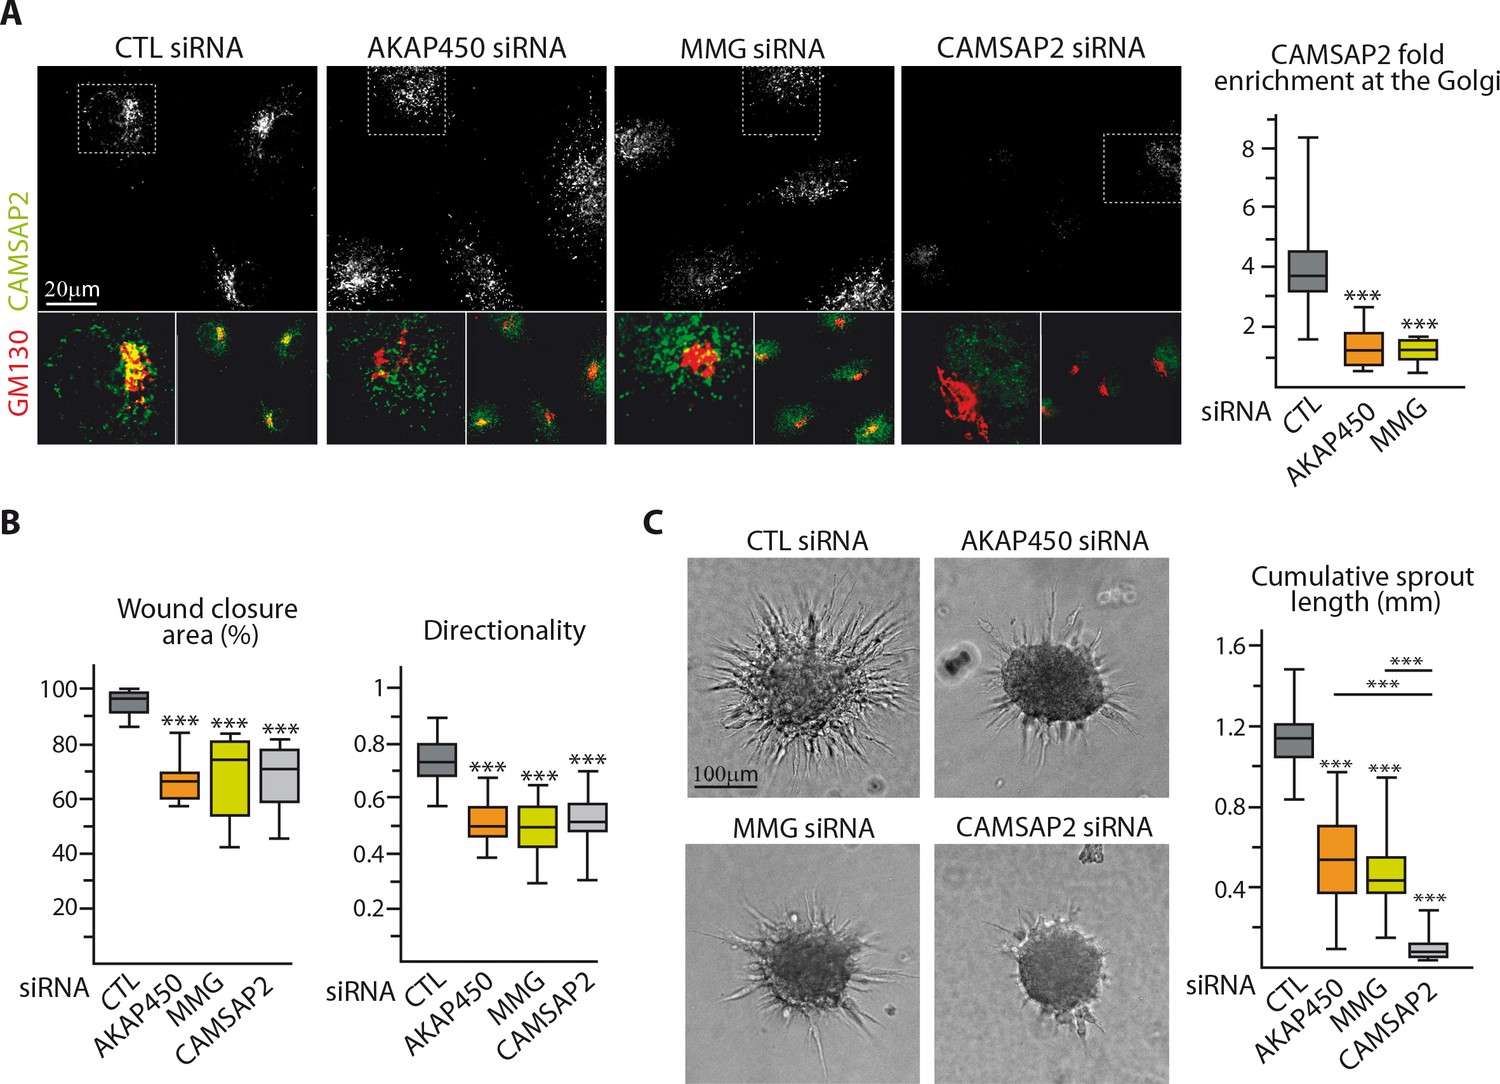
Loss of non-centrosomal MTs has a more severe impact than their detachment from the Golgi in 3D but not in 2D.
(A) Staining for CAMSAP2 (white, green) and Golgi (GM130, red) in HUVECs transfected with the indicated siRNA. The plot shows CAMSAP2 enrichment at the Golgi (ratio between the average CAMSAP2 intensity on top of Golgi and in the cytoplasm), n = 20 cells per condition. (B) Quantification of migratory parameters during wound healing assay in HUVECs transfected with the indicated siRNA. Bright-field micrographs were taken before and 8 hr after wounding to calculate the percentage of wound closure, n = 16 fields in two independent experiments per condition. Cell tracking analysis was performed on phase-contrast live imaging to quantify the directionality of cell movement, n = 30 cells per condition. (C) Spheroid sprouting assay in HUVECs transfected with the indicated siRNAs. Plots of the cumulative length of all sprouts per spheroid are on the right, n = 58, 62, 63 and 58 spheroids in three independent experiments. Data are shown using box plots; Mann-Whitney U test: ***p<0.001.
-
Figure 6—source data 1
An Excel sheet with numerical data on the quantification of the enrichment of CAMSAP2 at the Golgi, the directionality and efficiency of migration during scratch-wound assays and the cumulative length of spheroid sprouts in the absence of AKAP450, MMG or CAMSAP2 represented as plots in Figure 6A–C.
- https://doi.org/10.7554/eLife.33864.031
Figure 6—figure supplement 1
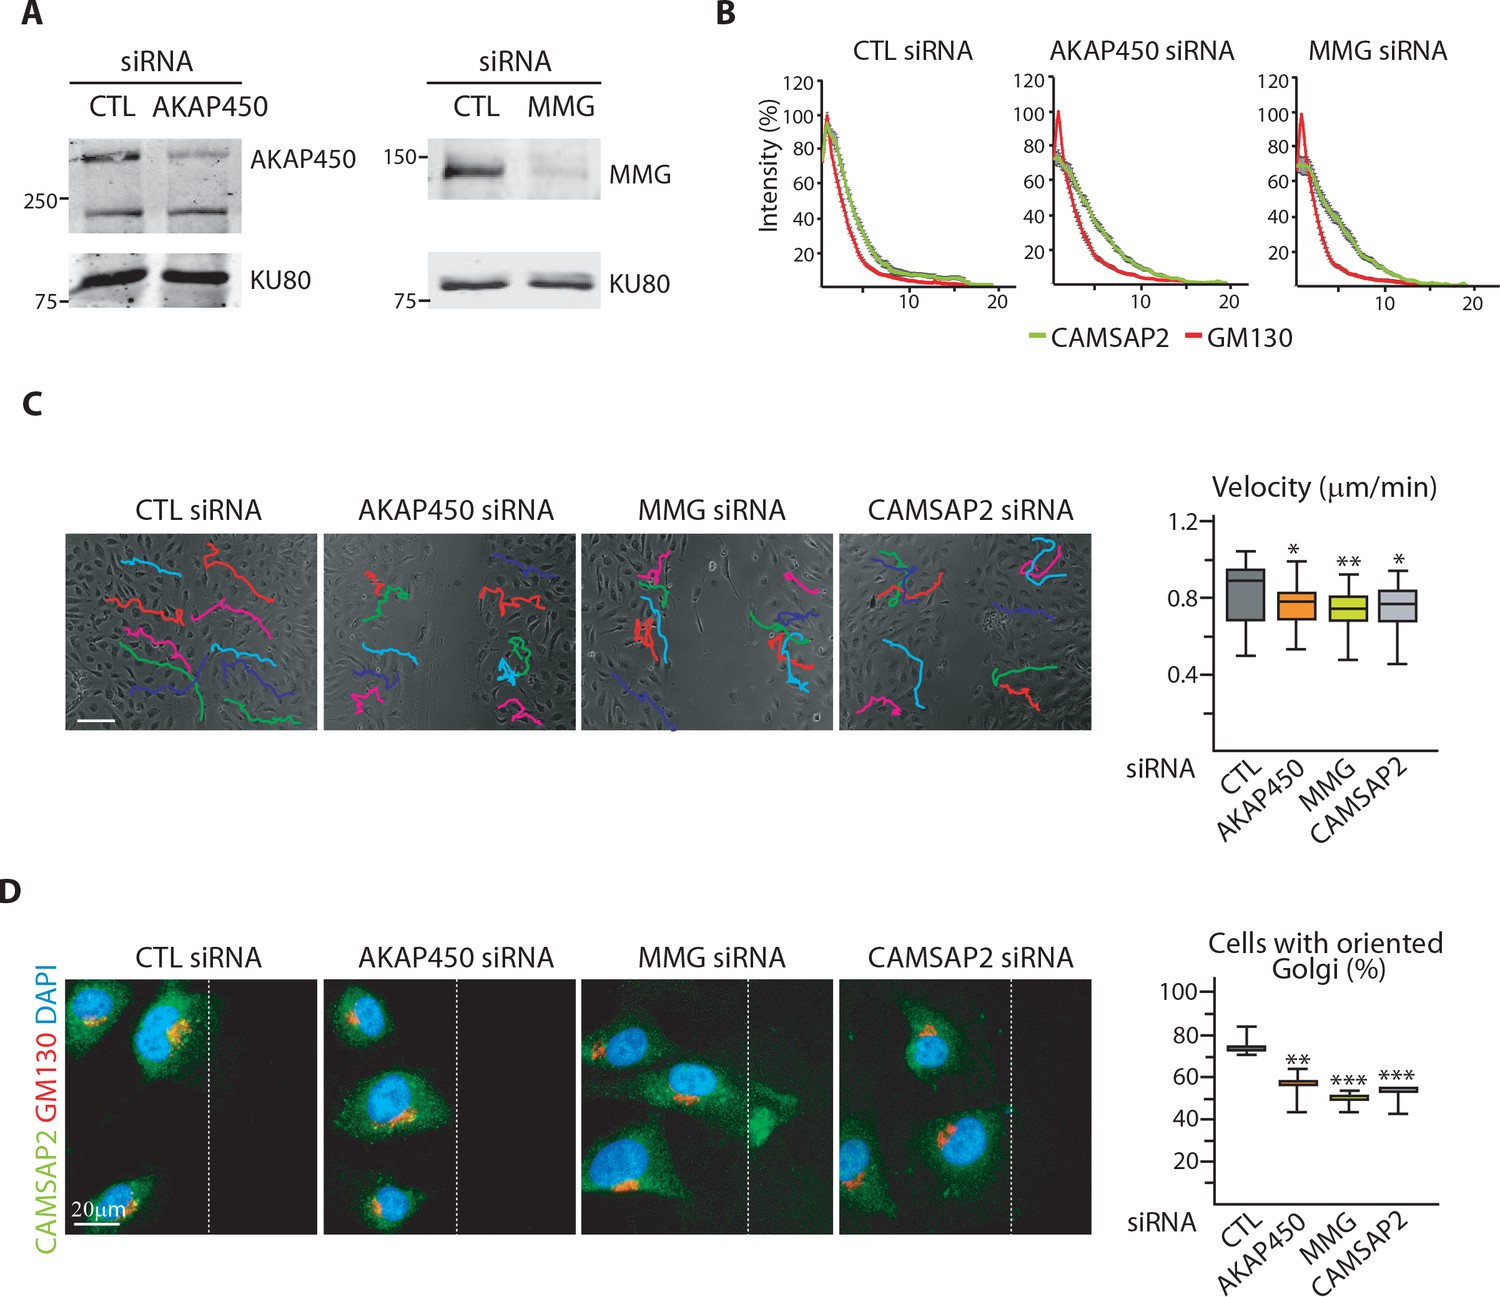
Loss of non-centrosomal MTs has a more severe impact than their detachment from the Golgi in 3D but not in 2D.
(A) Western blots of HUVEC extracts 72 hr after transfection with control, AKAP450 or MMG siRNAs using antibodies against AKAP450 or MMG, and Ku80 as loading control. (B) Normalized fluorescence intensity distribution of CAMSAP2 (green) and GM130 (red) along the cell radius originating from the Golgi center in HUVECs prepared as in (A), n = 20 cells per condition; data are mean ±SEM. (C) Overlay of end-point phase-contrast images with the results of cell tracking after 12 hr of migration in a wound healing assay in HUVECs transfected with the indicated siRNAs. Cell velocity based on cell-tracking analysis is shown in the plot, n = 30 cells for each condition. (D) Staining for CAMSAP2 (green), Golgi (GM130, red) and DNA (DAPI) in HUVECs transfected with the indicated siRNA during a 2D wound-healing assay. Z-maximum projections of confocal images are shown. The dashed line indicates the wound edge. The proportion of cells with oriented Golgi, defined as being contained in the 90˚ sector facing the wound was calculated, n = 3 independent experiments including 90 cells in total. Data are shown using box plots except in (B), where the mean ±SEM is represented; Mann-Whitney U test (C), Student’s unpaired two-tailed t-test (D): ***p<0.001, **p<0.01, *p<0.05.
-
Figure 6—figure supplement 1—source data 1
An Excel sheet with numerical data on the quantification of the profile of CAMSAP2 and GM130 signal along the cell radius, the velocity of migration and the polarization of Golgi during scratch-wound assays in the absence of AKAP450, MMG or CAMSAP2 represented as plots in Figure 6—figure supplement 1B–D.
- https://doi.org/10.7554/eLife.33864.032
Figure 7 with 1 supplement
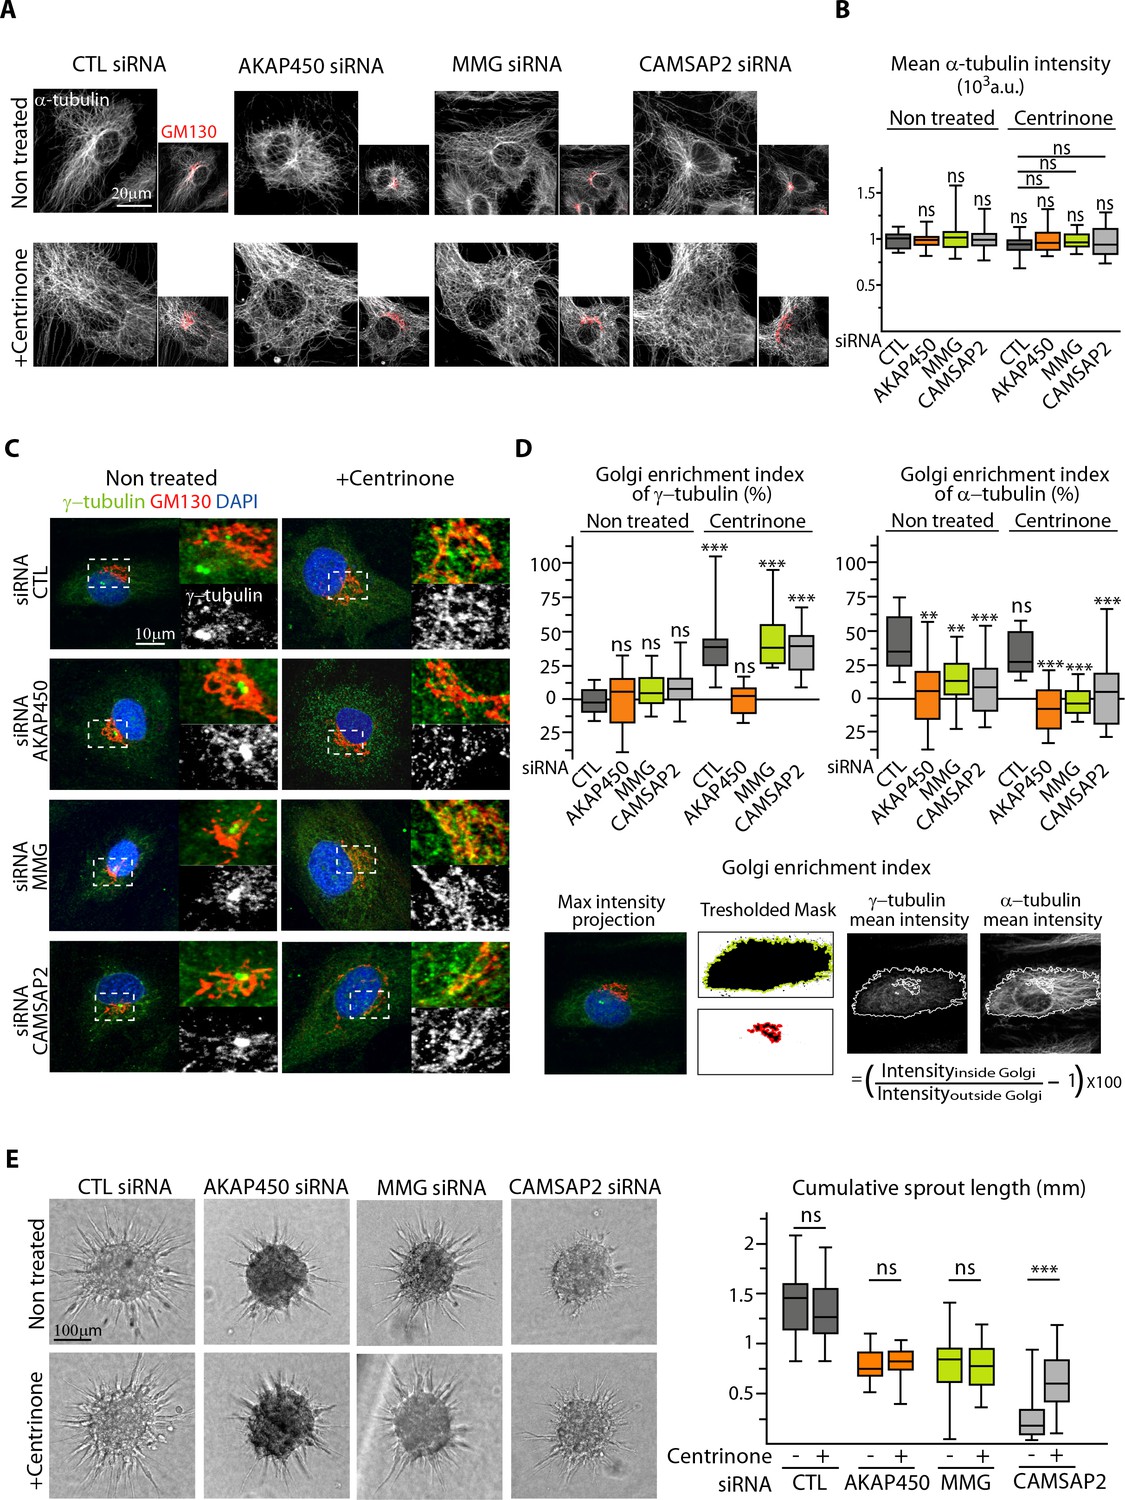
The centrosome inhibits cell polarization and sprouting in the absence of CAMSAP2.
(A,B) Staining for Golgi (GM130, red) and α-tubulin (white) in control and centrinone-treated HUVECs transfected with the indicated siRNAs. Z-maximum projections of confocal images (A) and average fluorescence intensity of α-tubulin (B) are shown; n = 25 cells in each condition. Histogram bars for non-treated/control siRNA, non-treated/CAMSAP2 siRNA and centrinone treated/control siRNA are the same as in Figure 1A and Figure 2—figure supplement 1C. (C) Staining for centrosome (γ-tubulin, green/white), Golgi (GM130, red) and DNA (DAPI, blue) in control and centrinone-treated HUVECs transfected with the indicated siRNAs. Z-maximum projections of confocal images are shown. (D) Enrichment index (difference between the average intensity at the Golgi and in the rest of the cell, divided by the intensity in the cytoplasm expressed in percent) was quantified as schematized at the bottom and as described in Materials and methods for γ-tubulin and α-tubulin at the Golgi in HUVECs treated and stained as in (A) and (C), n = 16, 12, 13, 14, 33, 20, 14 and 15 cells (γ-tubulin) and n = 15, 14, 13, 14, 14, 16, 14 and 15 cells (α-tubulin). (E) Spheroid sprouting assay of HUVECs in the indicated conditions in presence of thymidine. Plot shows quantification of the cumulative length of all sprouts per spheroid, n = 61, 59, 33, 35, 42, 39, 53 and 65 spheroids in three independent experiments. Data are shown using box plots; Mann-Whitney U test: **p<0.01, ***p<0.001, ns, no significant difference.
-
Figure 7—source data 1
An Excel sheet with numerical data on the quantification of the mean intensity of EC α-tubulin signal, the enrichment of γ- and α-tubulin at the Golgi and the cumulative length of spheroid sprouts in the absence of AKAP450, MMG or CAMSAP2 and after centrinone treatment represented as plots in Figure 7B,D,E.
- https://doi.org/10.7554/eLife.33864.035
Figure 7—figure supplement 1
The centrosome inhibits cell polarization and sprouting in the absence of CAMSAP2.
(A) EB3 staining in control and centrinone-treated HUVECs transfected with the indicated siRNAs was used to quantify the density of EB comets, n = 19, 20, 20, 21, 20, 20, 20, 21 cells, histogram bars for non-treated/control siRNA, non-treated/CAMSAP2 siRNA and centrinone treated/control siRNA are the same as in Figure 1C and Figure 2 – figure supplement C. (B) Staining of HUVECs treated with centrinone and transfected with the indicated siRNA for EB3 (green), Golgi (GM130, red) and DNA (DAPI, blue) 1.5 min after nocodazole washout. Z-maximum projections of confocal images and quantification of the fold enrichment (ratio between the average EB3 intensity around Golgi mini-stacks and the average EB3 intensity in the cytoplasm) of EB3 at the Golgi are shown, n = 18 cells per condition. (C) Staining for Pericentrin (white/green), GM130 (red) and DNA (DAPI, blue) in HUVECs transfected with the indicated the siRNA and treated or not treated with centrinone. Data are shown using box plots; Mann-Whitney U test: *p<0.05, ns, no significant difference.
-
Figure 7—figure supplement 1—source data 1
An Excel sheet with numerical data on the quantification of the number of EB comets in 2D ECs and the enrichment of EB at the Golgi after nocodazole washout in the absence of AKAP450, MMG or CAMSAP2 together with centrinone treatment represented as plots in Figure 7—figure supplement 1A,B.
- https://doi.org/10.7554/eLife.33864.036
Figure 8 with 1 supplement

Non-centrosomal MTs are required to create protrusion asymmetry.
(A) Imaging of control and centrinone-treated HUVECs transfected with the indicated siRNAs and stained for MTs (α-tubulin, cyan hot) using STED microscopy. MT images were split into a radial and non-radial component based on MT orientation in relation to the centrosome or the brightest point as described in the Materials and methods. The resulting heat maps (shown using a color look-up table (LUT)) were used to quantify the proportion of the non-radial part of the MT network in a circular section around the reference point (see Materials and methods for details), n = 12 cells per condition. (B) Staining for F-actin (phalloidin, green), α-tubulin (red) and DNA (DAPI, blue) in 3D cultured HUVECs treated as in (A). Z-maximum projections of confocal fluorescence images were used to calculate polarity index as described in Materials and methods and the legend to Figure 3D, n = 44, 36, 35, 38, 36 and 39 cells. (C) Staining for CAMSAP2 (green, white), Golgi (GM130,red), F-actin (phalloidin, white) and DNA (DAPI, blue) in 3D cultured HUVECs treated with centrinone and transfected with control or MMG siRNA. Z-maximum projections of confocal fluorescence images are shown and were used to calculate CAMSAP2 signal intensity enrichment at the Golgi (ratio between the average signal in the Golgi area and in the cytoplasm) and in the longest protrusion (ratio between the average signal in the longest protrusion (box 1) and in the other protrusions), n = 16 and 18 cells. (D) Staining for α-tubulin in 3D cultured HUVECs treated as in (A). Z-maximum projections of confocal fluorescence images are shown using a grey (left) or a color look-up table (LUT) (right) and were used to calculate the average α-tubulin intensity ratio between the longest protrusion and the other ones, n = 36 cells for each conditions. Data are shown using box plots; Mann-Whitney U test: ***p<0.001, ns, no significant difference.
-
Figure 8—source data 1
An Excel sheet with numerical data on the quantification of the effect of MMG or CAMSAP2 depletion together with centrinone treatment on the proportion of the non-radial MT network, the EC polarity index and the enrichment of α-tubulin signal in the 3D longest protrusion as well as the effect of MMG depletion and centrinone treatment on the enrichment of CAMSAP2 at the Golgi and in the longest protrusion in 3D represented as plots in Figure 8A–D.
- https://doi.org/10.7554/eLife.33864.039
Figure 8—figure supplement 1
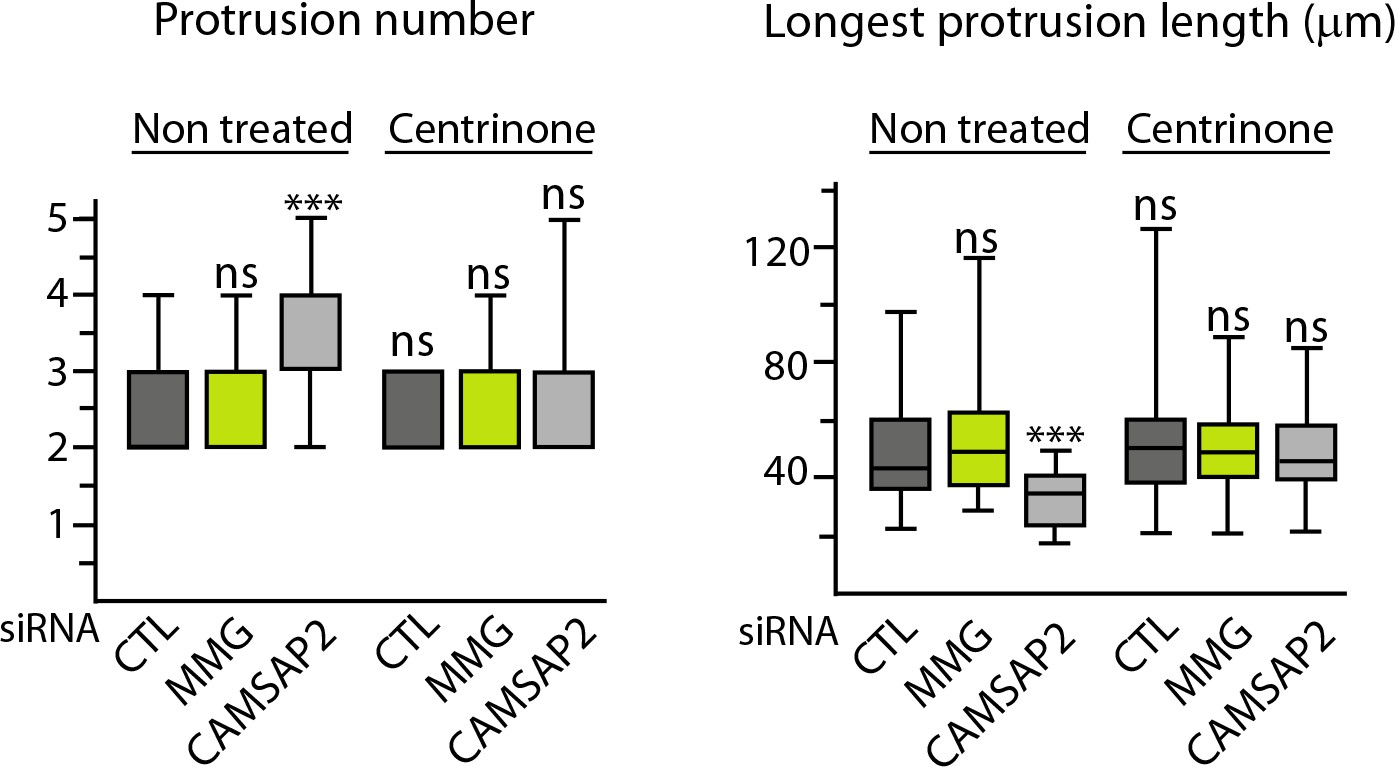
Non-centrosomal MTs are required to create protrusion asymmetry.
Quantification of 3D morphology of HUVECs treated as indicated, using ImageJ; plots show the total number of protrusions per cell and the length of the longest protrusion, n = 44, 36, 35, 38, 36 and 39 cells. See also Figure 8B. Data are shown using box plots; Mann-Whitney U test: ***p<0.001, ns, no significant difference.
-
Figure 8—figure supplement 1—source data 1
An Excel sheet with numerical data on the quantification of the effect of MMG or CAMSAP2 depletion together with centrinone treatment on the number and length of the 3D protrusions of isolated ECs represented as plot in Figure 8—figure supplement 1.
- https://doi.org/10.7554/eLife.33864.040
Figure 9 with 1 supplement
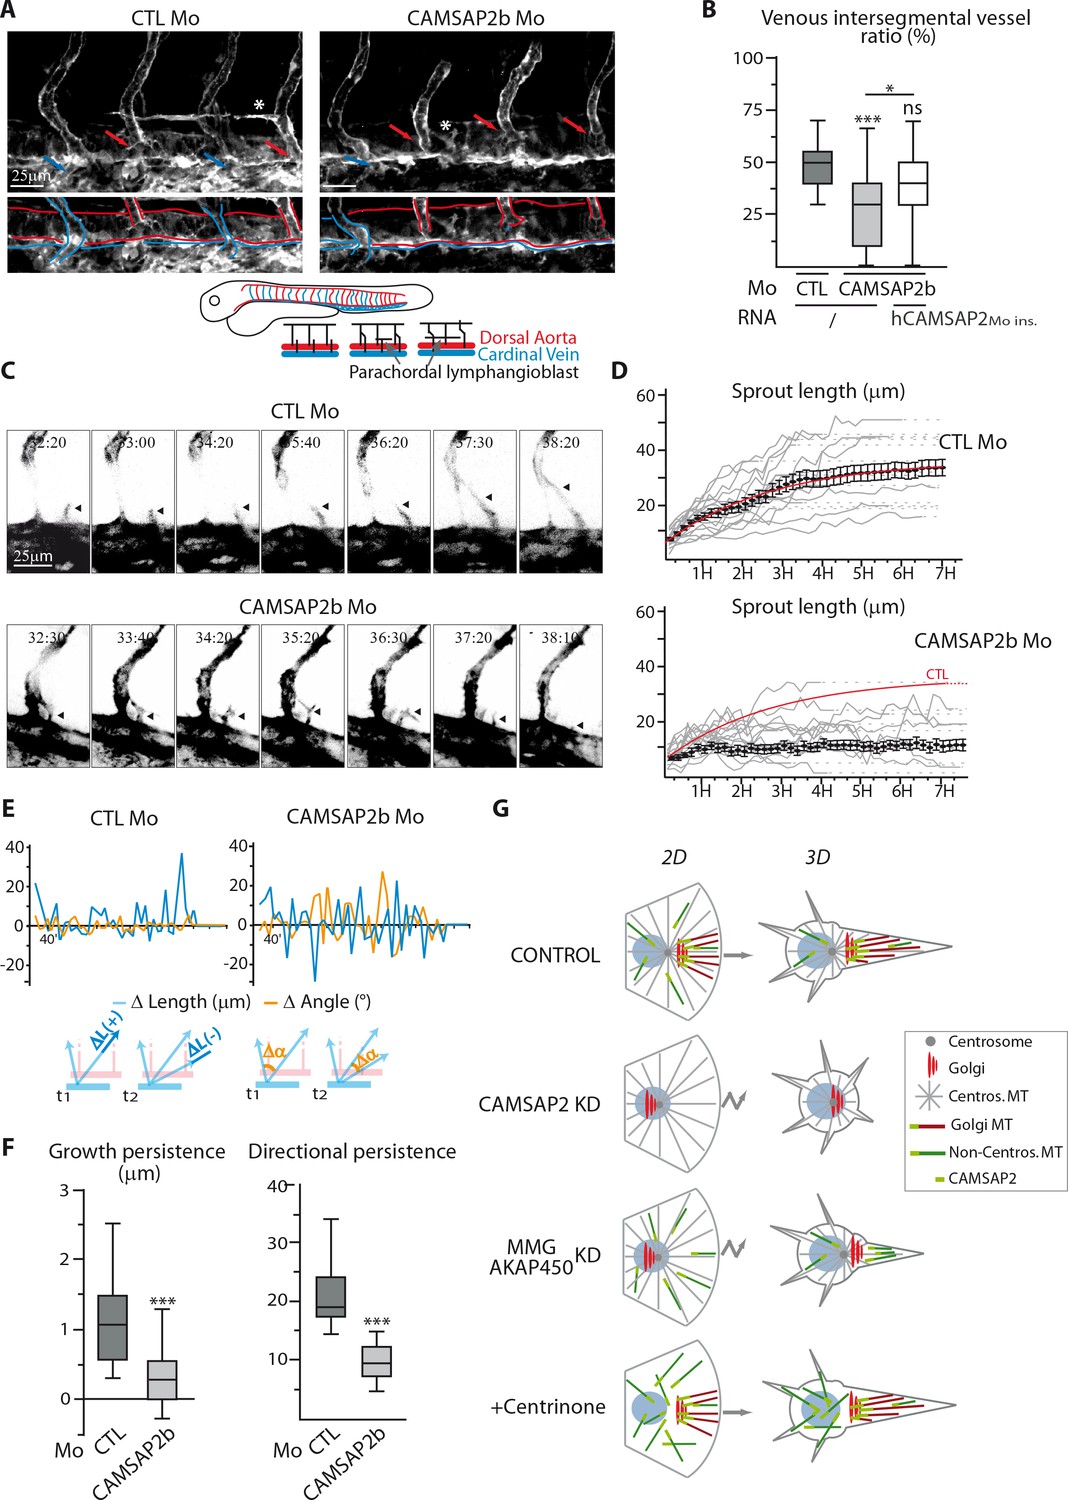
CAMSAP2 plays a role in sprouting angiogenesis in vivo.
(A) Live confocal images (Z-maximum projections) of 48 hpf Tg(Fli1ep:Lifeact-EGFP) embryos injected with control or CAMSAP2b morpholinos. Arterial and venous intersegmental vessels are indicated by red and blue arrows and highlighted with red and blue lines on the bottom pictures, respectively. Asterisks show parachordal lymphangioblast in control embryo and an abnormal venous sprout in CAMSAP2b morphant embryo. (B) Quantification of the percentage of venous intersegmental vessels in the same 10 somite-region in the trunk of embryos injected with control or CAMSAP2b morpholinos, or co-injected with CAMSAP2b morpholinos and RNA coding for a morpholino-insensitive mutant of human CAMSAP2, n = 90, 80 and 45 embryos in six, six and three independent experiments. (C) Frames (Z-maximum projections) from time-lapse confocal imaging of venous sprouting in control and CAMSAP2b-depleted embryos. Time is hr:min post-fertilization. Arrowheads point to the growing venous sprout. See also Videos 1–5. (D) Graphs representing venous sprout length over time measured during their growing period from the time-lapse imaging described in (C) in control and CAMSAP2b morphant embryos. Grey curves represent individual growing events, black dots indicate the average length at each time point ±SEM and the result of curve fitting (exponential - one phase association) in control embryos is drawn in red. (E) Graphs representing length (blue lines, ΔL in the scheme) and angle (orange lines, Δα in the scheme) variations of growing venous sprouts between each successive time point (t1 and t2 in the scheme) from the time-lapse imaging described in (C). One representative plot (out of 19 and 18) is shown for each condition. (F) Quantification of the average growth and directional persistence per growing event calculated from data described in (E) and as explained in the Materials and methods: the growth persistence was obtained by averaging the length variations (Δ Length) between two consecutive time frames per growing event whereas directional persistence was calculated as the inverse of the sinus of the angle variation (its absolute value) for each frame and then averaged per growth event, n = 19 and 18 sprouts in three independent experiments. (G) Model of the impact of MT array organization on endothelial polarization and movement in 2D and 3D. Control ECs contain three distinct populations of MT, the centrosomal MTs (grey), the non-centrosomal, Golgi-anchored MTs (burgundy) and the non-centrosomal non-Golgi-anchored MTs (dark green). The two non-centrosomal MT populations are stabilized by the presence of CAMSAP2 stretches at their minus-ends (light green rectangle). During 2D migration, the presence of Golgi-originating MTs, which are lost after CAMSAP2, MMG or AKAP450 depletion, ensures proper Golgi polarization and directional migration. In the context of 3D sprouting, both non-centrosomal populations are enriched in a single protrusion, which becomes larger and more stable than the rest. Centrosomal MTs are dispensable for both processes. Data are shown using box plots except in (D): mean ±SEM; Chi square test with Yates correction (B), Mann-Whitney U test (F): ***p<0.001, *p<0.05, ns, no significant difference.
-
Figure 9—source data 1
An Excel sheet with numerical data on the quantification of the effect of CAMSAP2b inactivation and its re-expression (for 1B) in zebrafish on the proportion of venous intersegmental vessels, the length of venous sprouts over time, the variation of their length and direction over time and the growth and directional persistence of secondary sprout formation represented as plots in Figure 9B,D–F.
- https://doi.org/10.7554/eLife.33864.043
Figure 9—figure supplement 1
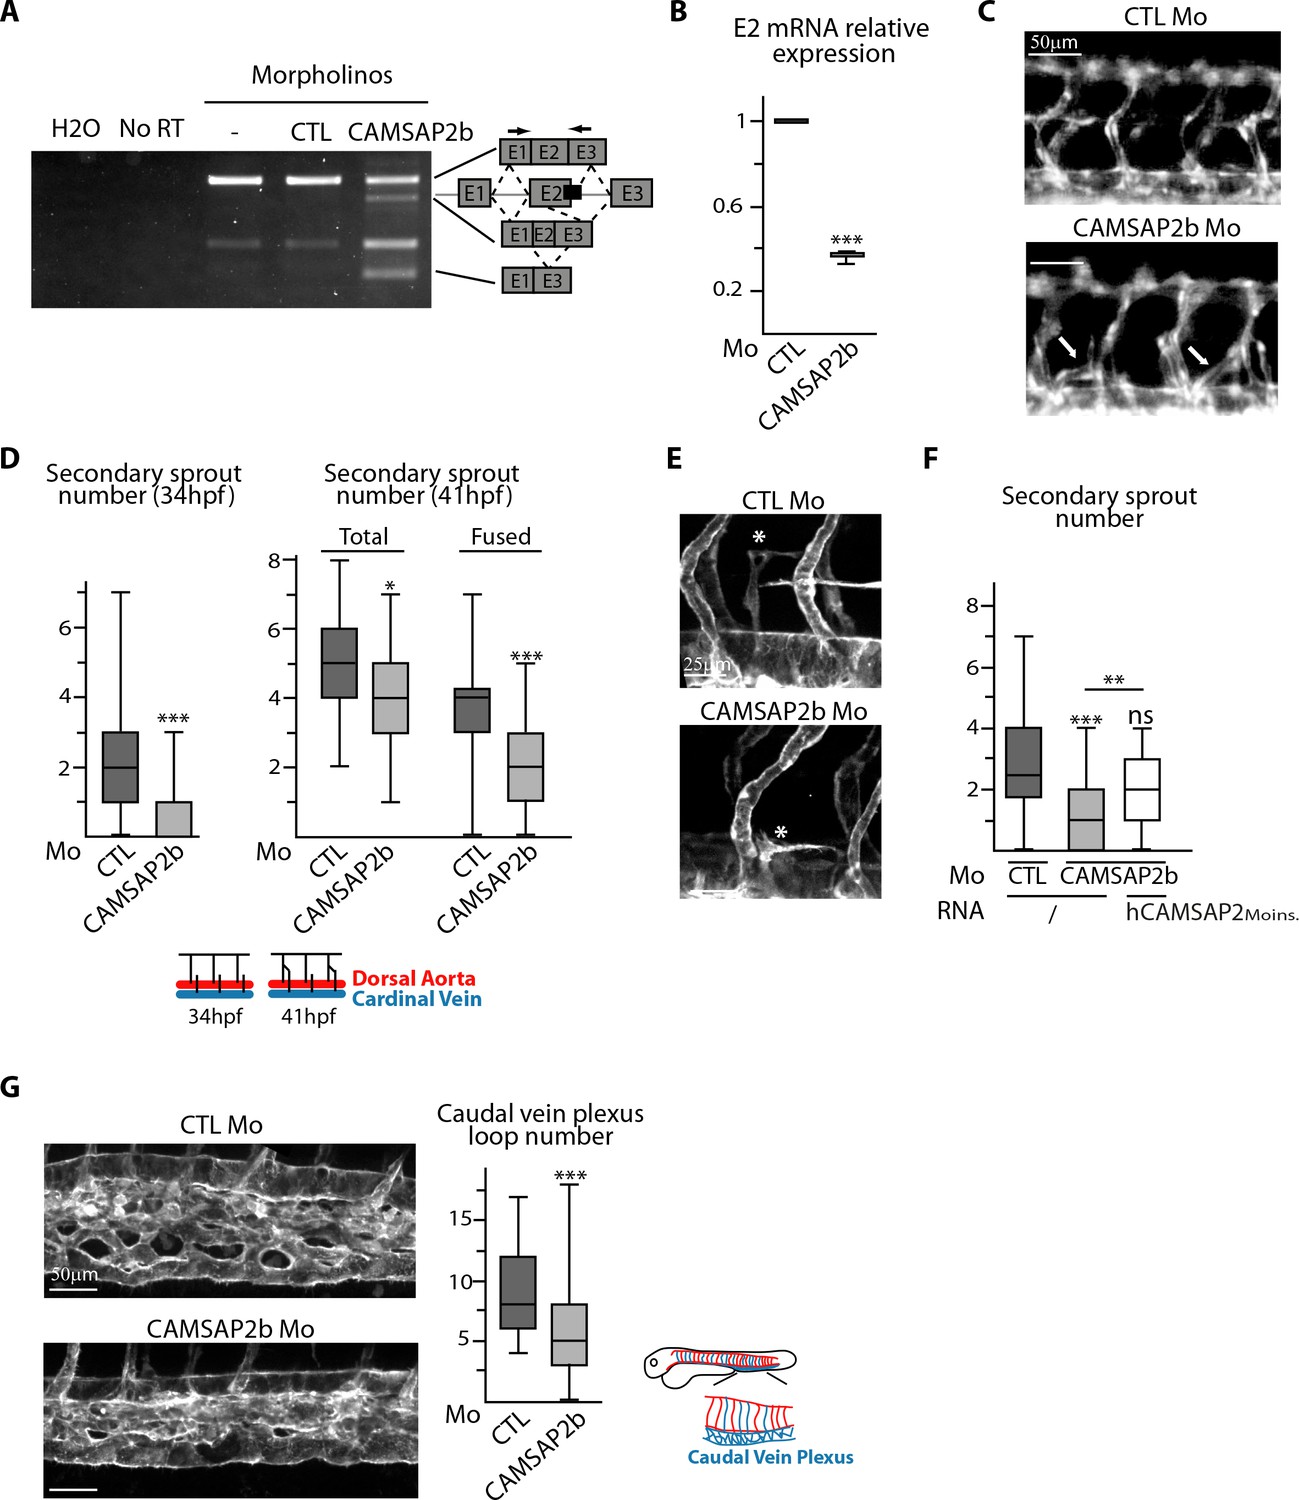
CAMSAP2 plays a role in sprouting angiogenesis in vivo.
(A) RT-PCR analysis of Tg(fli1a:eGFP) embryos injected with a splice-blocking morpholino targeting the exon2/intron2 boundary in Camsap2b (black box), a control or no morpholino (-) with primers (arrows) allowing amplification of distinct spliced species. A shorter amplicon is expected if exon2 is skipped or partially deleted. The same amplification was done with no cDNA (H2O) or with samples that were not treated with reverse transcriptase (NoRT). (B) qPCR analysis of CAMSAP2b exon2 mRNA expression in embryos injected with control or CAMSAP2b morpholinos; results are expressed relative to the control after normalization to ELFA housekeeping gene, n = 3 different primer pairs used in triplicate. (C) Live images of 48 hpf Tg(fli1a:eGFP) embryos injected with control or CAMSAP2b morpholinos showing the trunk vasculature; arrows point to abnormal venous sprouts. (D) Quantification of the number of secondary sprouts in control or CAMSAP2b-inactivated embryos at 34 hpf, n = 64 and 56 embryos in three independent experiments. and at 41 hpf, n = 42 and 41 embryos in two independent experiments. At 41 hpf, the secondary sprouts that have fused with the neighboring primary intersegmental vessel were distinguished among the total secondary sprouts. (E) Live confocal images (Z-maximum projections) of 48 hpf Tg(Fli1ep:Lifeact-EGFP) embryos injected with control or CAMSAP2b morpholinos; asterisks show venous sprouts forming parachordal lymphangioblast in control and CAMSAP2b morphant embryo. (F) Quantification of the number of secondary sprouts at 36 hpf in embryos injected with control or CAMSAP2b morpholinos, or co-injected with CAMSAP2b morpholinos and RNA coding for a morpholino-insensitive mutant of human CAMSAP2, n = 42, 42 and 30 embryos in two independent experiments. (G) Live confocal images (Z-maximum projections) of 48 hpf Tg(Fli1ep:Lifeact-EGFP) embryos injected with control or CAMSAP2 morpholinos showing caudal vein plexus morphology. The plot shows the number of avascular loops in the caudal vein plexus in both conditions, n = 35 and 41 embryos in three independent experiments. Data are shown using box plots; Student’s paired two-tailed t-test (B), Mann-Whitney U test (D,F,G): ***p<0.001, **p<0.01, *p<0.05.
-
Figure 9—figure supplement 1—source data 1
An Excel sheet with numerical data on the quantification of the efficiency of CAMSAP2b silencing, the number of secondary venous sprouts at 34 and 48 hpf and the number of loops in the caudal vein plexus after CAMSAP2b-directed morpholino injection in zebrafish embryos as well as of the number of secondary venous sprouts at 36 hpf after re-expression of CAMSAP2 represented as plots in Figure 9—figure supplement 1B,D,F,G.
- https://doi.org/10.7554/eLife.33864.044
Videos
Video 1
Time-lapse imaging of directional venous sprouting in control Tg(Fli1ep:Lifeact-EGFP) embryos.
Time is hr: min post-fertilization. Z-series images in the region centered on the yolk extension end using a 2-µm-step confocal based scan covering 70 µm depth were taken every 10 min. This video shows the highly directional migration of two venous sprouts toward the adjacent arterial intersegmental vessel.
Video 2
Time-lapse imaging of venous sprouting, arterial intersegmental vessel fusion and parachordal lymphangioblast assembly in control Tg(Fli1ep:Lifeact-EGFP) embryos.
Time is hr: min post-fertilization. This video was acquired as described in Video 1 and illustrates the two different outcomes of venous sprouting: arterial intersegmental vessel fusion or parachordal lymphangioblast assembly, both being directional processes.
Video 3
Time-lapse imaging of unstable venous sprouting in CAMSAP2 morphant Tg(Fli1ep:Lifeact-EGFP) embryos.
Time is hr: min post-fertilization. This video was acquired as described in Video 1 and shows two highly unstable venous sprouts.
Video 4
Time-lapse imaging of non-persistent venous sprouting in CAMSAP2 morphant Tg(Fli1ep:Lifeact-EGFP) embryos.
Time is hr: min post-fertilization. This video was acquired as described in Video 1 and illustrates the instability and lack of directional persistence of venous sprouting.
Video 5
Time-lapse imaging of venous sprouting in CAMSAP2 morphant Tg(Fli1ep:Lifeact-EGFP) embryos.
Time is hr: min post-fertilization. This video was acquired as described in Video 1. The rightmost arterial intersegmental vessel exhibits atypical fusion with two distinct venous sprouts.
Tables
Key resources table
| Reagent type (species) or resource | Designation | Source or reference | Identifiers | Additional information |
|---|---|---|---|---|
| Strain, strain background (Dario rerio) | Tg(fli1a:eGFP)y1 | Zebrafish facility GIGA institute, Liege University | ID_Zfin:ZDB-TGCONSTRCT-070117–94 | |
| Strain, strain background (D. rerio) | Tg(Fli1ep:Lifeact-EGFP) | Zebrafish facility GIGA institute, Liege University;Phng et al. (2013); PMID: 24046319 | ID_Zfin:ZDB-TGCONSTRCT-140610–8 | |
| Cell line (Homo sapiens) | HUVECs | Lonza | Lonza:C2519AS | Primary endothelial cells cultured as recommended by Lonza |
| Antibody | anti-CAMSAP2 (rabbit polyclonal) | Novus | Novus:NBP1-21402; RRID:AB_1659977 | (1:200) for IF; (1:1000) for WB |
| Antibody | anti-CEP135 (rabbit polyclonal) | Sigma-Aldrich | Sigma-Aldrich:SAB4503685; RRID:AB_10746232 | (1:300) |
| Antibody | anti-acetylated tubulin (rabbit polyclonal) | Sigma-Aldrich | Sigma-Aldrich:T7451; RRID:AB_609894 | (1:300) |
| Antibody | anti-polyglutamylated tubulin (rabbit polyclonal) | Sigma-Aldrich | Sigma-Aldrich:T9822; RRID:AB_477598 | (1:2000) |
| Antibody | anti- detyrosinated tubulin (rabbit polyclonal) | Abcam | Abcam:ab48389; RRID:AB_869990 | (1:2000) |
| Antibody | anti-γtubulin (rabbit polyclonal) | Sigma-Aldrich | Sigma-Aldrich:T3559, RRID:AB_477575 | (1:300) for IF; (1:1000) for WB |
| Antibody | anti-CDK5RAP2 (rabbit polyclonal) | Bethyl Laboratories | Bethyl Laboratories:A300-554A | (1:500) |
| Antibody | anti-EB3 (rabbit polyclonal) | Stepanova et al., 2003; PMID: 12684451 | (1:400) | |
| Antibody | anti-MMG8 (rabbit polyclonal) | Wang et al. (2014); PMID: 25217626 | (1:300) for IF; (1:1000) for WB | |
| Antibody | anti-MYOSIN IIb (goat polyclonal) | Santa-Cruz biotechnology | Santa-Cruz biotechnology:sc-47205; RRID:AB_2297998 | (1:200) |
| Antibody | anti-PCM1 (goat polyclonal) | Santa-Cruz biotechnology | Santa-Cruz biotechnology:sc-50164; RRID:AB_2160195 | (1:300) |
| Antibody | anti-GM130 (mouse monoclonal) | BD Biosciences | BD Biosciences:610823; RRID:AB_398142 | (1:600) |
| Antibody | anti-pericentrin (mouse monoclonal) | BD Biosciences | BD Biosciences:611815; RRID:AB_399295 | (1:300) |
| Antibody | anti-EB1 (mouse monoclonal) | BD Biosciences | BD Biosciences:610535; RRID:AB_397892 | (1:400) |
| Antibody | anti-VE-Cadherin (mouse monoclonal) | BD Biosciences | BD Biosciences:610252; RRID:AB_2276073 | (1:500) |
| Antibody | anti-ZO-1 (mouse monoclonal) | BD Biosciences | BD Biosciences:610966; RRID:AB_398279 | (1:200) |
| Antibody | anti-AKAP450 (mouse monoclonal) | BD Biosciences | BD Biosciences:611518; RRID:AB_398978 | (1:300) for IF; (1:500) for WB |
| Antibody | anti-KU80 (mouse monoclonal) | BD Biosciences | BD Biosciences:611360; RRID:AB_398882 | (1:3000) |
| Antibody | anti-CAMSAP3 (mouse monoclonal) | Sigma-Aldrich | Sigma-Aldrich:SAB4200415 | (1:500) |
| Antibody | anti-αtubulin (mouse monoclonal) | Sigma-Aldrich | Sigma-Aldrich:T5168; RRID:AB_477579 | (1:400) for IF; (1:2000) for WB |
| Antibody | anti-γtubulin (mouse monoclonal) | Sigma-Aldrich | Sigma-Aldrich: T6557; RRID:AB_477584 | (1:300) |
| Antibody | anti-NEDD1 (mouse monoclonal) | Abnova | Abnova:H00121441-M05; RRID:AB_534956 | (1:300) |
| Antibody | anti-αtubulin YL1/2 (rat monoclonal) | Pierce | Pierce: MA1-80017; RRID:AB_2210201 | (1:400) |
| Antibody | anti-CPAP (rabbit polyclonal) | Kohlmaier et al. (2009); PMID: 19481460 | (1:200) | |
| Antibody | Alexa Fluor 488-, 594- and 647- secondaries | Molecular Probes | (1:400) | |
| Antibody | Alexa Fluor 488-,and 594- phalloidin | Molecular Probes | (1:500) | |
| Antibody | Abberior STAR 635P- anti-mouse | Sigma-Aldrich | Sigma-Aldrich:2-0002-007-5 | (1:200) |
| Antibody | Atto 647N Phalloidin | Sigma-Aldrich | Sigma-Aldrich:65906 | (1:300) |
| Peptide, recombinant protein | VEGF-165 | Peprotech | Peprotech:100–20 | |
| Sequence-based reagent | siRNA against CAMSAP2#1 | Jiang et al. (2014); PMID: 24486153 | 5’- GAATACTTCTTGACGAGTT-3' | |
| Sequence-based reagent | siRNA against CAMSAP2#2 | Jiang et al. (2014); PMID: 24486153 | 5’- GTACTGGATAAATAAGGTA-3’ | |
| Sequence-based reagent | siRNA against CAMSAP3 | Noordstra et al. (2016); PMID: 27802168 | 5’-GCATTCTGGAGGAAATTGA-3’ | |
| Sequence-based reagent | siRNA against AKAP450 | Hurtado et al. (2011); PMID: 21606206 | 5’-AUAUGAACACAGCUUAUGA-3’ | |
| Sequence-based reagent | siRNA against MMG | Roubin et al. (2013); PMID: 23430395 | 5’-AGAGCGAGATCATGACTTA-3’ | |
| Sequence-based reagent | siRNA against CPAP | Tang et al. (2009); PMID: 19503075 | 5’- AGAAUUAGCUCGAAUAGAA-3’ | |
| Sequence-based reagent | morpholino against CAMSAP2b (Danio rerio) | Genetools | ATACAGATGgcaagtcttttacatc | |
| Sequence-based reagent | primers for CAMSAP2b (Danio rerio) amplification | This paper | see sequences in the zebrafish experiment section | |
| Commercial assay or kit | AMAXA huvecs nucleofector kit | Lonza | Lonza:VPB-1002 | |
| Recombinant DNA reagent | pLenti-RhoA2G | Addgene | Addgene:40179 | |
| Recombinant DNA reagent | pLVIN-Rac1-bs Rac1 | Bouchet et al. (2016); PMID: 27939686 | ||
| Chemical compound, drug | rat tail collagen I | Corning | Corning:734–1085 | |
| Chemical compound, drug | Centrinone | Wong et al. (2015); PMID: 25931445 | ||
| Chemical compound, drug | Y27632 | Sigma-Aldrich | Sigma-Aldrich:Y0503 | |
| Chemical compound, drug | Blebbistatin | Enzo Life Science | Enzo Life Science:BML-EI315-0005 | |
| Software, algorithm | ImageJ SOS plugin | Yao et al., 2017; PMID: 28324611 | ||
| Software, algorithm | ImageJ radiality plugin | https://github.com/ekatrukha/radialitymap | Katrukha, 2017. radialitymap. Github. https://github.com/ekatrukha/radialitymap cf1e78f | |
| Software, algorithm | imageJ curve tracing plugin | https://github.com/jalmar/CurveTracing | Teeuw and Katrukha, 2015. CurveTracing. Github. https://github.com/jalmar/CurveTracing 960852 f |
Additional files
-
Transparent reporting form
- https://doi.org/10.7554/eLife.33864.050
Download links
A two-part list of links to download the article, or parts of the article, in various formats.
Downloads (link to download the article as PDF)
Open citations (links to open the citations from this article in various online reference manager services)
Cite this article (links to download the citations from this article in formats compatible with various reference manager tools)
Control of endothelial cell polarity and sprouting angiogenesis by non-centrosomal microtubules
eLife 7:e33864.
https://doi.org/10.7554/eLife.33864


