Tunable molecular tension sensors reveal extension-based control of vinculin loading
- Duke University, United States
Figures
Figure 1 with 3 supplements
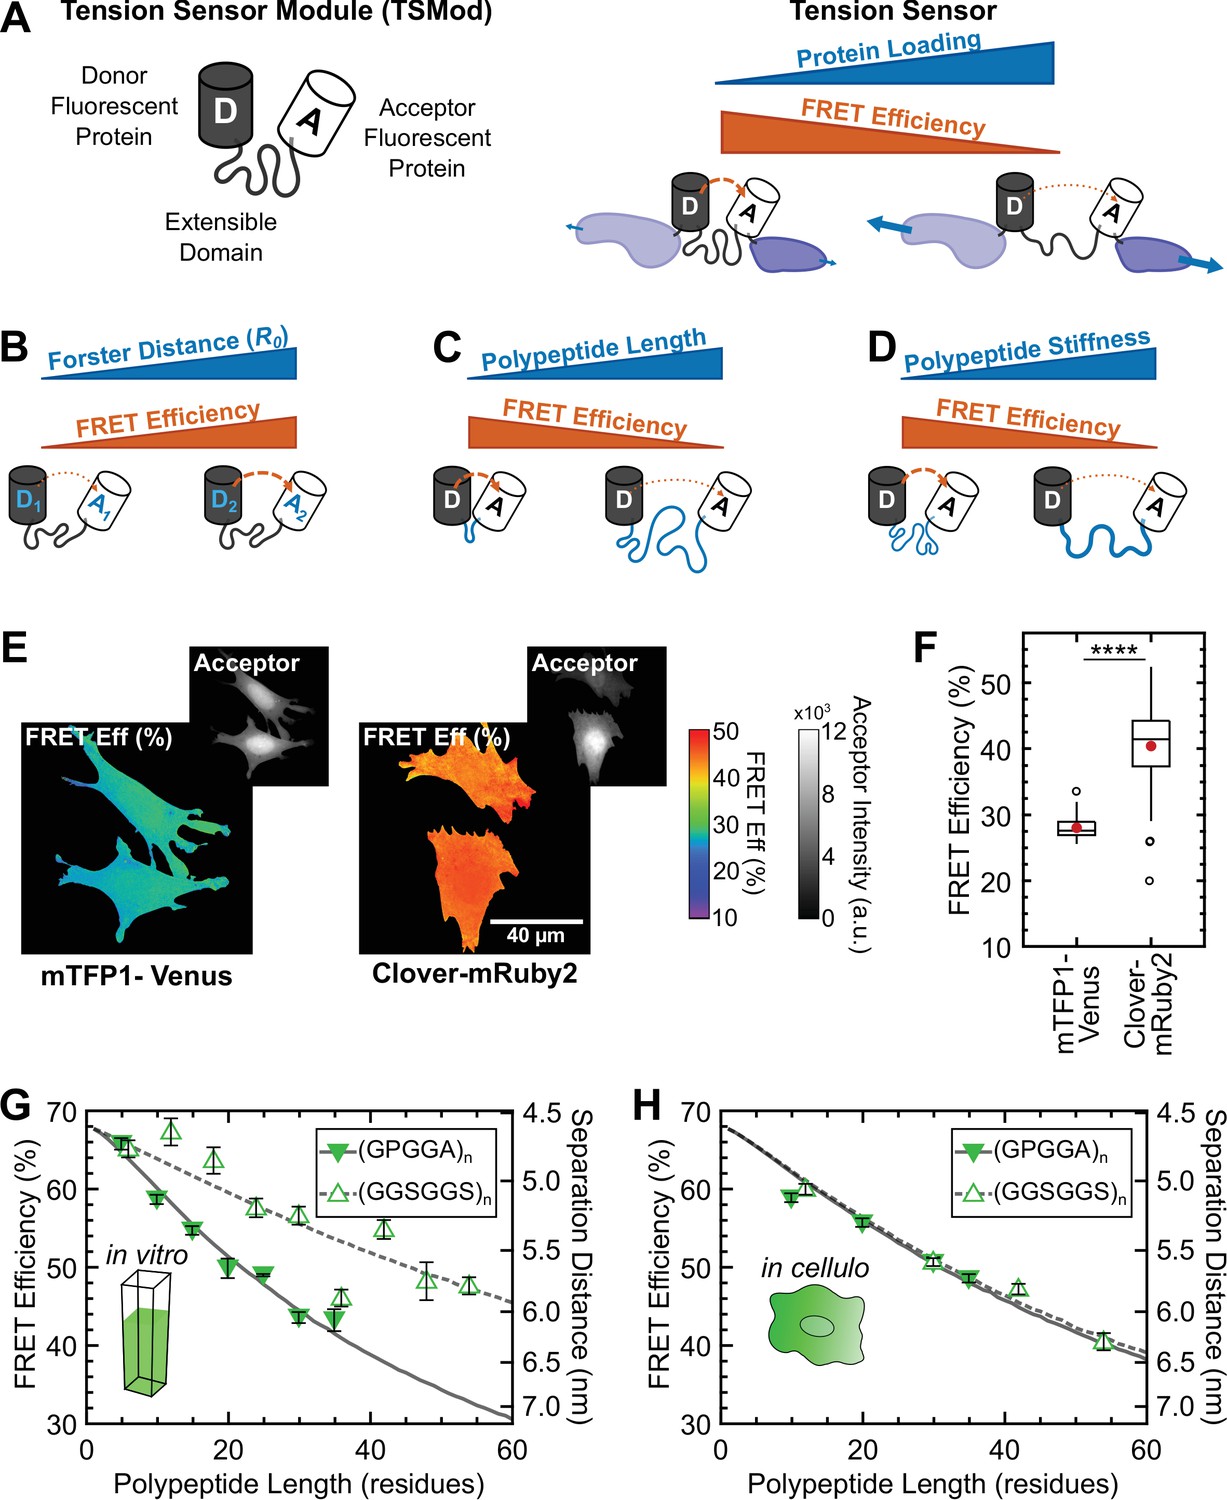
Design and characterization of tunable FRET-based molecular tension sensors.
(A) Schematic depiction of a generic TSMod and inverse relationship between FRET and force for molecular tension sensors under tensile loading. (B-D) TSMod function depends on the Förster radius of the chosen FRET pair (B) as well as the length (C) and stiffness (D) of the extensible polypeptide domain. (E) Representative images of soluble mTFP1-Venus and Clover-mRuby2 TSMods expressed in Vin-/- MEFs. (F) Quantification of unloaded FRET efficiency for mTFP1-Venus and Clover-mRuby2 TSMods; (n = 53 and 92 cells, respectively); red filled circle denotes sample mean; **** p < 0.0001, Student’s t-test, two-tailed, assuming unequal variances. (G) Quantification of FRET-polypeptide length relationship for minimal Clover-mRuby2 TSMods in vitro; each point represents data from at least 5 independent experiments; lines represent model fits where is the only unconstrained parameter. (H) Quantification of FRET-polypeptide length relationship for minimal Clover-mRuby2 based TSMods in cellulo; each point represents at least n = 48 cells from three independent experiments; lines represent model fits where is the only unconstrained parameter. All error bars, s.e.m.
-
Figure 1—source data 1
Measurements and models of the mechanical behavior of TSMods in vitro and in cellulo.
- https://doi.org/10.7554/eLife.33927.010
Figure 1—figure supplement 1
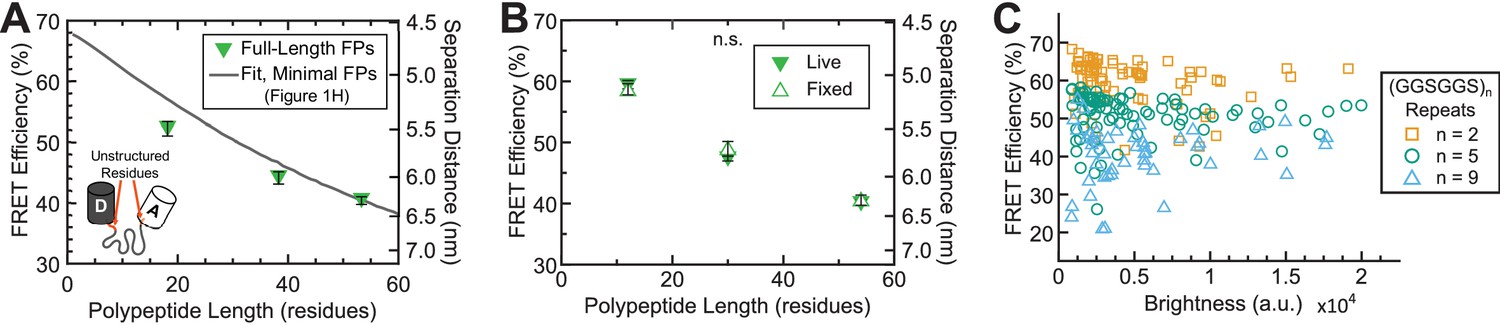
FRET efficiency measurements depend on the presence of unstructured residues in FPs, but are insensitive to fixation and sensor intensity.
(A) Quantification of FRET-polypeptide length relationship for (GPGGA)n extensible domains flanked by full-length Clover-mRuby2 FPs (containing unstructured residues, orange) as compared to model fit of the same module containing ‘minimal’ FPs (from Figure 1H); each point represents at least n = 47 cells pooled from three independent experiments; difference in slope of FRET-length relationship indicates that the unstructured residues in full-length FPs change the effective mechanics of the extensible domain, especially at short polypeptide lengths, an undesirable property in tension sensor modules. (B) Quantification of FRET-polypeptide length relationship for ‘minimal’ Clover-mRuby2 based TSMods in cellulo either live or fixed; each point represents at least n = 9 cells per experiment from three independent experiments; analysis of covariance (ANCOVA) was used to provide a model-independent assessment of statistical differences; ANCOVA interaction term p>0.05 indicates that the relationship between FRET efficiency and polypeptide length is not significantly different (n.s.) between live and fixed conditions; error bars, s.e.m. (C) FRET efficiency measurements as a function of mean acceptor intensity (brightness) for fixed cells expressing TSMods consisting of the ‘minimal’ Clover-mRuby2 FRET pair and (GGSGGS)2,5,9 extensible domains (R2 = 0.06, 0.01, 0.03 and n = 74, 86, 48 cells, respectively; data pooled from three independent experiments).
-
Figure 1—figure supplement 1—source data 1
FRET-length relationships for TSMods in various conditions.
- https://doi.org/10.7554/eLife.33927.005
Figure 1—figure supplement 2
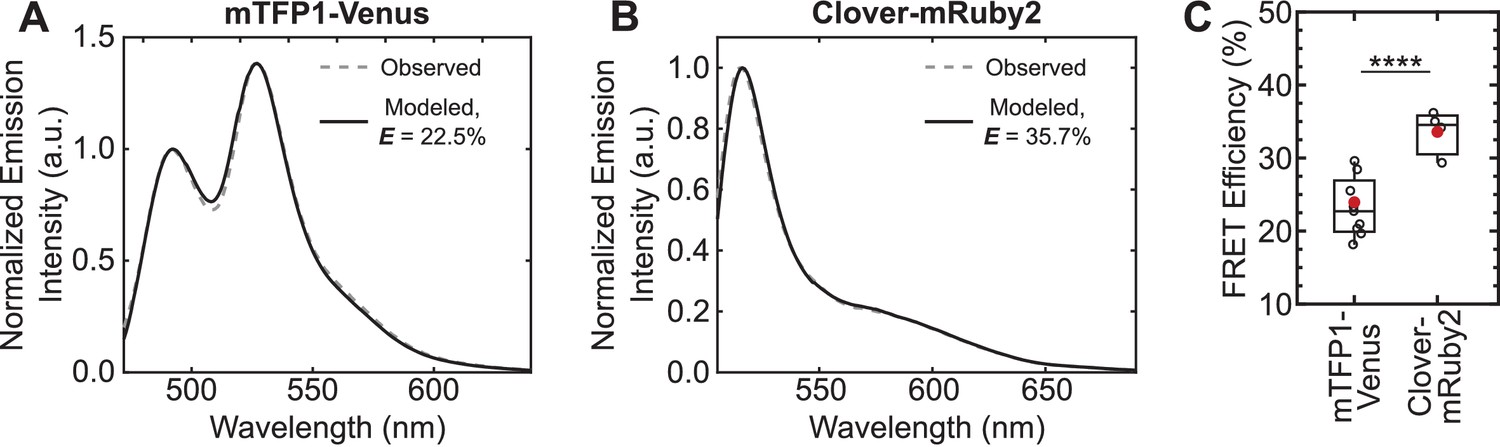
Increase in unloaded FRET efficiency with Clover-mRuby2 sensors in vitro.
(A, B) Representative images of quantitative spectral analysis of mTFP1-Venus (A) and Clover-mRuby2 (B) TSMod fluorescence in cell lysates using the (ratio)A method (Majumdar et al., 2005). (C) Quantification of unloaded FRET efficiency for mTFP1-Venus and Clover-mRuby2 TSMods with (GPGGA)8 extensible domain; (n = 9 and 4 independent experiments, respectively); red filled circle denotes sample mean; ****p<0.0001, Student’s t-test, two-tailed, assuming unequal variances.
-
Figure 1—figure supplement 2—source data 1
Fluorometric FRET measurements.
- https://doi.org/10.7554/eLife.33927.007
Figure 1—figure supplement 3
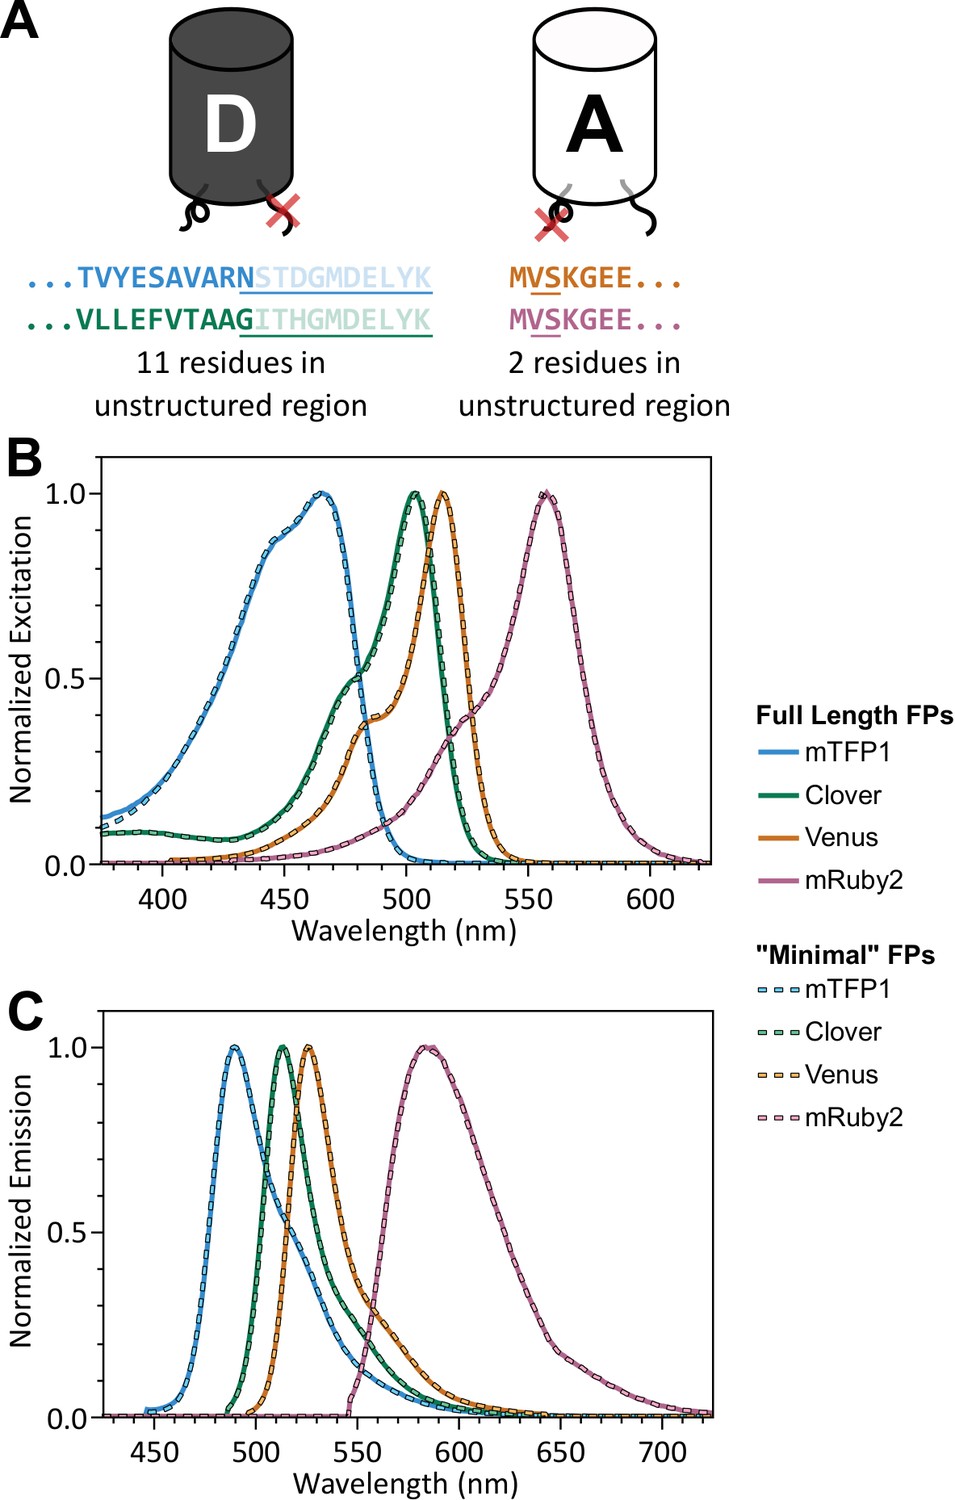
‘Minimal’ FPs exhibit spectral properties indistinguishable from full-length parent FPs.
(A) Schematic of donor and acceptor FPs highlighting 11 C-terminal residues (donor FP) and 2 N-terminal residues (acceptor FP), which do not contribute to beta barrel structure, but are highly conserved between various FPs; residues not appearing in crystal structures are faded (PDB 2HQK and 1MYW for donor and acceptor FPs, respectively); residues that were removed are underlined. (B, C) Normalized excitation (B) and emission (C) spectra for full length and ‘minimal’ versions of mTFP1, Venus, Clover, and mRuby2.
-
Figure 1—figure supplement 3—source data 1
Fluorescent protein spectra.
- https://doi.org/10.7554/eLife.33927.009
Figure 2 with 6 supplements

Predicting TSMod calibrations using a biophysical model.
(A, B) Model descriptions, at various persistence lengths (), of FRET-polypeptide length relationship (A) and FRET-force responses (B) of Cy3 and Cy5 dyes linked by SMCC linker + cysteine modified (GPGGA)n polypeptides; data was digitized based on histograms from (Brenner et al., 2016); model parameters , , (range to ); error bars, s.d. (C) Model predictions of force sensitivity of TSMods comprised of Clover-mRuby2 FRET pair and (GGSGGS)n extensible domains in comparison to the original TSMod (Grashoff et al., 2010); model parameters , , .
-
Figure 2—source data 1
Measurements and models of the mechanical behavior of TSMod-like constructs in vitro.
- https://doi.org/10.7554/eLife.33927.020
Figure 2—figure supplement 1
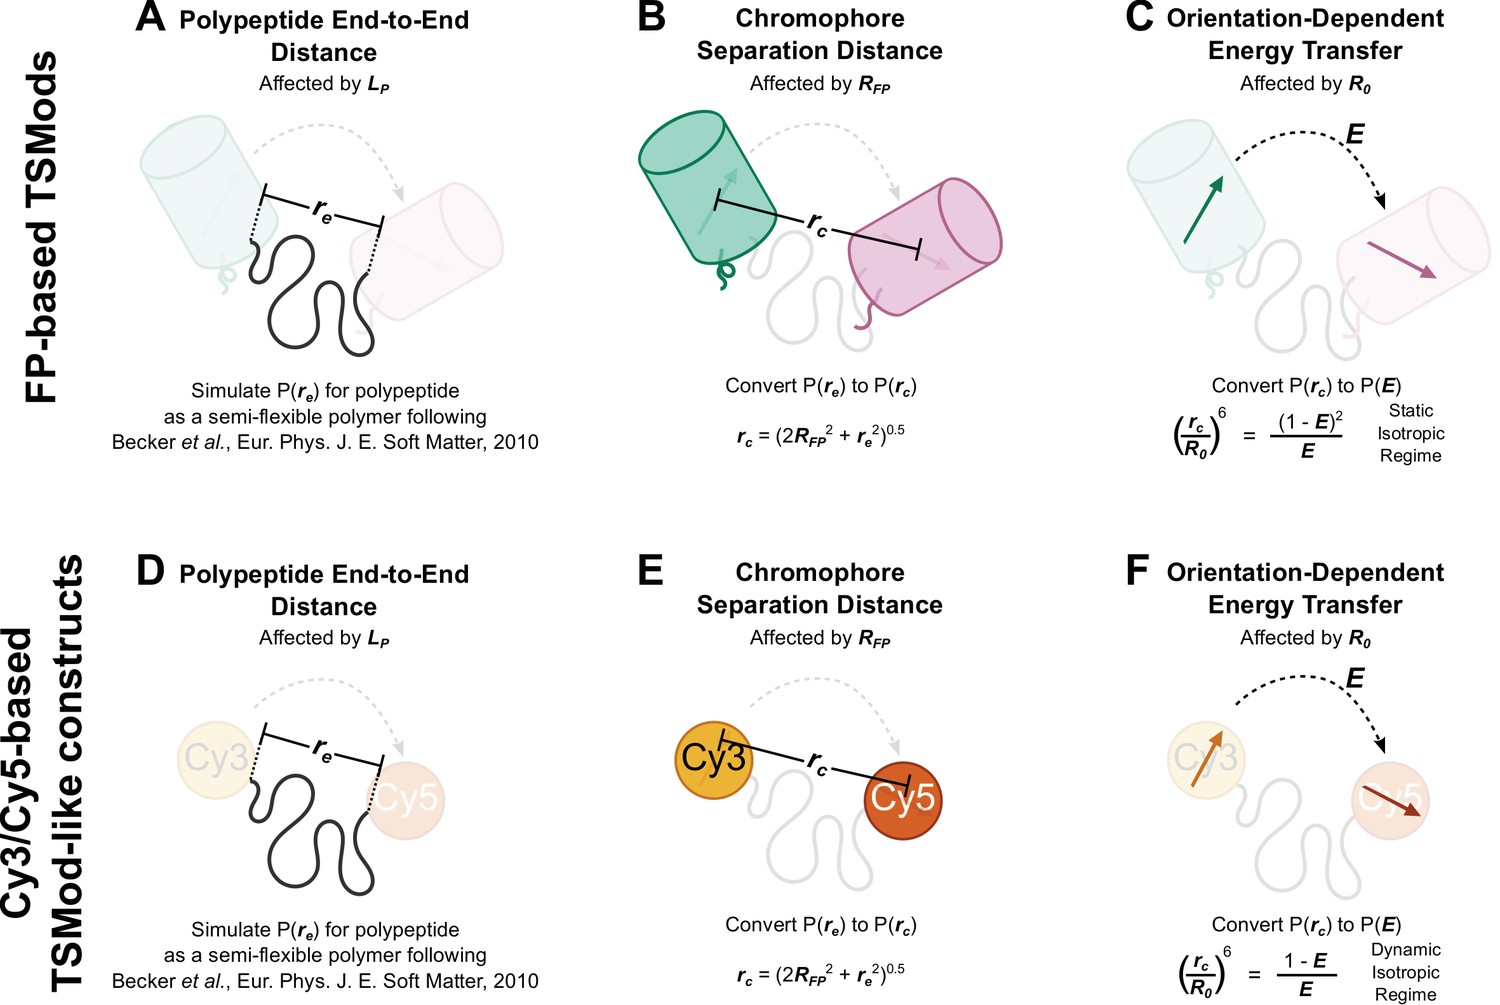
Schematic depiction of biophysical model describing the mechanical sensitivity of TSMods.
(A-C) Mechanical sensitivity of FRET-based TSMods depends on the mechanical properties and length of the extensible domain (A), the physical separation of the chromophores within the FPs (B), and the relative orientation and timescale of rotation of the FPs (C). (D-F) Similarly, the mechanical sensitivity of FRET-based TSMod-like constructs which utilize Cy3 and Cy5 as the fluorescent moiety depends on the mechanical properties and the length of the extensible domain (D), the physical separation of the organic dyes (E), and the relative orientation and timescale of rotation of the dyes (F). Note when modeling large FP-based TSMods, the static isotropic regime of energy transfer is valid, while FRET between organic dyes is more appropriately described by the dynamic isotropic assumption of the classical Förster equation (Vogel et al., 2014).
Figure 2—figure supplement 2
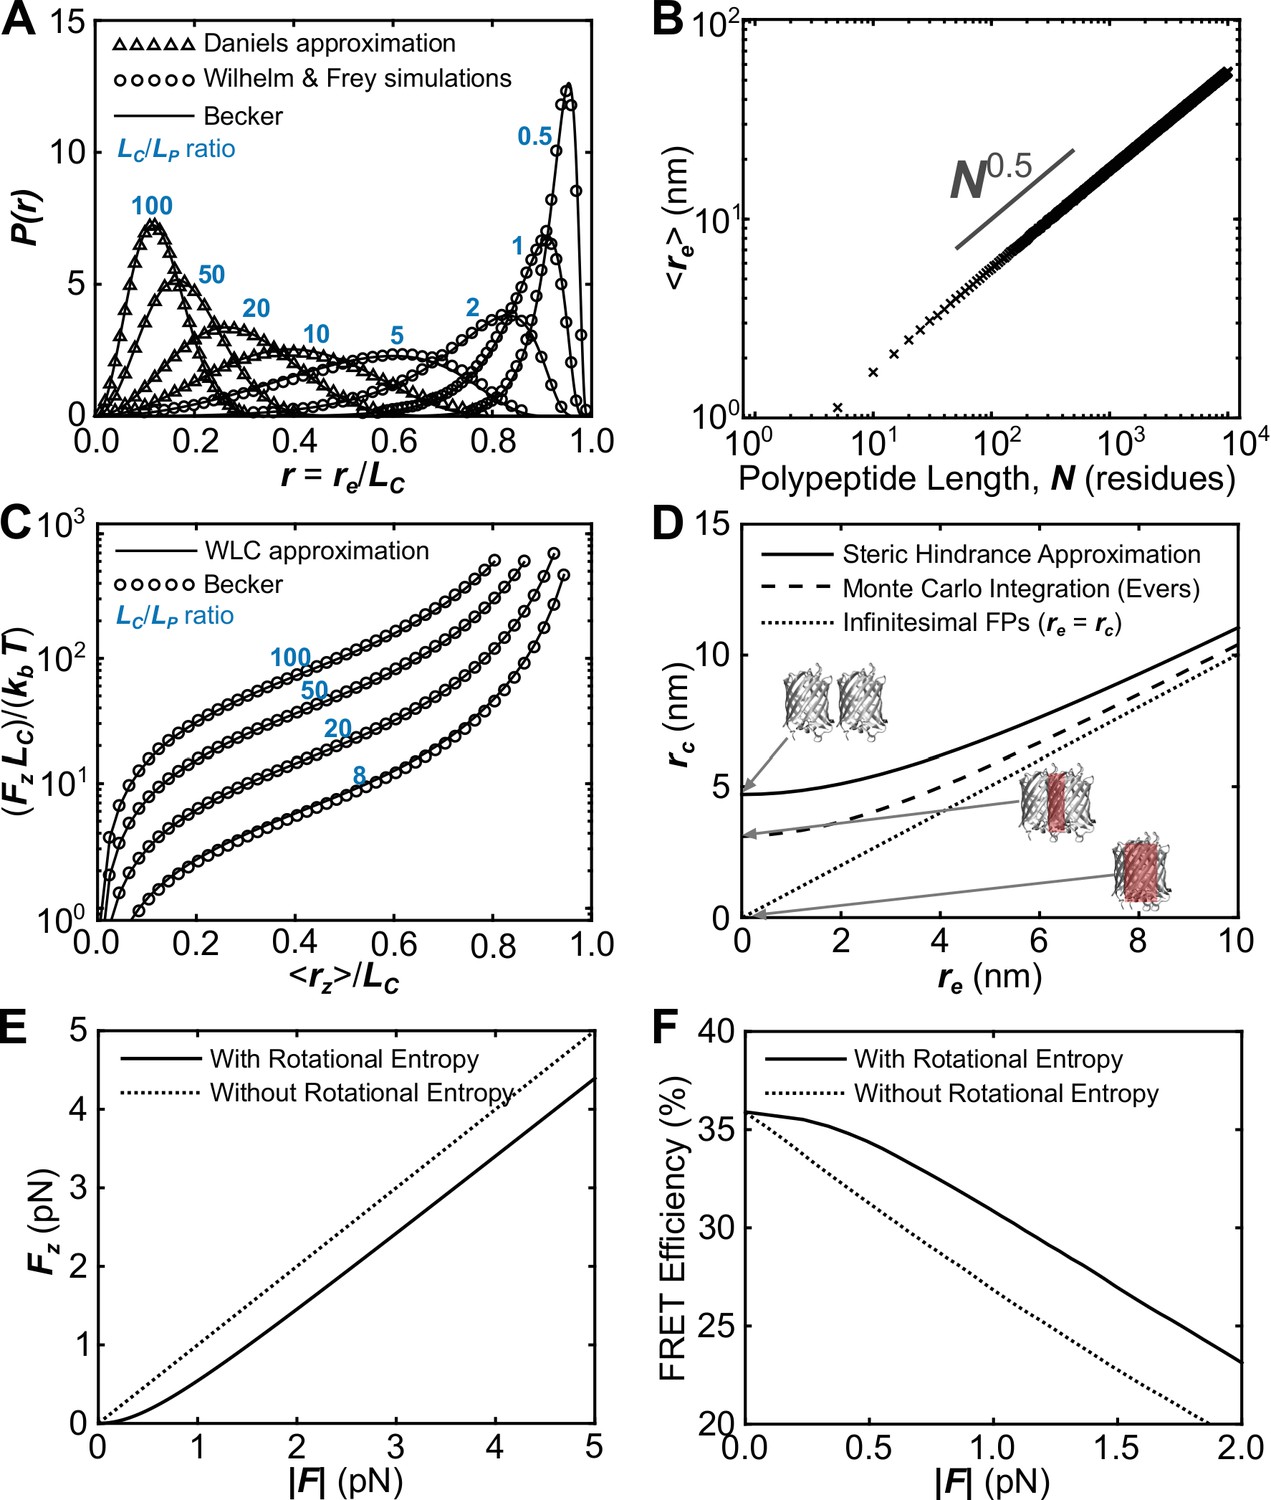
Verification of the proper implementation of a biophysical model describing the mechanical sensitivity of FRET-based TSMods.
(A) Probability distributions of polypeptide end-to-end distance (), normalized to contour length () such that calculated using the second Daniels approximation (Daniels, 1952; Yamakawa and Stockmayer, 1972), simulations from (Wilhelm and Frey, 1996), and an ansatz approximation used in the proposed model based on (Becker et al., 2010) that smoothly bridges between various mechanical regimes. (B) Demonstration that the numerical ansatz predicts the standard length scaling behavior characteristic of unstructured polypeptides. (C) Under load, the average extension () of the polypeptide extensible domain predicted by the (Becker et al., 2010) ansatz closely follows the previous prediction of the force-extension curve for a worm-like chain (Bouchiat et al., 1999). (D) Possible approaches to estimate the chromophore separation distance (), from polypeptide end-to-end distance (). Note that some approaches predict unphysical overlap of the FPs at short linker lengths, which is highlighted in red for the extreme condition of infinitesimal linker length. (E, F) The proposed model includes a dimensionless group (determined by the applied load, the rest length of the construct, and thermal energy) that heuristically accounts for the effects of rotational entropy. This results in a reduced amount of force transferred through FPs to the polypeptide at low applied force (E); this difference between the force causing extension of the polypeptide () and applied force () manifests in a plateau in the FRET-force relationship at very small loads (F).
-
Figure 2—figure supplement 2—source data 1
Numerical simulations of the mechanical behavior of worm-like chains.
- https://doi.org/10.7554/eLife.33927.014
Figure 2—figure supplement 3
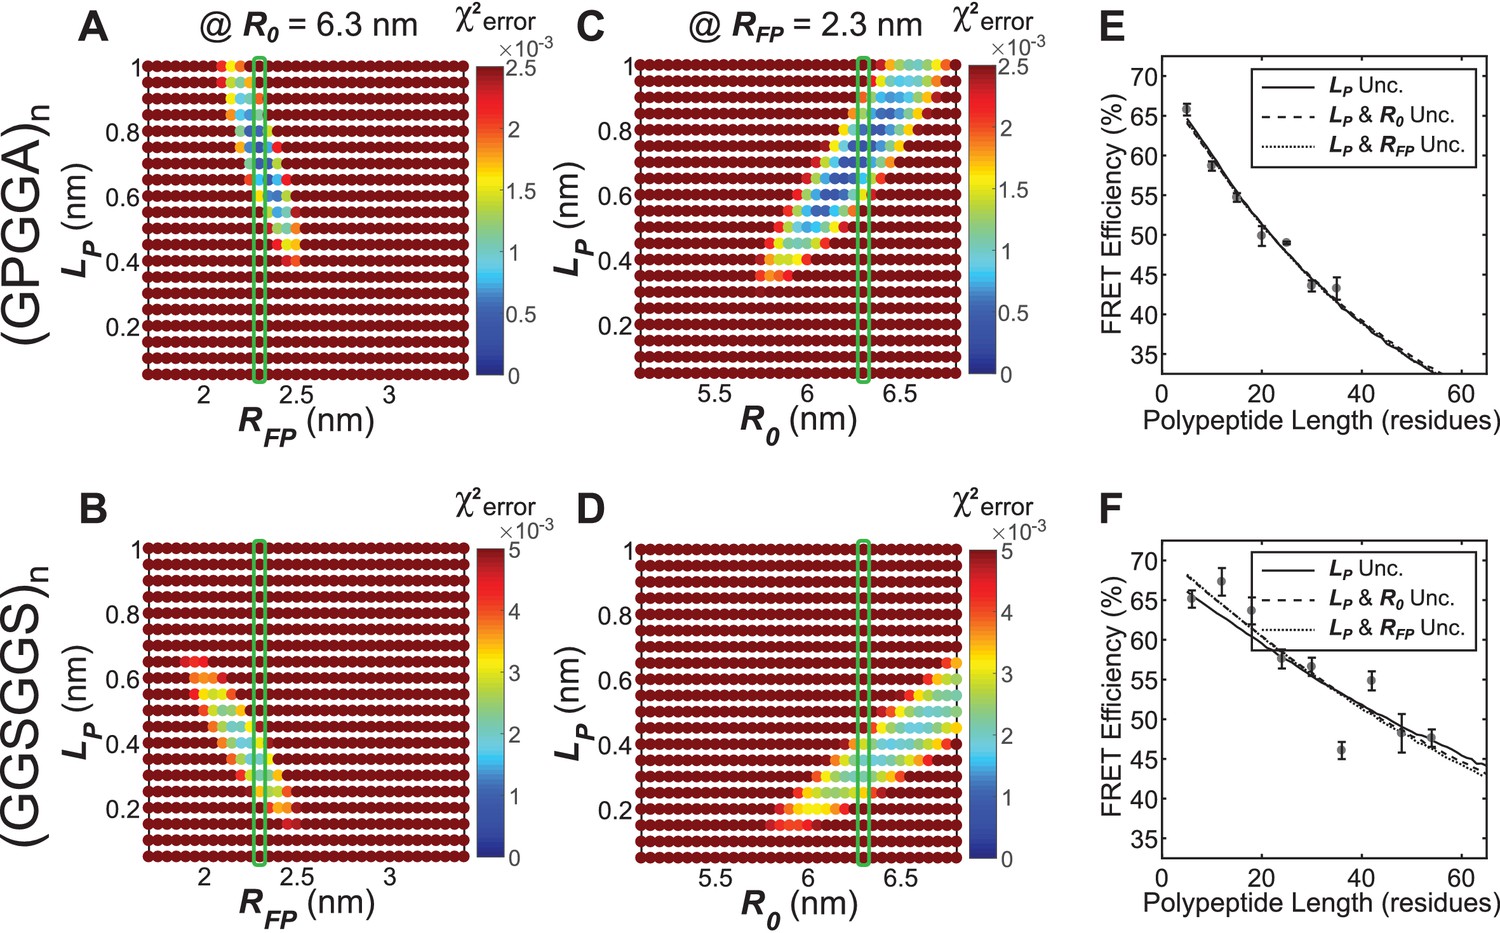
Parameter constraint has minimal effects on measurement of polypeptide persistence length () in vitro.
(A, B) Heatmaps of chi-squared error of model fits to in vitro ‘minimal’ Clover-mRuby2 based TSMod FRET-length measurements for various and for (GPGGA)n (A) and (GGSGGS)n (B) extensible domains; literature estimate of used for parameter constraint highlighted with green bar; is constrained to 6.3 nm. (C, D) As in panels (A and B), except various and parameters were examined; green bar highlights parameter estimate; is constrained to 2.3 nm. (E, F) Model fits to in vitro FRET-length relationships for ‘minimal’ Clover-mRuby2 based TSMods containing the (GPGGA)n (E) or (GGSGGS)n (F) extensible domain are equally accurate with either a single unconstrained (unc.) parameter () or two unconstrained parameters.
Figure 2—figure supplement 4
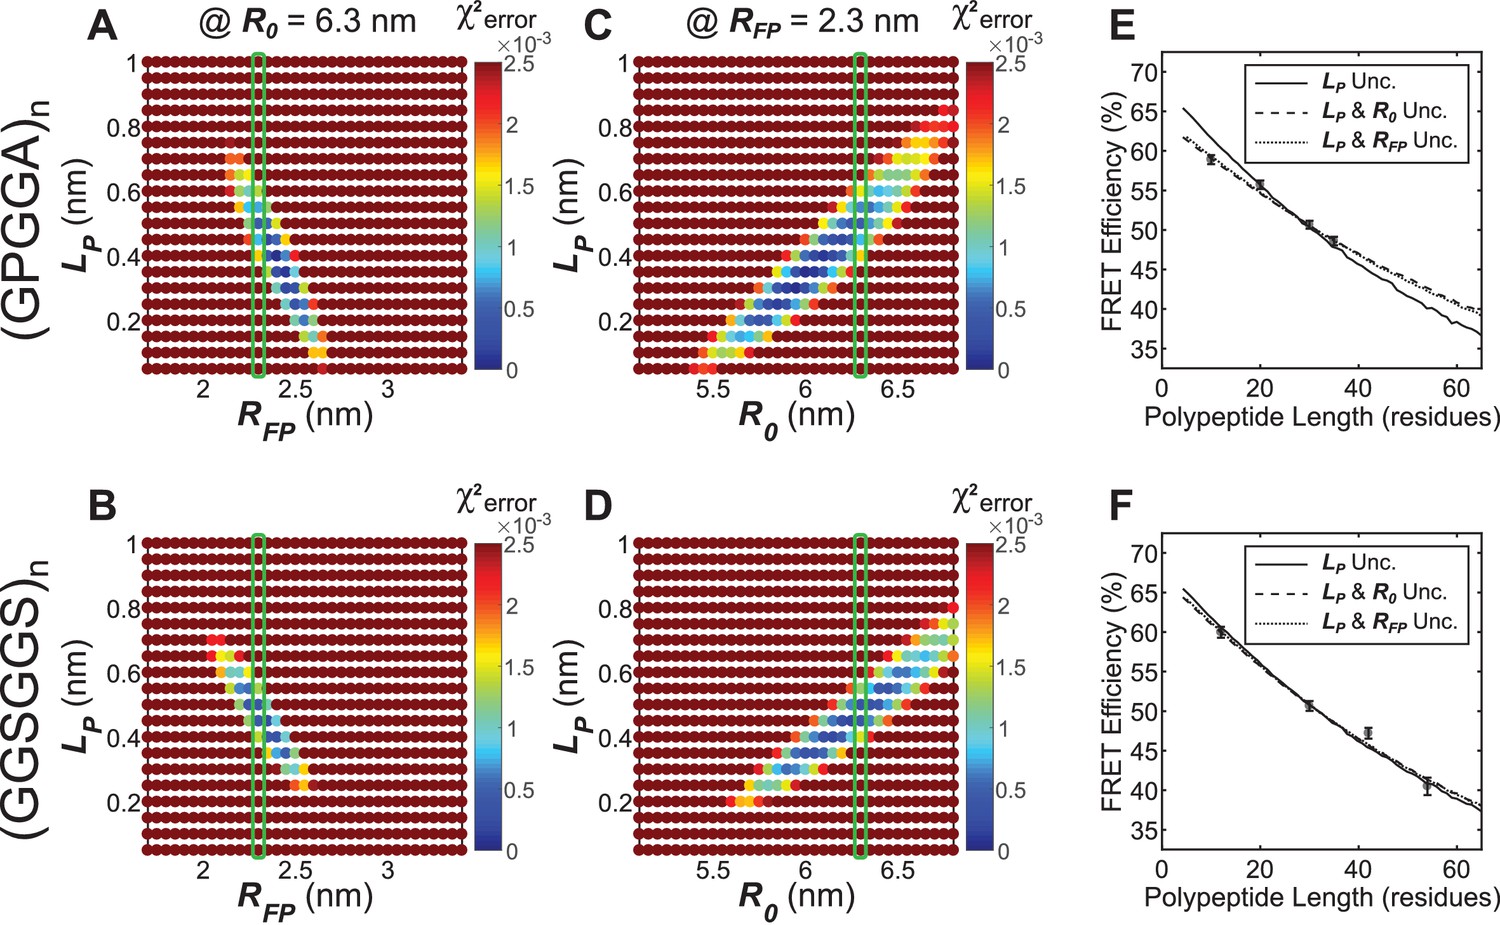
Parameter constraint has minimal effects on measurement of polypeptide persistence length () in cellulo.
(A, B) Heatmaps of chi-squared error of model fits to in cellulo “minimal” Clover-mRuby2 based TSMod FRET-length measurements for various and for (GPGGA)n (A) and (GGSGGS)n (B) extensible domains; literature estimate of used for parameter constraint highlighted with green bar; is constrained to 6.3 nm. (C, D) As in panels (A and B), except various and parameters were examined; green bar highlights parameter estimate; is constrained to 2.3 nm. (E, F) Model fits to in cellulo FRET-length relationships for ‘minimal’ Clover-mRuby2 based TSMods containing the (GPGGA)n (E) or (GGSGGS)n (F) extensible domain are equally accurate with either a single unconstrained (unc.) parameter () or two unconstrained parameters.
Figure 2—figure supplement 5
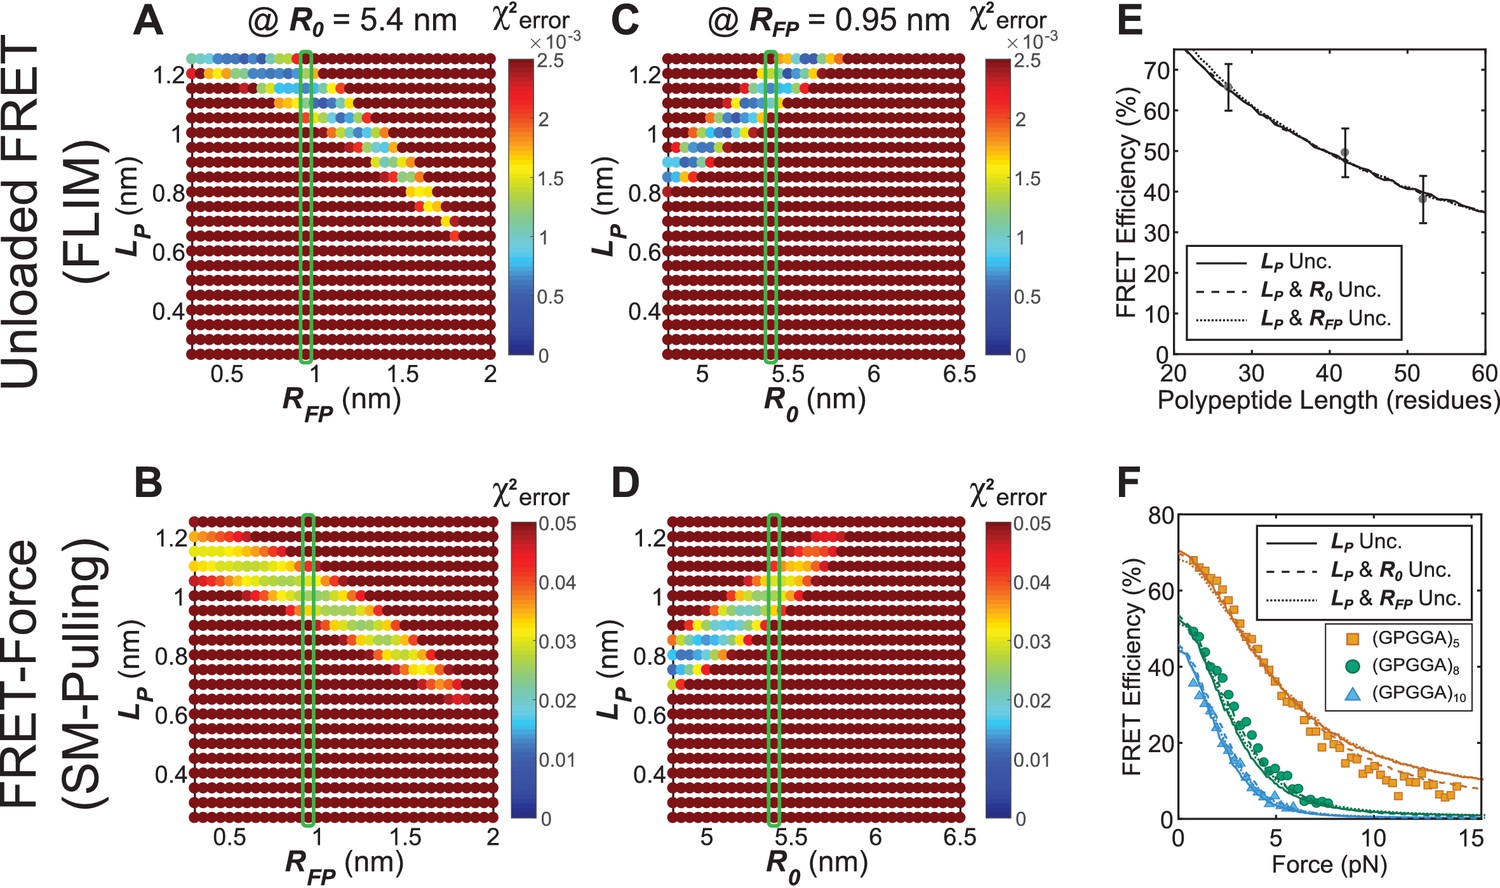
Parameter constraint has minimal effects on measurement of polypeptide persistence length () for TSMod-like constructs in unloaded or loaded conditions.
(A, B) Heatmaps of chi-squared error of model fits to published fluorescence-force spectroscopy measurements of (GPGGA)5,8,10 extensible domains flanked by Cy3 and Cy5 fluorescent dyes in unloaded (A) and loaded (B) conditions; literature estimate of used for parameter constraint highlighted with green bar; is constrained to 5.4 nm. (C, D) As in panels (A and B), except various and parameters were examined; green bar highlights parameter estimate; is constrained to 0.95 nm. (E, F) Model fits to published fluorescence-force spectroscopy data of TSMod-like constructs in unloaded (E) and loaded (F) conditions are equally accurate with either a single unconstrained (unc.) parameter () or two unconstrained parameters.
Figure 2—figure supplement 6
Experimental and theoretical examinations of other models (Brenner et al., 2016) of (GPGGA)n mechanical sensitivity.
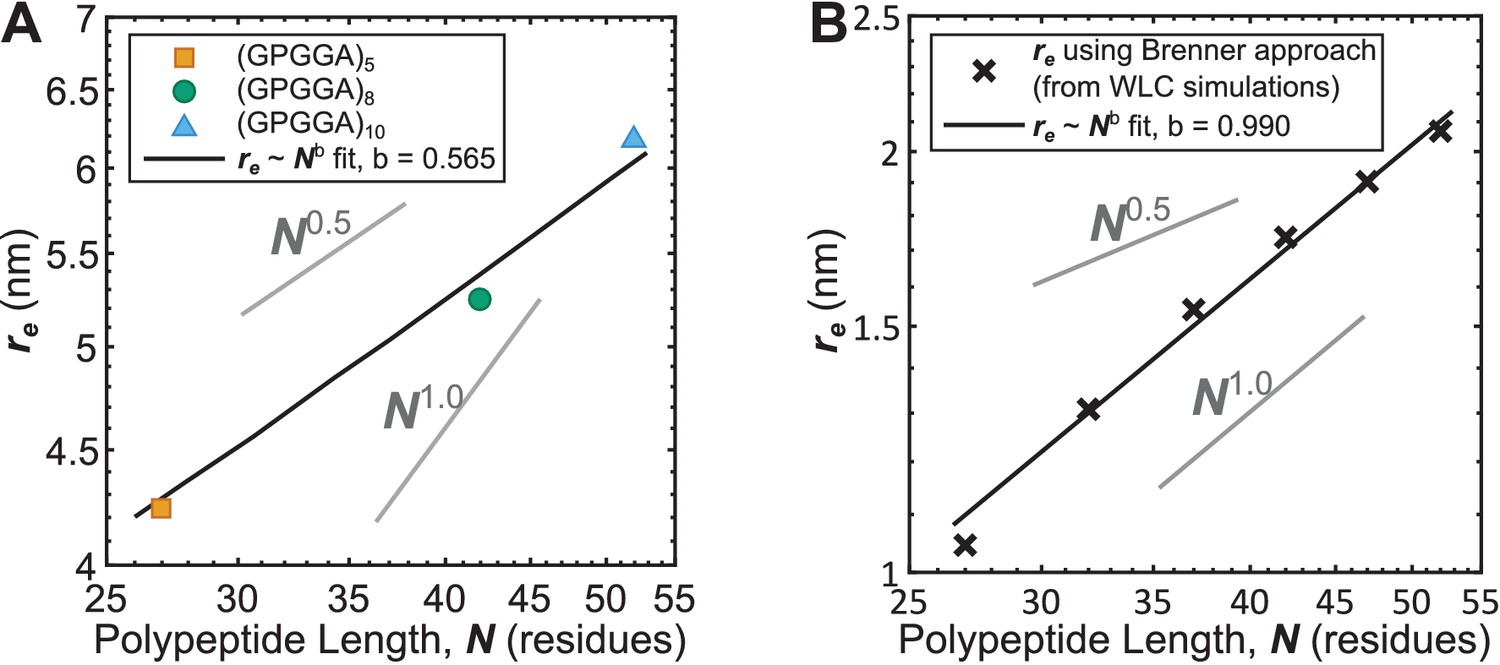
(A) Measured relationship between average polypeptide end-to-end distance as a function of the number of residues in the (GPGGA)n extensible domain shows behavior characteristic of unstructured polypeptides; data transformed from Figure 2A using the proposed model of TSMod mechanical sensitivity. (B) After simulating unstructured polypeptides of various lengths in the context of the WLC model, calculation of using the approach put forth by (Brenner et al., 2016) yields an artificial behavior. Note that plots are logarithmic on both axis such that power-law relationships appear as straight lines.
-
Figure 2—figure supplement 6—source data 1
Comparitive analysis of models of flagelliform polypeptide mechanics.
- https://doi.org/10.7554/eLife.33927.019
Figure 3 with 2 supplements
Optimized tension sensor reveals sub-FA gradients in vinculin tension.
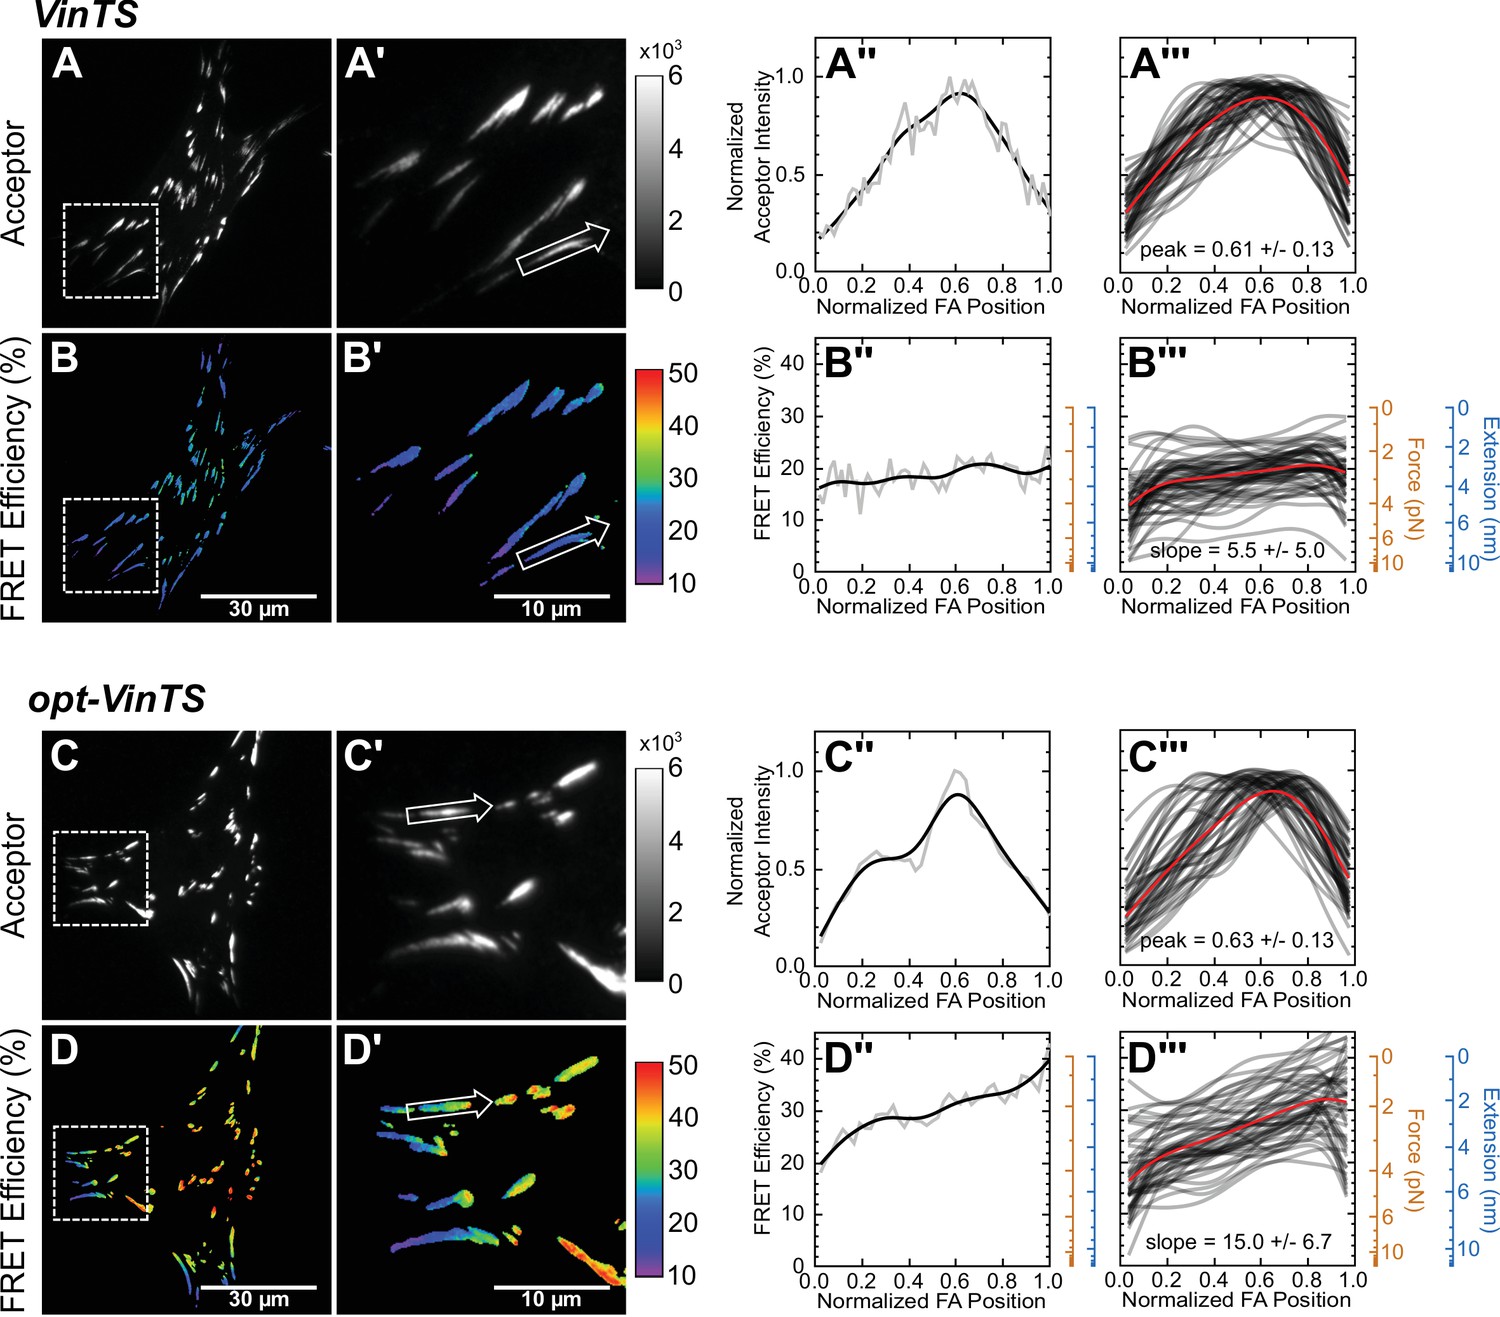
(panels A and B) Representative images of subcellular distribution of VinTS (Grashoff et al., 2010) (A, A’) along with representative (A’’) and aggregate (A’’’) line scans of single FAs of size >0.5 μm2 and axis ratio >1.5; corresponding masked FRET images (B, B’) and line scans (B’’, B’’’); n = 55 FAs from n = 11 cells from three independent experiments; averaged intensity and FRET profiles in red. (panels C and D) As in panels (A and B), but with optimized opt-VinTS construct; n = 49 FAs from n = 10 cells from three independent experiments.
Figure 3—figure supplement 1
Selection of optimal (GGSGGS)n extensible domain length in a Clover-mRuby2 based TSMod for measuring ~1-6 pN loads borne by vinculin.
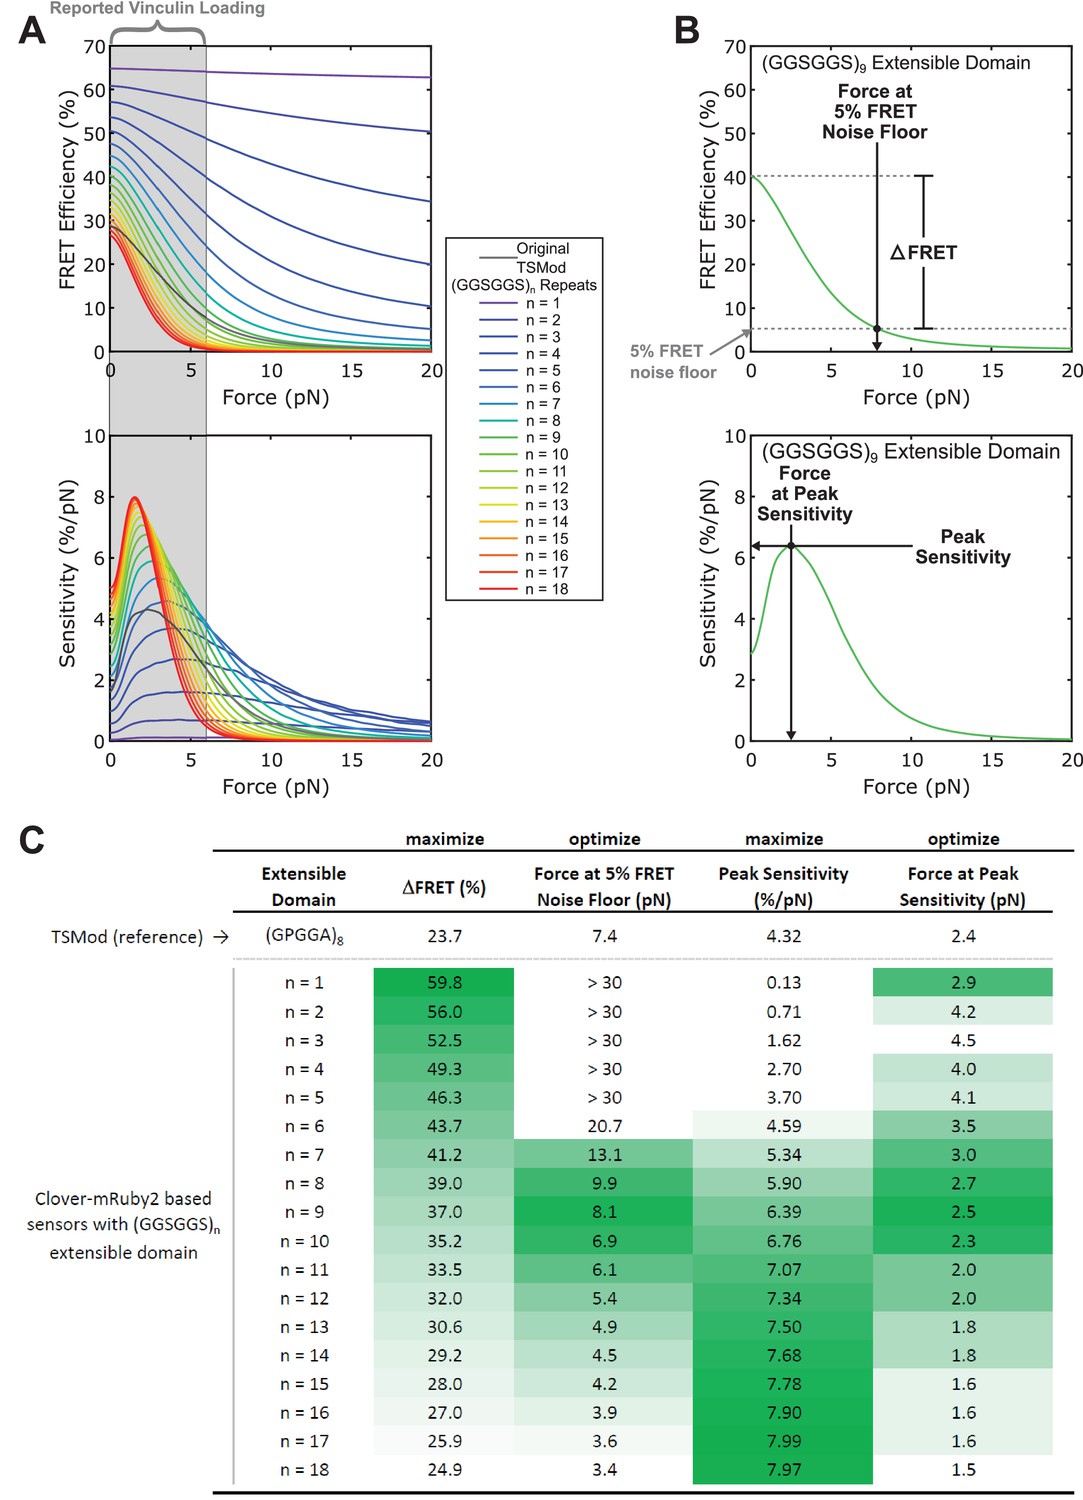
(A) Predicted force sensitivities of TSMods containing “minimal” Clover-mRuby2 FRET pair and (GGSGGS)n extensible domains (n =1 to 16). (B) Schematic of metrics used to quantify and compare different aspects of TSMod mechanical sensitivity, which describe sensor sensitivity (, top; Peak Sensitivity, bottom) and functional force measurement regimes (Force at 5% FRET noise floor, top; Force at Peak Sensitivity, bottom) (C) Graphical comparison of TSMod mechanical sensitivity properties; green indicates favorable value for a given metric. Nine-repeat (GGSGGS)n extensible domain shows similar force range as original TSMod (columns 2, 4) as well as a good balance between (column 1) and Peak Sensitivity (column 3), which are inversely proportional.
Figure 3—figure supplement 2

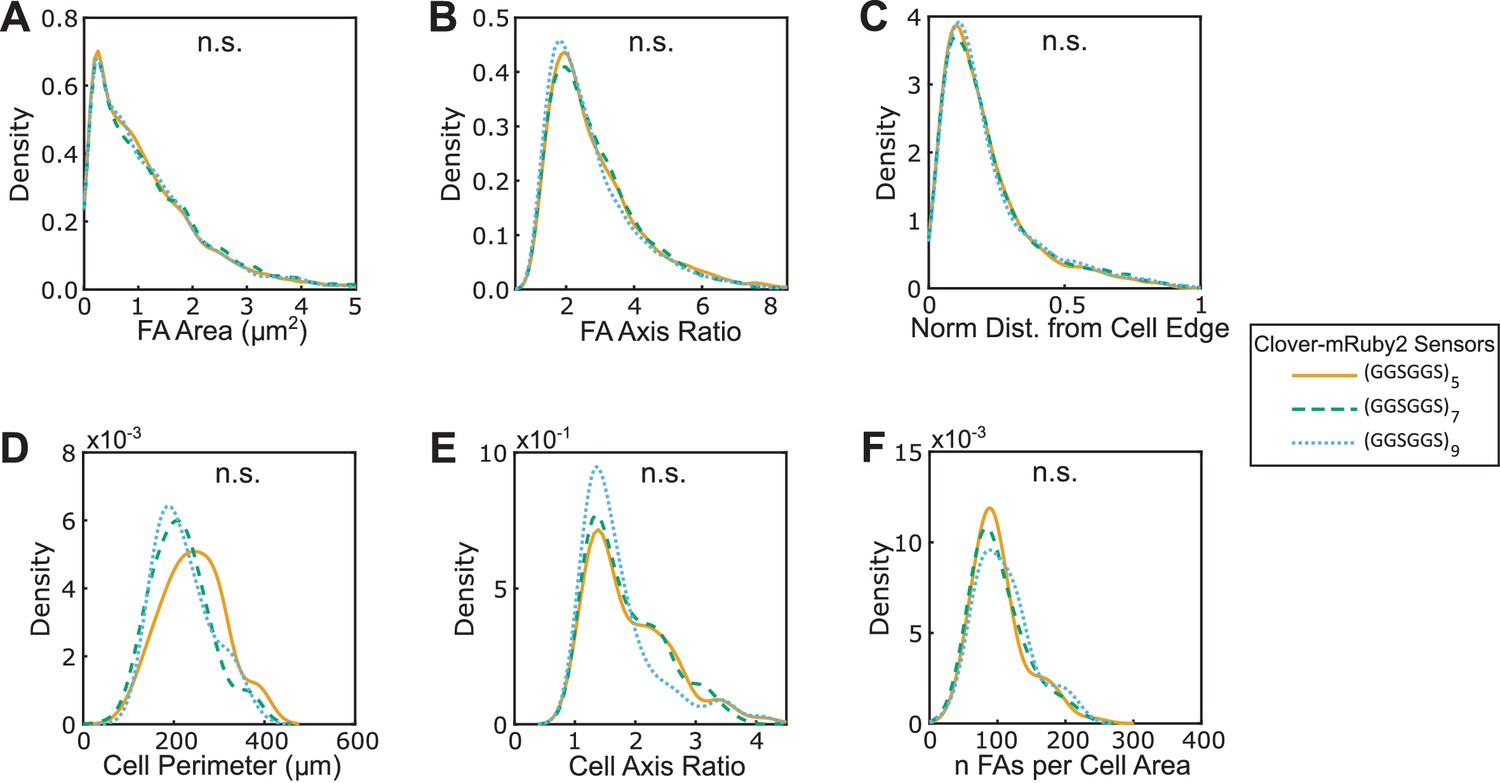
FA morphologies, cell morphologies, and sensor localization to FAs are indistinguishable between different versions of VinTS.
(A-F) Vin-/- MEFs expressing various version of VinTS show indistinguishable FA area (A), FA axis ratio (B), subcellular distributions of FAs quantified as normalized distance from cell edge (C), cell perimeter (D), cell axis ratio (E), number of FAs normalized by cell area (F). Different versions of the tension sensor include those constructed with minimal Clover-mRuby2 modules containing three distinct extensible domains, namely (GGSGGS)5 (n = 98 cells), (GGSGGS)7 (n = 79 cells), (GGSGGS)9 (n = 63 cells), along with the original TSMod containing a (GPGGA)8 extensible domain (n = 48 cells), each from at least three independent experiments; n.s. not significant (p≥0.05), ANOVA. See Supplementary file 4 for exact p-values.
Figure 4 with 9 supplements
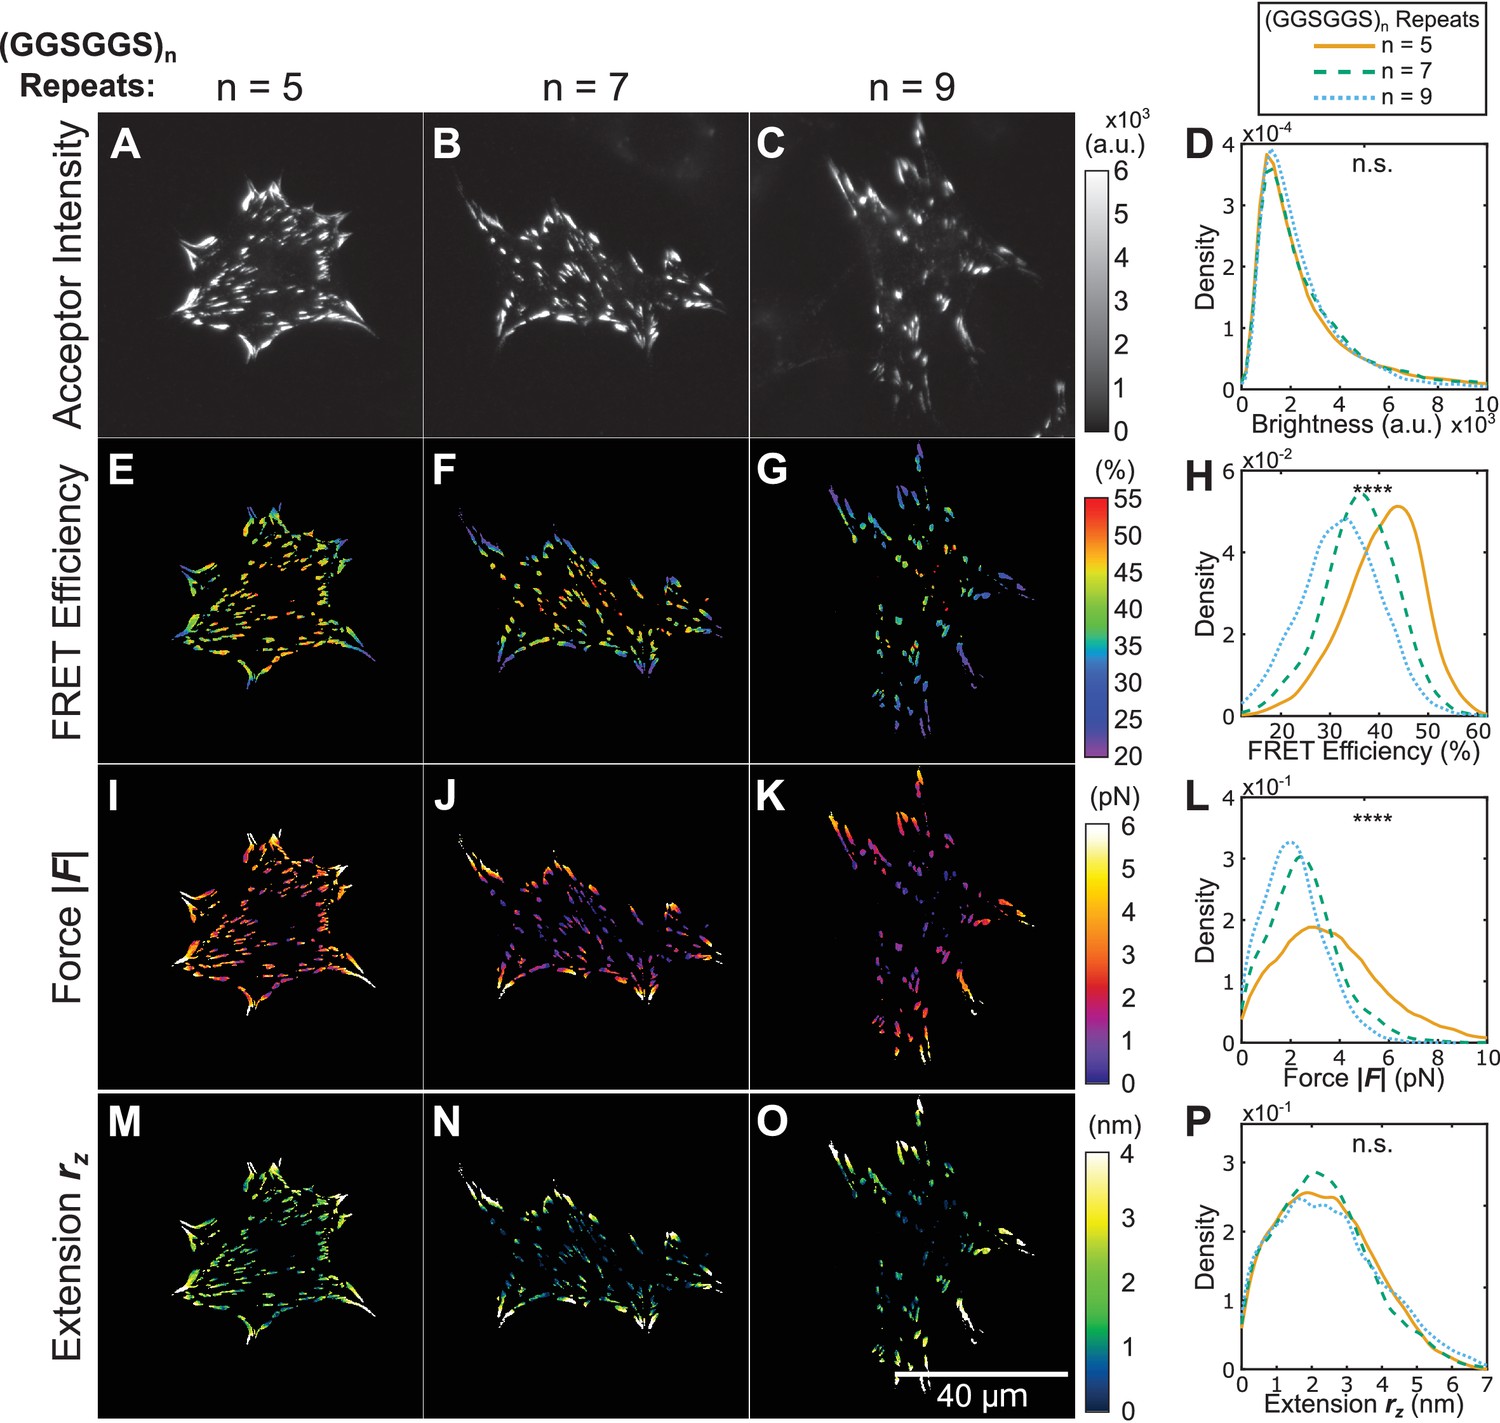
Using tension sensors with distinct mechanical sensitivities to test force-based versus extension-based control of vinculin loading.
(A-C) Representative images of the localization of a trio of vinculin tension sensors to FAs. (D) Normalized histograms of acceptor intensities at FAs are indistinguishable between the three sensors. (E-G) Representative images of masked FRET efficiency and (H) normalized histograms of average FA FRET reported by each sensor. (I-K) Representative images of forces and (L) normalized histograms of average vinculin force in FAs reported by each sensor. (M-O) Representative images of extension and (P) normalized histograms of average vinculin extension in FAs reported by each sensor. Note that ~12% of FAs exhibited negative forces/extensions and were excluded from the analysis in panels (L and P). All normalized histograms depict data from individual FAs; n = 98, 79, 63 cells and n = 11900, 9461, 7569 FAs for (GGSGGS)5,7,9 extensible domains, respectively; data pooled from six independent experiments; ****p<0.0001, n.s. not significant (p≥0.05), ANOVA. See Supplementary file 4 for exact p-values and multiple comparisons test details.
Figure 4—figure supplement 1

Schematic depiction of force-extension relationships and potential force- and extension-control paradigms.
(A, B) A force-control paradigm cannot be detected if only a single sensor is used (A), but can be discerned if multiple sensors report the same forces, but distinct extensions (B). (C, D) An extension-control paradigm also cannot be detected if a single sensor is utilized (C), but can be uncovered if multiple sensors report the same extension and therefore distinct forces across a protein of interest (D). Curves are predictions of the force-extension curve of the WLC model with persistence lengths of 0.5 nm and contour lengths corresponding to the (GGSGGS)5,7,9 linkers utilized in this study (orange, green, and blue, respectively).
Figure 4—figure supplement 2

Evaluating gradients in vinculin extension and force at the sub-FA length scale.
(A-D) Line scans of single FAs of size >0.5 μm2 and axis ratio >1.5 were compiled and averaged to quantify the spatial distribution of acceptor intensity (A), as well as corresponding FRET efficiencies (B), forces (C), and extensions (D) reported by each of the three distinct tension sensors; shaded region depicts 95% confidence interval for averaged spatial profile; n = 46, 45, 50 FAs from n = 9, 9, 10 cells from three independent experiments.
Figure 4—figure supplement 3

Effect of Y-27632 treatment on vinculin extension-control.
(A-C) Representative images of the localization of a trio of vinculin tension sensors to FAs formed in cells treated with Y-27632. (D) Normalized histograms of acceptor intensities at FAs are indistinguishable between the three sensors. (E-G) Representative images of masked FRET efficiency and (H) normalized histograms of average FA FRET reported by each sensor. (I-K) Representative images of forces and (L) normalized histograms of average vinculin force in FAs reported by each sensor. (M-O) Representative images of extension and (P) normalized histograms of average vinculin extension in FAs reported by each sensor. Note that ~10% of FAs exhibited negative forces/extensions and were excluded from the analysis in panels (L and P). All normalized histograms depict data from individual FAs; n = 50, 40, 42 cells and n = 8623, 6944, 7839 FAs for (GGSGGS)5,7,9 extensible domains, respectively; data pooled from three independent experiments; ****p<0.0001, n.s. not significant (p≥0.05), ANOVA. (Q) Quantification of cell-average FRET efficiency in control compared to Y-27632-treated VinTS-expressing cells; data represents ≥40 cells per condition, pooled from three independent experiments; red filled circle denotes sample mean; ****p<0.0001, Student’s t-test, two-tailed, assuming unequal variances. See Supplementary file 4 for exact p-values and multiple comparisons test details.
Figure 4—figure supplement 4

Three versions of VinTS respond similarly to Y-27632 treatment.
(A-F) Vin-/- MEFs expressing various version of VinTS, treated with Y-27632, show indistinguishable FA area (A), FA axis ratio (B), subcellular distributions of FAs quantified as normalized distance from cell edge (C), cell perimeter (D), cell axis ratio (E), number of FAs normalized by cell area (F). Different versions of the tension sensor were constructed with minimal Clover-mRuby2 modules flanking three distinct extensible domains, namely (GGSGGS)5 (n = 50 cells), (GGSGGS)7 (n = 40 cells), (GGSGGS)9 (n = 42 cells), pooled from three independent experiments; n.s. not significant (p≥0.05), ANOVA. See Supplementary file 4 for exact p-values.
Figure 4—figure supplement 5
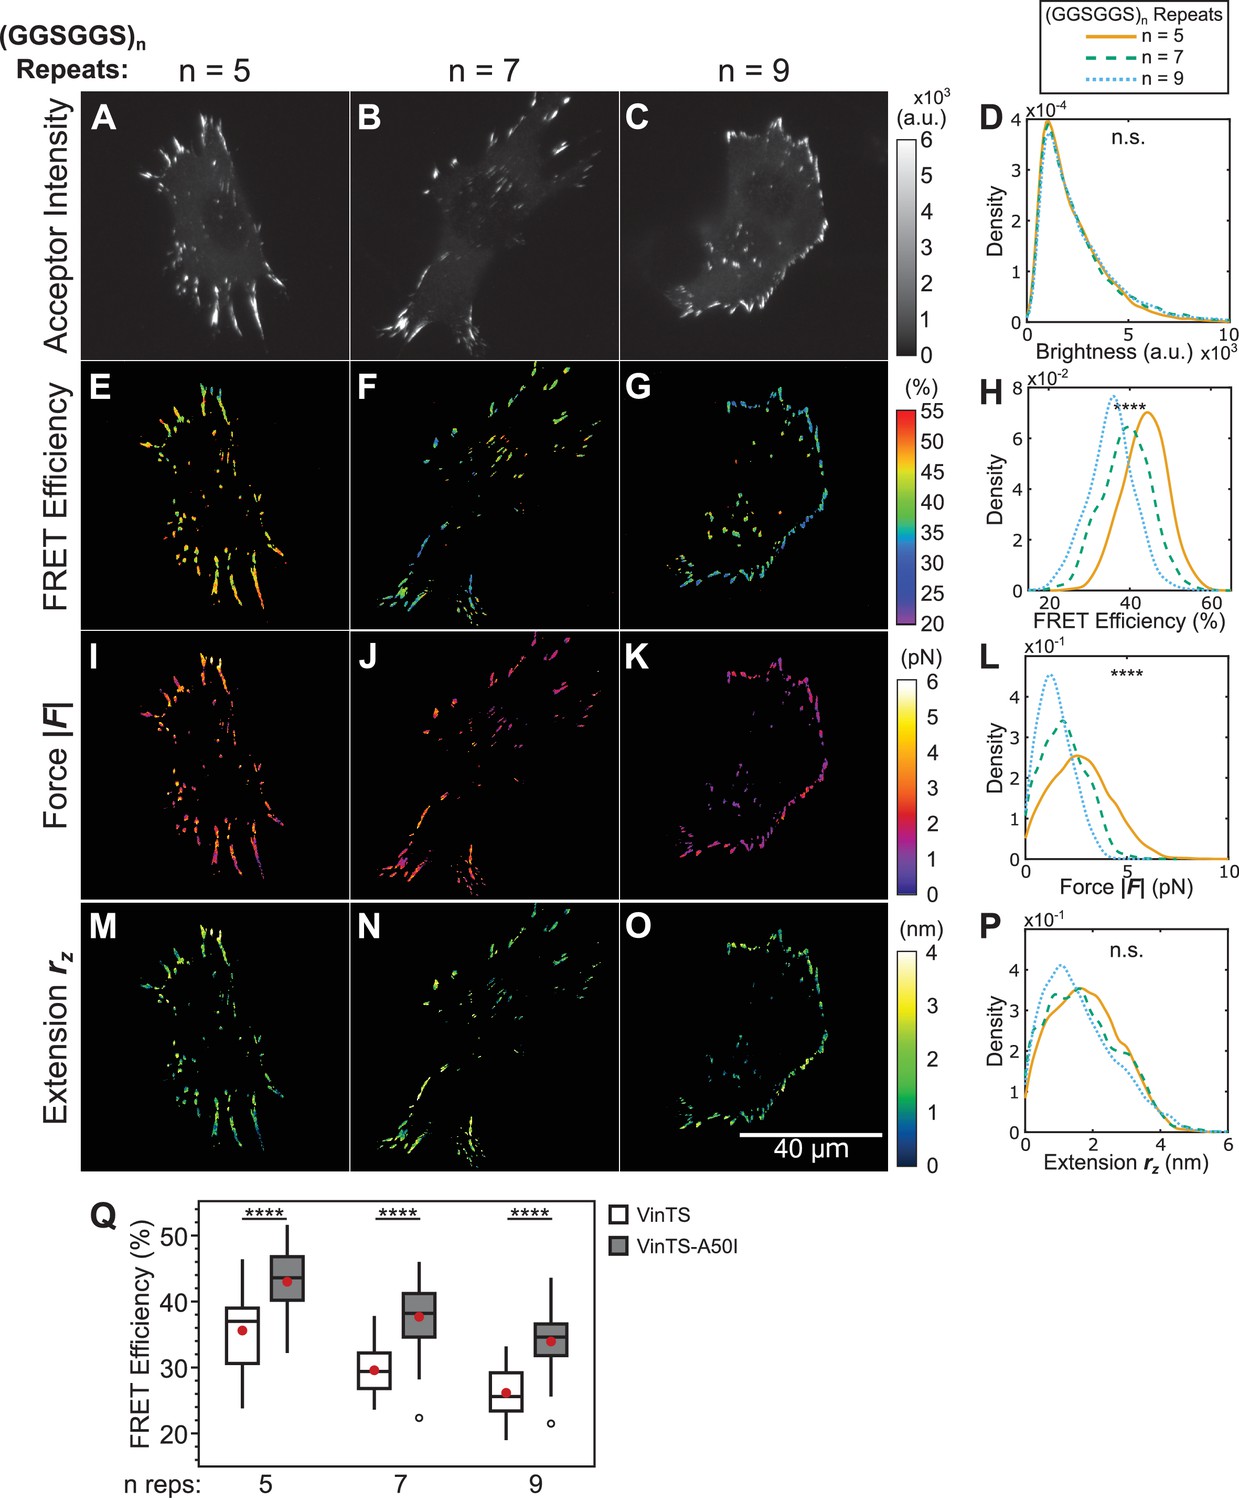
Effect of disrupting vinculin-talin interactions on vinculin extension-control.
(A-C) Representative images of the localization of a trio of vinculin tension sensors containing A50I mutations to FAs. (D) Normalized histograms of acceptor intensities at FAs are indistinguishable between the three sensors. (E-G) Representative images of masked FRET efficiency and (H) normalized histograms of average FA FRET reported by each sensor. (I-K) Representative images of forces and (L) normalized histograms of average vinculin force in FAs reported by each sensor. (M-O) Representative images of extension and (P) normalized histograms of average vinculin extension in FAs reported by each sensor. Note that ~16% of FAs exhibited negative forces/extensions and were excluded from the analysis in panels (L and P). All normalized histograms depict data from individual FAs; n = 60, 58, 62 cells and n = 4759, 3393, 4147 FAs for (GGSGGS)5,7,9 extensible domains, respectively; data pooled from three independent experiments; ****p<0.0001, n.s. not significant (p≥0.05), ANOVA. (Q) Quantification of cell-average FRET efficiency in control VinTS-expressing compared to VinTS-A50I -expressing cells; data represents ≥58 cells per condition, pooled from three independent experiments; red filled circle denotes sample mean; ****p<0.0001, Student’s t-test, two-tailed, assuming unequal variances. See Supplementary file 4 for exact p-values and multiple comparisons test details.
Figure 4—figure supplement 6
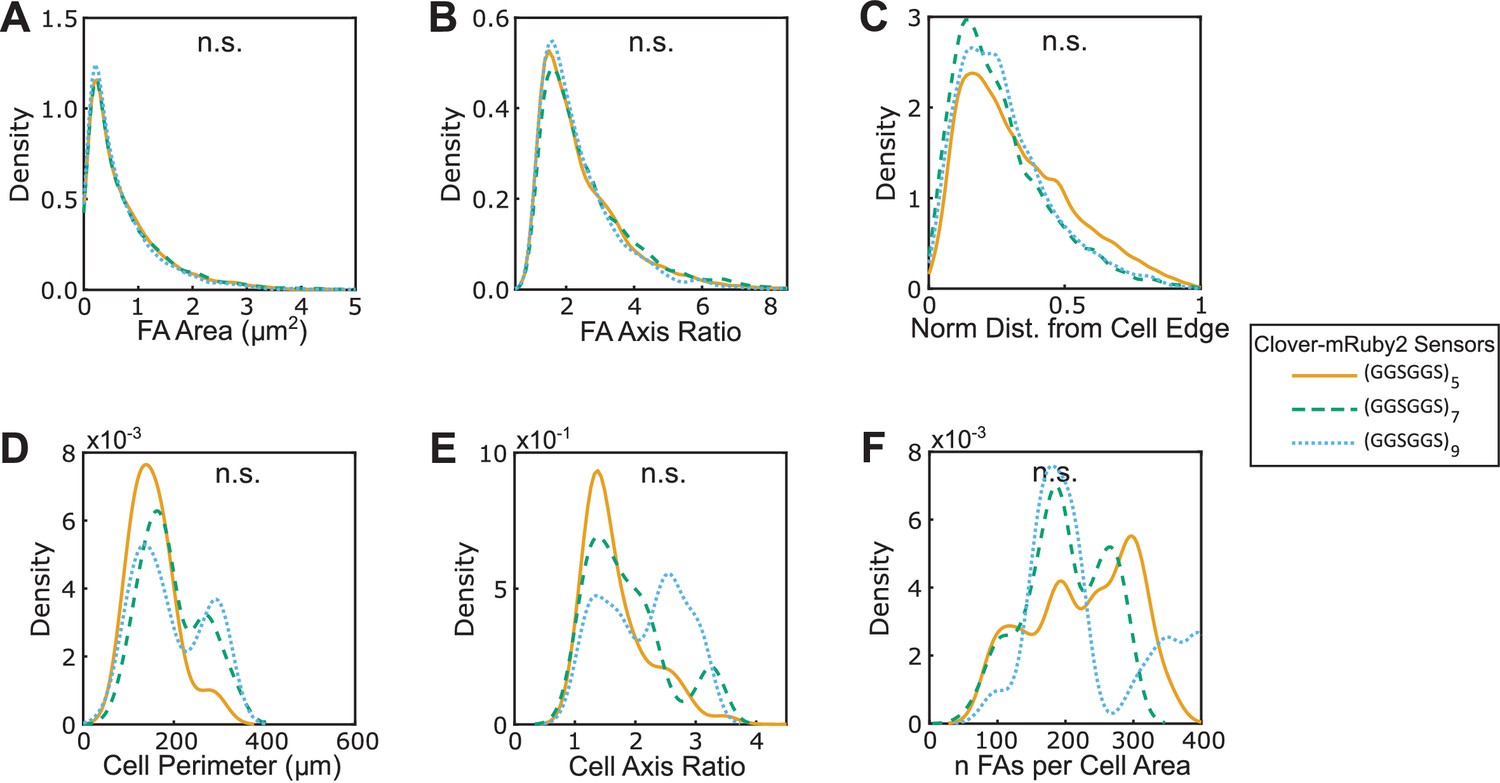
Three versions of VinTS-A50I exhibit similar FA morphologies, cell morphologies, and sensor localization to FAs.
(A-F) Vin-/- MEFs expressing various version of VinTS-A50I show indistinguishable FA area (A), FA axis ratio (B), subcellular distributions of FAs quantified as normalized distance from cell edge (C), cell perimeter (D), cell axis ratio (E), number of FAs normalized by cell area (F). Different versions of the tension sensor were constructed with minimal Clover-mRuby2 modules flanking three distinct extensible domains, namely (GGSGGS)5 (n = 60 cells), (GGSGGS)7 (n = 58 cells), (GGSGGS)9 (n = 62 cells), pooled from three independent experiments; n.s. not significant (p≥0.05), ANOVA. See Supplementary file 4 for exact p-values.
Figure 4—figure supplement 7

Effect of substrate stiffness on vinculin extension-control.
(A-C) Representative images of the localization of a trio of vinculin tension sensors to FAs formed in cells plated on fibronectin-coated 10 kPa gels. (D) Normalized histograms of acceptor intensities at FAs are indistinguishable between the three sensors. (E-G) Representative images of masked FRET efficiency and (H) normalized histograms of average FA FRET reported by each sensor. (I-K) Representative images of forces and (L) normalized histograms of average vinculin force in FAs reported by each sensor. (M-O) Representative images of extension and (P) normalized histograms of average vinculin extension in FAs reported by each sensor. Note that ~8% of FAs exhibited negative forces/extensions and were excluded from the analysis in panels L and P. All normalized histograms depict data from individual FAs; n = 25, 25, 14 cells and n = 2569, 3251, 1800 FAs for (GGSGGS)5,7,9 extensible domains, respectively; data pooled from three independent experiments; ***p<0.001, n.s. not significant (p≥0.05), ANOVA. (Q) Quantification of cell-average FRET efficiency in VinTS-expressing cells plated on glass compared to 10 kPa gels; data represents ≥14 cells per condition, pooled from three independent experiments; red filled circle denotes sample mean; n.s. not significant (p≥0.05), Student’s t-test, two-tailed, assuming unequal variances. See Supplementary file 4 for exact p-values and multiple comparisons test details.
Figure 4—figure supplement 8
Three versions of VinTS respond similarly to softer substrates.
(A-F) Vin-/- MEFs expressing various version of VinTS plated on 10 kPa gels show indistinguishable FA area (A), FA axis ratio (B), subcellular distributions of FAs quantified as normalized distance from cell edge (C), cell perimeter (D), cell axis ratio (E), number of FAs normalized by cell area (F). Different versions of the tension sensor were constructed with minimal Clover-mRuby2 modules flanking three distinct extensible domains, namely (GGSGGS)5 (n = 25 cells), (GGSGGS)7 (n = 25 cells), (GGSGGS)9 (n = 14 cells), pooled from three independent experiments; n.s. not significant (p≥0.05), ANOVA. See Supplementary file 4 for exact p-values.
Figure 4—figure supplement 9
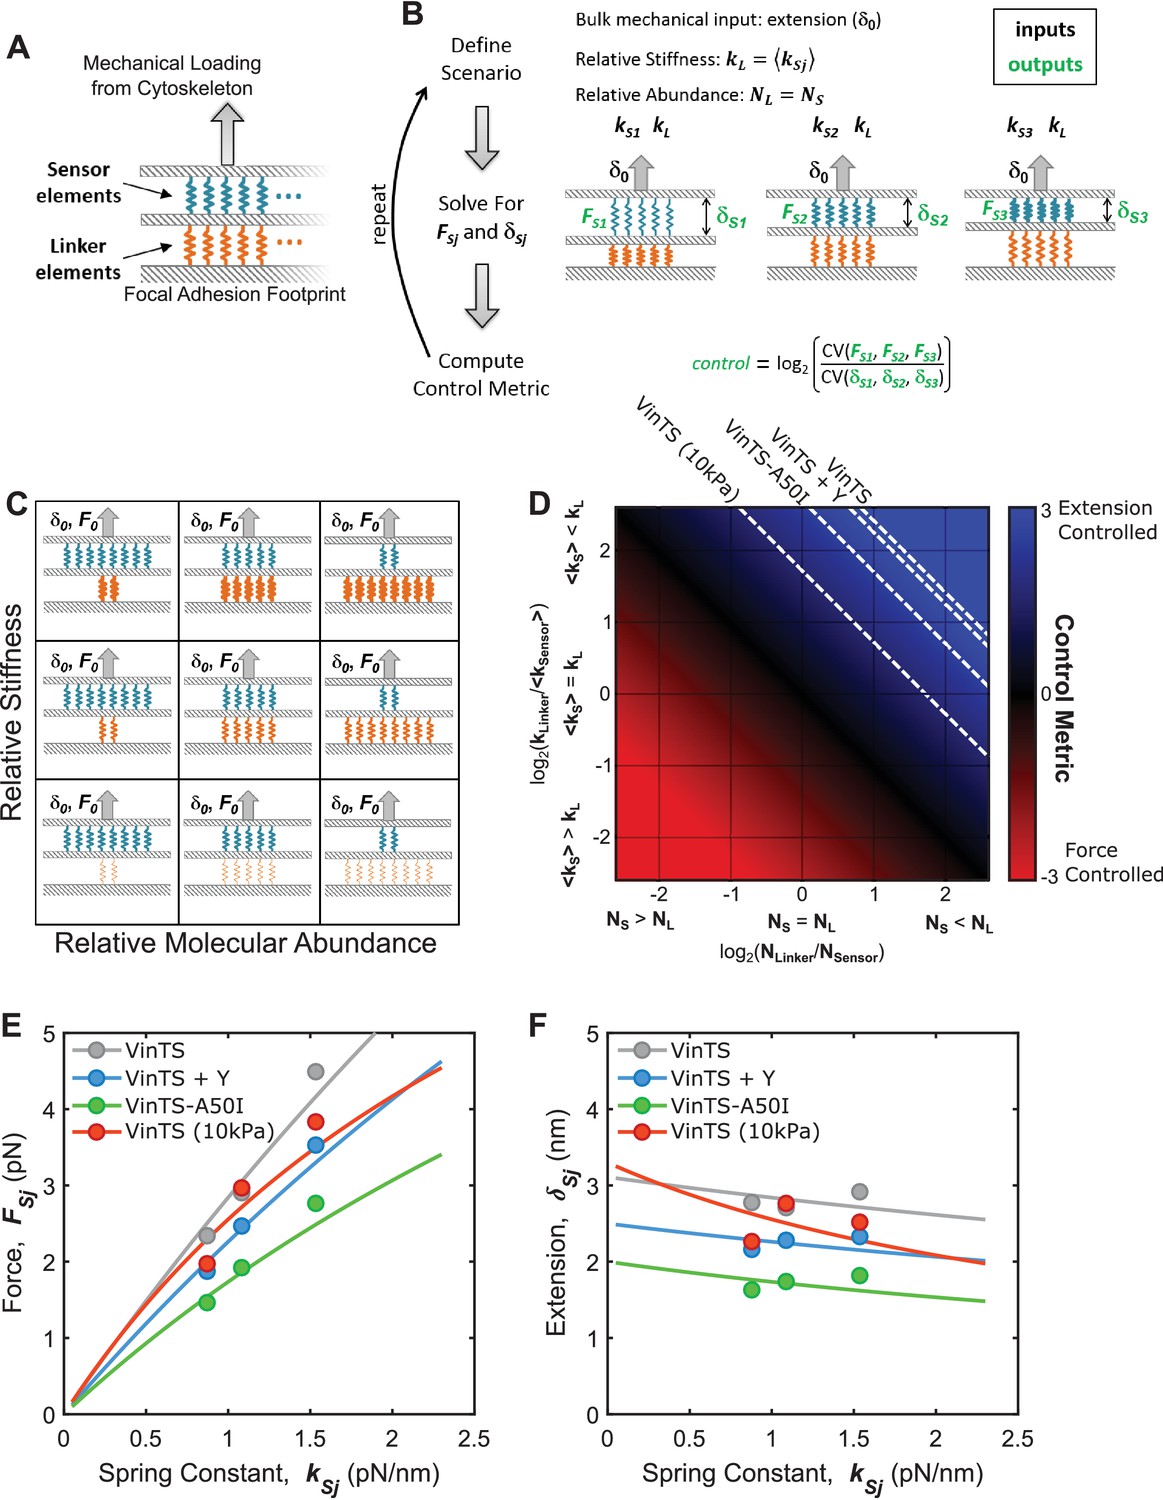
Various structural arrangements within FAs could lead to force-based or extension-based control.
(A) FA structural model consists of two parallel layers of proteins, which can be conceptualized as either ‘sensor’ (blue) or ‘linker’ (orange) elements. (B) Mimicking what was done in experiments (Figure 4), simulations involved three sensor elements with distinct stiffnesses (, , ), arranged in a stratified fashion with a single linker element (stiffness ), loaded by a bulk extension (or force) input. The forces and the extensions experienced by each sensor element were calculated, and a relating the relative variation in forces to the variation in extensions was calculated (see Appendix 2 for details). (C) Schematic depiction of parameter space examined using this simple structural model of FAs, wherein the relative number of the sensor and linker element is varied (x-axis) along with their relative stiffness (y-axis); thicker springs indicate stiffer mechanics. (D) Summary of results from simulations quantifying force-controlled versus extension-controlled loading of the sensor element. describes the ratio of variation in forces to the variation in extensions experienced by the sensor elements and will be positive for extension-controlled situations and negative for force-controlled situations. Following a bulk extension input, force-controlled loading of the sensor element occurs when the sensor element is stiff and in relatively high abundance, while extension-controlled loading of the sensor element occurs when the sensor element is soft and/or in relatively low abundance. Dashed contour lines are depicted that correspond to the measured for VinTS, VinTS + Y-27632, VinTS-A50I, and VinTS on 10 kPa gels (, respectively). (E-F) FA structural model predictions of the relationship between sensor element stiffness (spring constant) and force (E) or extension (F). Dashed contour lines in panel (D) correspond to force-stiffness relationships in (E) and extension-stiffness relationships in (F).
Figure 5 with 1 supplement
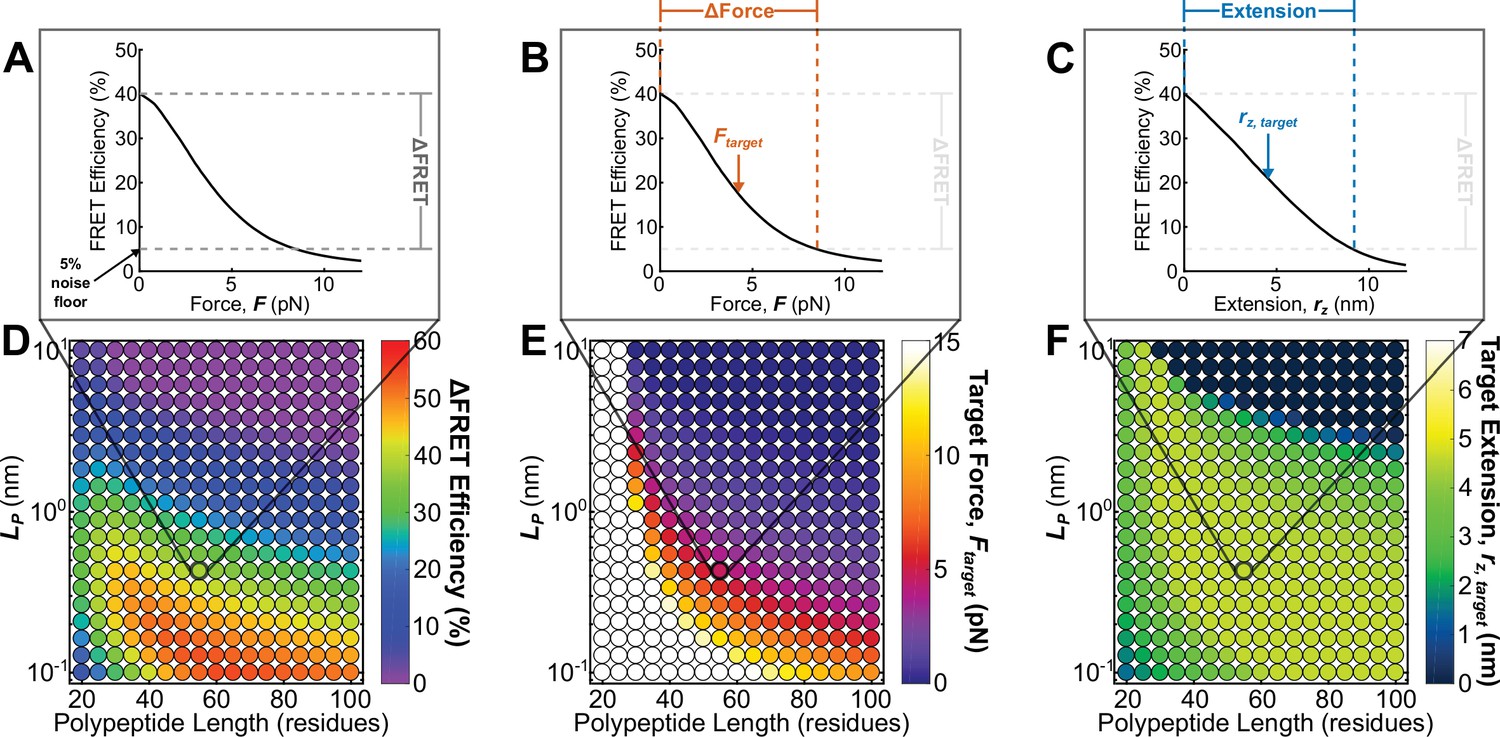
Roadmap to enable the rational design of FRET-based molecular tension sensors.
(A-C) Representative plots of relationships between FRET efficiencies, forces, and extensions reported by a single sensor, highlighting (A), (B), and polypeptide extension (C) required to stretch a sensor from its resting state to the 5% FRET noise floor. (D-F) Parameter space highlighting the predicted at the 5% noise floor (D) as well as the target force (E) and target extension (F) predicted for a variety of Clover-mRuby2-based sensors with a variety of polypeptide lengths (x-axis), and polypeptide mechanical properties (y-axis). Each point represents a single potential TSMod design.
Figure 5—figure supplement 1
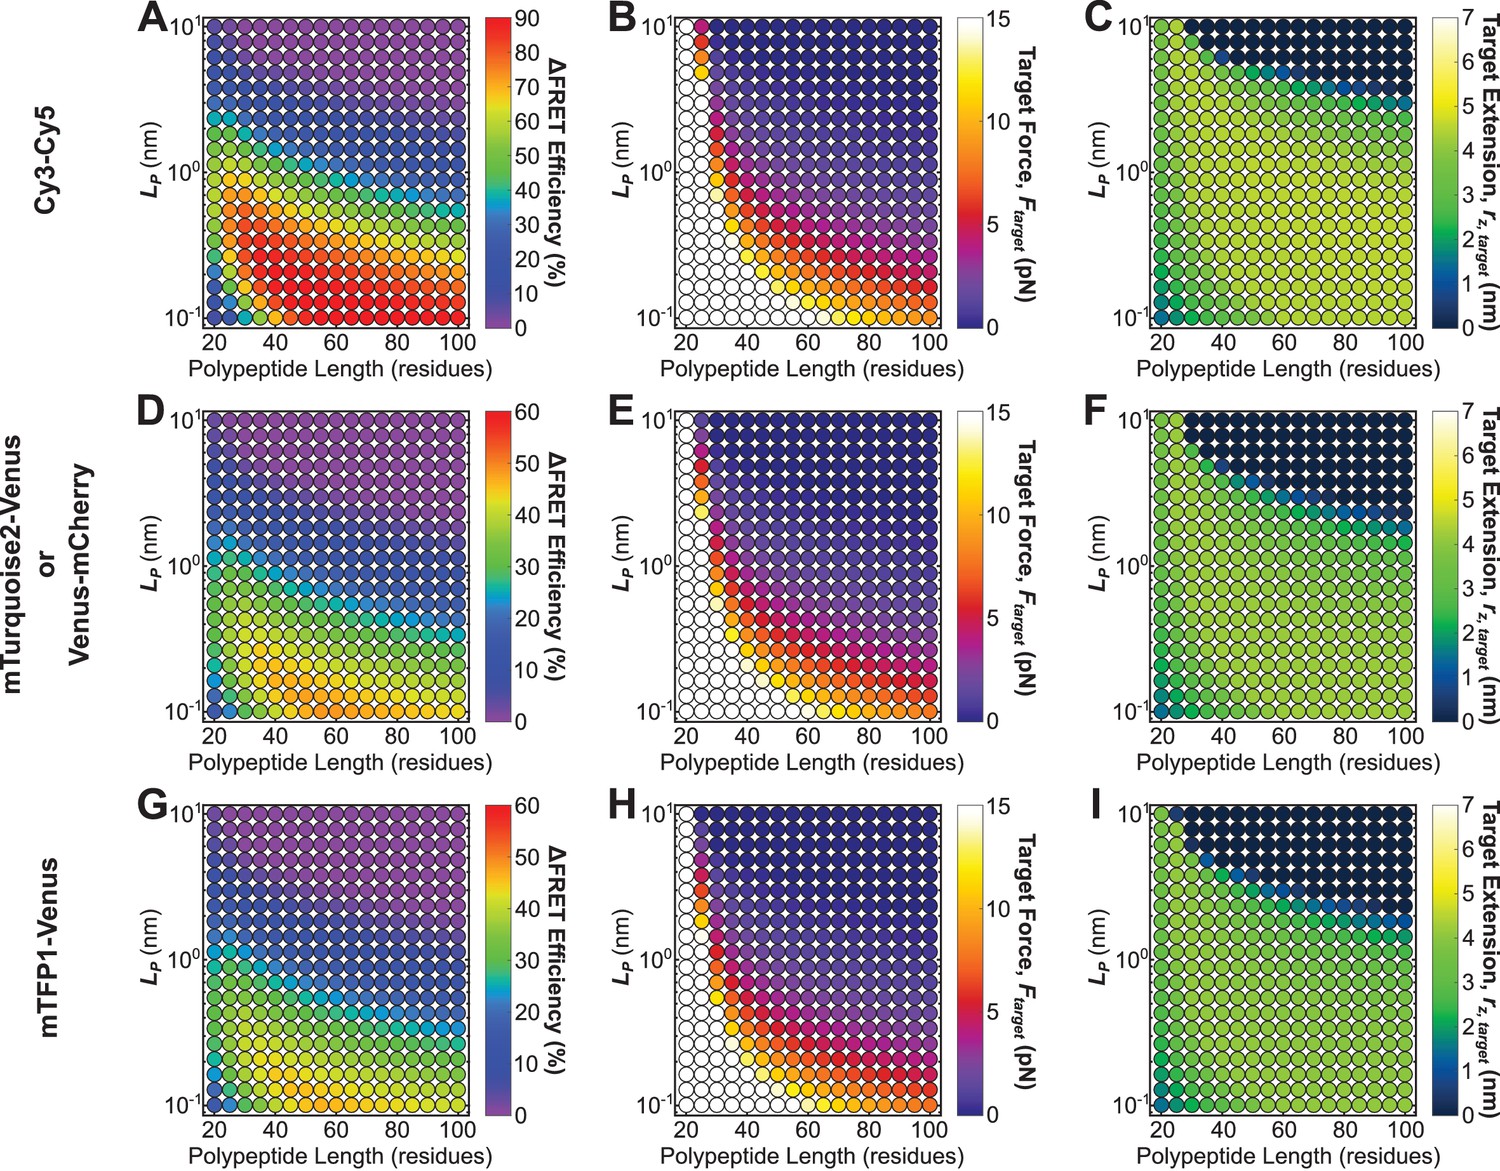
Roadmaps to guide the rational design of FRET-based molecular tension sensors for some commonly used FRET-pairs.
Parameter space highlighting the predicted at the 5% FRET noise floor (A, D, G), as well as corresponding target force, (B, E, H), and target extensions (C, F, I), for a variety of Cy3-Cy5 (A-C), Venus-mCherry or mTurquoise2-Venus (which have identical ) (D-F), and mTFP1-Venus (G-I), based sensors with a variety of polypeptide lengths (x-axis), and mechanical properties (y-axis). Each point represents a single potential tension sensor design.
Tables
Key resources table
| Reagent type (species) or resource | Designation | Source or reference | Identifiers | Additional information |
|---|---|---|---|---|
| Cell line (Mus musculus) | Vinculin -/- mouse embryonic fibroblast | PMID: 20181946 | NA | |
| Cell line (Homo sapiens) | HEK293, Human embryonic kidney cells | ATCC Cat# CRL-1573 | RRID:CVCL_0045 | |
| Transfected construct | pcDNA3.1(+) | Invitrogen, Carlsbad, CA | ||
| Transfected construct | VinculinTS | Addgene, Cambridge, MA; PMID: 20613844 | Plasmid #26019 | |
| Transfected construct | tCRMod-GGSGGS5 | Addgene, Cambridge, MA; this work | Plasmid #111760 | |
| Transfected construct | tCRMod-GGSGGS7 | Addgene, Cambridge, MA; this work | Plasmid #111761 | |
| Transfected construct | tCRMod-GGSGGS9 | Addgene, Cambridge, MA; this work | Plasmid #111762 | |
| Transfected construct | VinTS- tCRMod-GGSGGS5 | Addgene, Cambridge, MA; this work | Plasmid #111763 | |
| Transfected construct | VinTS- tCRMod-GGSGGS7 | Addgene, Cambridge, MA; this work | Plasmid #111764 | |
| Transfected construct | VinTS- tCRMod-GGSGGS9 | Addgene, Cambridge, MA; this work | Plasmid #111765 | |
| Sequence-based reagent | Oligonucleotides detailed in Supplementary file 2 | this work | NA | |
| Chemical compound, drug | Y-27632 | Sigma Aldrich, St. Louis, MO | Y0503; PubChem Substance ID 24277699 | Used at 25 μM |
| Software, algorithm | ImageJ | US National Institutes of Health, Bethesda, MD | RRID:SCR_003070 | http://imagej.nih.gov/ij/ |
| Software, algorithm | Image Corrections | PMID: 25640429; doi.org/ 10.1007/s12195-015-0404-9 | NA | https://gitlab.oit.duke.edu/HoffmanLab- Public/image-preprocessing (Rothenberg et al., 2018b; copy archived at https://github.com/elifesciences-publications/HoffmanLab-image-preprocessing) |
| Software, algorithm | FRET calculations from 3-cube imaging | PMID: 16815904; doi.org/ 10.1007/s12195-015-0404-9 | NA | https://gitlab.oit.duke.edu/HoffmanLab- Public/fret-analysis (Rothenberg et al., 2018a; copy archived at https://github.com/elifesciences-publications/HoffmanLab-fret-analysis) |
| Software, algorithm | FRET calculations from spectrofluorometry | PMID: 16055154 | NA | https://gitlab.oit.duke.edu/HoffmanLab- Public/fluorimetry-fret (LaCroix et al., 2018c; copy archived at https://github.com/elifesciences-publications/HoffmanLab-fluorimetry-fret) |
| Software, algorithm | TSMod calibration model | this work | NA | https://gitlab.oit.duke.edu/HoffmanLab- Public/tsmod-calibration-model (LaCroix et al., 2018b; copy archived at https://github.com/elifesciences-publications/HoffmanLab-tsmod-calibration-model) |
| Software, algorithm | FA structural model | this work | NA | https://gitlab.oit.duke.edu/HoffmanLab- Public/FA-structural-model (LaCroix and Hoffman, 2018a; copy archived at https://github.com/elifesciences-publications/HoffmanLab-FA-structural-model) |
Additional files
-
Supplementary file 1
Persistence length () for a variety of published polypeptides.
Overall, persistence lengths < 0.2 and > 5.0 nm are rarely observed. Synthetic homo-polymers (ex. poly-proline) can achieve larger persistence lengths.
- https://doi.org/10.7554/eLife.33927.036
-
Supplementary file 2
Primers used in this study.
- https://doi.org/10.7554/eLife.33927.037
-
Supplementary file 3
Spectral bleed-through coefficients and G factors for mTFP1-Venus and Clover-mRuby2 based tension sensor FRET efficiency calculations.
- https://doi.org/10.7554/eLife.33927.038
-
Supplementary file 4
Statistical test details including exact p-values for ANOVAs and post-hoc tests.
Note, individual comparisons were made only when statistical significance was detected in ANOVAs.
- https://doi.org/10.7554/eLife.33927.039
-
Transparent reporting form
- https://doi.org/10.7554/eLife.33927.040
Download links
A two-part list of links to download the article, or parts of the article, in various formats.
Downloads (link to download the article as PDF)
Open citations (links to open the citations from this article in various online reference manager services)
Cite this article (links to download the citations from this article in formats compatible with various reference manager tools)
Tunable molecular tension sensors reveal extension-based control of vinculin loading
eLife 7:e33927.
https://doi.org/10.7554/eLife.33927


