Temporospatial induction of homeodomain gene cut dictates natural lineage reprogramming
- School of Life Sciences, Peking University, China
- Peking University, China
Figures
Figure 1 with 1 supplement
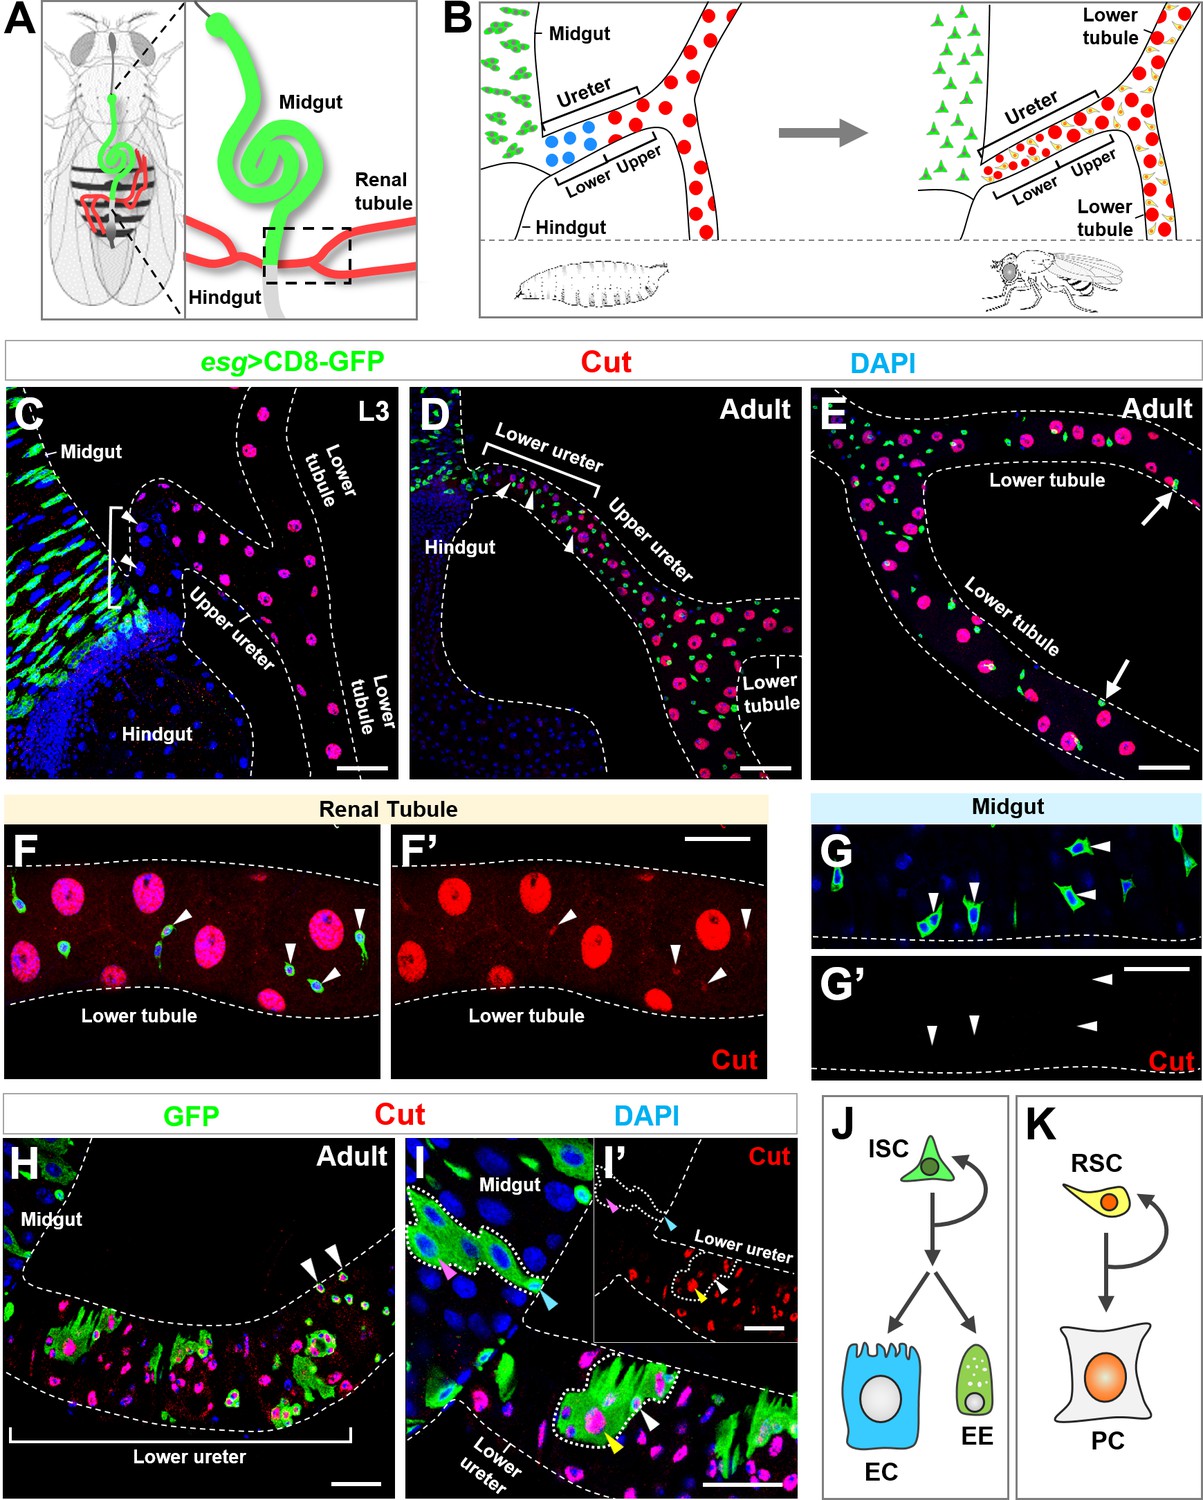
Homeodomain transcription factor Cut is specifically expressed in Drosophila adult renal stem cells.
(A) A schematic diagram of two pairs of renal tubules (red) that converge at ureters and connect to the digestive tract at the midgut (green)-hindgut (grey) boundary of an adult fly (A). The area encircled by dashed line in (A) is magnified and shown in (B). (B) Close-up schematics of larval (left) and adult (right) intestine and renal tubules. Note that each pair of renal tubules merges together at the ureter that is further divided into lower and upper regions. Adult renal stem cells (RSC; yellow) are present in adult but not larval renal tubules. The large principal cells (PC) in lower ureter (blue) during larval stage are replaced with intermediate sized new principal cells (red) during adult stage. (C) Progenitors marked by esgts>CD8-GFP (green) reside in the third instar larval (L3) midgut. White bracket indicates the lower ureter region containing Cut- principal cells (blue). (D–E) During adult stage, Esg+ stem cells are present in both midgut and renal tubules. White bracket indicates lower ureter containing Cut+ Esg- principal cells (D). Arrows indicate furthest detectable RSCs on renal tubules (E). (F–G’) Cut is expressed in adult renal stem cells (arrowheads in F, F’) but not intestinal stem cells (ISC; arrowheads in G, G’). (F’,G’) show single-channel images for Cut immunostaining. (H) MARCM clones induced at early larval stages and examined at early adult stage. Clones containing multiple cells appeared only at lower ureter (bracket), whereas single-cell clones containing Cut+ progenitors (arrowheads) appeared beyond that region. (I, I’) MARCM clones induced at lower ureter contain Cut+ small diploid RSCs (white arrowhead) and Cut+ large polyploid principal cells (yellow arrowhead). The inset shows single-channel image for Cut immunostaining (I’). Neither ISCs (cyan arrowhead) nor polyploid enterocytes (ECs; pink arrowhead) expressed Cut (I’). (J, K) Distinct composition of ISC (J) and RSC (K) lineages. EE: enteroendocrine. Scale bar: 50 μm (C–E); 25 μm (F–I’).
Figure 1—figure supplement 1
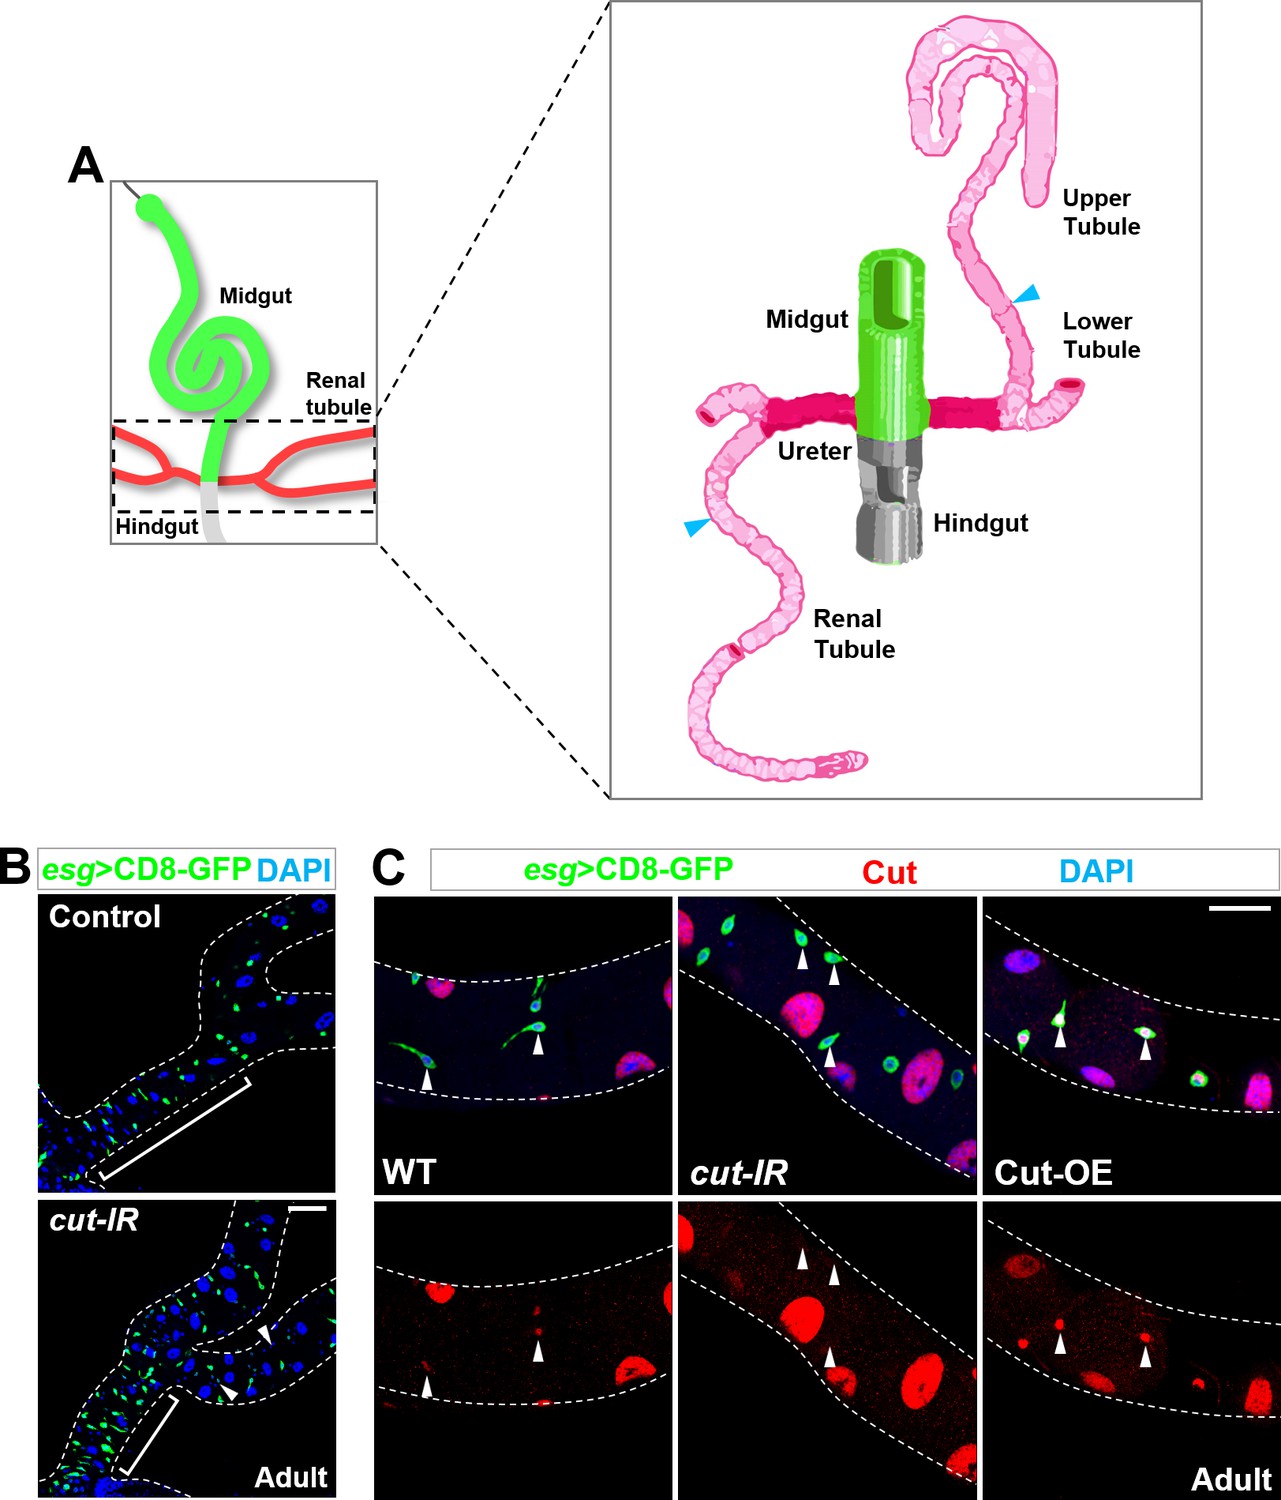
Identification of Cut as a specific adult renal stem cell marker.
(A) schematic drawing adapted from Wessing and Eichelberg (1978) of Drosophila midgut (green), hindgut (grey), ureter (dark pink) and renal tubules (pink). Note that cyan arrowhead indicates the boundary between lower and upper tubules. (B) Genome-wide RNAi-based screen identified Cut as a candidate mediating the MP-to-RP identity switch. Compared with wild type control, specific knockdown of cut in midgut progenitors, by esg-Gal4, resulted in the lack of lower ureter region (bracket) and ectopic appearance of Esg- diploid cells along renal tubules (arrowheads). (C) Cut expression levels in adult renal stem cells (arrowheads) are sharply reduced upon cut knockdown and elevated upon Cut overexpression. Scale bar, 25 μm.
Figure 2 with 1 supplement

Emergence, migration and differentiation of Cut+ renal progenitors during metamorphosis.
(A–G) Midgut-hindgut boundary and lower ureter region at the stages of (A) third instar larvae (L3), (B) 0 hr, (C) 0.5 hr, (D) 1 hr, (E) 3 hr, (F) 9 hr or (G) 10 hr after puparium formation (APF) stained with Cut (red). Note that Cut+ progenitors are marked with white arrowheads (B) or yellow brackets (C–G). Also note that Cut- principal cells in the lower ureter (pink arrowheads in A–D) are engulfed and deposited to the intestinal lumen at 3 hr APF (pink arrowheads in E). Upon differentiation into Cut+ principal cells (cyan arrowheads in F and G), Esg+ progenitors exhibit reduced levels of Cut expression (white arrowheads in G). (H) Quantification of the number of Cut+ progenitors per intestine-renal tubule (I-R) sample at different developmental stages (n = 7–13). (I) Schematic representations of emergence, migration and differentiation of Esg+ Cut+ RPs. Scale bar, 25 μm.
-
Figure 2—source data 1
Input data for bar graph Figure 2H.
- https://doi.org/10.7554/eLife.33934.007
Figure 2—figure supplement 1
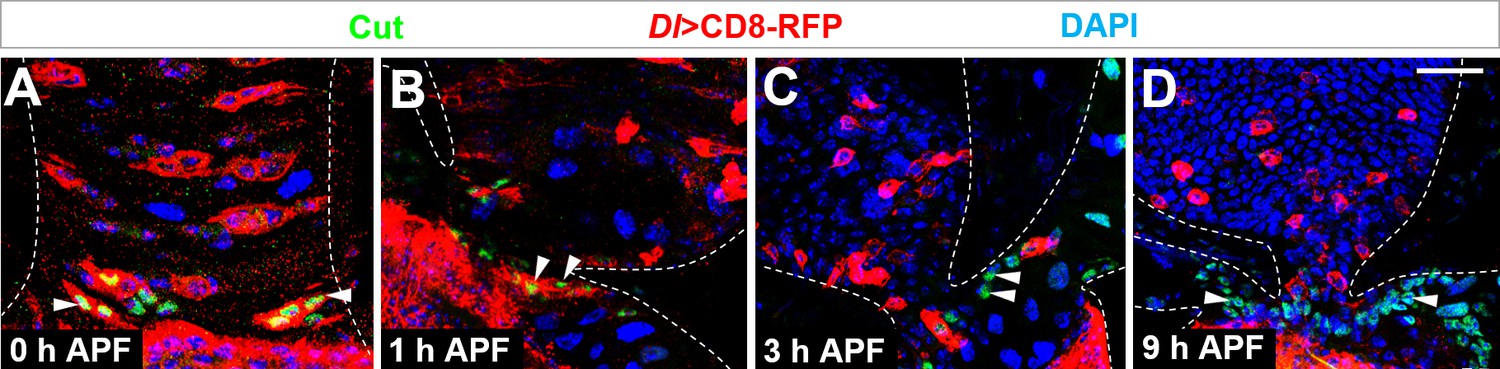
Cut+ renal progenitors are converted from Dl+ midgut progenitors.
(A–D) Cut staining (green) of midgut-hindgut area of Dl-Gal4 >CD8 RFP flies at the stages of (A) 0 hr, (B) 1 hr, (C) 3 hr or (D) 9 hr after puparium formation (APF). Scale bar, 25 μm.
Figure 3 with 2 supplements
Cut dictates midgut-to-renal progenitor identity switch.
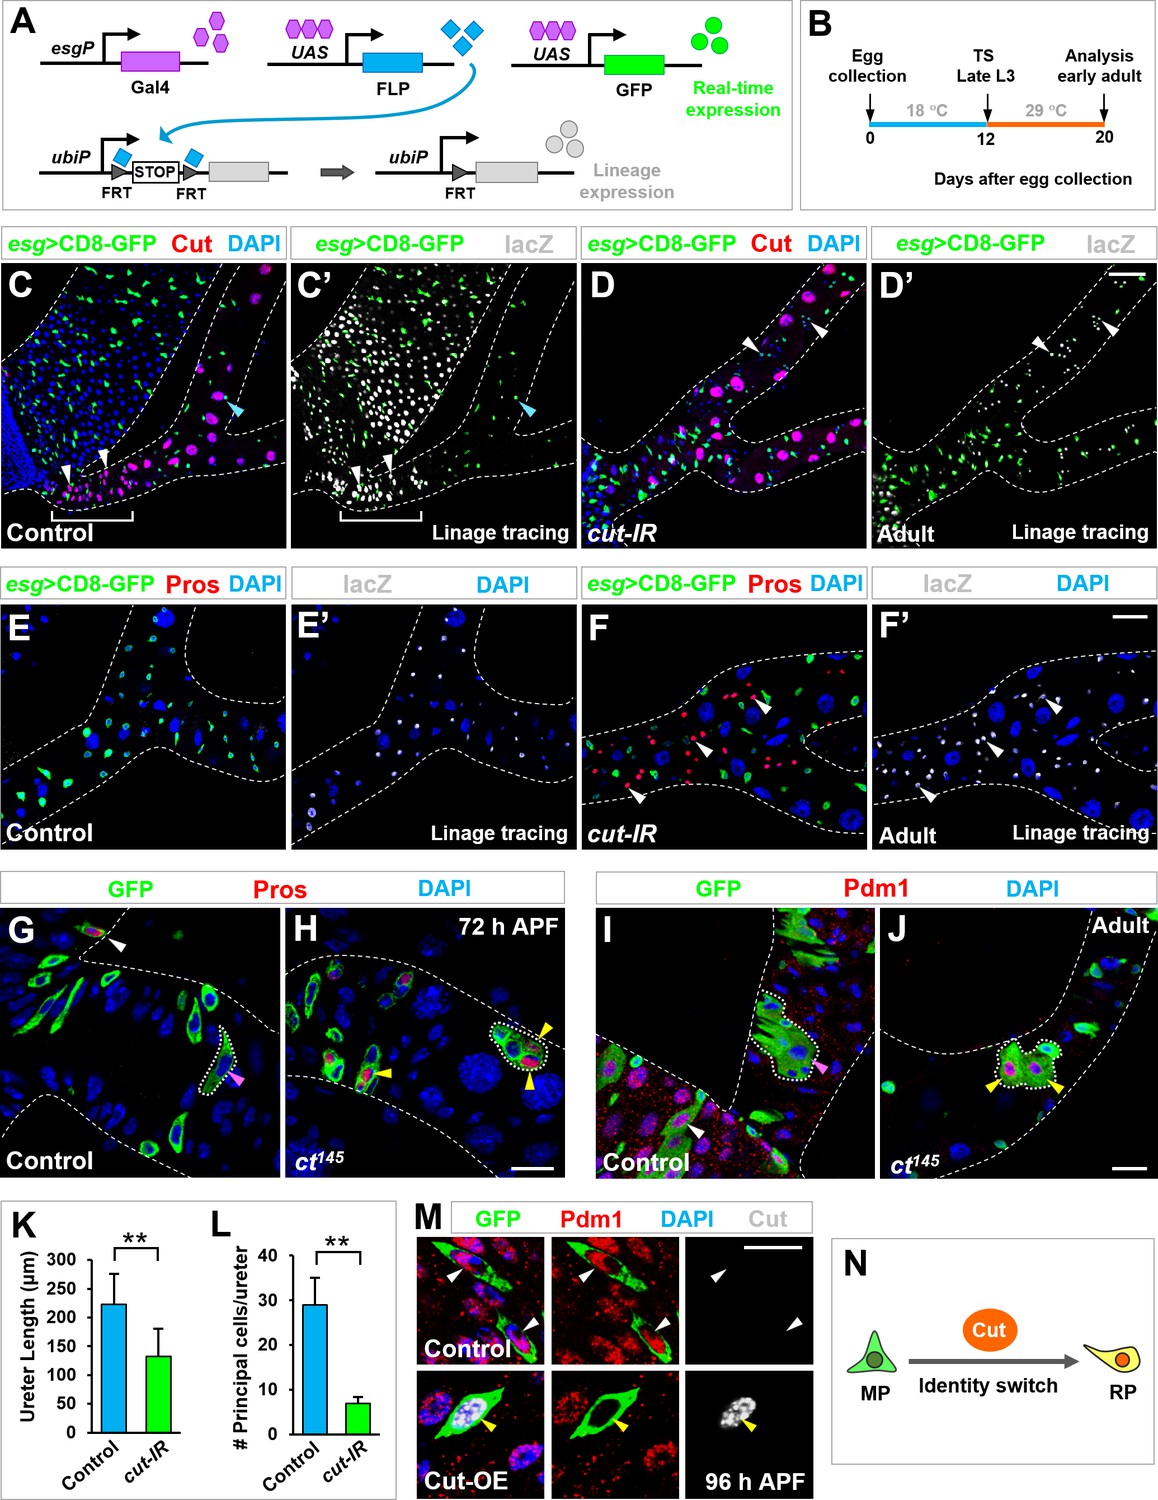
(A–B) Genetic schema (A) and experimental timeline (B) of the lineage-tracing experiment. (C–F’) Lineage-tracing analysis of Esg+ progenitors in ureter and lower tubule regions. Wild type RPs in lower ureter (white brackets in C, C’) differentiate into Cut+ polyploid principal cells (white arrowheads in C, C’). Upon cut depletion, Esg+ progenitors in ureter and lower tubule regions give rise to Cut- Pros+ diploid cells (white arrowheads in D’, F, F’). Note that the cut-RNAi renal tubules lack the entire lower ureter region (D, D’). (G–J) Wild type control MARCM clones residing in the midgut but not ureter region (pink arrowheads in G and I) contain Pros+ EE cells (white arrowhead in G) and Pdm1+ ECs (white arrowhead in I). In sharp contrast, cut mutant clones at ureter region contain Pros+ EEs (yellow arrowheads in H) or Pdm1+ ECs (yellow arrowheads in J). (K–L) Quantification of the length of ureter (K; **p<0.001 (n = 11)) and the total number of principal cells (L; **p<0.0001 (n = 7–9)) in wild type or esgts >cut-IR adult animals. (M) Control or Cut-overexpressing (Cut-OE) MARCM clones were induced at third instar larval stages, dissected at late-pupal stage and stained with Pdm1 (red) and Cut (gray). Note that 100% polyploid cells in WT control clones are Pdm1+ Cut- (n = 69). By contrast, 91% polyploid cells in Cut-OE clones are Pdm1- Cut+, with the rest 9% expressing low levels of Pdm1 and Cut (n = 66). (N) Schematic depiction of Cut as a MP-to-RP identity switch. Scale bars, 50 μm (C–D’), 25 μm (E–F’, I, J) and 10 μm (G, H, M).
-
Figure 3—source data 1
Input data for bar graph Figure 3K,L.
- https://doi.org/10.7554/eLife.33934.011
Figure 3—figure supplement 1
Cut-depleted Esg+ progenitors in renal tubules behave exactly like midgut progenitors.
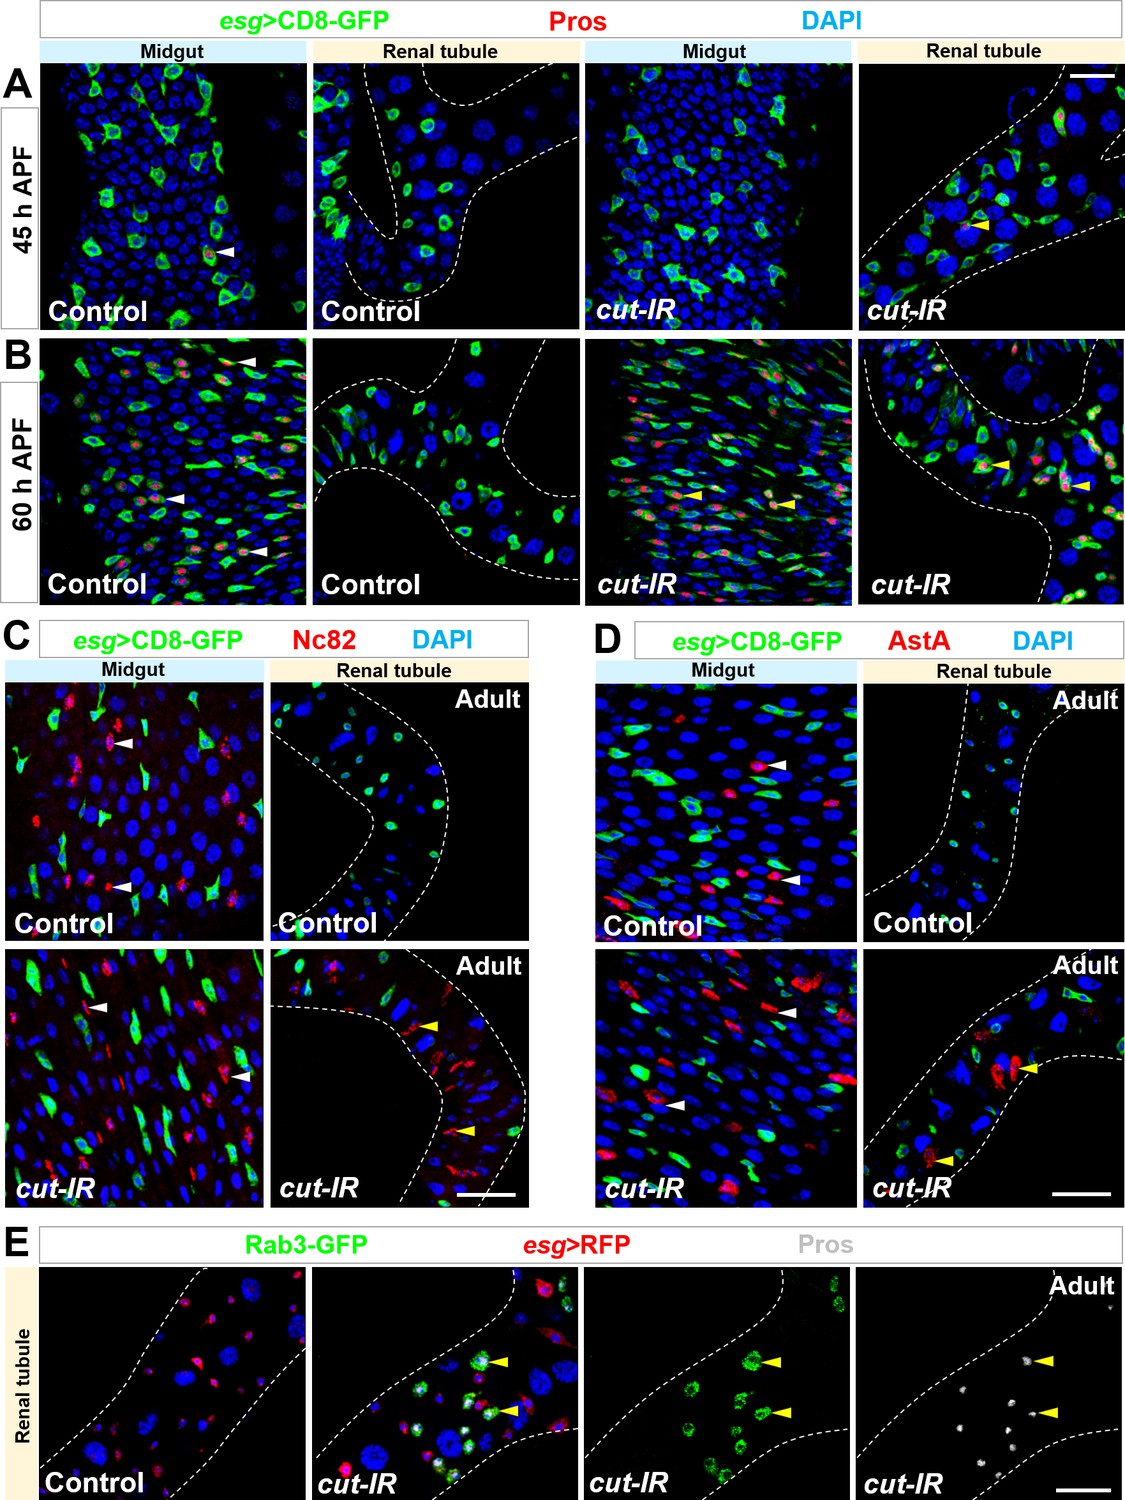
(A,B) Time-course analysis of EE production in renal tubules of esgts > cut RNAi flies. (A) At 45 hr APF, Pros+ EEs (white arrowheads) start to appear in wild type control midgut but not renal tubules. Pros+ EEs (yellow arrowheads) also start to emerge in esgts > cut RNAi renal tubules. (B) At 60 hr APF, around half of Esg+ cells in wild type control midgut (white arrowheads) or esgts > cut RNAi renal tubules (yellow arrowheads) are Pros+ EEs. (C–E) Nc82+ (arrowheads in C), AstA+ (arrowheads in D) or Rab3-GFP+ Pros+ (arrowheads in E) EEs form in esgts > cut RNAi but not in WT control renal tubules. Note that Nc82 is the antigen of EE marker Brp. Scale bars, 20 μm (A,B) and 25 μm (C–E).
Figure 3—figure supplement 2
Notch signaling modulates EE and EC differentiation on renal tubules.
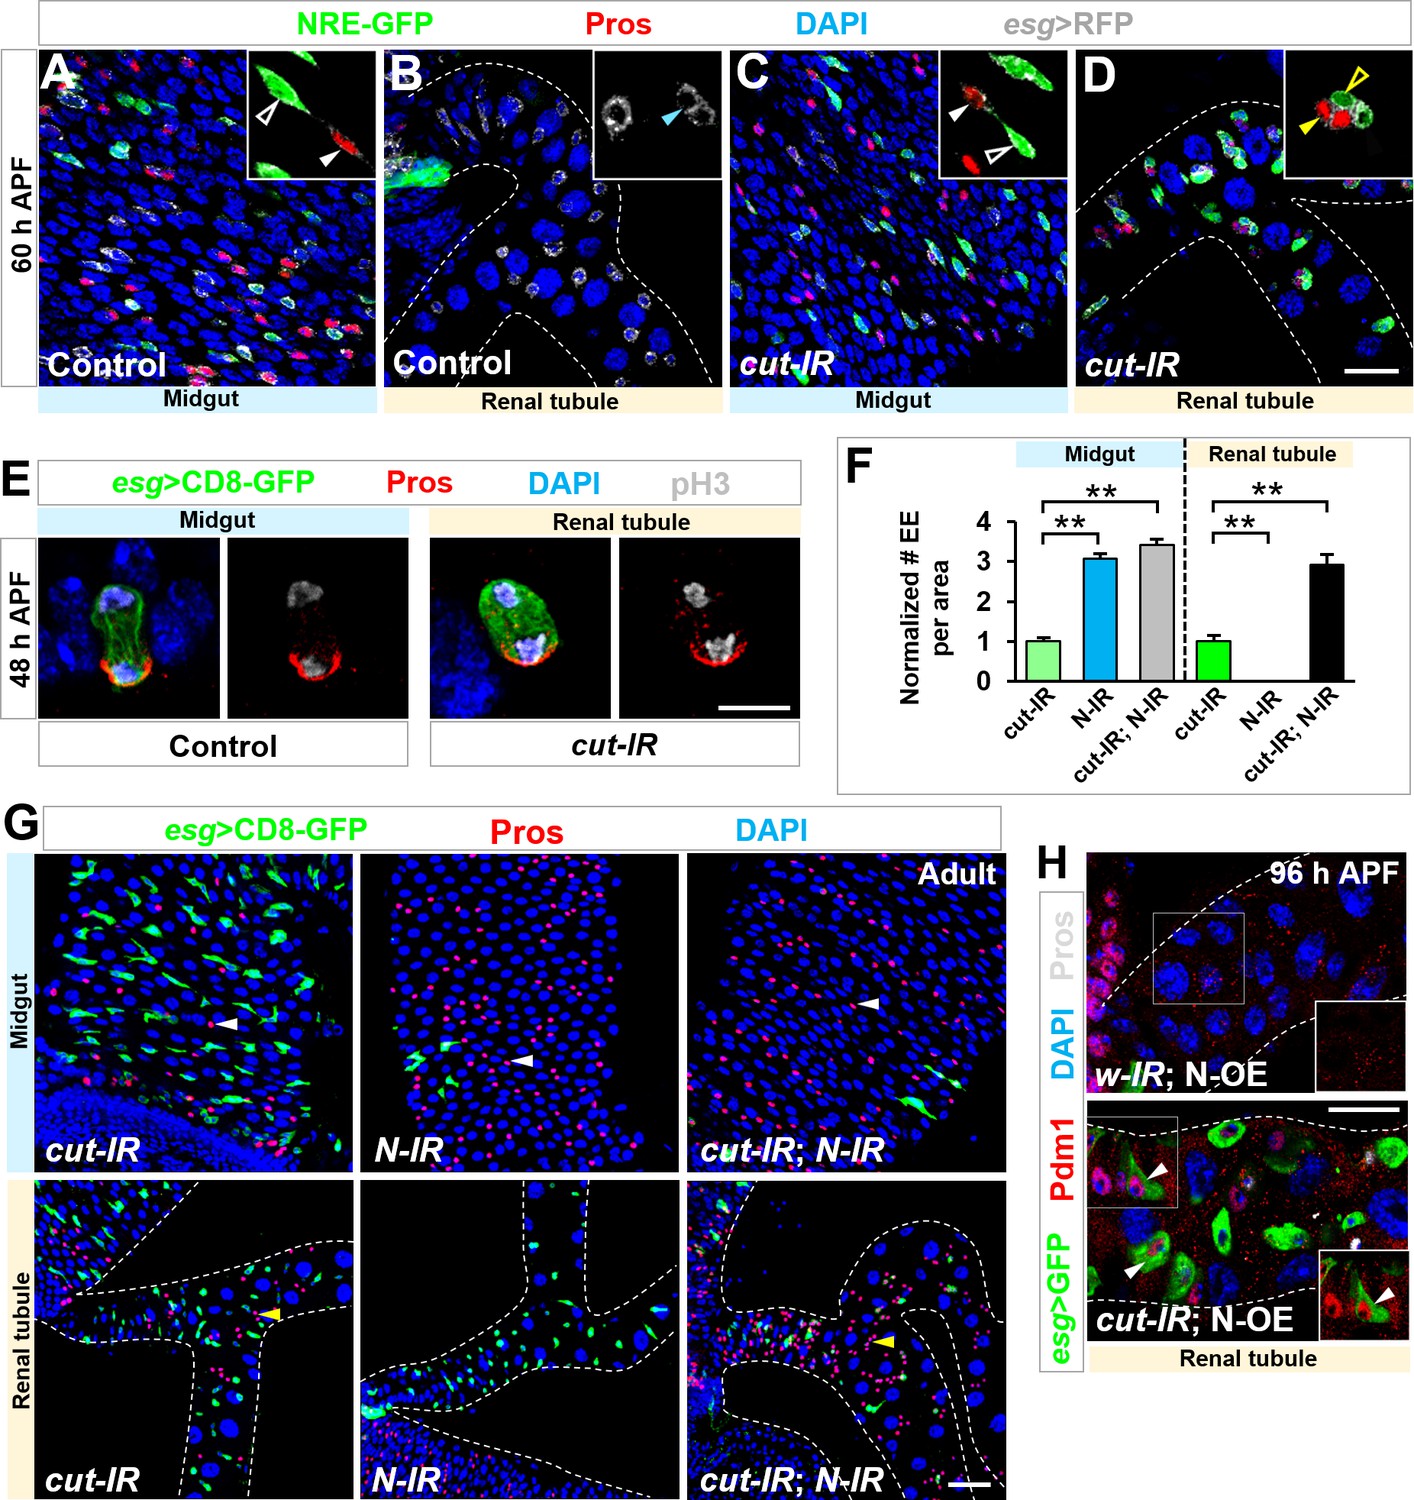
(A–D) At 60 hr APF, Notch signaling reporter NRE-GFP is present in Esg+ Pros- MPs (white open arrowhead, inset in A) but not RPs (cyan arrowhead, inset in B) of wild type control animals. By contrast, upon cut depletion, Esg+ Pros- progenitors on renal tubules (yellow open arrowhead, inset in D) also express NRE-GFP, adjacent to sibling Pros+ EEs (yellow closed arrowhead, inset in D). (E) Pros is asymmetrically localized to the basal side of dividing wild type midgut progenitors or esgts > cut-RNAi progenitors on renal tubules. (F,G) Notch knockdown driven by esg-Gal4 leads to a sharp reduction in number of GFP+ progenitors and a two-fold increase in number of Pros+ EEs in both midgut and renal tubule regions. Quantification of the relative number of EEs in midgut or renal tubules of indicated genotypes is shown in (F). **p<0.0001 (n = 6–8). (H) Notch overexpression driven by esg-Gal4 leads to a sharp reduction in number of GFP+ progenitors, whereas coexpression of cut-RNAi with Notch leads to differentiation of progenitors into Pdm1+ ECs (arrowheads) along renal tubules. Scale bars, 20 μm (A–D,H), 5 μm (E) and 25 μm (G).
Figure 4 with 1 supplement
Wg morphogen acts as a spatial cue selecting the pool of future RPs.
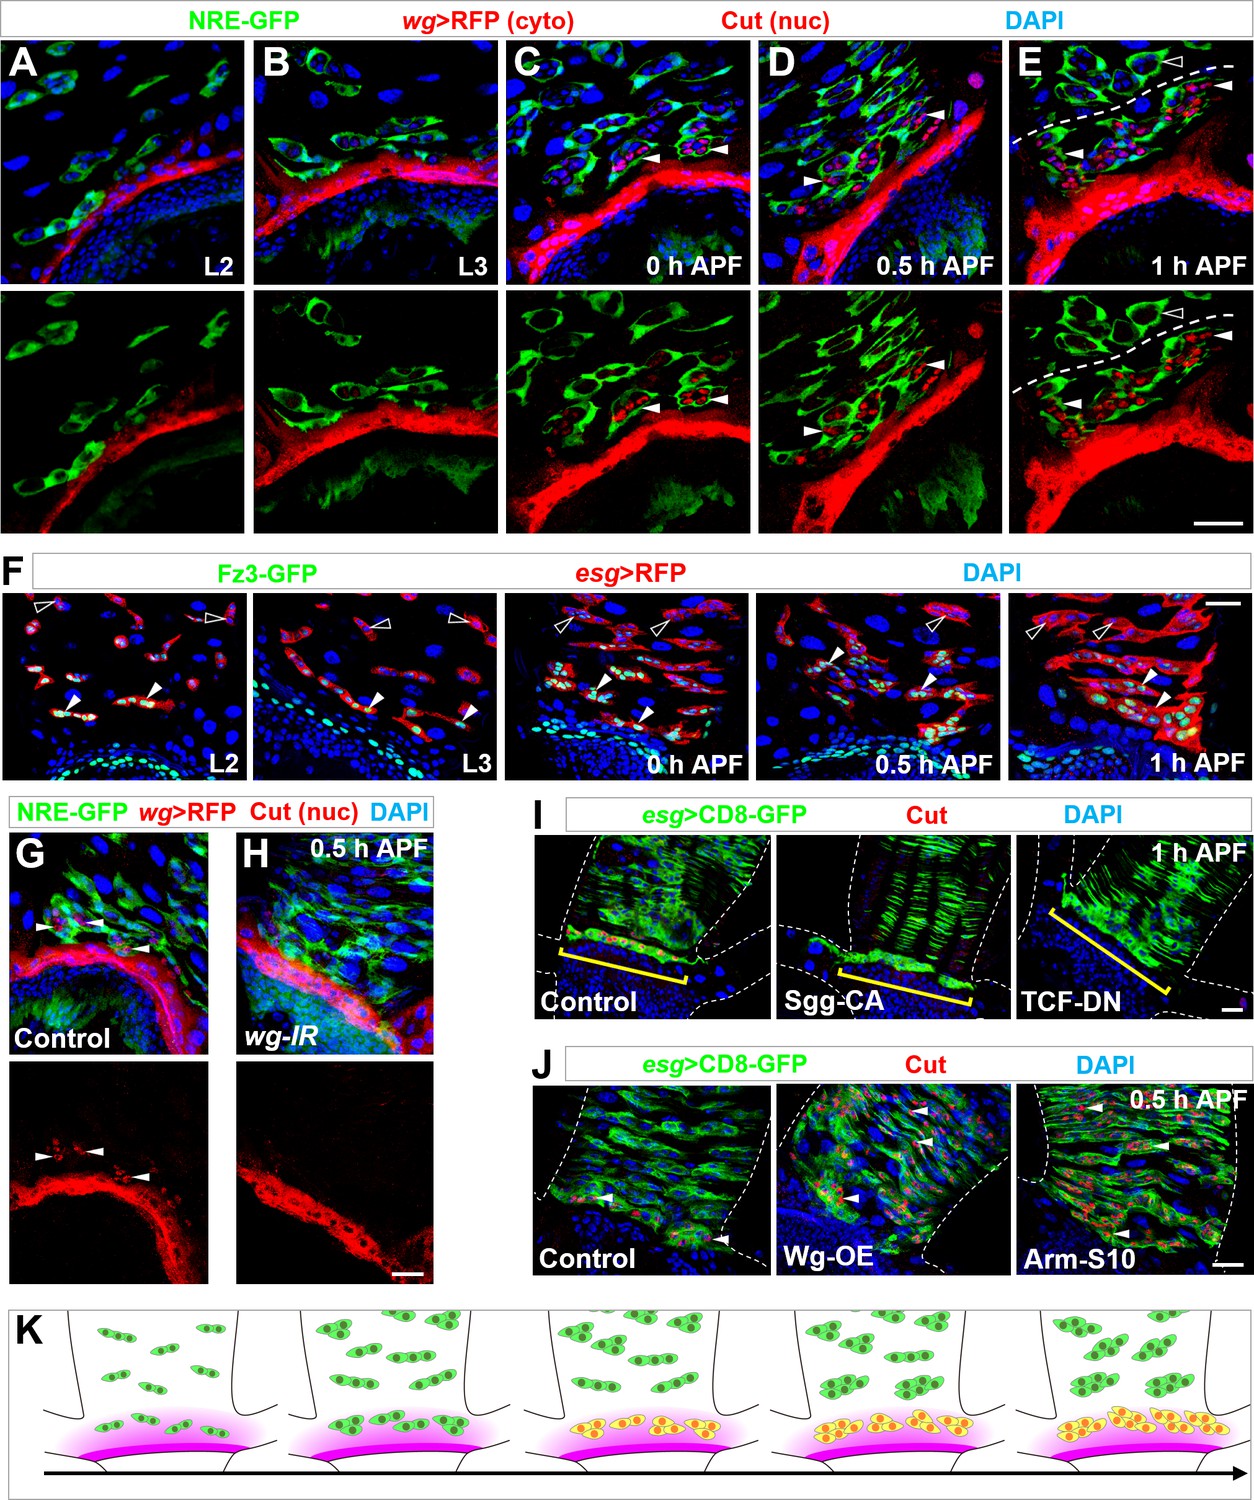
(A–E) Wg ligand expression, as labeled by wg-Gal4 >CD8-RFP, is highly restricted to a narrow band of cells proximal to the midgut-hindgut boundary at the stages of second instar (A) or third instar larva (B), or 0 hr (C), 0.5 hr (D) or 1 hr (E) APF. NRE-GFP marks peripheral cells encasing midgut progenitor islands. Note that Cut+ progenitors (red, nuclear signal; indicated by arrowheads) are in close proximity to the Wg-producing band. Cyto: cytoplasmic; nuc: nuclear. (F) Expression pattern of Wg signaling reporter Fz3-GFP at different developmental stages. Closed and open arrowheads indicate Fz3-GFP+ and Fz3-GFP- progenitors respectively. (G,H) wg-Gal4>white-RNAi or wg-Gal4>wg-RNAi midgut-hindgut boundary region stained with Cut (nuclear signal; arrowheads in G). Note that white-RNAi serves here as a negative control. (I) Upon overexpression of Sgg-CA or TCF-DN, Esg+ progenitors in closest proximity to the band of wg-producing cells (brackets) fail to express Cut. (J) Upon overexpression of Wg or Arm-S10, Esg+ progenitors far away from the midgut-hindgut boundary ectopically turn on Cut expression (arrowheads). (K) Schematic drawings of the progressive MP (green)-RP (yellow) identity switch in the range of Wg morphogen gradient (purple) along the developmental axis. Scale bars, 25 μm.
Figure 4—figure supplement 1

Wg signaling is both necessary and sufficient for inducing cut expression in Esg+ progenitors.
(A–D) Time-course analysis of Wg expression, as indicated by wg-lacZ, at the stages of second instar larvae (A), third instar larvae (B), 0 hr APF (C) or 1 hr APF (D). (E) MARCM clonal analysis of WT control or dsh mutant progenitors. Midgut progenitors produce Pros+ EEs (yellow arrowheads) in the present or absent of Dsh. By contrast, Pros+ EEs (yellow arrowheads) are produced at renal tubules only upon Dsh inactivation. (F,G) Compared with WT control, a significantly increased number of Esg+ Cut+ renal progenitors migrate onto renal tubules upon Wg overexpression. Quantification of the number of Esg+ Cut+ renal progenitors in the ureter region of genotypes as indicated is shown in (G). **p<0.0001 (n = 5–8).(H) Cut expression (yellow brackets) is detected in control but not wg(KO; NRT-Wg) homozygous progenitors in proximal to the midgut-hindgut boundary at metamorphosis. Scale bars, 25 μm.
Figure 5 with 1 supplement
Ecdysone hormone acts as a temporal cue and synergizes with Wg signaling in cut induction.
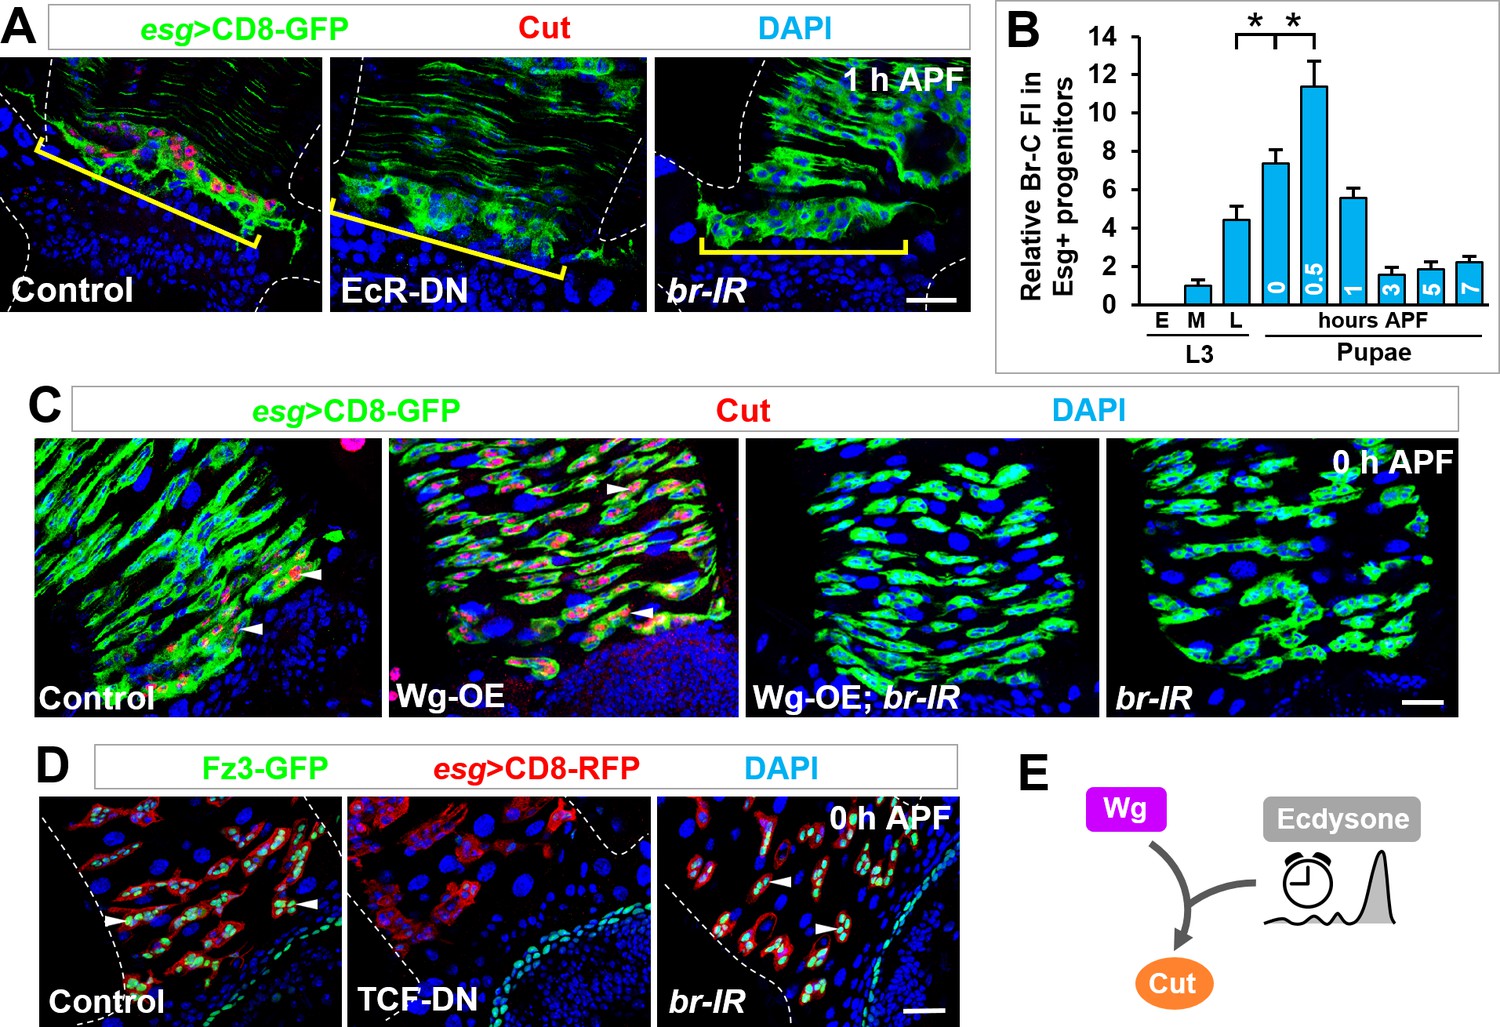
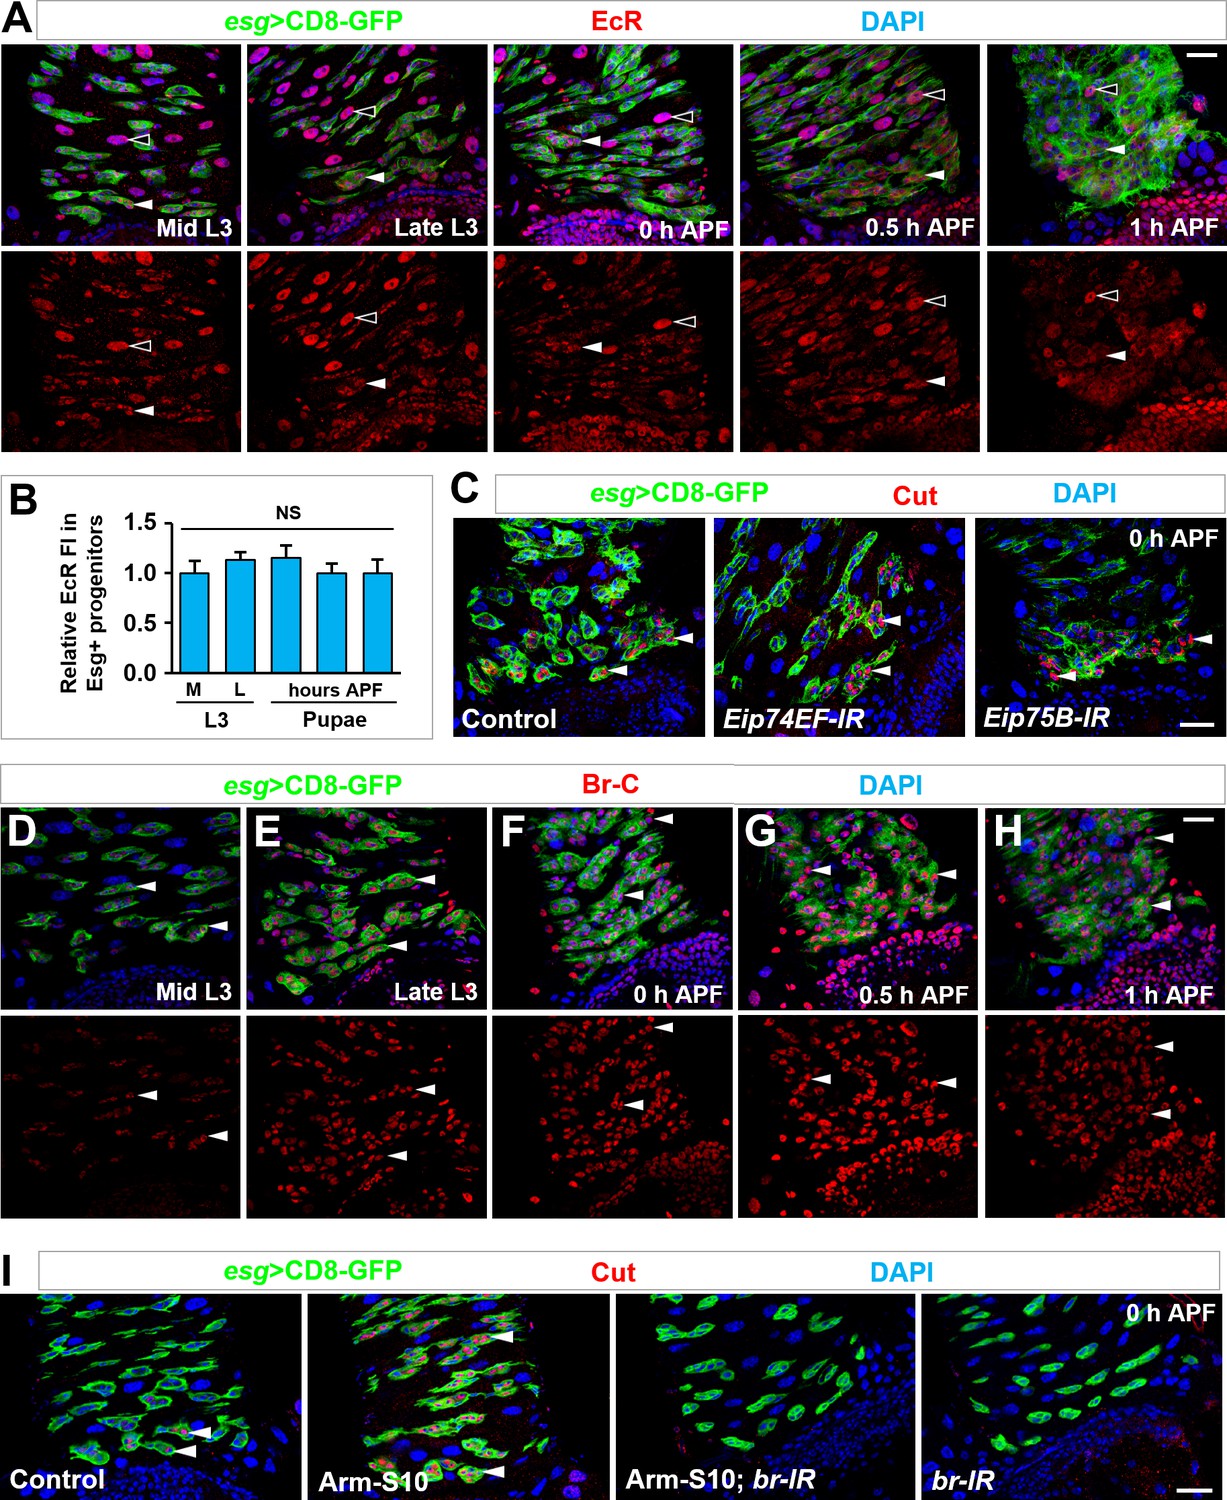
(A) Cut expression in Esg+ progenitors (yellow brackets) is diminished upon expression of EcR-DN or br-RNAi. (B) Quantification of the relative Br-C fluorescent intensity (FI) in Esg+ progenitors at different developmental stages. *p<0.0001 (n = 14–16). Note that the Br-C expression levels here are assessed with Br-core antibody that detects all Br isoforms. (C) Wg overexpression-induced ectopic expression of Cut in Esg+ MPs (arrowheads) is completely abolished upon br knockdown. (D) Expression pattern of Wg signaling reporter Fz3-GFP of indicated genotypes at 0 hr APF. Note that Fz3-GFP expression in Esg+ progenitors is diminished upon TCF-DN but not br-RNAi expression. (E) Wg and ecdysone signaling pathways converge on cut induction.
-
Figure 5—source data 1
Input data for bar graph Figure 5B.
- https://doi.org/10.7554/eLife.33934.016
Figure 5—figure supplement 1
Dynamic expression of Broad, in comparison to EcR, and its epistatic interaction with Armadillo in inducing cut expression.
(A,B) EcR is expressed in essentially all cell types in the midgut, including polyploid ECs (open arrowheads) and Esg+ progenitors (closed arrowheads), at similar levels at different developmental stages (A). Quantification of relative EcR fluorescence intensity in Esg+ progenitors is shown in (B). NS, not significant (n = 10). (C) Depletion of ecdysone early response genes Eip74EF or Eip75B in Esg+ progenitors showed no effect on cut induction in future RPs (arrowheads). (D–H) Time-course analysis of dynamic Br-C expression in Esg+ progenitors (arrowheads) at the stages of mid (B) or late (C) third instar larvae, 0 hr (D), 0.5 hr (E) or 1 hr (F) APF. Note that Br-C expression levels in Esg+ progenitors gradually increase (B–D) and reach its peak at around 0.5 hr APF (E), followed by a gradual decline (F). Note that quantification of Br-C expression at different stages is shown in Figure 5B. (I) Ectopic expression of Cut in midgut progenitors (arrowheads), induced by Arm-S10 overexpression, is completely abolished by coexpression of broad-RNAi. Scale bars, 25 μm.
Figure 6 with 1 supplement
TCF/Arm physically associates with Br-Z2 in inducing cut transcription.
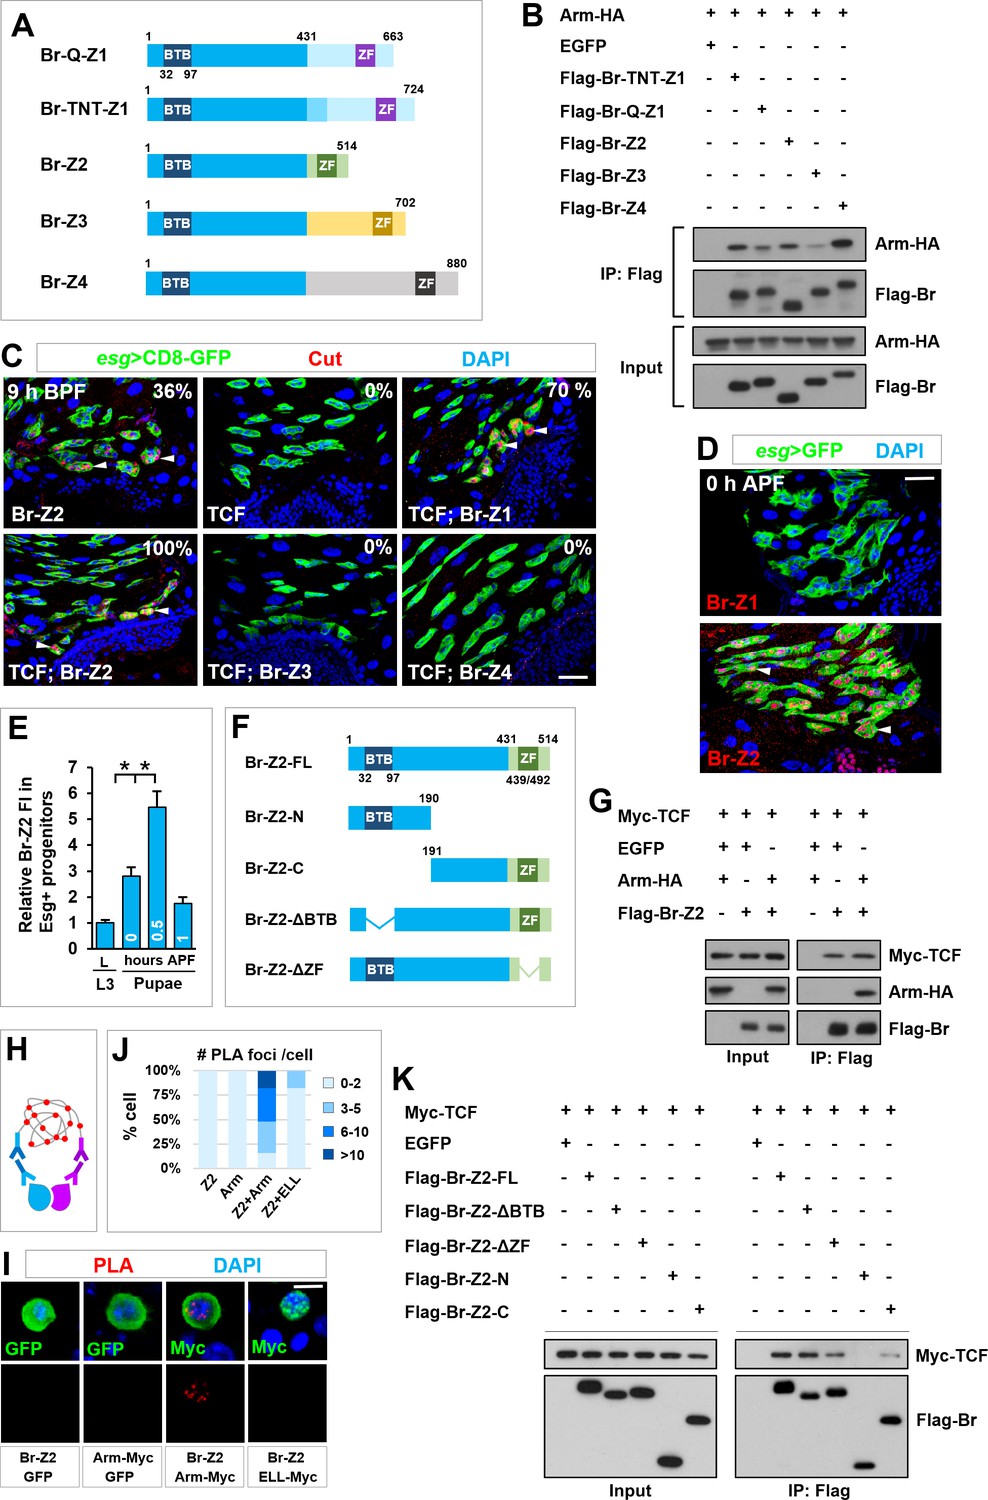
(A) Schematic drawings of Br isoforms. Note that BTB and ZF indicate BTB (Broad-Complex, Tramtrack and Bric a brac) domain and Zinc Finger domain respectively. (B) Coimmunoprecipitation (CoIP) of Br isoforms and Arm in HEK293T cell extracts. In these and subsequent panels, GFP served as a negative control. (C) Cut expression pattern in Esg+ progenitors of indicated genotypes at 9–10 hr before puparium formation (BPF). (D) Expression pattern of Br-Z1 and Br-Z2 at midgut-hindgut boundary region at 0 hr APF. (E) Quantification of relative Br-Z2 fluorescent intensity (FI) in Esg+ progenitors at different developmental stages. *p<0.0001 (n = 11–16). (F) Schematic drawings of Br-Z2 domains and truncated constructs. (G) CoIP of FLAG-tagged Br-Z2, HA-tagged Arm and Myc-tagged TCF in HEK293T cell extracts. (H–J) Specific Arm and Br-Z2 interaction detected by in situ PLA (proximity ligation assay) in the nuclei of Drosophila S2 cells. (H) Schematic diagram showing the principles of PLA. (I) S2 cells transfected with the indicated plasmids were detected for PLA signal (red). Note that the bottom panel shows single-channel images for PLA signal. Also note that ELL is a subunit of the Super Elongation Complex (SEC) that regulates gene transcription. Myc-tagged ELL serves here as a negative control. Quantification of the percentage of PLA foci number per transfected cell is shown in (J; n = 20–44). (K) CoIP of full-length (FL) or truncated FLAG-Br-Z2 and Myc-TCF. Scale bars, 25 μm (C, D) and 5 μm (I).
-
Figure 6—source data 1
Input data for bar graph Figure 6E,J.
- https://doi.org/10.7554/eLife.33934.019
Figure 6—figure supplement 1
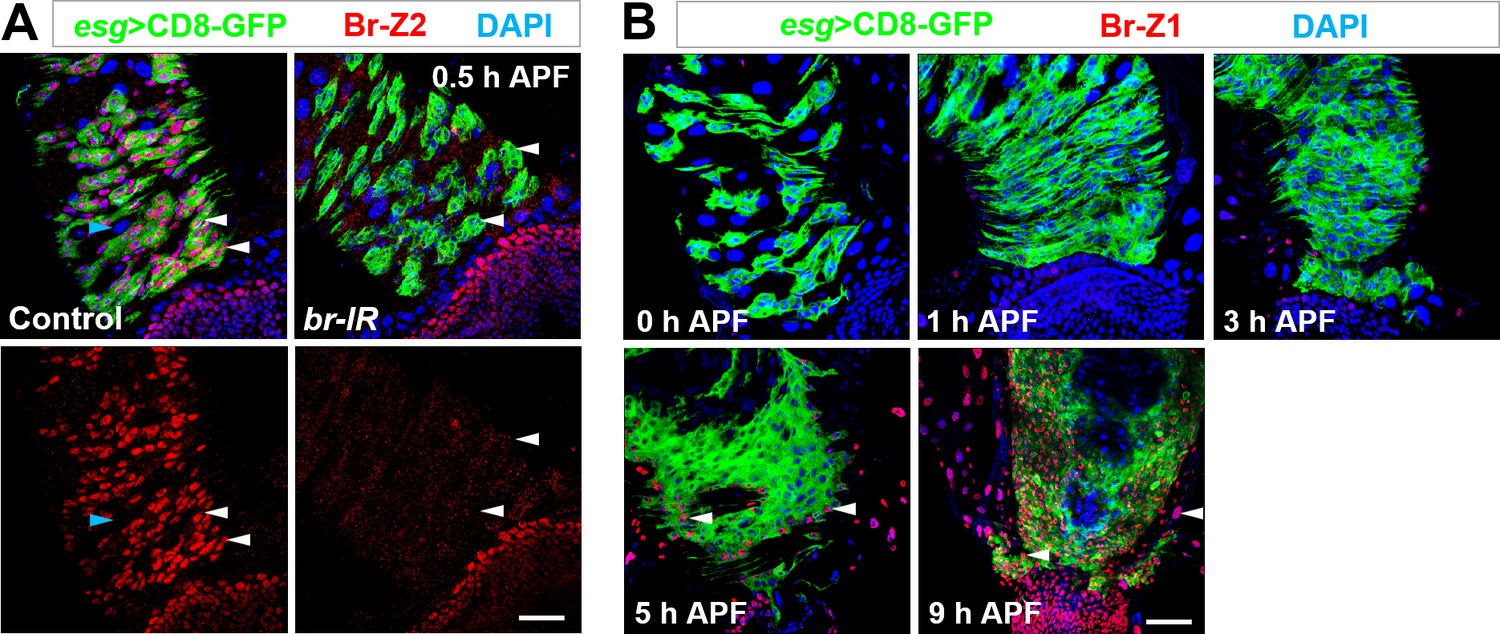
Dynamic expression of Br-Z2 and Br-Z1 during metamorphosis.
(A) Antibody raised against Br-Z2 is highly specific. Specific expression of Br-Z2 in Esg+ progenitors (white arrowheads) but not polyploid ECs (cyan arrowhead) at 0.5 hr APF, detected with a newly-raised antibody, is drastically reduced upon Esg+ progenitor-specific knockdown of Br. (B) Br-Z1 is not expressed in midgut or renal tubule region until 5 hr APF. Note that at 9 hr APF, Br-Z1 is ubiquitously expressed in essentially all cell types (arrowheads). Scale bar, 25 μm.
Figure 7 with 2 supplements
Self-association of Broad likely mediates enhancer-promoter looping of cut locus.
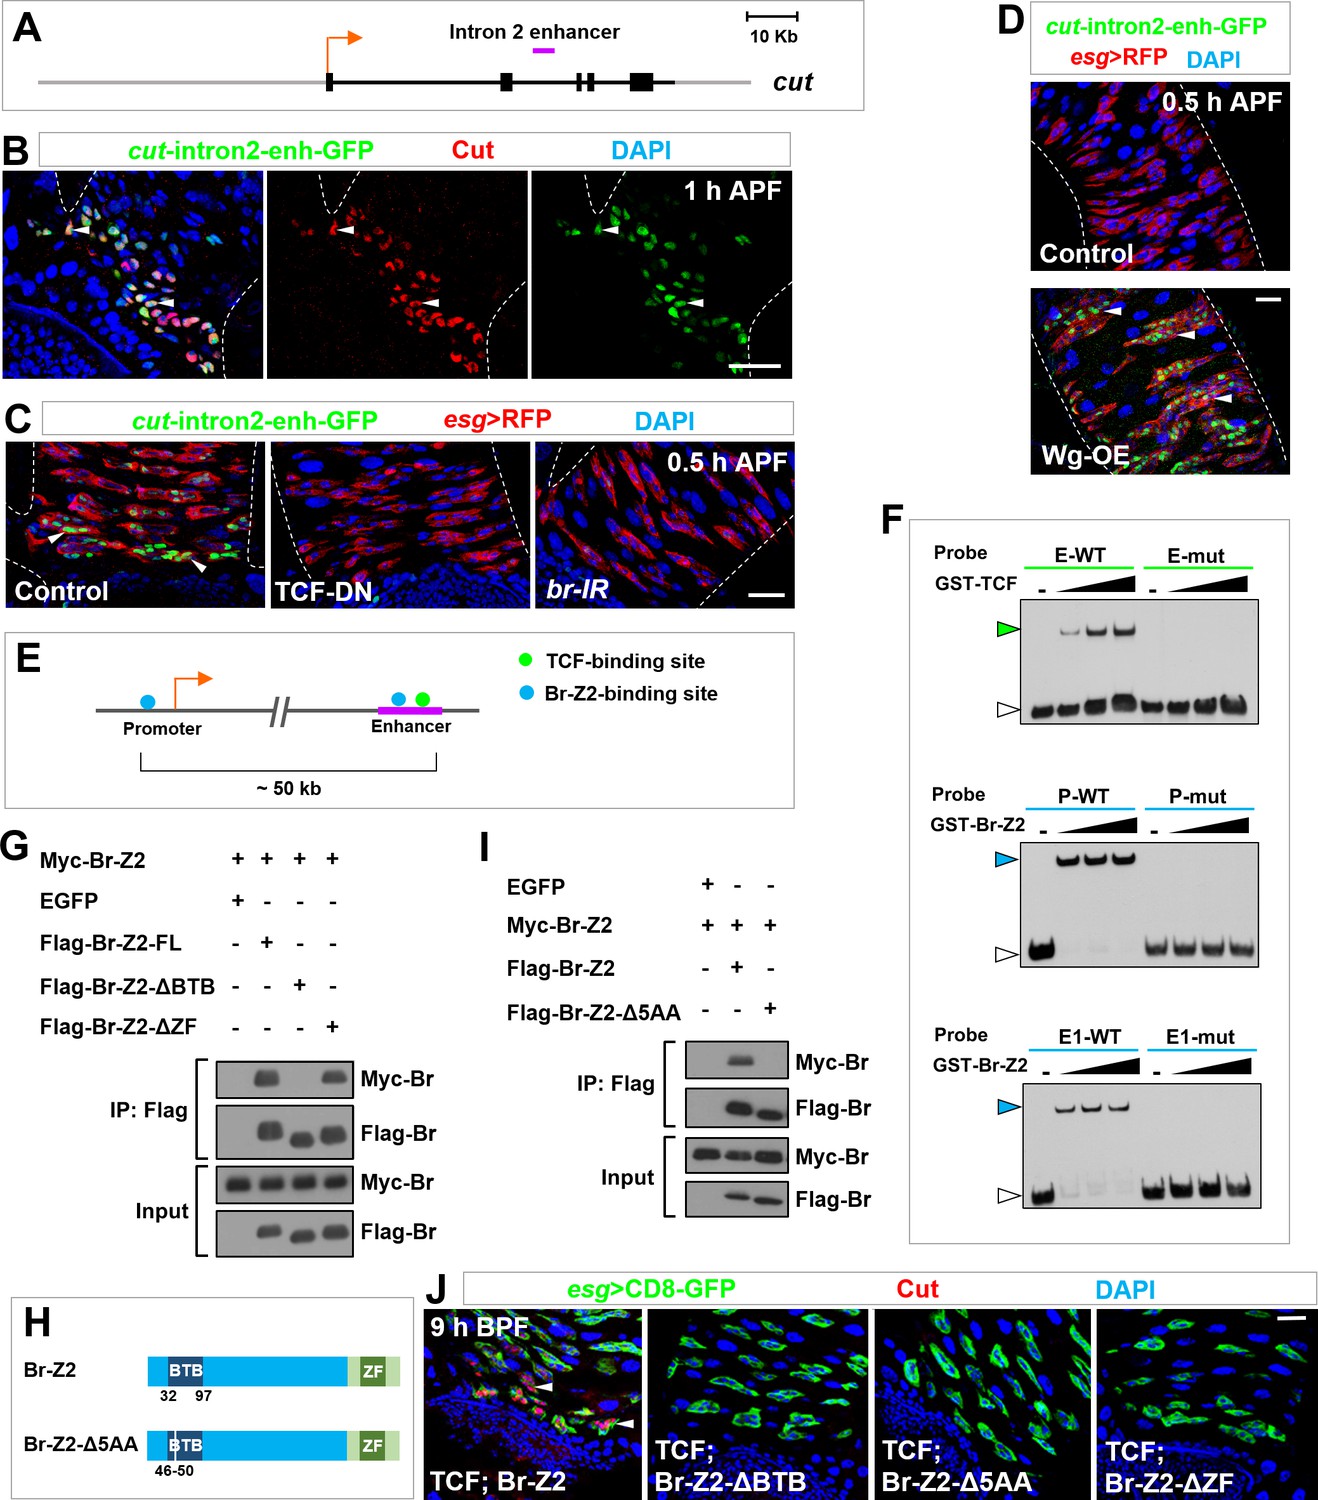
(A) Schematic representation of the cut genomic locus. Exons, introns/non-coding regions and flanking genomic regions are represented as black bars, black lines and gray lines respectively. Purple bar indicates intron2-enhancer. (B) cut-intron2-enhancer-GFP, a reporter for the intron2 enhancer of cut, specifically colocalizes with endogenous Cut in future RPs. (C) The expression of cut-intron2-enhancer-GFP is abolished upon expression of TCF-DN or br-RNAi in Esg+ progenitors. (D) cut-intron2-enhancer-GFP is ectopically induced in MPs far away from the midgut-hindgut boundary upon Wg overexpression. (E) Schematic drawing of a portion of the cut locus spanning approximately 60 kb. Putative TCF-binding sites and Br-Z2-binding sites are represented by green and blue dots respectively. Purple line indicates intron2-enhancer. (F) EMSA demonstrating the interaction of TCF or Br-Z2 DNA-binding domains with biotin-labelled probes bearing wild type (WT) or mutant (mut) sequence of putative TCF- or Br-Z2-binding sites. E: enhancer; P: promoter. Note that green or blue arrowheads indicate the DNA-protein complexes, whereas white arrowheads indicate free probes. (G) CoIP between full-length (FL) or truncated FLAG-tagged Br-Z2 and Myc-tagged Br-Z2 in 293T cells. Note that dimerization of Br-Z2 depends on its BTB but not ZF domain. (H) Schematic drawings of Br-Z2-Δ5AA construct, a small deletion in the BTB domain. (I) CoIP between Flag-Br-Z2-Δ5AA and Myc-Br-Z2 in 293T cells. (J) Coexpression of TCF with Br-Z2-ΔBTB, Br-Z2-Δ5AA or Br-Z2-ΔZF failed to precociously induce Cut expression at 9 hr BPF. Scale bars, 25 μm.
Figure 7—figure supplement 1
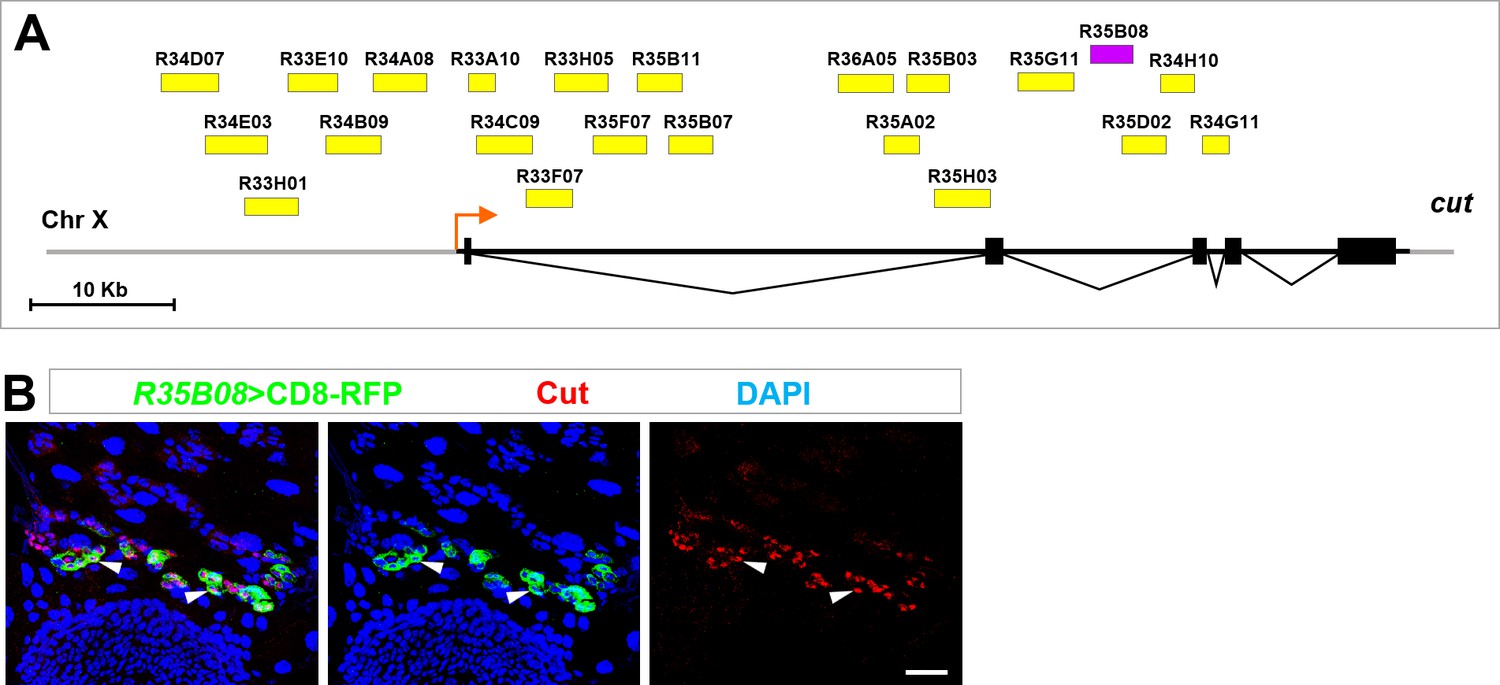
Identification of an intronic enhancer conferring temporospatial induction of cut in future RPs.
(A) The gene map of cut locus showing the 22 genomic regions screened for enhancer(s) conferring cut expression in future RPs. Cut-intron2-enhancer (35B08) is represented as a purple bar, whereas the rest of the putative enhancers are represented as yellow bars. (B) R35B08-Gal4 drove specific expression of UAS-CD8-RFP in future RPs, colocalizing with endogenous Cut. Scale bar, 25 μm.
Figure 7—figure supplement 2
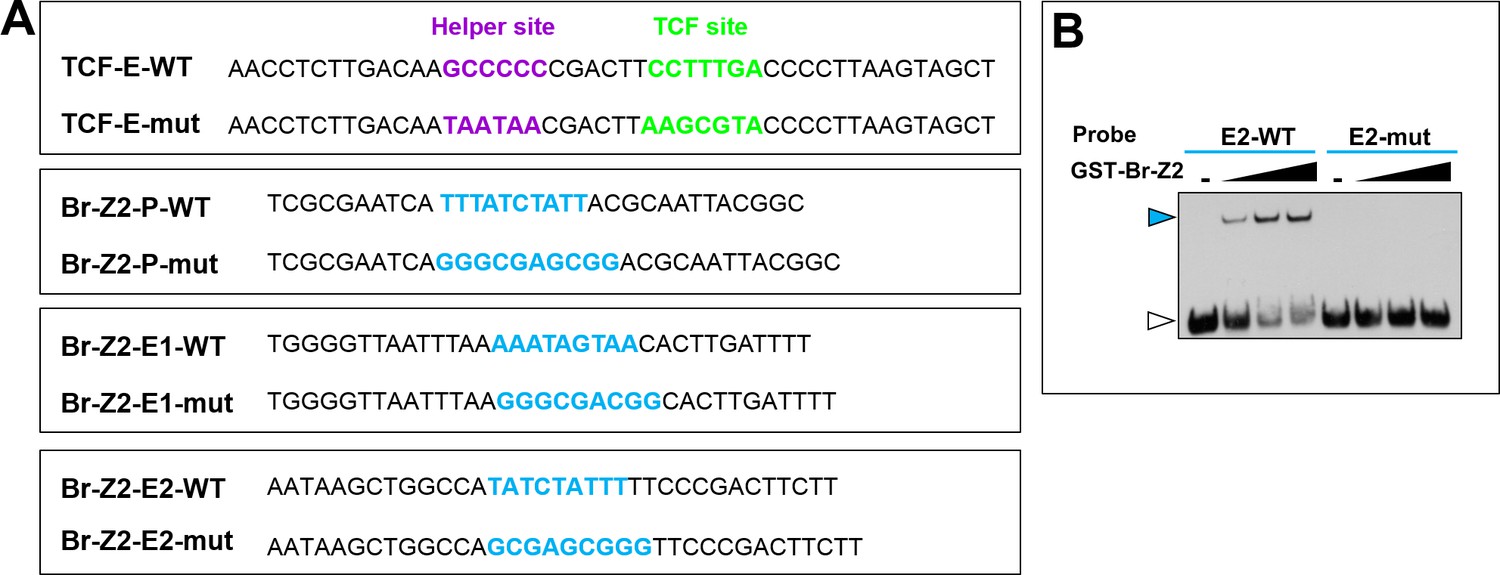
EMSA assay showing specific binding of TCF or Br-Z2 to their binding site in cut promoter or intron2-enhancer region.
(A) The sequence of the EMSA probes containing wild type (WT) or mutant (mut) form of TCF or Br-Z2-binding sites (bold) in cut enhancer or promoter region. E: enhancer; P: promoter. The consensus sequences of TCF-binding site, helper site and Br-Z2-binding site are CCTTTG(A/T); GCCGCC and TTT(A/T)(A/T)CTATTT respectively (Archbold et al., 2014; Chang et al., 2008; von Kalm et al., 1994). (B) EMSA demonstrating the interaction of the Br-Z2 DNA-binding domain with DNA probes bearing WT or mutant sequence of a putative Br-Z2-binding site in cut enhancer region (E2). Note that the blue arrowhead indicates the DNA-protein complexes, whereas the white arrowhead indicates free probes.
Figure 8
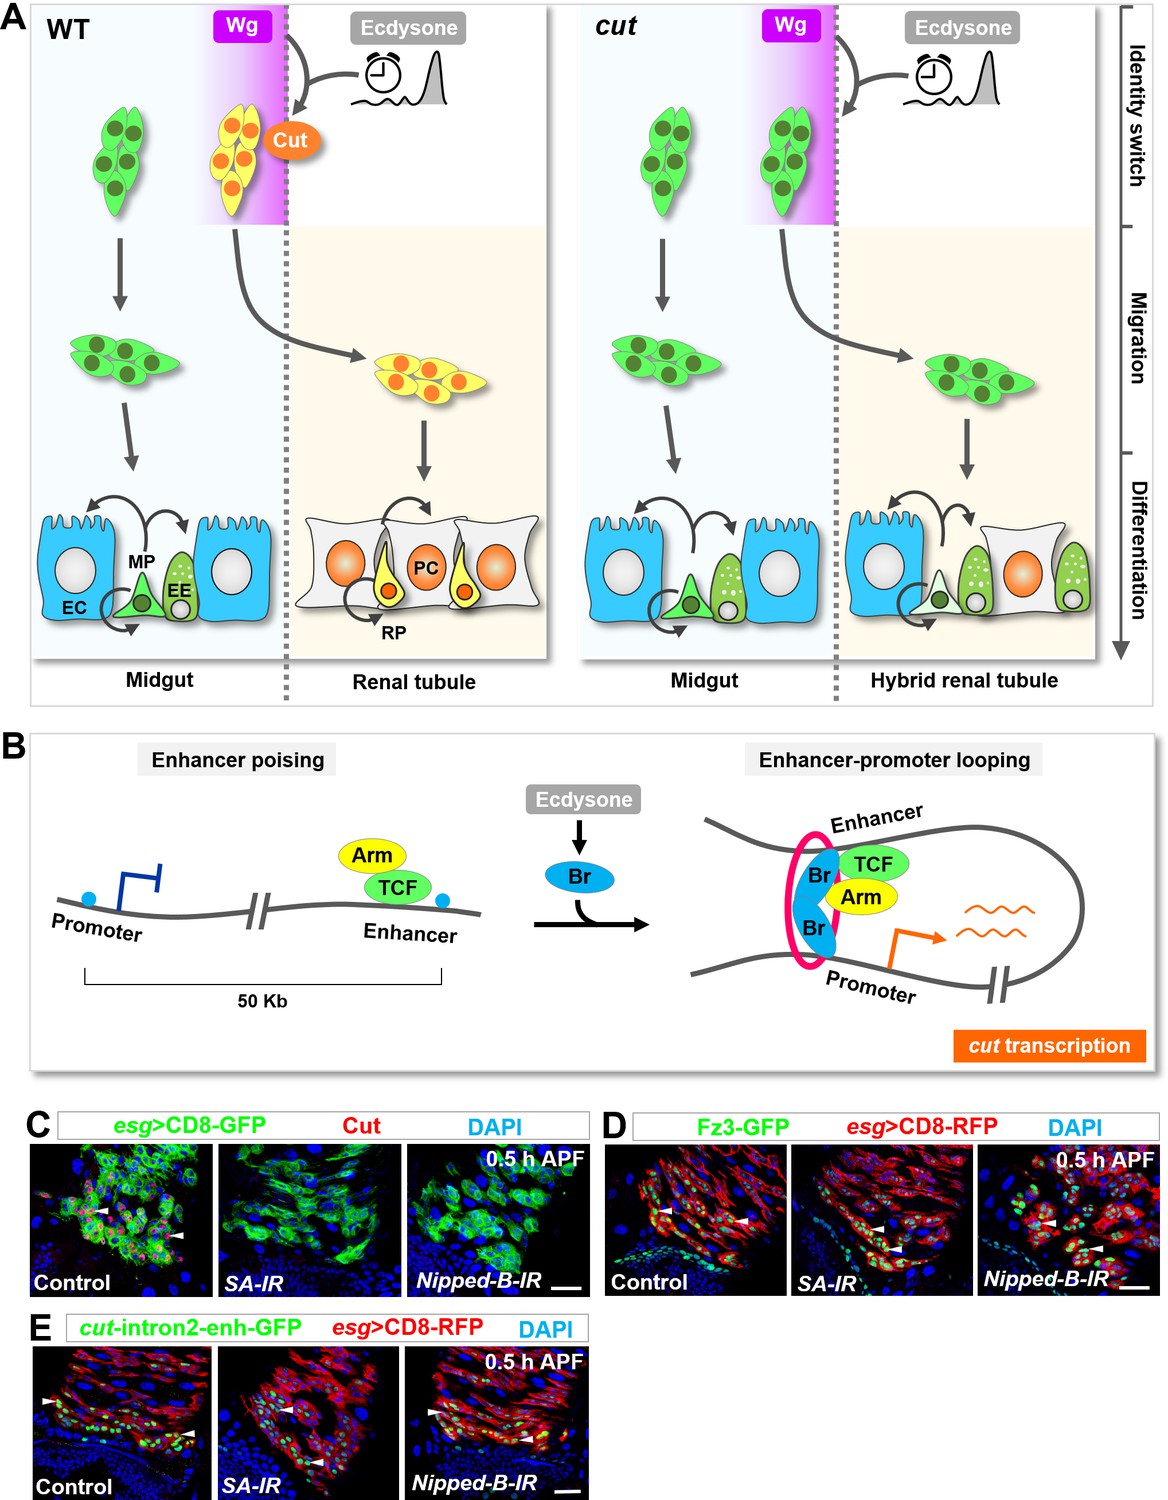
Ecdysone signaling and Wg pathway might intersect through a poising-and-bridging mechanism to dictate midgut-to-renal lineage reprogramming.
(A) A graphic model of the MP-RP identity switch. Cut (orange), induced by Wg morphogen gradient (purple; spatial cue) in conjunction with the steroid hormone ecdysone (grey; temporal cue), dictates midgut-to-renal progenitor identity switch at the onset of metamorphosis. (B) A working model depicting the poising-and-bridging mechanism. Note that the red circle represents cohesin, which is likely to be important for stabilizing the enhancer-promoter looping of cut. (C–E) Downregulation of either cohesin subunit SA or cohesin loading factor Nipped-B abolished cut induction (C) but showed no effects on Fz3-GFP (D) or cut-intron2-enhancer-GFP (E) expression in future RPs. Scale bars, 25 μm.
Tables
Key resources table
| Reagent type (species) or resource | Designation | Source or reference | Identifiers | Add. info. |
|---|---|---|---|---|
| Genetic reagent (D. melanogaster) | UAS-cut | Bloomington Drosophila Stock Center | RRID: BDSC_36496 | |
| Genetic reagent (D. melanogaster) | FRT19A, cutC145 | Bloomington Drosophila Stock Center | RRID: BDSC_36496 | |
| Genetic reagent (D. melanogaster) | FRT19A, dsh3 | Bloomington Drosophila Stock Center | RRID: BDSC_6331 | |
| Genetic reagent (D. melanogaster) | UAS-Wg-HA | Bloomington Drosophila Stock Center | RRID: BDSC_5918 | |
| Genetic reagent (D. melanogaster) | UAS-Arm-S10 | Bloomington Drosophila Stock Center | RRID: BDSC_4782 | |
| Genetic reagent (D. melanogaster) | esg-Gal4, tubP-Gal80ts, UAS-GFP | Gift from Dr. H Jasper (Biteau et al., 2008) and Dr. C Micchelli (Micchelli and Perrimon, 2006) | N/A | |
| Genetic reagent (D. melanogaster) | wg-Gal4 | Gift from Dr. JP Vincent (Alexandre et al., 2014) | N/A | |
| Genetic reagent (D. melanogaster) | wg(KO; NRT–Wg) | Gift from Dr. JP Vincent (Alexandre et al., 2014) | N/A | |
| Genetic reagent (D. melanogaster) | UAS-TCF-DN | Bloomington Drosophila Stock Center | RRID: BDSC_4785 | |
| Genetic reagent (D. melanogaster) | wg-lacZ | Bloomington Drosophila Stock Center | RRID: BDSC_1672 | |
| Genetic reagent (D. melanogaster) | Rab3-GFP | Bloomington Drosophila Stock Center | RRID: BDSC_62541 | |
| Genetic reagent (D. melanogaster) | UAS-CD8-RFP | Bloomington Drosophila Stock Center | RRID: BDSC_27392 | |
| Genetic reagent (D. melanogaster) | cut-intron2-Gal4 | Bloomington Drosophila Stock Center | RRID: BDSC_49818 | |
| Genetic reagent (D. melanogaster) | NRE-GFP | Bloomington Drosophila Stock Center | RRID: BDSC_30727 | |
| Genetic reagent (D. melanogaster) | UAS-Sgg.S9A | Bloomington Drosophila Stock Center | RRID: BDSC_5255 | |
| Genetic reagent (D. melanogaster) | UAS-EcR-DN | Bloomington Drosophila Stock Center | RRID: BDSC_6872 | |
| Genetic reagent (D. melanogaster) | UAS-Br-Z1 | Bloomington Drosophila Stock Center | RRID: BDSC_51190 | |
| Genetic reagent (D. melanogaster) | UAS-Br-Z3 | Bloomington Drosophila Stock Center | RRID: BDSC_51192 | |
| Genetic reagent (D. melanogaster) | UAS-Br-Z4 | Bloomington Drosophila Stock Center | RRID: BDSC_51193 | |
| Genetic reagent (D. melanogaster) | UAS-TCF | Bloomington Drosophila Stock Center | RRID: BDSC_4838 | |
| Genetic reagent (D. melanogaster) | UAS-cut-IR | Bloomington Drosophila Stock Center | RRID: BDSC_33967 | |
| Genetic reagent (D. melanogaster) | UAS-br-IR | Bloomington Drosophila Stock Center | RRID: BDSC_27272 | |
| Genetic reagent (D. melanogaster) | UAS-Nipped-b-IR | Bloomington Drosophila Stock Center | RRID: BDSC_32406 | |
| Genetic reagent (D. melanogaster) | UAS-SA-IR | Bloomington Drosophila Stock Center | RRID: BDSC_33395 | |
| Genetic reagent (D. melanogaster) | UAS-wg-IR | Bloomington Drosophila Stock Center | RRID: BDSC_33902 | |
| Genetic reagent (D. melanogaster) | UAS-Eip74EF-IR | Bloomington Drosophila Stock Center | RRID: BDSC_29353 | |
| Genetic reagent (D. melanogaster) | UAS-Eip75B -IR | Bloomington Drosophila Stock Center | RRID: BDSC_26717 | |
| Genetic reagent (D. melanogaster) | UAS-white-IR | Bloomington Drosophila Stock Center | RRID: BDSC_33623 | |
| Antibody | Anti-Flag M2 affinity gels | Sigma-Aldrich | Cat#: A2220 | |
| Antibody | Mouse anti-Broad-core (25E9.D7) | Developmental Studies Hybridoma Bank | RRID: AB_528104 | |
| Antibody | Mouse anti-Broad-Z1 (Z1.3C11.OA1) | Developmental Studies Hybridoma Bank | RRID: AB_528105 | |
| Antibody | Mouse anti-Cut (2B10) | Developmental Studies Hybridoma Bank | RRID: AB_528186 | |
| Antibody | Mouse anti-Prospero (MR1A) | Developmental Studies Hybridoma Bank | RRID: AB_528440 | |
| Antibody | Mouse anti-Bruchpilot (nc82) | Developmental Studies Hybridoma Bank | RRID: AB_2314866 | |
| Antibody | Mouse anti-Allatostatin (Ast7, 5F10) | Developmental Studies Hybridoma Bank | RRID: AB_528076 | |
| Antibody | Rabbit anti-Pdm1 | Gift from Dr. X. Yang | N/A | |
| Antibody | Anti-GFP antibody | abcam | Cat#: ab13970 | |
| Antibody | Anti-GFP antibody - ChIP Grade | abcam | Cat#: ab290 | |
| Antibody | Mouse anti-beta-galactosidase (40-1a) | Developmental Studies Hybridoma Bank | RRID: AB_2314509 | |
| Antibody | Anti-RFP antibody | abcam | Cat#: ab62341 | |
| Antibody | Phospho-Histone H3 (Ser10) Antibody | Cell Signaling Technology | Cat#: 9701 | |
| Antibody | Rabbit anti-Myc | Cell Signaling Technology | Cat#: 2278 | |
| Commercial assay or kit | Duolink In Situ Red Starter Kit Mouse/Rabbit | Sigma-Aldrich | Cat#: DUO92101 | |
| Strain, strain background (E.coli) | BL21 (DE3) | TransGen Biotech | Cat#: CD601-02 | |
| Software, algorithm | Photoshop CS5 | Adobe | N/A | |
| Software, algorithm | The Leica Application Suite 2.6.3 | Leica | N/A | |
| Cell line (Human) | HEK293T | ATCC | RRID: CRL-3216 | |
| Cell line (D. melanogaster) | S2 | DGRC | Cat#: S2-DGRC | |
| Recombinant DNA reagent | pcDNA3.1 | Invitrogen | Cat#: V79020 | |
| Recombinant DNA reagent | pAc5.1 | Invitrogen | Cat#: V4110-20 | |
| Recombinant DNA reagent | pGEX-6P-1 | GE Healthcare | Cat#: 28-9546-48 |
Additional files
-
Transparent reporting form
- https://doi.org/10.7554/eLife.33934.024
Download links
A two-part list of links to download the article, or parts of the article, in various formats.
Downloads (link to download the article as PDF)
Open citations (links to open the citations from this article in various online reference manager services)
Cite this article (links to download the citations from this article in formats compatible with various reference manager tools)
Temporospatial induction of homeodomain gene cut dictates natural lineage reprogramming
eLife 7:e33934.
https://doi.org/10.7554/eLife.33934


