Non-invasive imaging of CSF-mediated brain clearance pathways via assessment of perivascular fluid movement with diffusion tensor MRI
- University College London, United Kingdom
- The Francis Crick Institute, United Kingdom
- UCL Institute of Neurology, United Kingdom
Figures
Figure 1

Non-invasive MRI of perivascular channels.
(A) Example b0 MRI image. The position and orientation of the imaging slice is adjusted to optimally visualize the perivascular space (PVS) around both branches of the MCA. Bright signal can be observed from fluid filled compartments: CSF in the subarachnoid space around the Circle of Willis (CoW); fluid in the perivascular space that surrounds the MCA; the ventral aspect of the third ventricle. (B) Photograph of the ventral aspect of the rat brain surface illustrating a putative PVS surrounding the middle cerebral artery (MCA) (reproduced with permission from Lochhead et al., 2015).
Figure 2 with 1 supplement
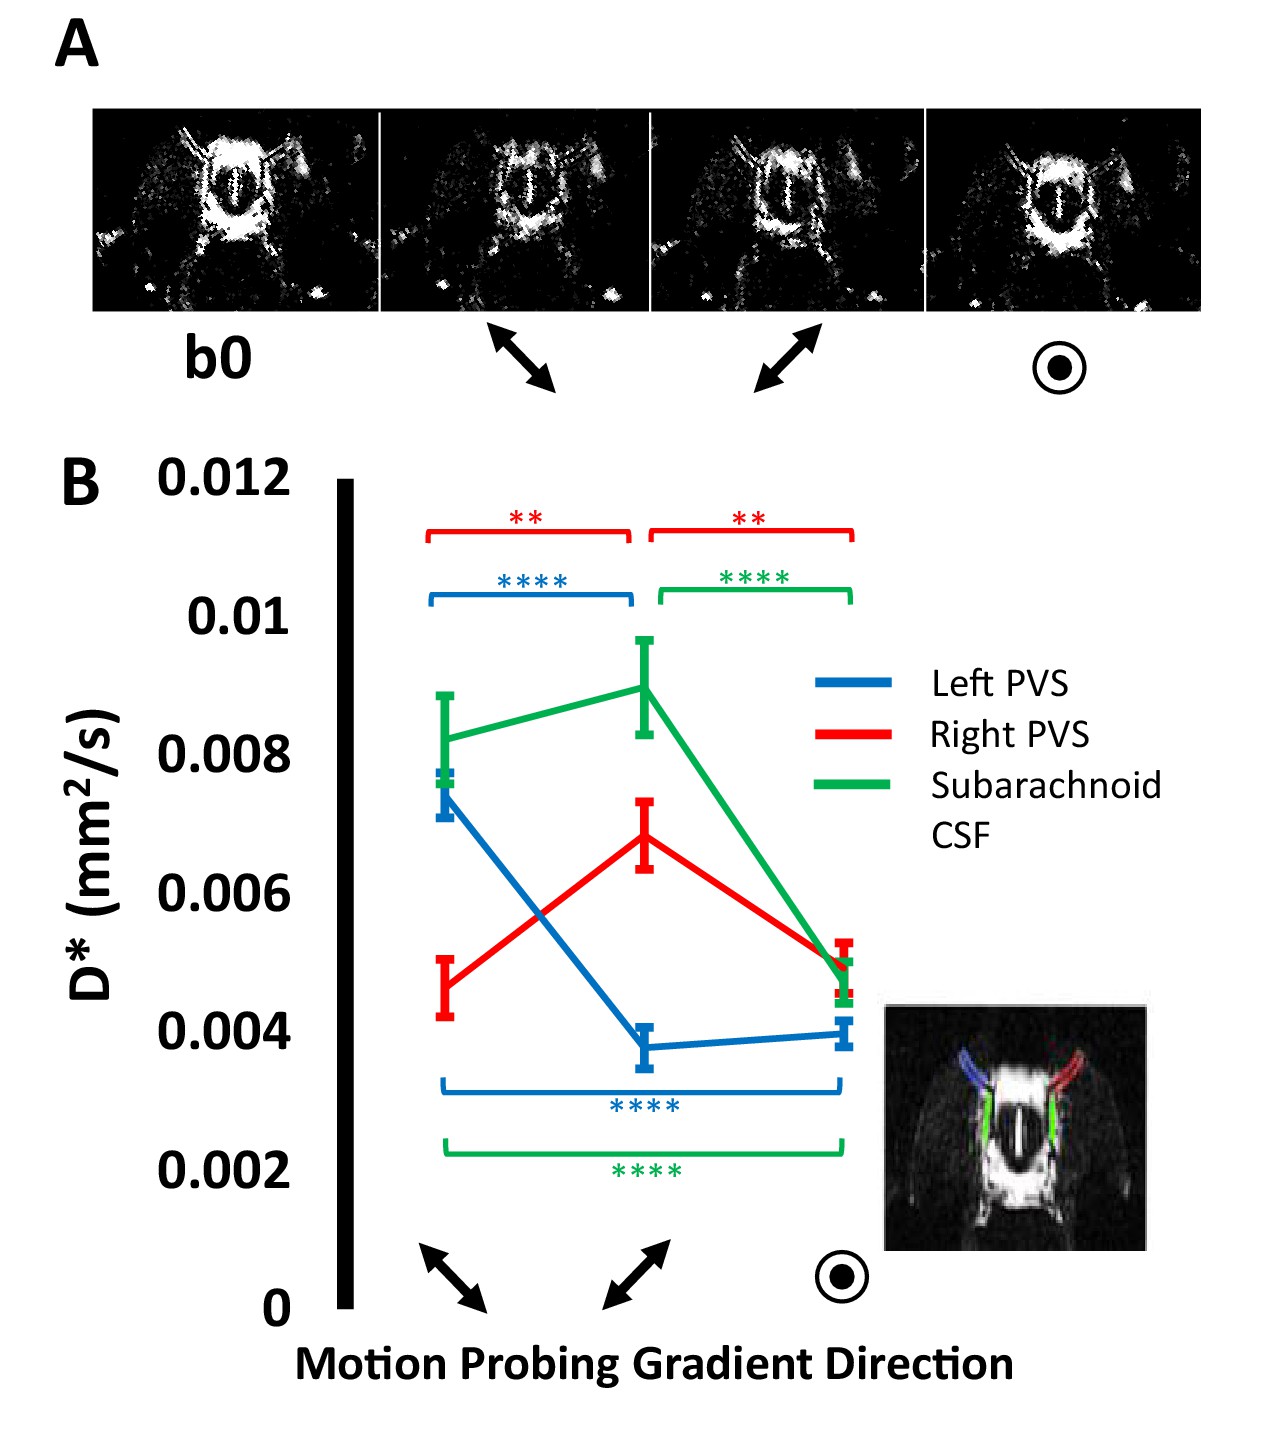
Multiple direction diffusion weighted imaging of subarachnoid and perivasular fluid movement.
(A) Example bO and ‘diffusion weighted’ images acquired with the motion probing gradients applied in 3 orthogonal directions respectively. (B) The mean D* calculated within ROIs [see insert] in the right perivascular space (red), left perivascular space (blue), subarachnoid space (green) with the motion probing gradients applied in three orthogonal directions (±SEM).
Figure 2—figure supplement 1
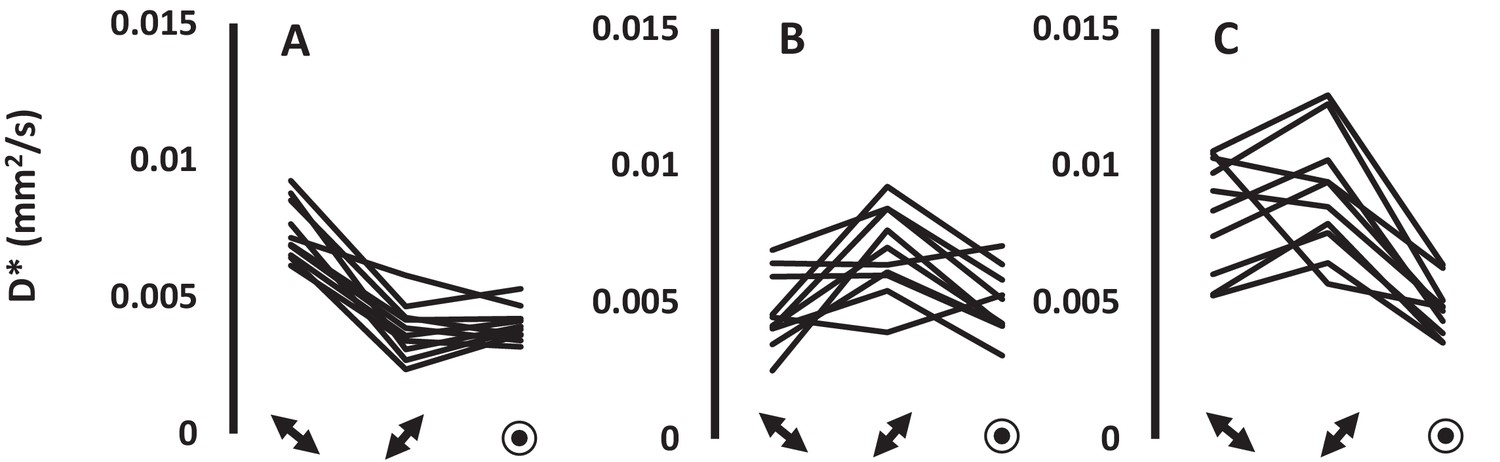
The individual animal D* calculated within ROIs in the right perivascular space.
(A), left perivascular space (B), subarachnoid space (C) with the motion probing gradients applied in three orthogonal directions (x-axis). Each line represents an individual animal (n = 10).
Figure 3 with 1 supplement

Diffusion tensor imaging of subarachnoid and perivascular fluid movement.
(A) bO image with ROIs in the right and left PVS and subarachnoid space highlighted in blue, red and green respectively. The mean pseudo-diffusion tensor ellipsoid within the subarachnoid space ROI (B) and right (C) and left (D) PVS respectively across the six rats. The pseudo-diffusion tensors for each individual animal are shown in Figure 3—figure supplement 1. (E) Example map of pseudo-diffusion tensor ellipsoids with corresponding b0 image (insert).
Figure 3—figure supplement 1
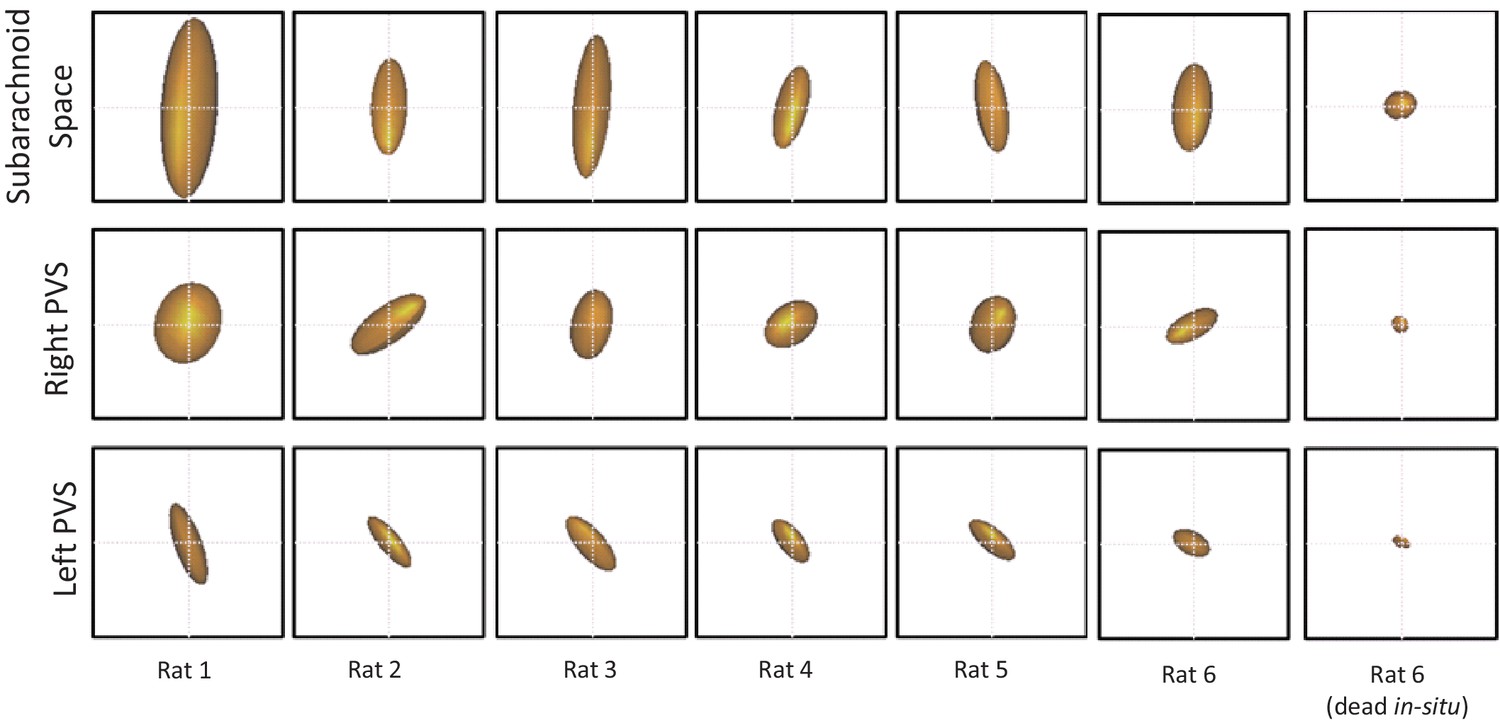
D* tensors within the left and right perivascular space (PVS) and subarachnoid space ROIs for each of the individual subjects imaged in part ii).
The corresponding D* tensor for the dead brain is also shown.
Figure 4 with 1 supplement
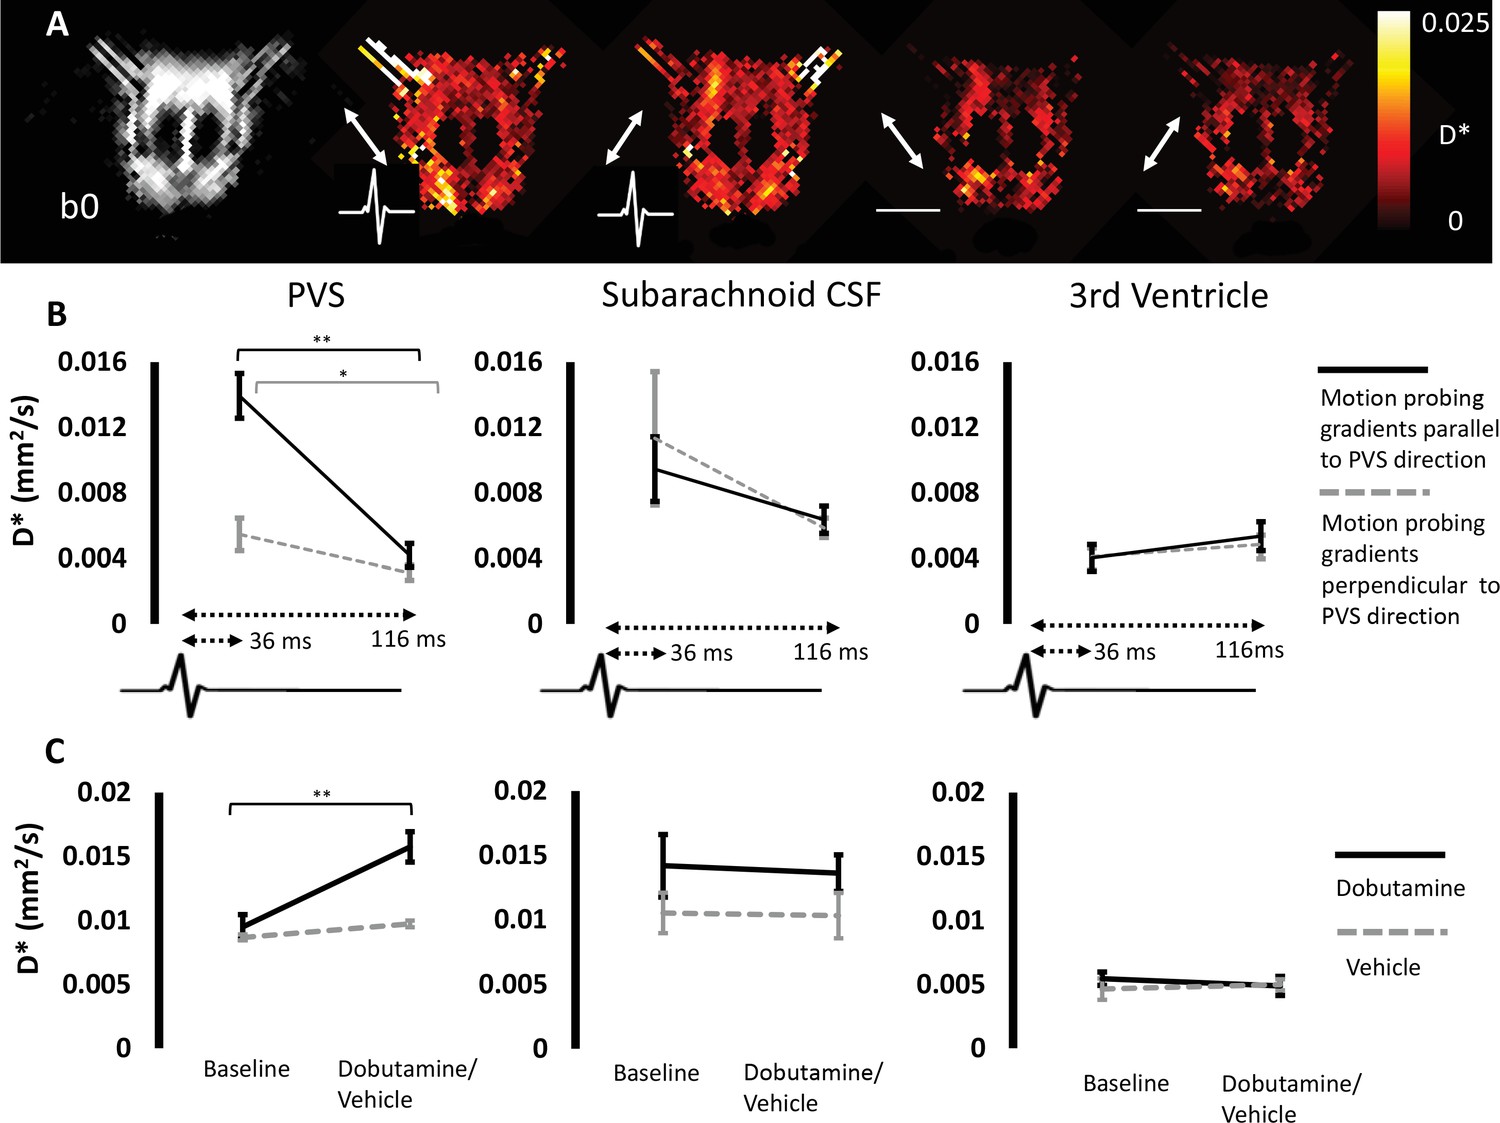
Cerebral arterial pulsation drives non-invasive measures of perivascular fluid movement.
(A) b0 image (first column) and D* maps during arterial pulsation (second and third column) and during diastole (fourth and fifth column) from a single animal [the white arrows represent the direction of the applied MPGs]. (B) The mean D* during arterial pulsation and diastole respectively within the three ROIs for MPGs applied parallel (black line) and perpendicular to (grey dashed line) PVS orientation. (C) The mean D* at baseline and after dobutamine (black line) or vehicle (grey dashed line) within the same ROIs (non-gated).
Figure 4—figure supplement 1
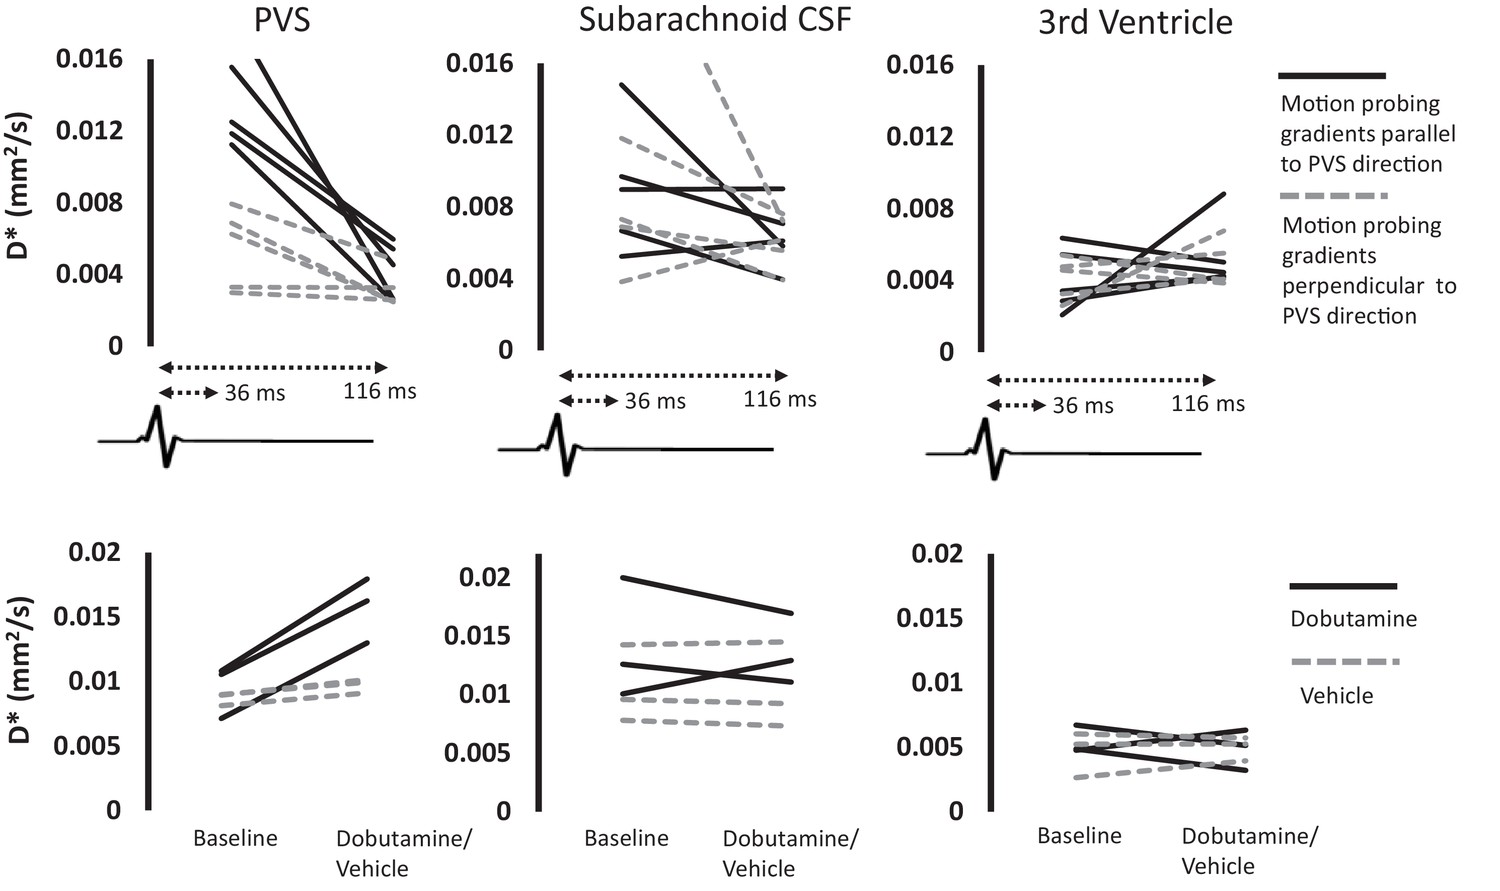
(A) The individual animal D* during arterial pulsation and diastole respectively within the three ROIs for MPGs applied parallel (black line) and perpendicular to (grey dashed line) PVS orientation. (B) The mean D* at baseline and after dobutamine (black line) or vehicle (grey dashed line) within the same ROIs (non-gated). Each line represents an individual animal.
Author response image 1
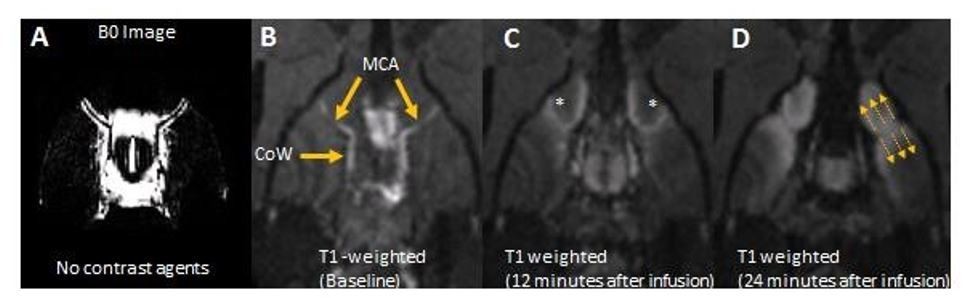
Comparison to contrast enhanced MRI following cisterna magna injection of gadolinium
A. b0 image at the ventral aspect of the rat brain captured using the noninvasive approach with an ultra-long TE. B. T1 weighted image at the matched ventral slice at baseline, prior to intra-cisternal gadolinium infusion. T1 weighted images 12 minutes (C) and 24 minutes (D) after intra-cisternal gadolinium infusion.
Additional files
-
Transparent reporting form
- https://doi.org/10.7554/eLife.34028.010
Download links
A two-part list of links to download the article, or parts of the article, in various formats.
Downloads (link to download the article as PDF)
Open citations (links to open the citations from this article in various online reference manager services)
Cite this article (links to download the citations from this article in formats compatible with various reference manager tools)
Non-invasive imaging of CSF-mediated brain clearance pathways via assessment of perivascular fluid movement with diffusion tensor MRI
eLife 7:e34028.
https://doi.org/10.7554/eLife.34028


