Forniceal deep brain stimulation induces gene expression and splicing changes that promote neurogenesis and plasticity
- Baylor College of Medicine, United States
- Jan and Dan Duncan Neurological Research Institute, Texas Children’s Hospital, United States
- Howard Hughes Medical Institute, Baylor College of Medicine, United States
Figures
Figure 1 with 2 supplements
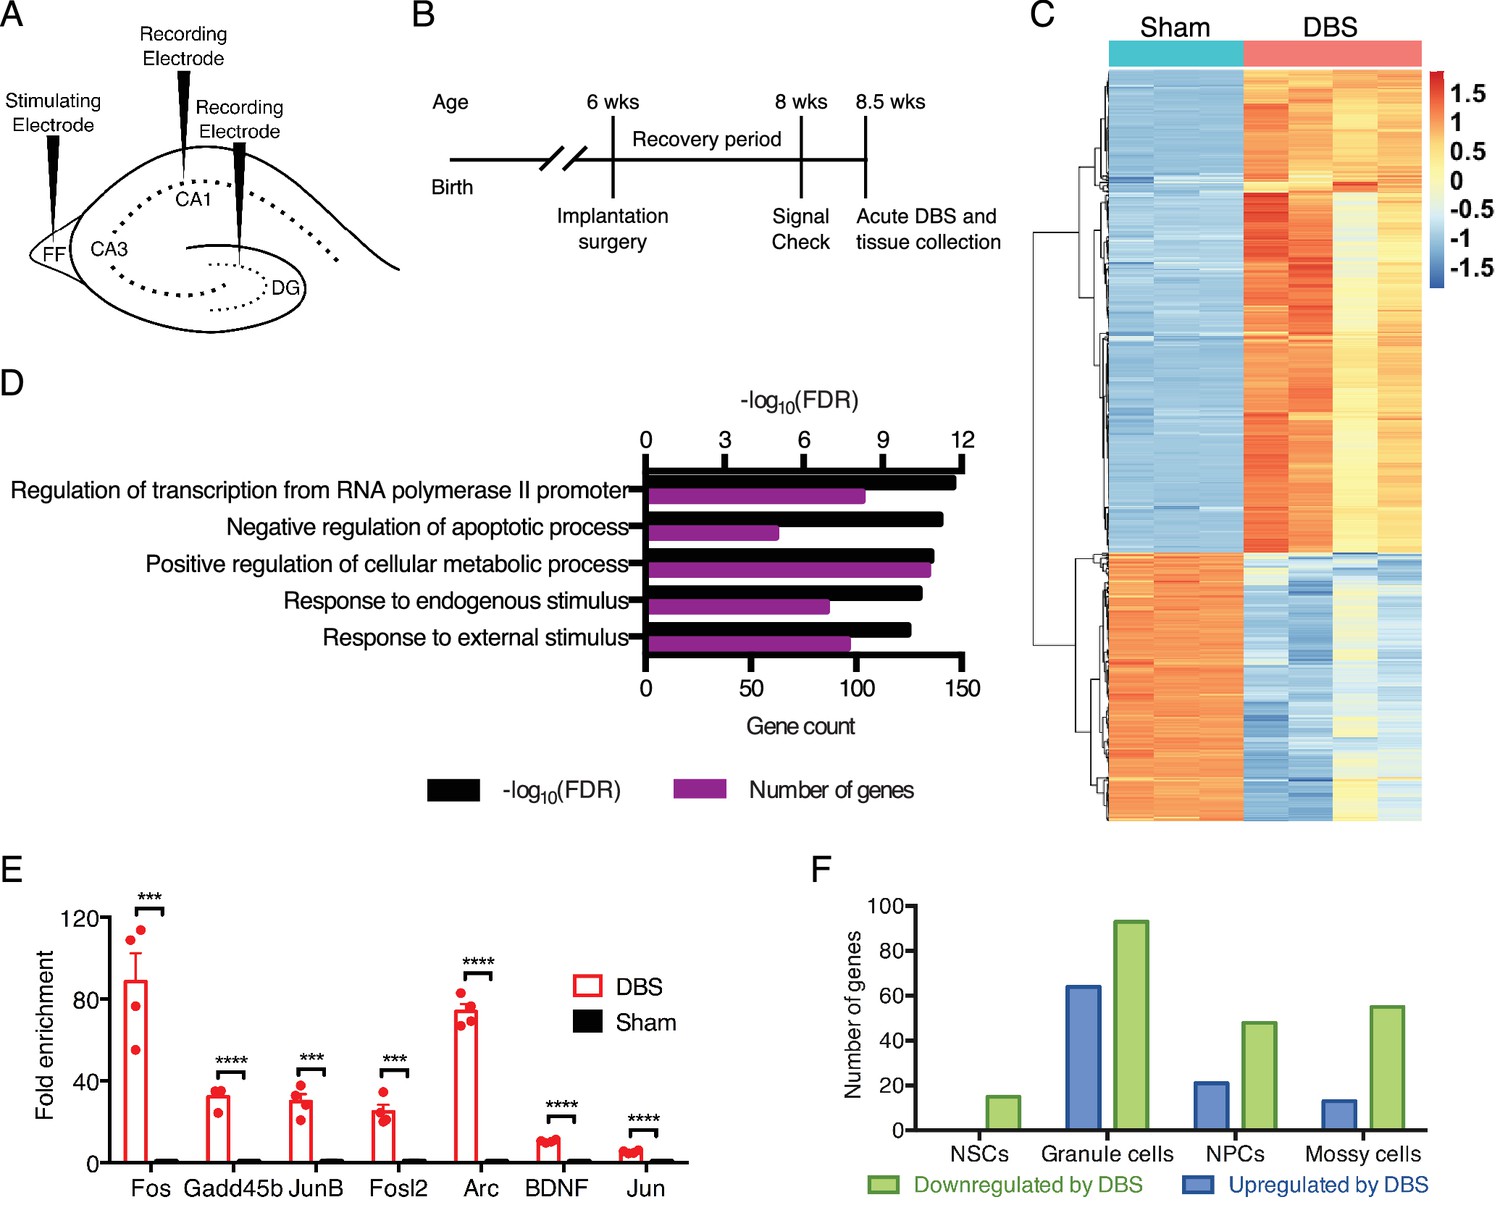
DBS alters the expression of many genes, including numerous transcriptional regulators in wild-type mice.
(A) Schematic showing electrode placement for DBS. DG: dentate gyrus; FF: fimbria-fornix. (B) Timeline of implantation and tissue collection used for these studies. Signal check: single pulse induced evoked responses in the DBS pathway as recorded in the hippocampus were verified 1–2 days prior to acute DBS. (C) Heatmap showing protein-coding genes whose expression change at least 2-fold (with FDR < 0.05) following DBS in wild-type mice (WT). Sham columns are indicated by teal bar. DBS columns are indicated by the pink bar. (D) Gene ontology (GO) analysis of genes that are upregulated at least at least 2-fold (with FDR < 0.05) following DBS. (E) RT-qPCR validation of DBS upregulated genes in a new cohort of WT mice (n = 4 sham and 4 DBS mice; significance determined using an unpaired, two-tailed t-test; error bars: SEM; ***p<0.001; ****p<0.0001). (F) Numbers of genes found to be significantly altered in expression following DBS in different dentate gyrus cell types (p<0.01). NSCs: Neural stem cells; NPCs: Neural progenitor cells. Figure 1—figure supplement 1 shows preliminary RT-qPCR experiment data used to pick the optimal duration for acute stimulation, and it shows the overlap of DBS-upregulated genes with prior activity-dependent datasets. Figure 1—figure supplement 2 shows the stable RNA expression level of genes used as housekeeping genes in RT-qPCR experiments. Source data for all quantified gene expression data in WT sham and DBS samples is provided in Figure 1—source data 1. Figure 1—source data 2 provides the GO data used in Figure 1D. The complete PSEA results are available in Figure 1—source data 3.
-
Figure 1—source data 1
Quantified gene expression data from wild-type sham and DBS-treated mice.
- https://doi.org/10.7554/eLife.34031.006
-
Figure 1—source data 2
Gene ontology data for differentially expressed genes in wild-type samples following DBS.
- https://doi.org/10.7554/eLife.34031.007
-
Figure 1—source data 3
Detailed PSEA results showing cell type and DBS-treatment specific genes.
The following information is provided in this table: coef.1 is the noise, coef.2 is the normalized population specific expression, coef.3 is the normalized relative differences between DBS and sham treatment, and pvalue.1, pvalue.2, and pvalue.3 indicate significance of coef.1, 2, or 3, respectively, as determined by the F-test in the linear regression analysis.
- https://doi.org/10.7554/eLife.34031.008
Figure 1—figure supplement 1
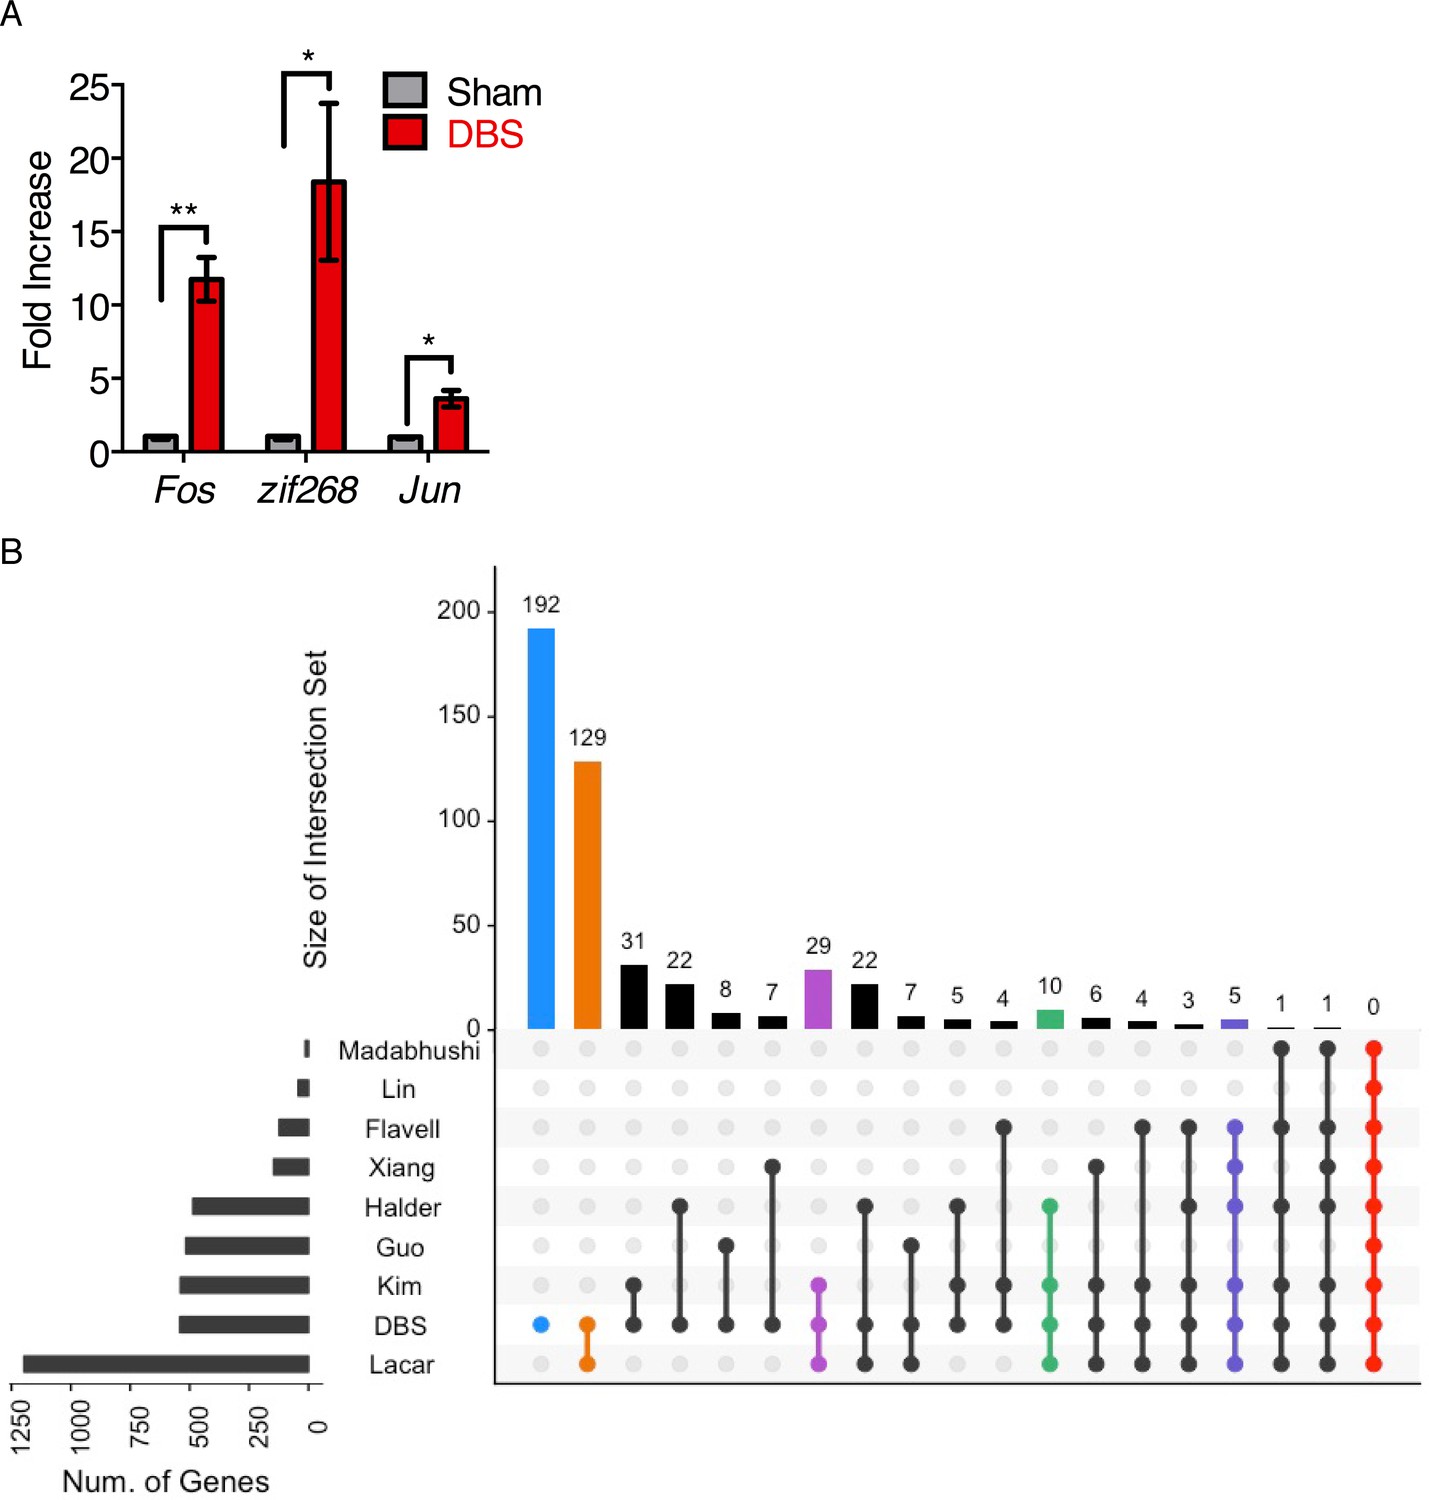
Determining stimulation duration for acute DBS and overlap of DBS-induced genes with previously reported activity-dependent genes.
(A) RT-qPCR evaluation of the expression of 3 activity-dependent genes in DG tissue from WT mice following 45 min of DBS with a 20 min post-stimulation recovery period (n = 4 DBS, three sham; error bars: SEM; unpaired, two-tailed t-test; *p<0.05; **p<0.01; normalized to GAPDH). (B) Overlap of genes previously reported to be activity-dependent with those genes found to be significantly upregulated (FDR < 0.05, fold-change >2) by forniceal DBS in WT mice.
Figure 1—figure supplement 2
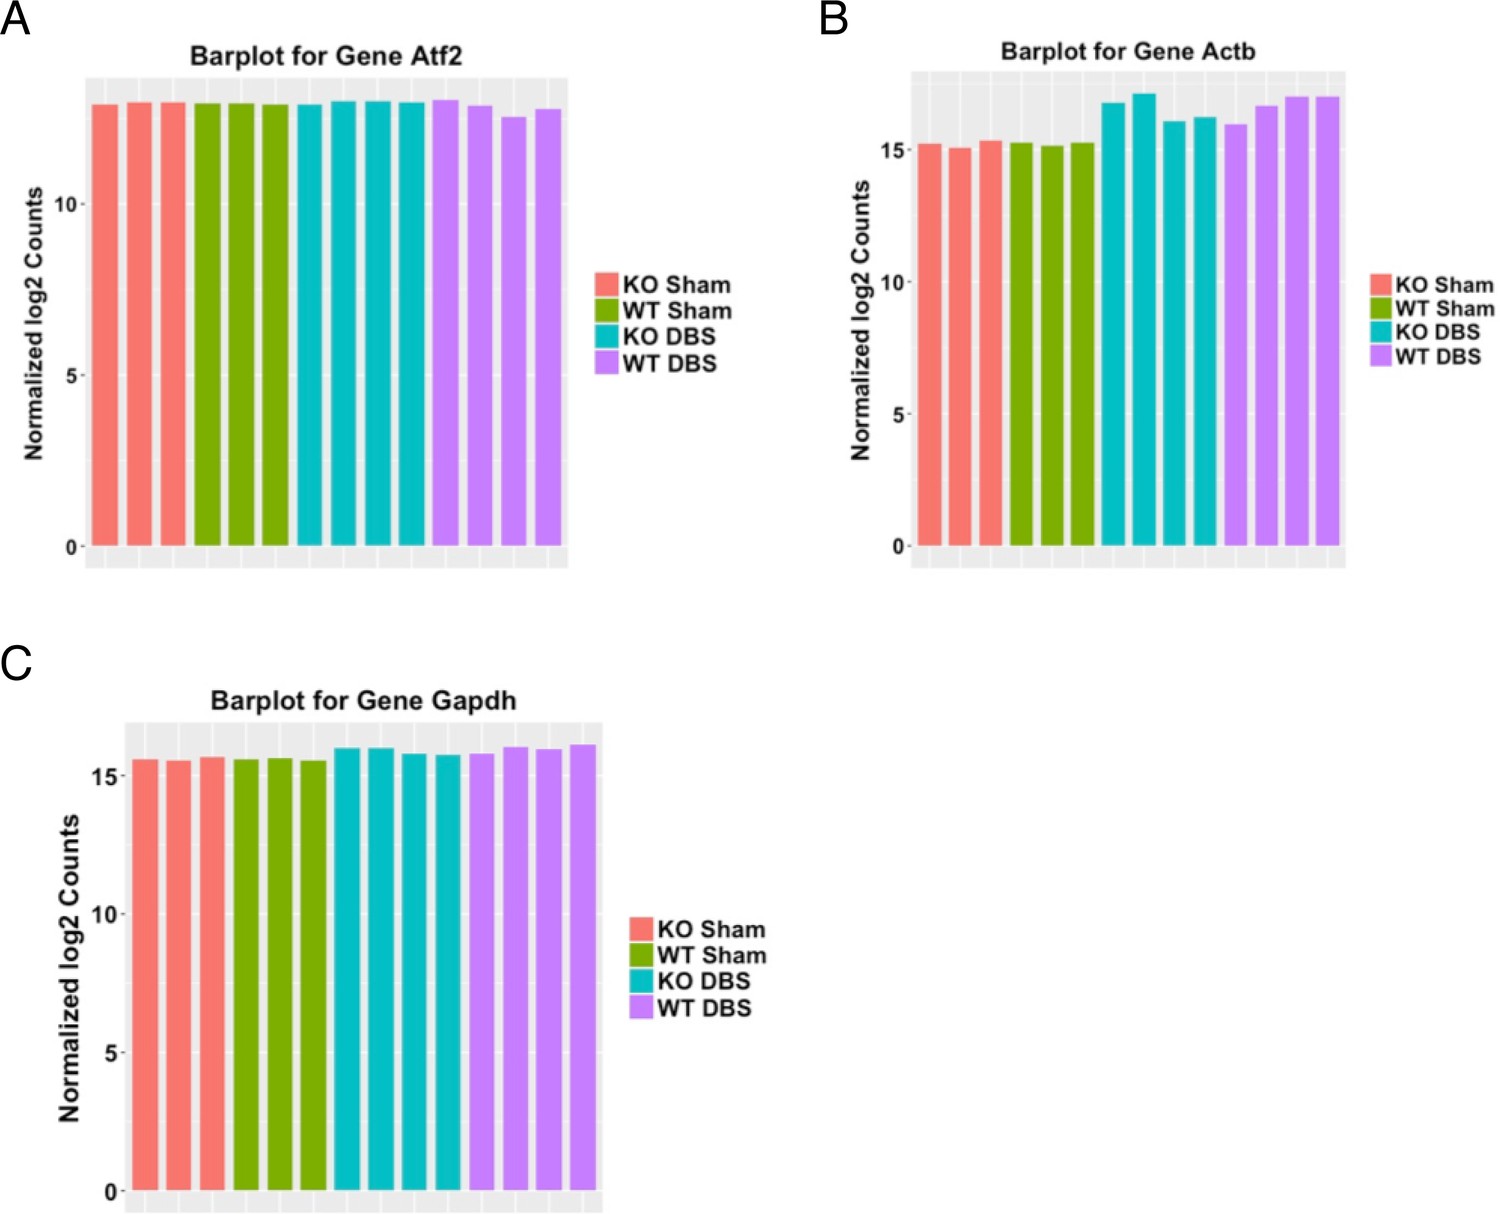
Selection of housekeeping genes for RT-qPCR based on stability of gene expression across genotypes and treatments.
These three housekeeping genes were used for normalization in RT-qPCR experiments. They were chosen because of their stable expression between genotypes (WT and Mecp2-KO mice) and between sham and DBS treated animals.
Figure 2
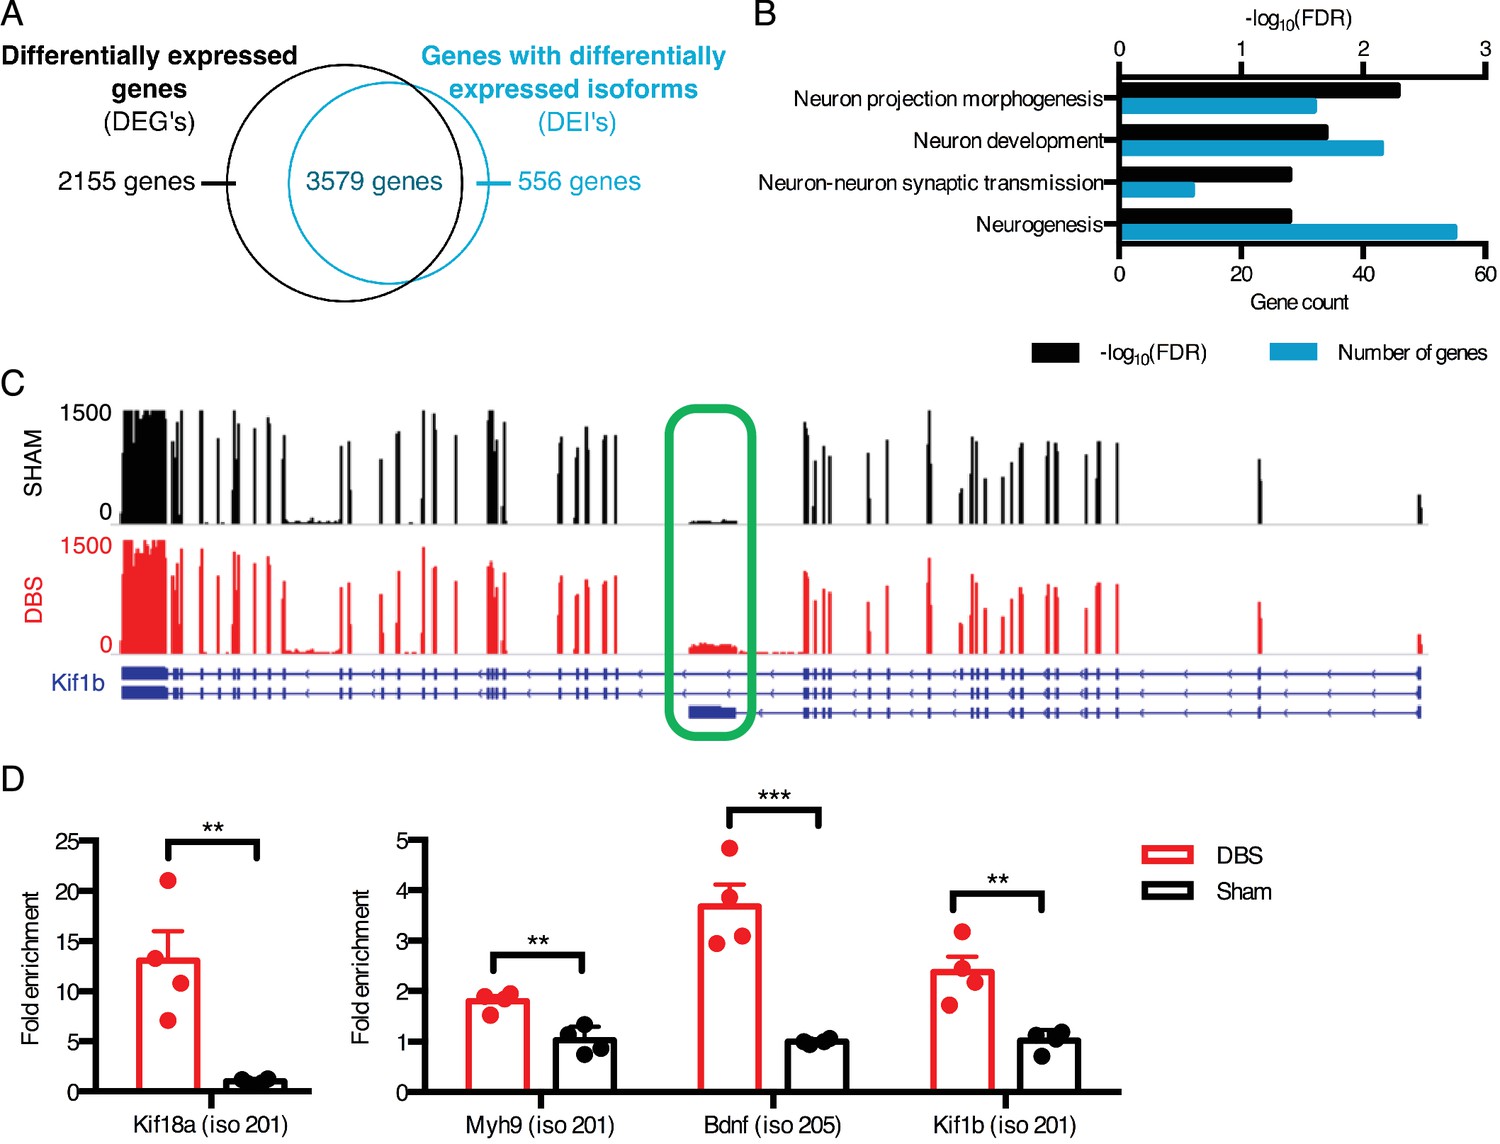
DBS revealed hundreds of activity-dependent splicing changes in genes that would be overlooked by differential gene analysis.
(A) Overlap between genes that are differentially expressed with DBS (fold-change >20%; FDR < 0.05) and genes with differential isoform expression following DBS in WT mice (Fold-change >30%; FDR < 0.05). (B) Gene ontology (GO) analysis of genes showing differential isoform expression but not an overall change in gene expression following DBS. (C) Representative RNA-sequencing tracks from WT sham (black; max: 1500 reads) and WT DBS (red; max: 1500 reads) mice showing the expression of the Kif1b gene, along with annotated Kif1b isoforms (shown in blue). The shortest isoform is differentially expressed post-DBS, and the green box indicates the unique region of the shortest isoform where RT-qPCR primers were located to check transcript levels in a new cohort. (D) RT-qPCR validation of DBS upregulated isoforms in a new cohort of WT mice (n = 4 sham, 4 DBS mice; significance determined using an unpaired, two-tailed t-test; error bars: SEM; **p<0.01; ***p<0.001). Source data for RNA isoforms quantification can be found in Figure 2—source data 1. The complete list of GO terms and scores for genes with differentially expressed isoforms that are not differentially expressed at the whole gene level can be found in Figure 2—source data 2.
-
Figure 2—source data 1
Isoform expression data from wild-type sham and DBS-treated mice.
- https://doi.org/10.7554/eLife.34031.010
-
Figure 2—source data 2
Gene ontology data for genes in wild-type samples with differentially expressed isoforms (DEIs) that are not differentially expressed at the gene level.
- https://doi.org/10.7554/eLife.34031.011
Figure 3

DBS induces Jun-associated transcriptional programs.
(A) Transcription factors found to be increased in WT dentate gyrus neurons following DBS as quantified by Mass spectrometry. P-values were calculated using an unpaired, two-tailed t-test. (B) Network analysis results showing the direct and downstream targets of the three transcription factors whose protein levels are altered following DBS. The identified targets are genes that are either significant DEG’s (Differentially expressed genes; FDR < 0.05,>2 fold expression change) or DEI’s (Differentially expressed isoforms; FDR < 0.05,>2 fold expression change). Node size indicates the number of targeted genes. Node color indicates the log-fold change in expression of that gene, with blue indicating downregulated genes, and red indicating upregulated genes. Label colors indicate the category of gene: Black: the gene is both DEG and DEI, Purple: DEG only, Green: DEI only. The detailed mass spectrometry results from WT sham and DBS mice can be found in Figure 3—source data 1.
-
Figure 3—source data 1
Detailed mass spectrometry results for sham and DBS wild-type mice.
- https://doi.org/10.7554/eLife.34031.013
Figure 4 with 1 supplement
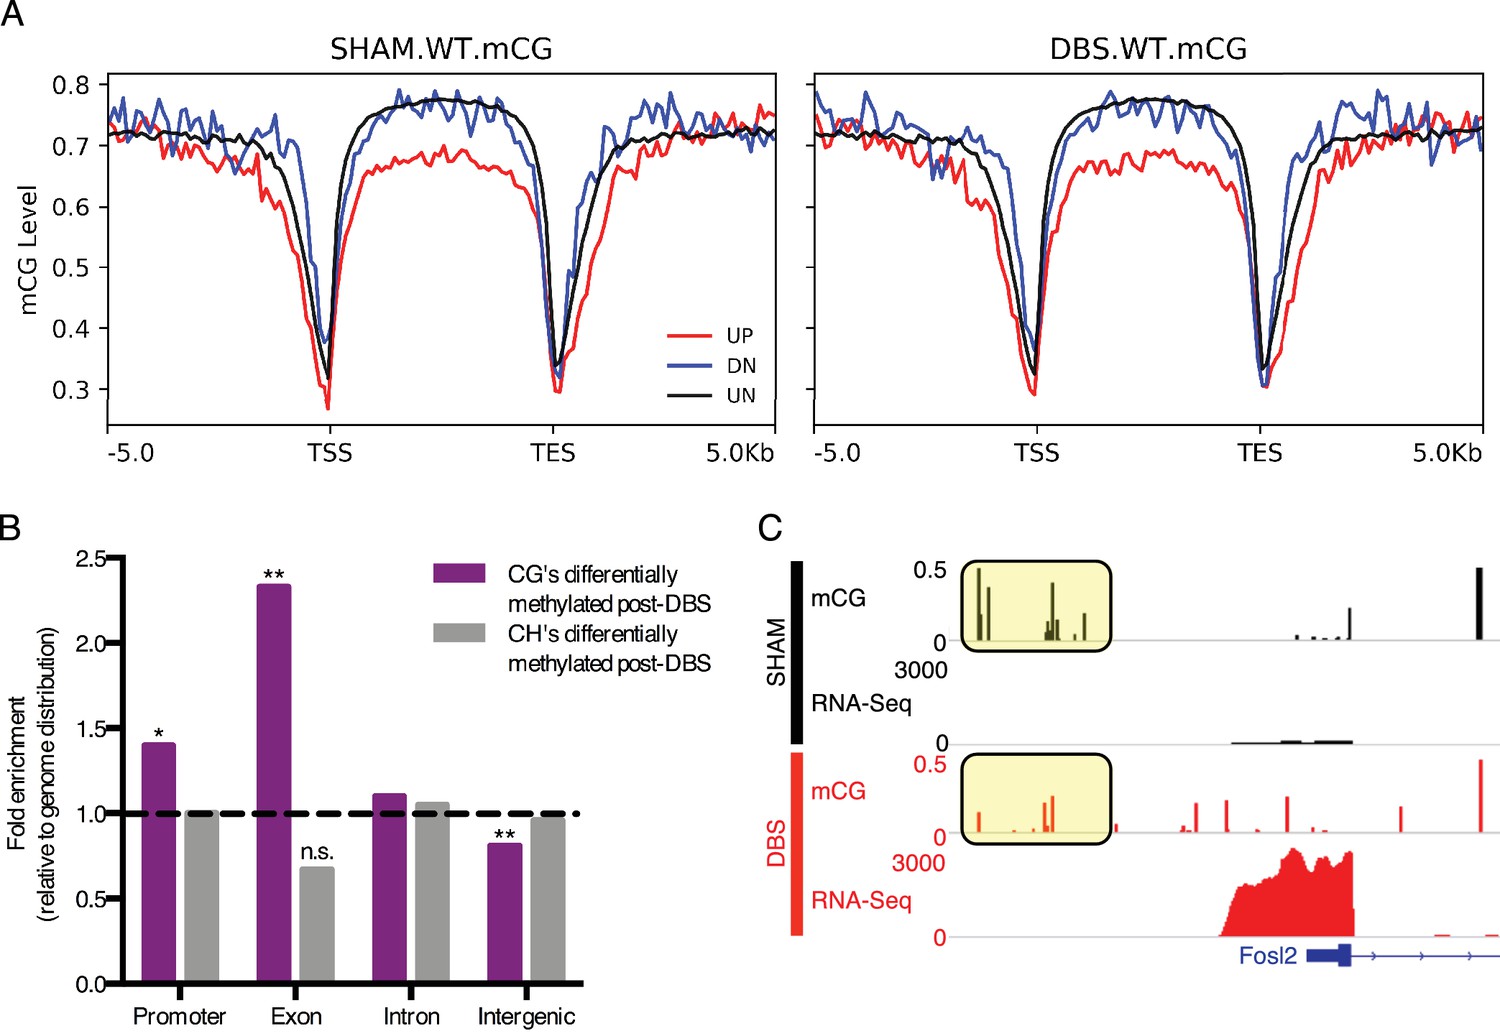
DBS-induced transcription and splicing changes show unique methylation patterns.
(A) Running average plot of mCG methylation levels on DBS upregulated genes (shown in red; FDR < 0.05,>2 fold increase in expression), DBS downregulated genes (shown in blue; FDR < 0.05,>2 fold decrease in expression), and in genes whose expression is unchanged by DBS (shown in black). The left panel shows the mCG methylation of these genes observed in sham samples. The right panel shows the mCG methylation of these categories of genes observed in DBS samples. (B) Genomic locations of differentially methylated regions (DMRs) with a greater than 50% change in methylation following DBS. Locations evaluated: intergenic, introns, exons, and promoters. The percentage of DMRs falling into each location type was divided by the percentage of the genome comprised of that location type to generate a fold enrichment score for DMR locations relative to the genomic distribution. Dashed line at y = 1 indicates the genomic values. *p<0.05, **p<0.01. (C) Fosl2 mCG methylation and RNA-sequencing tracks from representative WT sham (shown in black) and WT DBS (shown in red) samples. The annotated gene is shown in blue, and the mCG level in the promoter region is highlighted in the yellow boxes. Figure 4—figure supplement 1 shows mCH distribution at promoters and gene bodies in DBS-regulated genes, and it also shows genomic localization of DMRs with a greater than 50% change in methylation following DBS. The DMR source data, including p-values, percent change and genomic localization is provided in Figure 4—source data 1.
-
Figure 4—source data 1
Locations of differentially methylated regions that are significantly different between wild-type sham and wild-type DBS samples.
- https://doi.org/10.7554/eLife.34031.016
Figure 4—figure supplement 1
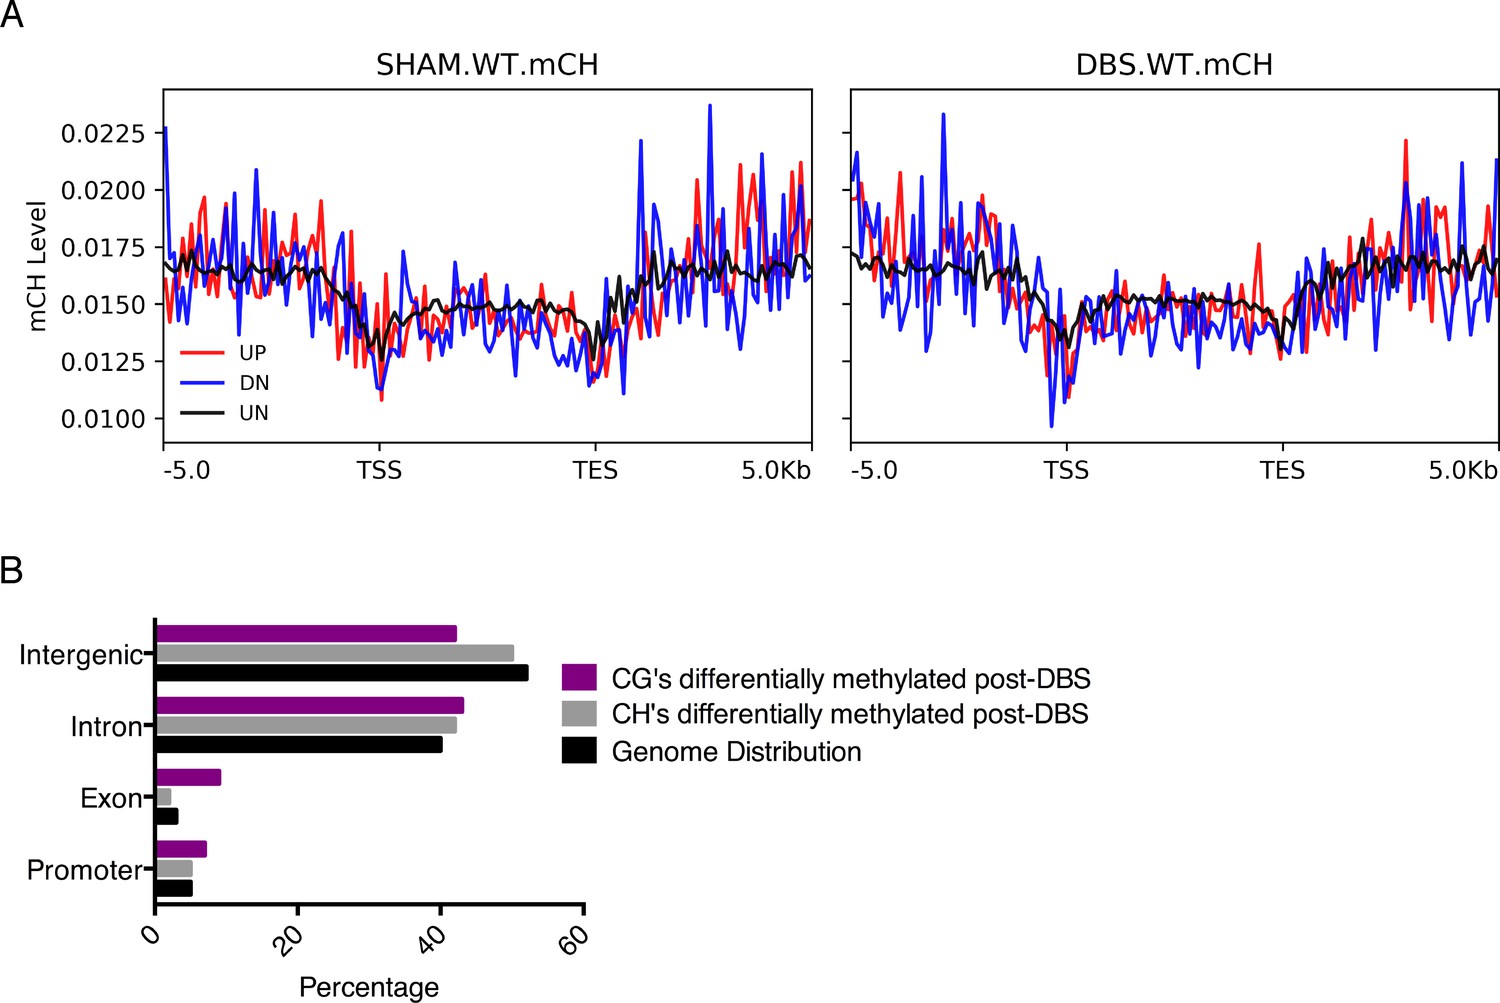
mCH levels do not show distinct signatures on DBS up- or downregulated genes.
(A) Quantification of mCH levels on promoters and gene bodies of genes that are upregulated by DBS (shown in red; FDR < 0.05, fold-change >2), downregulated by DBS (shown in blue; FDR < 0.05, greater than two decrease), or genes that are unchanged by DBS (shown in black). (B) Genomic locations of differentially methylated regions (DMRs) with a greater than 50% change in methylation following DBS. Locations evaluated: intergenic, introns, exons, and promoters, and the percentage of the genome that each location comprises is shown in black.
Figure 5
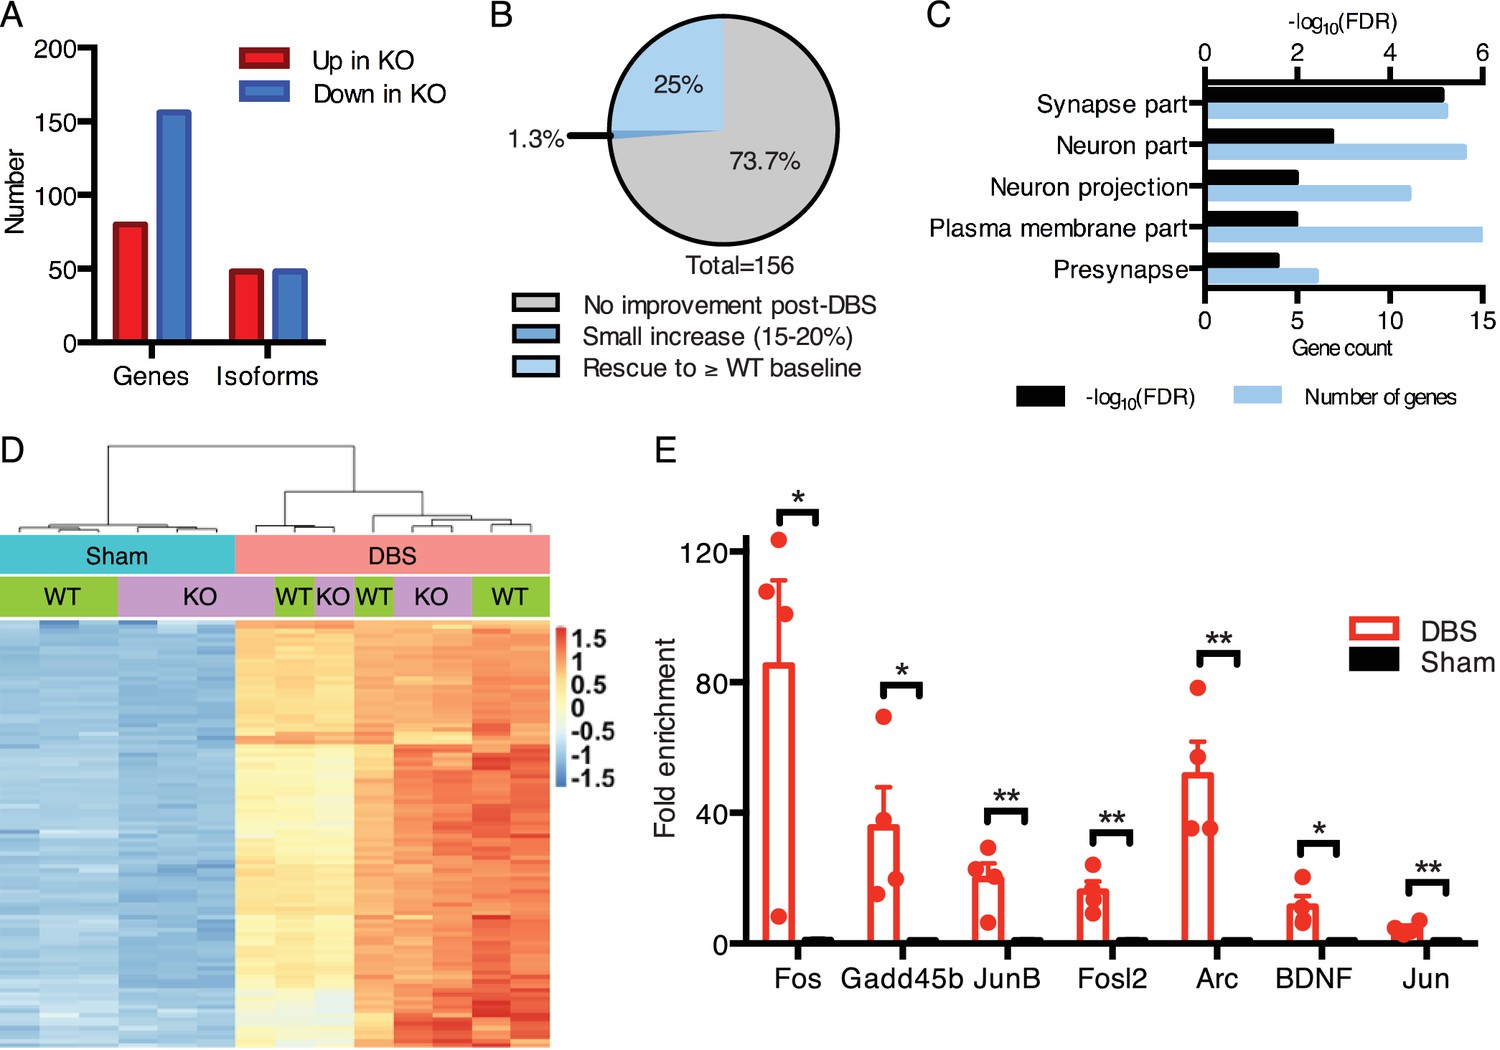
DBS rescues expression of genes important for neurological function that are low in Mecp2-null mice.
(A) Differentially expressed genes and isoforms in KO sham samples (FDR < 0.05,>20% fold-change) as compared to WT samples. (B) Evaluation of the effect of DBS on genes with decreased expression in KO sham samples. Gray: genes with unchanged expression following DBS in KO mice (FDR > 0.05). Dark blue: genes with a small but significant increase following DBS in KO mice (FDR < 0.05; Fold-change <20%). Light blue: genes rescued to at least WT baseline levels (FDR < 0.05, Fold-change >20%). (C) Gene ontology analysis of the genes rescued back to WT baseline levels in KO mice. (D) Heat map showing the expression levels of the top 100 protein coding genes with the highest increase in expression in WT mice, and the comparison in expression of these genes between WT and KO samples. (E) RT-qPCR validation of DBS upregulated isoforms in a new cohort of WT mice (n = 4 sham, 4 DBS mice; significance determined using an unpaired, two-tailed t-test; error bars: SEM; *p<0.05; **p<0.01). All quantified gene expression changes along with comparisons between WT and KO samples at baseline and following DBS can be found in Figure 5—source data 1. Isoform expression data from WT and KO mice can be found in Figure 5—source data 2. GO data for genes with rescued expression following DBS in KO mice can be found in Figure 5—source data 3.
-
Figure 5—source data 1
Quantified gene expression data from wild-type and Mecp2-null sham and DBS-treated mice.
- https://doi.org/10.7554/eLife.34031.018
-
Figure 5—source data 2
Isoform expression data from wild-type and Mecp2-null sham and DBS-treated mice.
- https://doi.org/10.7554/eLife.34031.019
-
Figure 5—source data 3
Gene ontology data for DBS-rescued genes in KO mice.
- https://doi.org/10.7554/eLife.34031.020
Figure 6 with 1 supplement
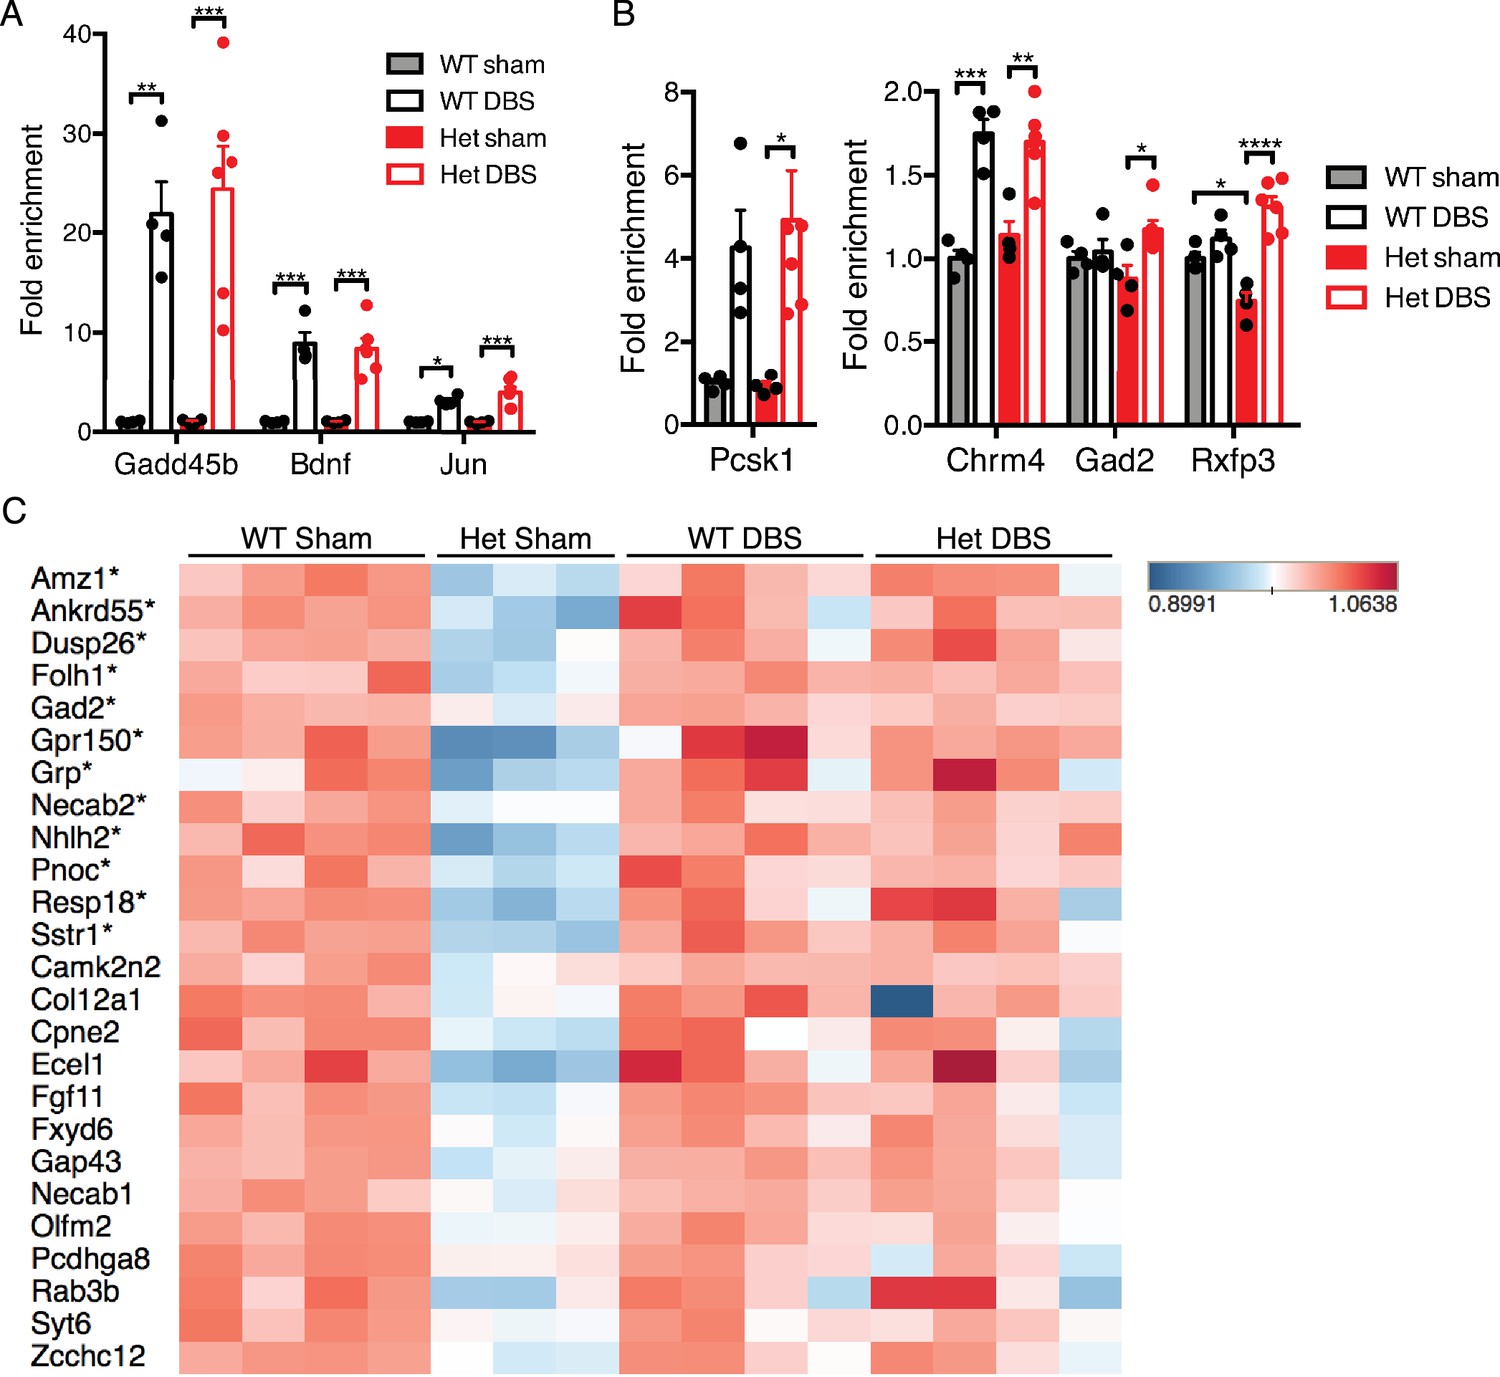
Forniceal DBS induces similar acute gene expression changes in Mecp2-heterozygous (Het) mice and reveals a trend for sustained gene expression rescue following chronic DBS.
(A) and (B) RT-qPCR data from 8.5-week-old female samples following acute DBS (45 min of DBS; n = 4 WT sham, 4 WT DBS, 4 Het sham, and 6 Het DBS; significance determined using an two-way ANOVA with Holm-Sidak multiple comparisons test; error bars: SEM; *p<0.05; **p<0.01; ***p<0.001; ****p<0.0001). (C) Heat map of RNA-Sequencing data from 13.5-week-old WT and Het female chronic forniceal DBS samples showing a subset of the protein coding genes that are downregulated by at least 20% (padj <0.05) in Het sham samples. Genes with an asterisk (*) are those that are significantly increased (fold-change >15%; FDR < 0.05) in the Het samples that received chronic DBS. All quantified gene expression data from chronic DBS and sham treated female mice can be found in Figure 6—source data 1. Figure 6—figure supplement 1 shows a heat map of all genes that are either down- or upregulated at least 20% (FDR < 0.05) in Het sham mice.
-
Figure 6—source data 1
Quantified gene expression data from chronic forniceal DBS or sham treated wild-type and Mecp2-heterozygous mice.
- https://doi.org/10.7554/eLife.34031.023
Figure 6—figure supplement 1

Heat map showing expression levels of protein coding genes that are significantly altered in Mecp2-heterozygous mice.
RNA-Sequencing data from chronic forniceal DBS or sham treated WT and Het mice showing the level of expression of genes that are either downregulated by at least 20% (FDR < 0.05) in the Het sham mice or upregulated by at least 20% (FDR < 0.05) in the Het sham mice. Unsupervised clustering of the samples shows that 3 of the Het DBS samples cluster with the WT samples.
Figure 7 with 1 supplement
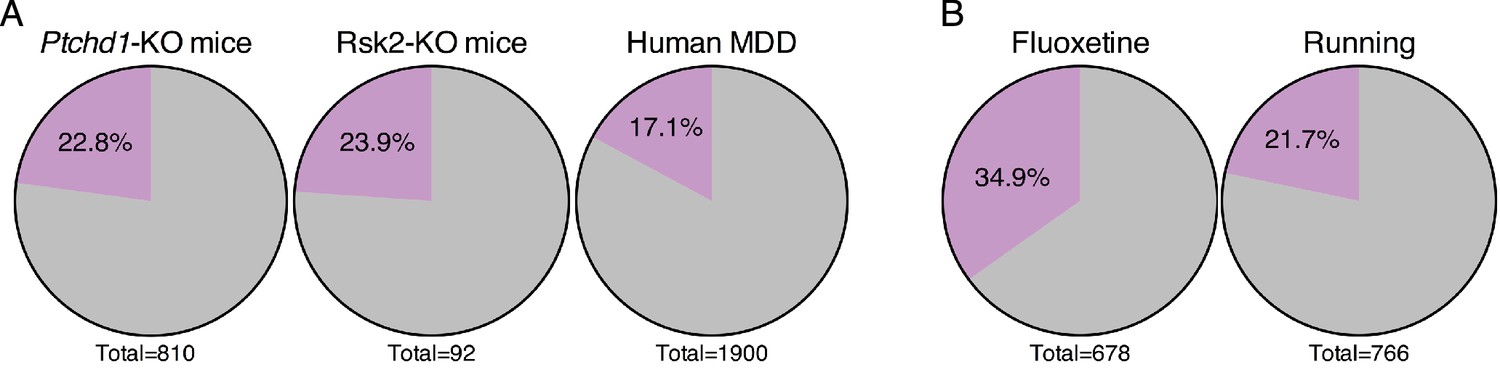
Forniceal DBS enhances the expression of genes relevant to other neuropsychiatric conditions.
(A) Pie charts showing the overlap of DBS upregulated genes with genes found to be decreased in expression in the hippocampus of individuals with or mouse models of neuropsychiatric disorders. Gray: genes that are low in the indicated sample that are unchanged by DBS in WT mice (FDR > 0.05). Purple: genes with increased expression following DBS in WT mice (FDR < 0.05,>25% fold-change). The significance of the overlap between DBS and these datasets was determined using the Fisher exact test, yielding the following values: Ptchd1-KO vs. DBS: p=3.10E-25; Rsk2-KO vs. DBS: p=7.5E-6; MDD vs. DBS: p=4.3E-20. (B) Comparison of genes upregulated by DBS and genes upregulated by either fluoxetine or running. The significance of the overlap between DBS and these datasets was determined using the Fisher exact test, yielding the following values: fluoxetine vs. DBS: p=1.45E-67; running vs. DBS: p=3.7E-20. Comparison of genes upregulated by DBS and genes upregulated by either fluoxetine or running. Purple: genes that are increased by the indicated treatment and by DBS in WT mice (FDR < 0.05,>25% fold-change). Gray: genes increased by fluoxetine or running that are not increased by DBS in WT mice. Figure 7—figure supplement 1 compares the genes that overlap with DBS (indicated by the purple slice in the pie chart) from each of the disorders shown in Figure 7A.
Figure 7—figure supplement 1
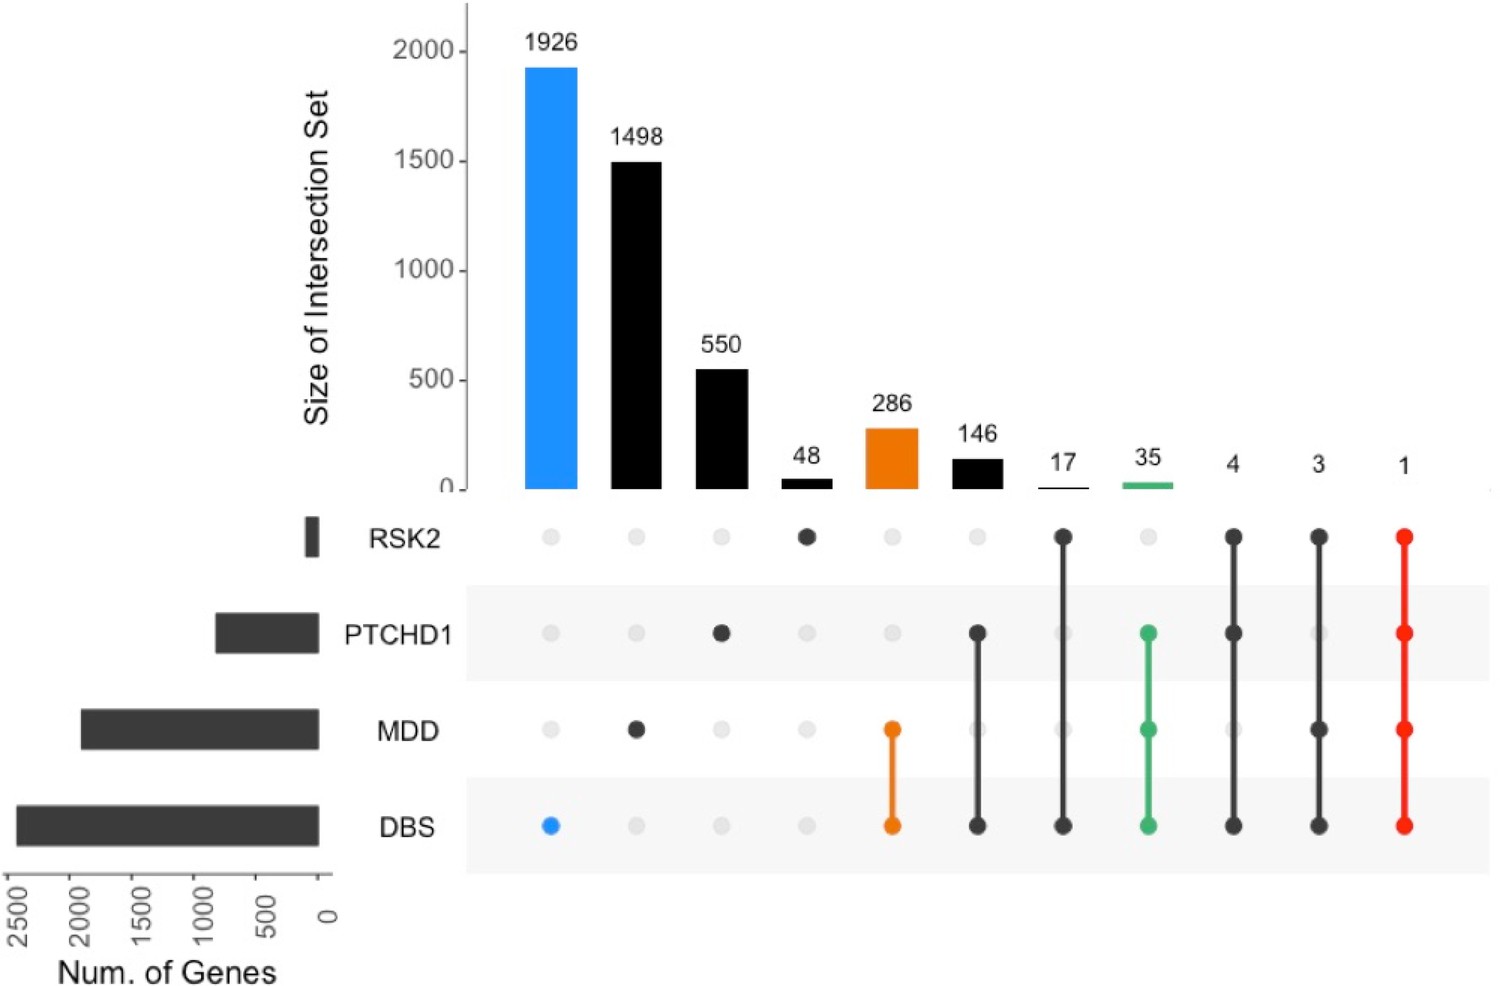
Overlap between the DBS dataset and neurologic disorders.
Overlap of genes downregulated in intellectual disability models and human major depressive disorder (MDD) with those genes found to be significantly upregulated (FDR < 0.05, fold-change >25%) by forniceal DBS in WT mice.
Tables
Key resources table
| Reagent or resource | Source | Identifier |
|---|---|---|
| Critical Commercial Assays | ||
| Aurum Total RNA Fatty and Fibrous Tissue Kit | Bio-Rad | Cat #: 7326830 |
| TruSeq RNA Library Prep Kit v2 | Illumina | RS-122–2001 |
| Quick-DNA Universal Kit | ZymoResearch | Catalog #: D4068 |
| EZ DNA Methylation Lightning Kit | ZymoResearch | Catalog #: D5030 |
| TruSeq DNA Methylation Kit | Illumina | EGMK81312 |
| Deposited Data | ||
| Raw data | This paper | GSE107357, GSE107383 and GSE111703 |
| Analyzed data | This paper | See Source Data files |
| Mouse reference genome GRCm38 (M10) | GENCODE | http://www.gencodegenes.org/mouse_releases/10.html |
| Duric (MDD dataset) | Duric et al. (2013) | GSE24095 |
| Madabhushi (Activity Dependent Genes) | Madabhushi et al. (2015) | GSE61887 |
| Reanalyzed Running Dataset (Neurogenesis) | Miller et al. (2013) | GSE39697 |
| Flavell (Activity Dependent Genes) | Flavell et al. (2008) | GSE13539 |
| Guo (Activity Dependent Genes) | Guo et al. (2011) | GSE30493 |
| Halder (Activity Dependent Genes) | Halder et al. (2016) | GSE74971 |
| Kim (Activity Dependent Genes) | Kim et al. (2010) | GSE21161 |
| Lacar (Activity Dependent Genes) | Lacar et al. (2016) | GSE77067 |
| Lin (Activity Dependent Genes) | Lin et al. (2008) | GSE11261 |
| Xiang (Activity Dependent Genes) | Xiang et al. (2007) | GSE6254 |
| Fluoxetine (Neurogenesis) | Samuels et al. (2014) | GSE43261 |
| Rsk2 KO/Coffin Lowry Syndrome (IDD) | Mehmood et al. (2011) | GSE22137 |
| PTCHD1 KO (IDD) | Ung et al. (2017) | GSE80312 |
| Experimental Models: Organisms/Strains | ||
| Mecp2-null (KO) mouse (B6.129P2(C)-Mecp2tm1.1Bird/J) | Jackson laboratory | Stock number: 003890 RRID:IMSR_JAX:003890 |
| Wild-type FVB males for breeding (FVB/NJ) | Jackson laboratory | Stock number: 001800 RRID:IMSR_JAX:001800 |
| Wild-type 129 males for backcrossing (129S6/SvEvTac) | Taconic | Catalog #: 129SVE-M RRID:IMSR_TAC:129sve |
| Oligonucleotides | ||
| Primers for RT-qPCR | This paper | Supplementary file 1 |
| Recombinant DNA | ||
| Unmethylated cl857 Sam7 Lambda DNA | Promega | D1521 |
| Software and Algorithms | ||
| STAR aligner (v2.4.2a) | Dobin et al. (2013) | https://github.com/alexdobin/STAR/releases/tag/STAR_2.4.2a RRID:SCR_015899 |
| HTSeq (v 0.9.1) | (Anders et al., 2015) | https://htseq.readthedocs.io/en/release_0.9.1/ RRID:SCR_005514 |
| DESeq2 | Love et al. (2014) | https://bioconductor.org/packages/release/bioc/html/DESeq2.html RRID:SCR_015687 |
| ggplot2 | Hadley Wickham. ggplot2: Elegant Graphics for Data Analysis (2010) | https://github.com/tidyverse/ggplot2 RRID:SCR_014601 |
| UpSetR | CRAN Package | https://cran.r-project.org/web/packages/UpSetR/index.html https://doi.org/10.1093/bioinformatics/btx364 RRID:SCR_003005 |
| Limma | Bioconductor Package | http://bioconductor.org/packages/release/bioc/html/limma.html RRID:SCR_010943 |
| pheatmap | CRAN Package | https://cran.r-project.org/web/packages/pheatmap/index.html RRID:SCR_003005 |
| GeneOverlap | (Shen, 2013) | http://bioconductor.org/packages/GeneOverlap/ RRID:SCR_006442 |
| TRANSFAC database | geneXplain | http://genexplain.com/transfac/ RRID:SCR_005620 |
| Kallisto | (Bray et al., 2016) | https://pachterlab.github.io/kallisto/download |
| Sleuth | (Pimentel et al., 2017) | https://github.com/pachterlab/sleuth |
| R Project for Statistical Computing | https://www.r-project.org | RRID:SCR_001905 |
| Population Specific Expression Analysis | (Kuhn et al., 2011) | https://bioconductor.org/packages/release/bioc/html/PSEA.html RRID:SCR_006442 |
| rMATS v3.2.5 | (Shen et al., 2014) | http://rnaseq-mats.sourceforge.net/ |
| Bismark | (Krueger and Andrews, 2011) | http://www.bioinformatics.babraham.ac.uk/projects/bismark/ RRID:SCR_005604 |
| Prism 6 | https://www.graphpad.com/scientific-software/prism/ | RRID:SCR_015807 |
| Tableau Desktop 10.5 | https://www.tableau.com | RRID:SCR_013994 |
| methylKit | (Akalin et al., 2012) | https://bioconductor.org/packages/release/bioc/html/methylKit.html RRID:SCR_005177 |
| deepTools | (Ramírez et al., 2014) | http://deeptools.readthedocs.io/en/latest/index.html |
| IGV | (Thorvaldsdóttir et al., 2013) | http://software.broadinstitute.org/software/igv/ RRID:SCR_011793 |
| webGestalt | (Zhang et al., 2005) | http://www.webgestalt.org/option.php RRID:SCR_006786 |
| EntichmentMap | (Merico et al., 2010) | http://baderlab.org/Software/EnrichmentMap |
| Cytoscape | (Shannon et al., 2003) | http://cytoscape.org/ RRID:SCR_003032 |
| bedGraphToBigWig | ENCODE | https://www.encodeproject.org/software/bedgraphtobigwig/ RRID:SCR_015482 |
Additional files
-
Supplementary file 1
RT-qPCR primers used for validation of gene expression and splicing differences.
- https://doi.org/10.7554/eLife.34031.026
-
Transparent reporting form
- https://doi.org/10.7554/eLife.34031.027
Download links
A two-part list of links to download the article, or parts of the article, in various formats.
Downloads (link to download the article as PDF)
Open citations (links to open the citations from this article in various online reference manager services)
Cite this article (links to download the citations from this article in formats compatible with various reference manager tools)
Forniceal deep brain stimulation induces gene expression and splicing changes that promote neurogenesis and plasticity
eLife 7:e34031.
https://doi.org/10.7554/eLife.34031


