Differential 3’ processing of specific transcripts expands regulatory and protein diversity across neuronal cell types
- The Rockefeller University, United States
- University of Colorado Anschutz Medical Campus, United States
Figures
Figure 1 with 2 supplements
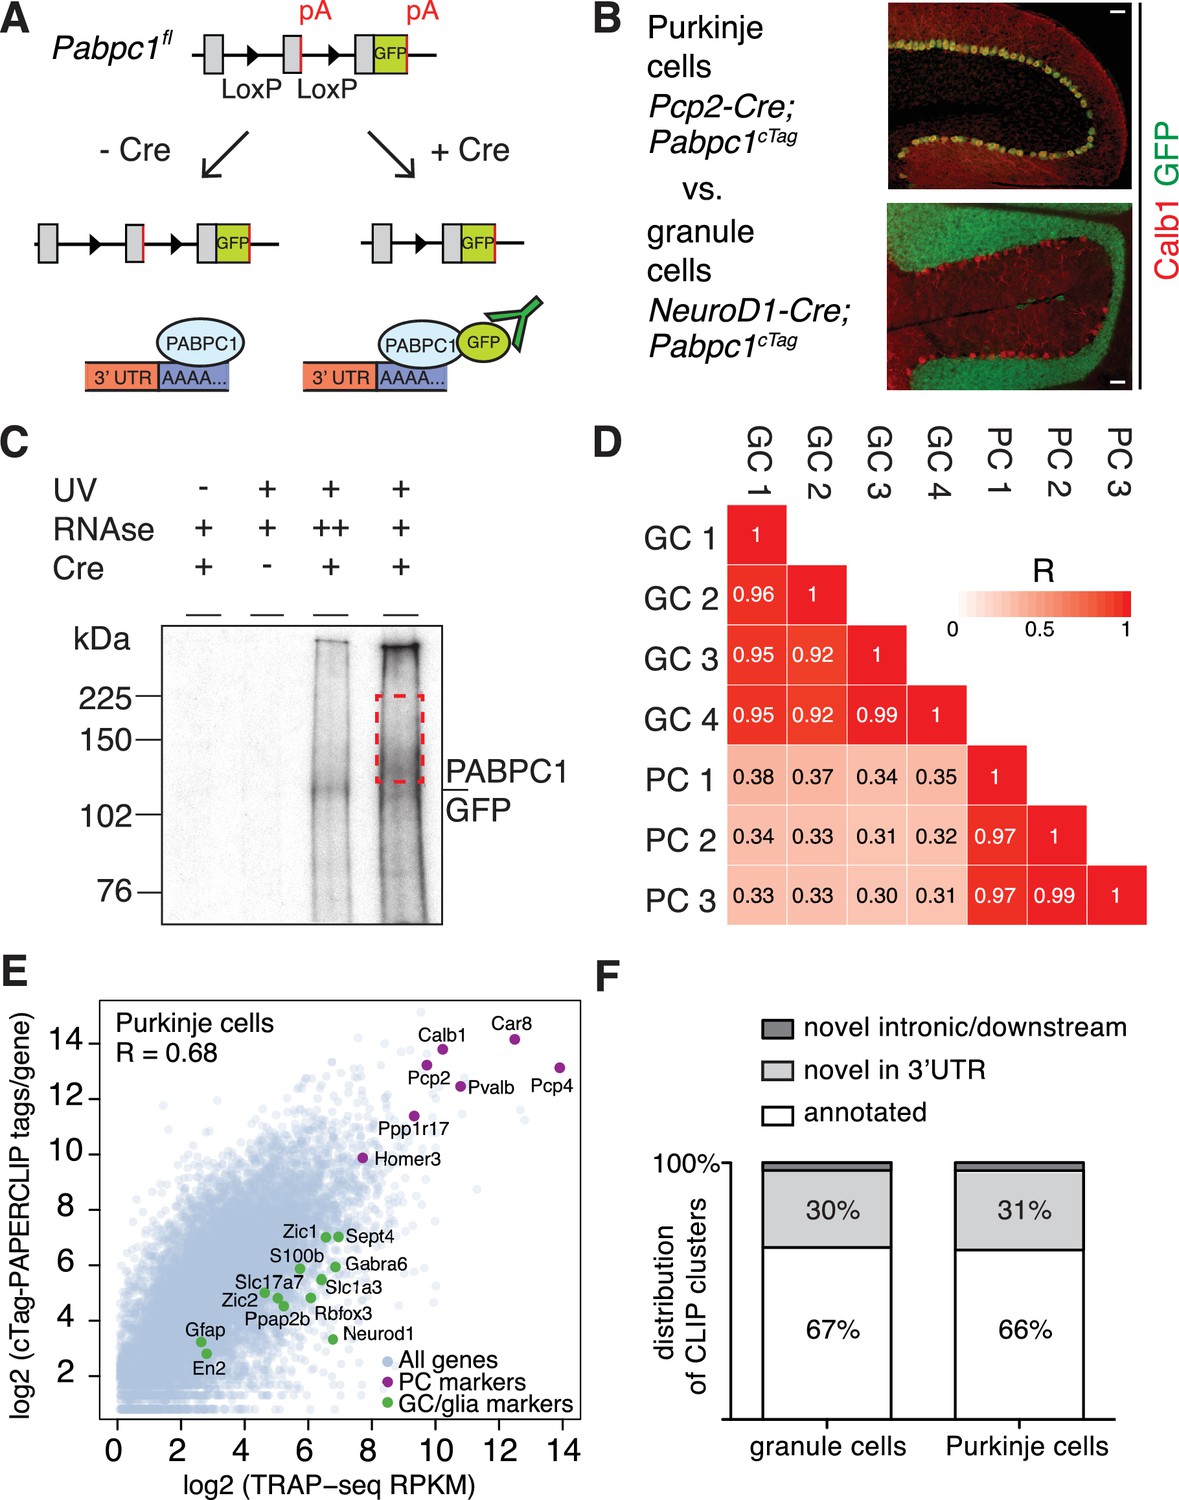
cTag-PAPERCLIP identifies 3’UTR isoforms expressed in specific neuronal types.
(A) Schematic of the cTag-PAPERCLIP approach. Breeding of cTag-PABP mice with Cre-expressing mice restricts expression of PABPC1-GFP to the cells of interest (B) Immunostaining of cerebella from mice expressing PABPC1-GFP in Purkinje cells (top) and granule cells (bottom). Calb1: Purkinje cell marker. Scale bars: 50 μm. (C) Autoradiogram of radiolabelled RNA cross-linked to PABPC1-GFP purified by immunoprecipitation from granule cells. Red dashed rectangle shows the area of the membrane from which RNA was eluted and sequenced. (D) Correlation between the total number of cTag-PAPERCLIP reads per cluster in four biological replicates from granule cells and three biological replicates from Purkinje cells. R: Pearson correlation coefficient. (E) Comparison between total uniquely mapped cTag-PAPERCLIP reads per gene and TRAP-Seq Reads Per Kilobase per Million mapped reads (RPKM) per gene from Purkinje cells. R: Pearson correlation coefficient. Purkinje cell markers are highlighted in purple and non-target cell markers are highlighted in green. (F) Overlap of cTag-PAPERCLIP clusters that contain reads from three biological replicates from Purkinje cells and at least three biological replicates from granule cells with 3’UTR ends of Ensembl-annotated genes (annotated – clusters that overlap with annotated 3’UTR ends, novel – clusters that do not overlap with annotated 3’UTR ends). The data in panels E and F were derived from analysis of four replicates of cTag-PAPERCLIP on granule cells and three replicates of cTag-PAPERCLIP on Purkinje cells.
Figure 1—figure supplement 1
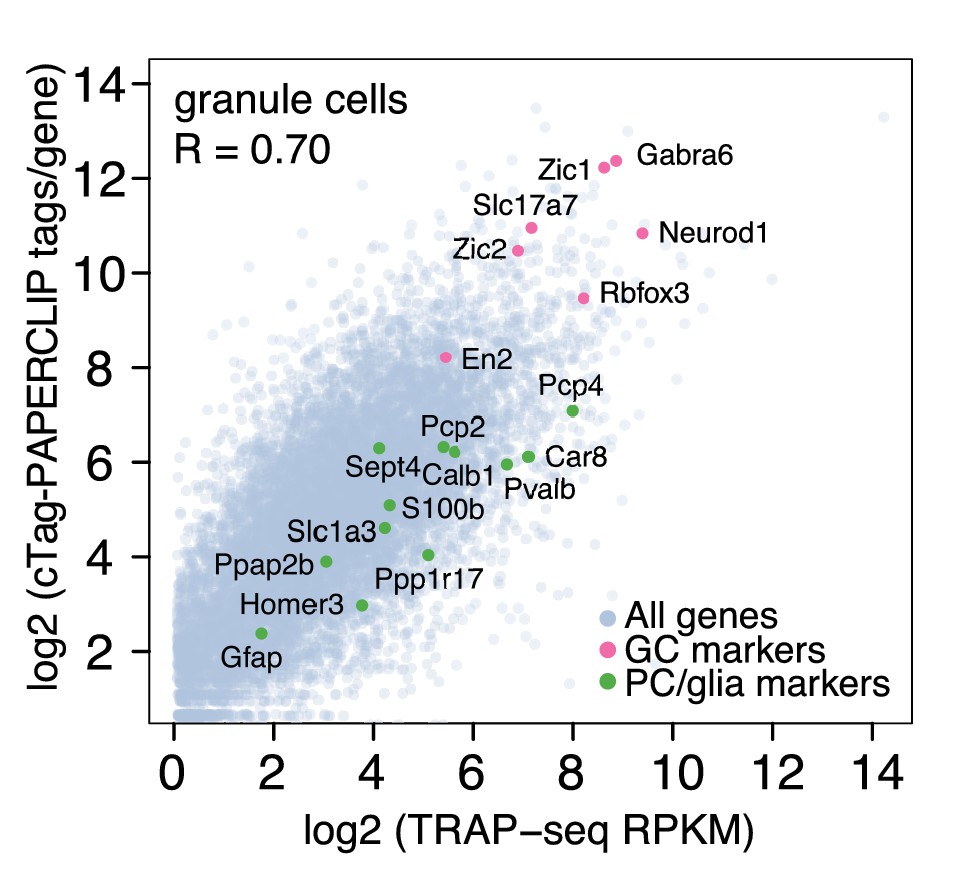
Comparison between total uniquely mapped cTag-PAPERCLIP reads per gene and TRAP-Seq Reads Per Kilobase per Million mapped reads (RPKM) per gene from granule cells.
R: Pearson correlation coefficient. Granule cell markers are highlighted in pink and non-target cell markers are highlighted in green. The data were derived from analysis of three replicates of cTag-PAPERCLIP and four replicates of TRAP-seq.
Figure 1—figure supplement 2
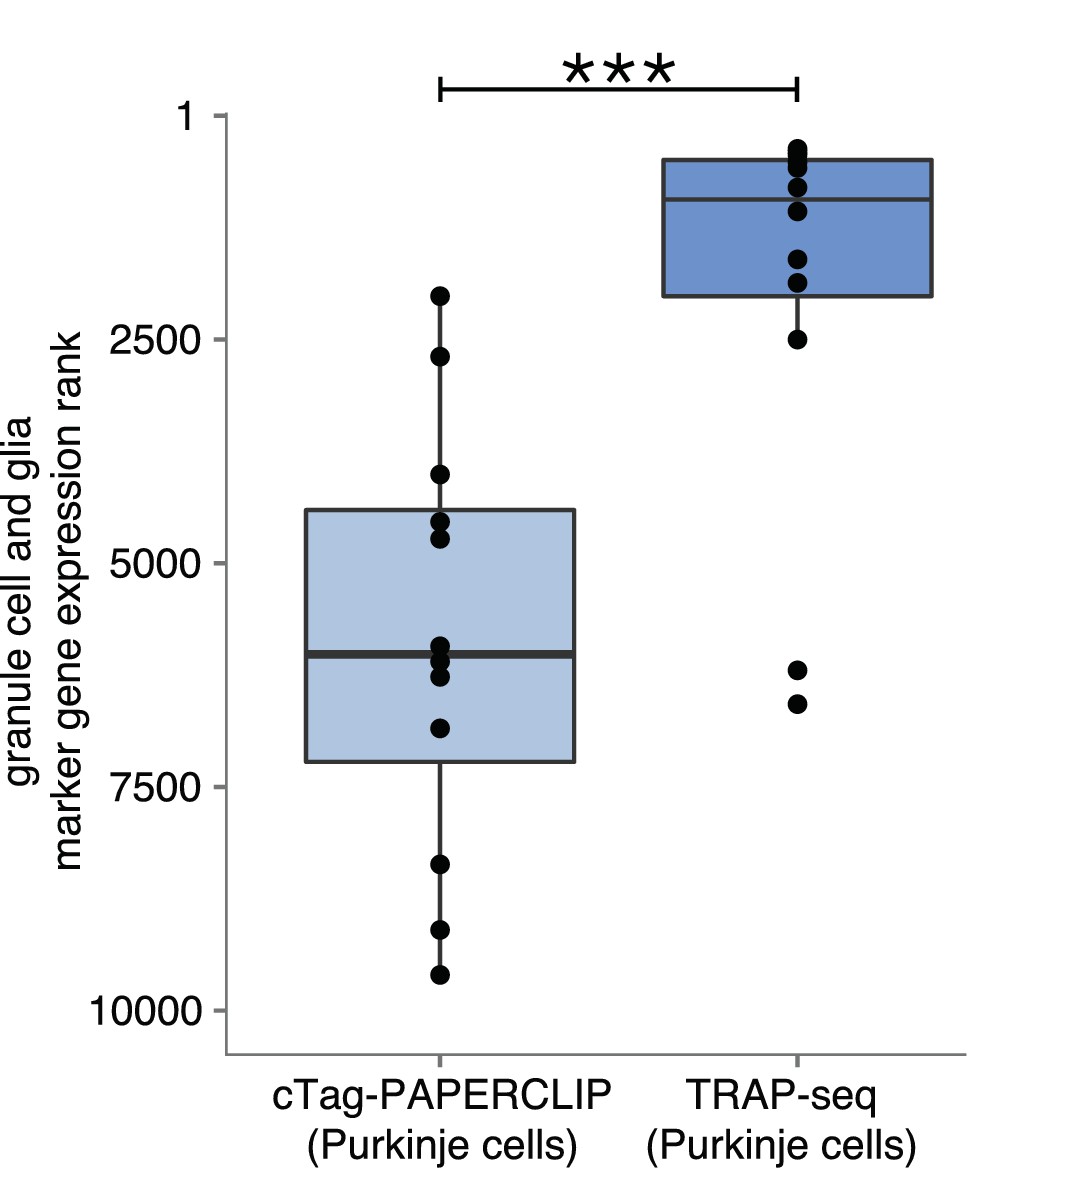
Comparison of marker gene ranks from non-target cell types in cTag-PAPERCLIP data and TRAP-Seq data in Purkinje cells.
We used the markers of granule cells and Bergmann glia shown in green in Figure 1E. Mann-Whitney test. p-value<0.001. The highest expressed gene has a rank of 1.
Figure 2 with 2 supplements
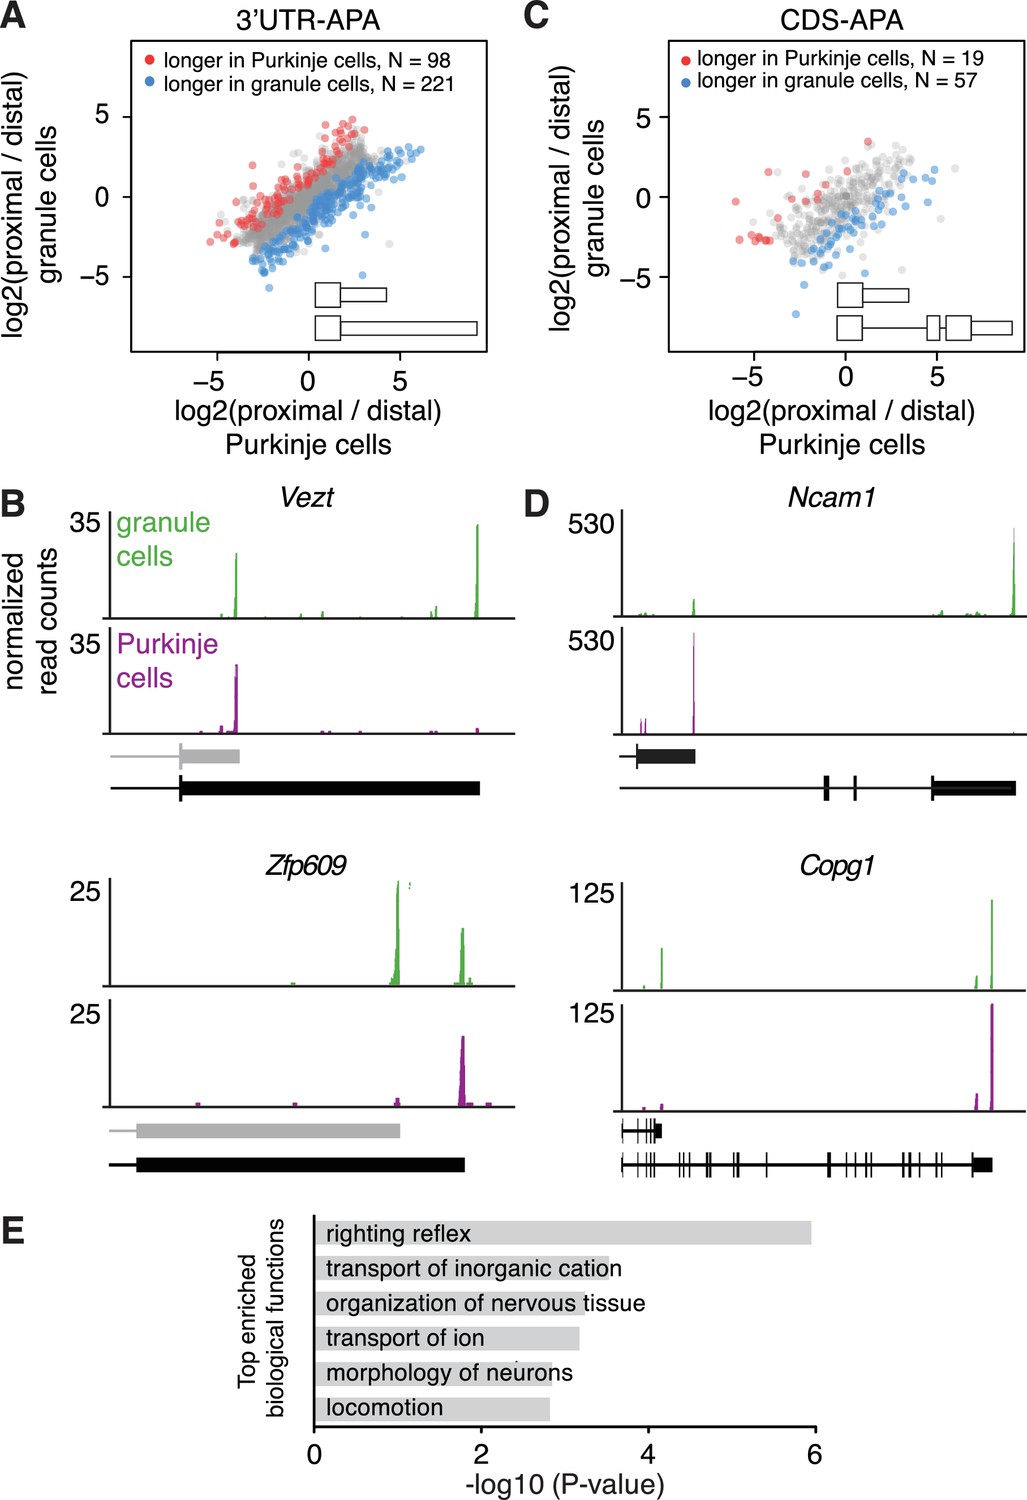
Differences in APA between Purkinje and granule cells.
(A) Scatterplot representing the ratio between the number of cTag-PAPERCLIP reads at the end of the proximal 3’UTR isoform and the number of cTag-PAPERCLIP reads at the end of the distal 3’UTR isoform in Purkinje vs. granule cells. Only genes with two tandem 3’UTR isoforms are shown. Genes showing significantly different ratios (FDR < 0.05) are highlighted in red or blue. (B) Examples of cTag-PAPERCLIP data for genes that show a large difference in 3’UTR-APA between Purkinje and granule cells. Black bars represent isoforms annotated by Ensembl, gray ones are (predicted) novel isoforms discovered by cTag-PAPERCLIP. (C) Scatterplot representing the ratio between the number of cTag-PAPERCLIP reads at the end of the proximal 3’UTR isoform and the number of cTag-PAPERCLIP reads at the end of the distal 3’UTR isoform in Purkinje vs. granule cells. Only genes with two 3’UTR isoforms that differ in CDS-APA are shown. Genes showing significantly different ratios (FDR < 0.05) are highlighted in red or blue. (D) Examples of cTag-PAPERCLIP data for genes that show a large difference in CDS-APA between Purkinje and granule cells. (E) Gene ontology analysis of genes showing significant differences in APA between Purkinje and granule cells. Top six relevant functional categories are shown. The data in all panels were derived from analysis of four replicates of cTag-PAPERCLIP on granule cells and three replicates of cTag-PAPERCLIP on Purkinje cells.
Figure 2—figure supplement 1

TRAP-Seq data for genes shown in Figure 2B and D.
TRAP-Seq data on granule and Purkinje cells from adult mice (the data represents an average of four replicates per cell type) (Mellén et al., 2012).
Figure 2—figure supplement 2

qPCR validation of 3’UTR isoform abundance differences between Purkinje and granule cells.
N = 3 for each time point for qPCR. N = 4 for cTag-PAPERCLIP on granule cells and N = 3 for cTag-PAPERCLIP on Purkinje cells. Log2(fold change) represents log2 of the ratio between the ratios of distal 3’UTR isoform abundance over total mRNA abundance in Purkinje vs. granule cells for 3’UTR-APA genes (Vezt and Ncam1). For CDS-APA genes (Zfp609 and Copg1) the log2(fold change) represents log2 of the ratio between the ratios of distal 3’UTR isoform abundance over proximal 3’UTR isoform abundance in Purkinje vs. granule cells.
Figure 3 with 4 supplements
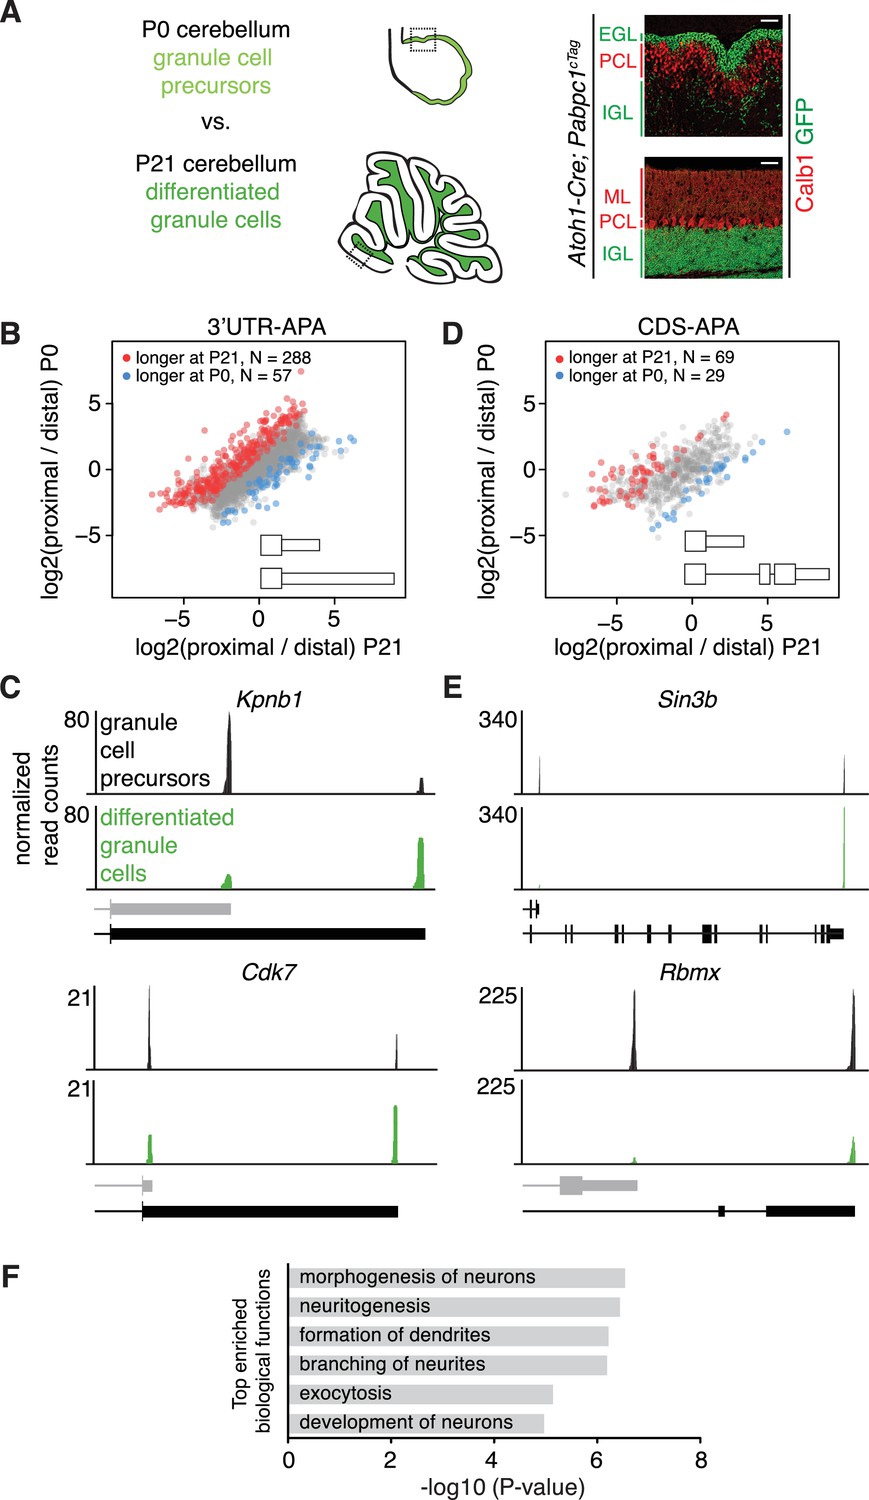
Changes in APA during granule cell development.
(A) Immunostaining showing cell type specific expression of conditionally tagged PABPC1 in P0 and P21 granule cells. EGL – external granule layer, PCL – Purkinje cell layer, IGL – internal granule layer, ML – molecular layer. Calb1: Purkinje cell marker. Scale bars: 50 μm. Dotted square on the schematic of cerebellum at P0 and P21 (left side of the panel) shows the location of the immunostaining on the right. (B) Scatterplot representing the ratio between the number of cTag-PAPERCLIP reads at the end of the proximal 3’UTR isoform and the number of cTag-PAPERCLIP reads at the end of the distal 3’UTR isoform in P0 vs. P21 granule cells. Only genes with two tandem 3’UTR isoforms are shown. Genes showing significantly different ratios (FDR < 0.05) are highlighted in red or blue. (C) Examples of cTag-PAPERCLIP data for genes that show a large difference in 3’UTR-APA between P0 and P21 granule cells. Black bars represent isoforms annotated by Ensembl, gray ones are (predicted) novel isoforms discovered by cTag-PAPERCLIP. (D) Scatterplot representing the ratio between the number of cTag-PAPERCLIP reads at the end of the proximal 3’UTR isoform and the number of cTag-PAPERCLIP reads at the end of the distal 3’UTR isoform in P0 vs. P21 granule cells. Only genes with two 3’UTR isoforms that differ in CDS-APA are shown. Genes showing significantly different ratios (FDR < 0.05) are highlighted in red or blue. (E) Examples of cTag-PAPERCLIP data for genes that show a large difference in CDS-APA between P0 and P21 granule cells. Black bars represent isoforms annotated by Ensembl, gray (predicted) isoform of Rbmx was discovered by cTag-PAPERCLIP. The CDS portion of the last exon in the predicted Rbmx isoform was inferred from an annotated isoform not shown in the picture. (F) Gene ontology analysis of genes showing significant differences in APA between P0 and P21 granule cells. Top six relevant functional categories are shown. The data in panels B-F were derived from three replicates of cTag-PAPERCLIP per time point.
Figure 3—figure supplement 1

The number of cTag-PAPERCLIP reads per gene is correlated with RNA sequencing reads per kilobase (RPK) per gene.
Comparison between cTag-PAPERCLIP data from granule cell precursors at P0 (average of three replicates) and RNA-seq data (average of three replicates) from the same population purified by FACS. R: Pearson correlation coefficient.
Figure 3—figure supplement 2

RNA-seq data for genes shown in Figure 3C and E.
RNA-Seq data on FACS-sorted granule cell precursors (from P0 mice) and differentiated granule cells (from P21 mice). The data represents an average of three replicates per time point.
Figure 3—figure supplement 3
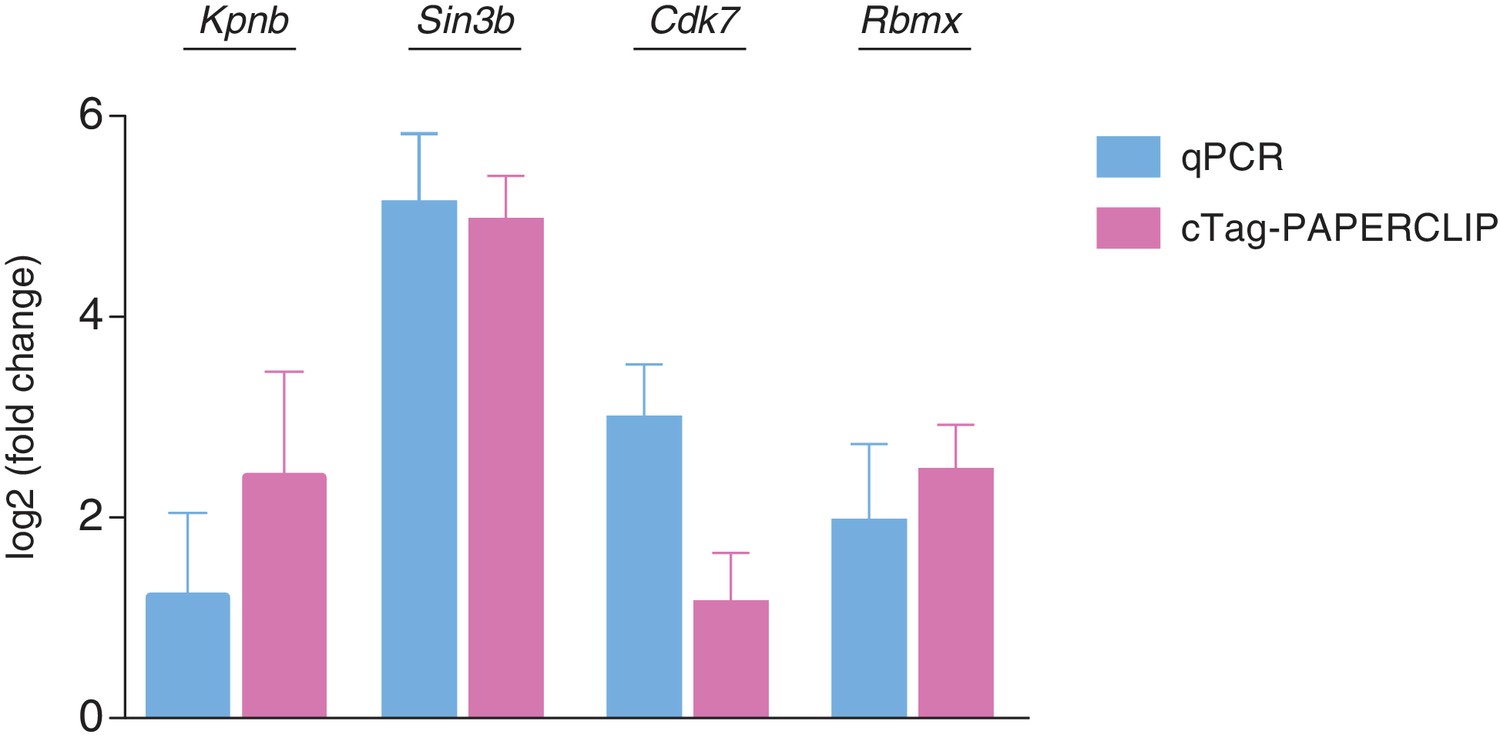
qPCR validation of 3’UTR isoform abundance differences between P0 and P21 granule cells.
N = 3 for each time point for both qPCR and cTag-PAPERCLIP. Log2(fold change) represents log2 of the ratio between the ratios of distal 3’UTR isoform abundance over total mRNA abundance in P21 vs. P0 granule cells for 3’UTR-APA genes (Kpnb and Cdk7). For CDS-APA genes (Sin3b and Rbmx) the log2(fold change) represents log2 of the ratio between the ratios of distal 3’UTR isoform abundance over proximal 3’UTR isoform abundance in P21 vs. P0 granule cells.
Figure 3—figure supplement 4
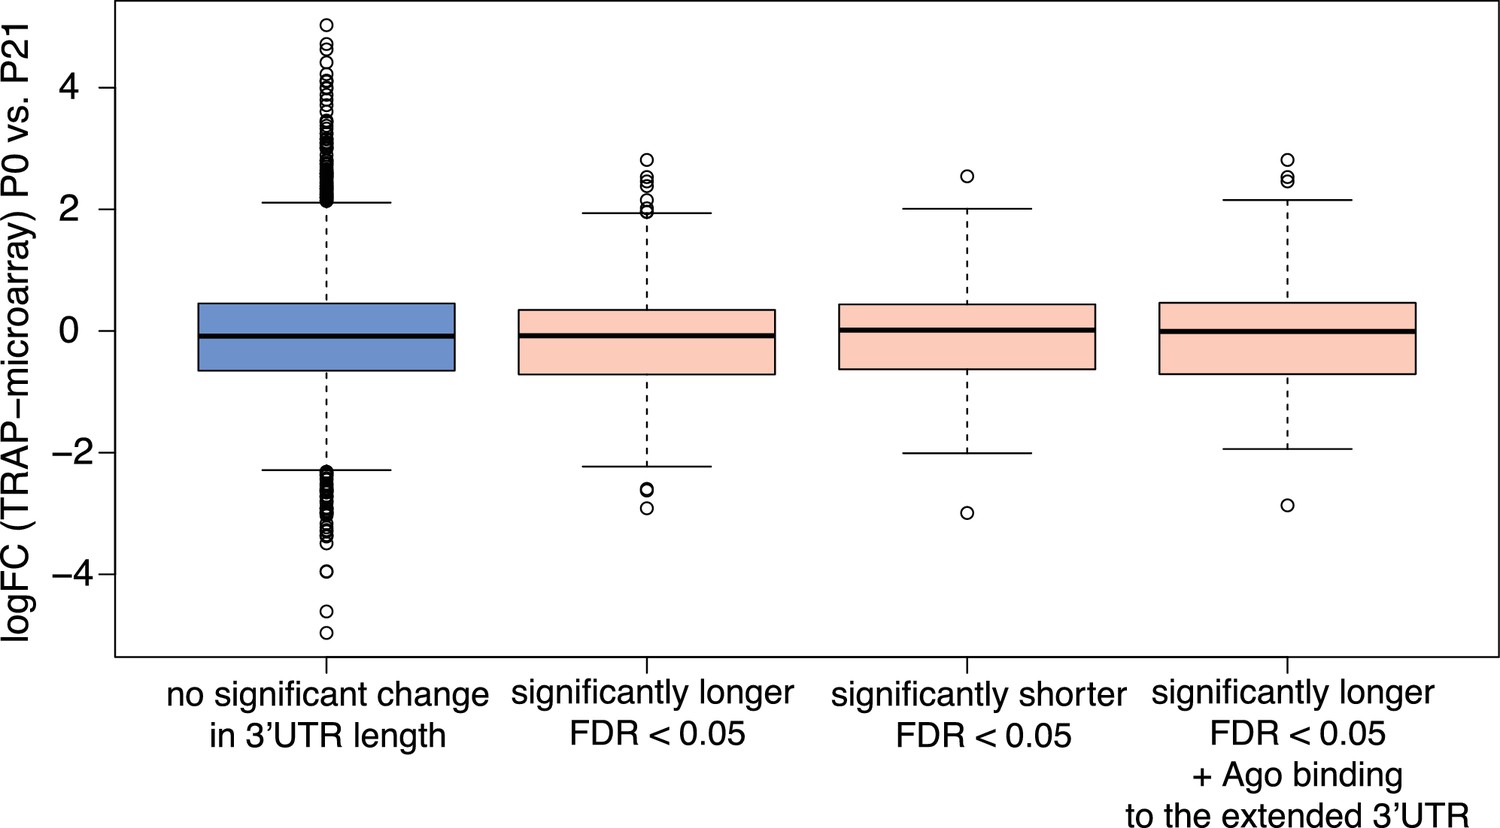
Distribution of log2 fold changes in ribosome-associated mRNA abundance between P0 and P21 cerebellar granule cells for groups of genes exhibiting significant differences in 3’UTR isoform expression during development.
Distribution of log2 fold-changes (logFC) in ribosome-associated mRNA abundance between P0 and P21 for genes with two 3’UTR isoforms that do not show significant changes in 3’UTR isoform expression (non-significant genes) between the two time points (blue box) and those that do (red boxes). Mann-Whitney test. p-value=NS for all comparisons (non-significant genes vs. those that express significantly more of the longer isoform, non-significant genes vs. those that express significantly more of the shorter isoform and non-significant vs. those that express significantly more of the longer isoform and show evidence of Argonaute (Ago) binding to extended 3’UTR portion). LogFC in ribosome-associated mRNA abundance was determined using data from a TRAP microarray study on developing cerebellar granule cells (using data from three replicates per time point) (Zhu et al., 2016). Argonaute CLIP data from Moore et al., 2015. Only 3’UTR-APA genes were used for this analysis.
Figure 4
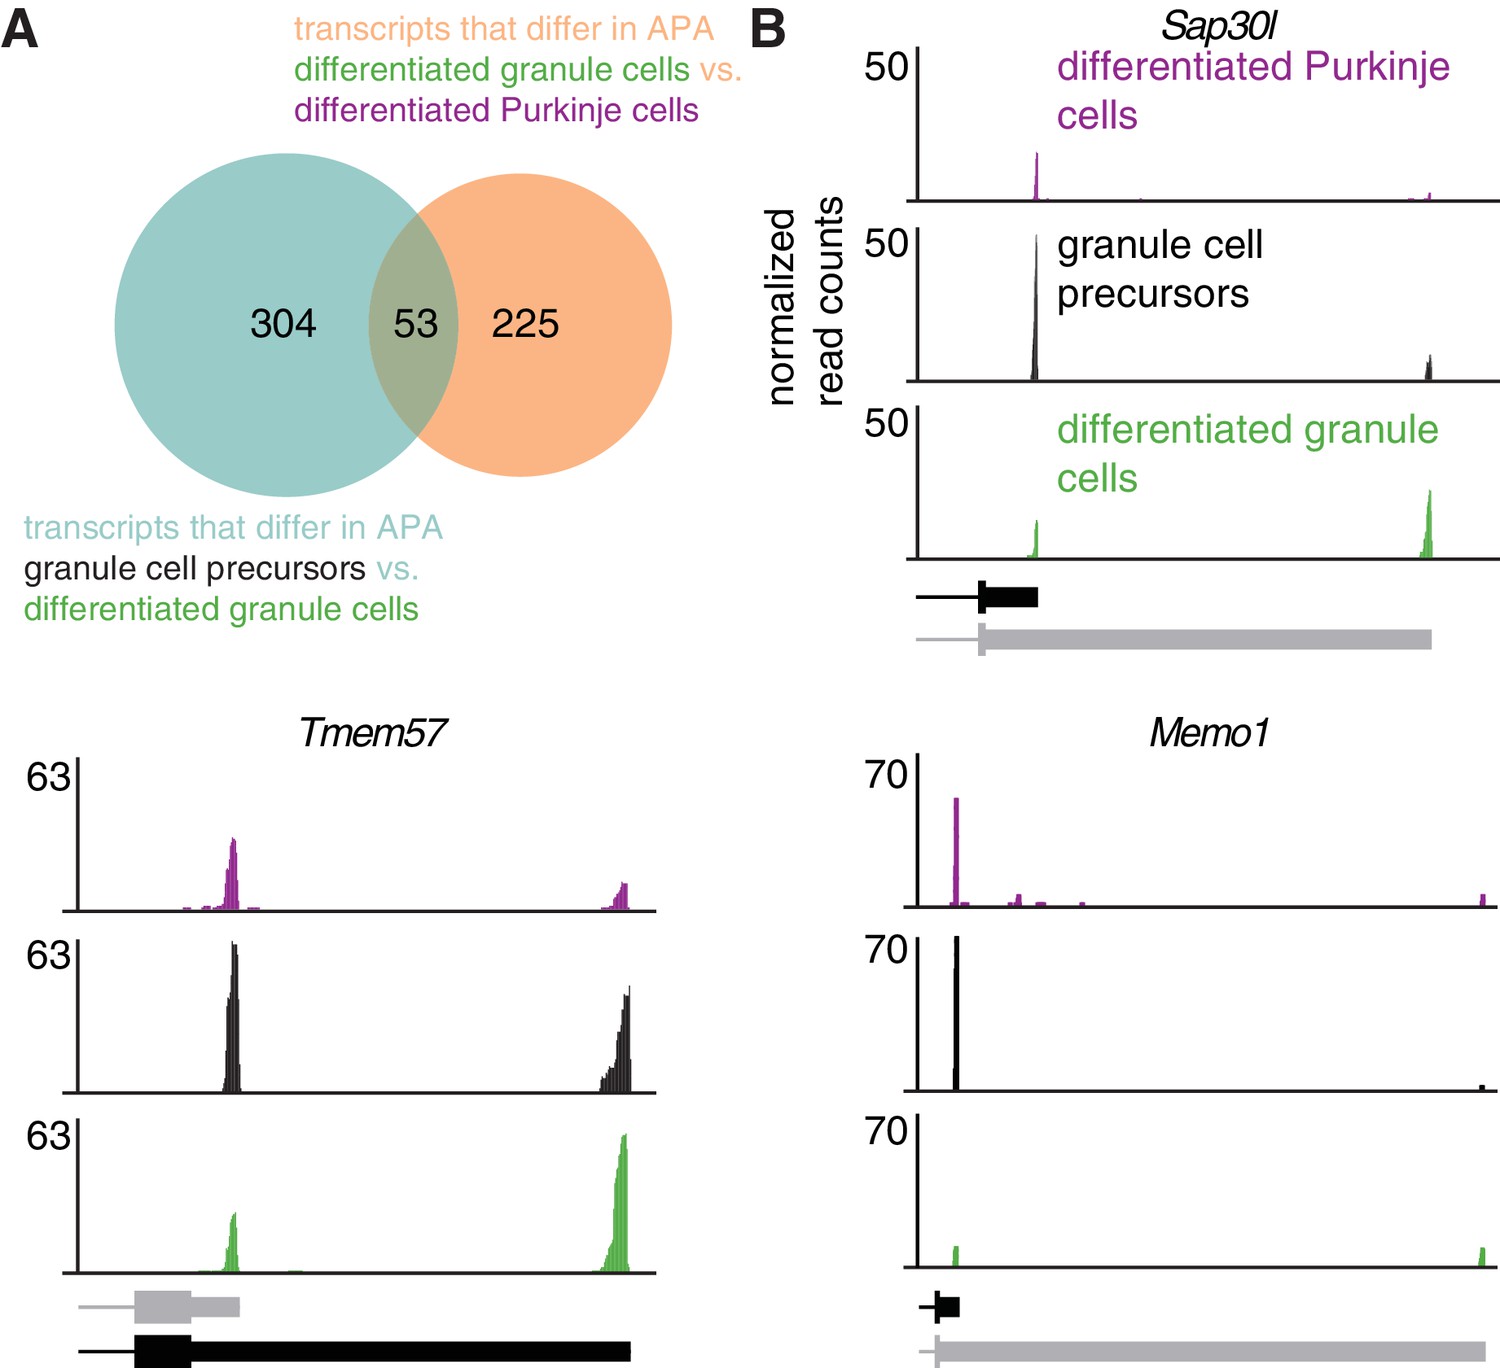
Increase in expression of distal 3’UTR isoforms during development is cell-type specific.
(A) Overlap between genes that exhibit a significant shift towards distal 3’UTR isoform expression during granule cell development (blue circle) and genes that express significantly more of the distal 3’UTR isoforms in granule cells compared to Purkinje cells (orange circle). p=6.85*10−8, hypergeometric test. (B) cTag-PAPERCLIP data for three genes that show a significant shift towards distal 3’UTR isoform expression during granule cell development and a difference in 3’UTR isoform expression between Purkinje and granule cells. Black bars represent isoforms annotated by Ensembl, gray ones are (predicted) novel isoforms discovered by cTag-PAPERCLIP. The data represents an average of three replicates for adult Purkinje cells and granule cell precursors and four replicates for differentiated granule cells.
Figure 5 with 2 supplements
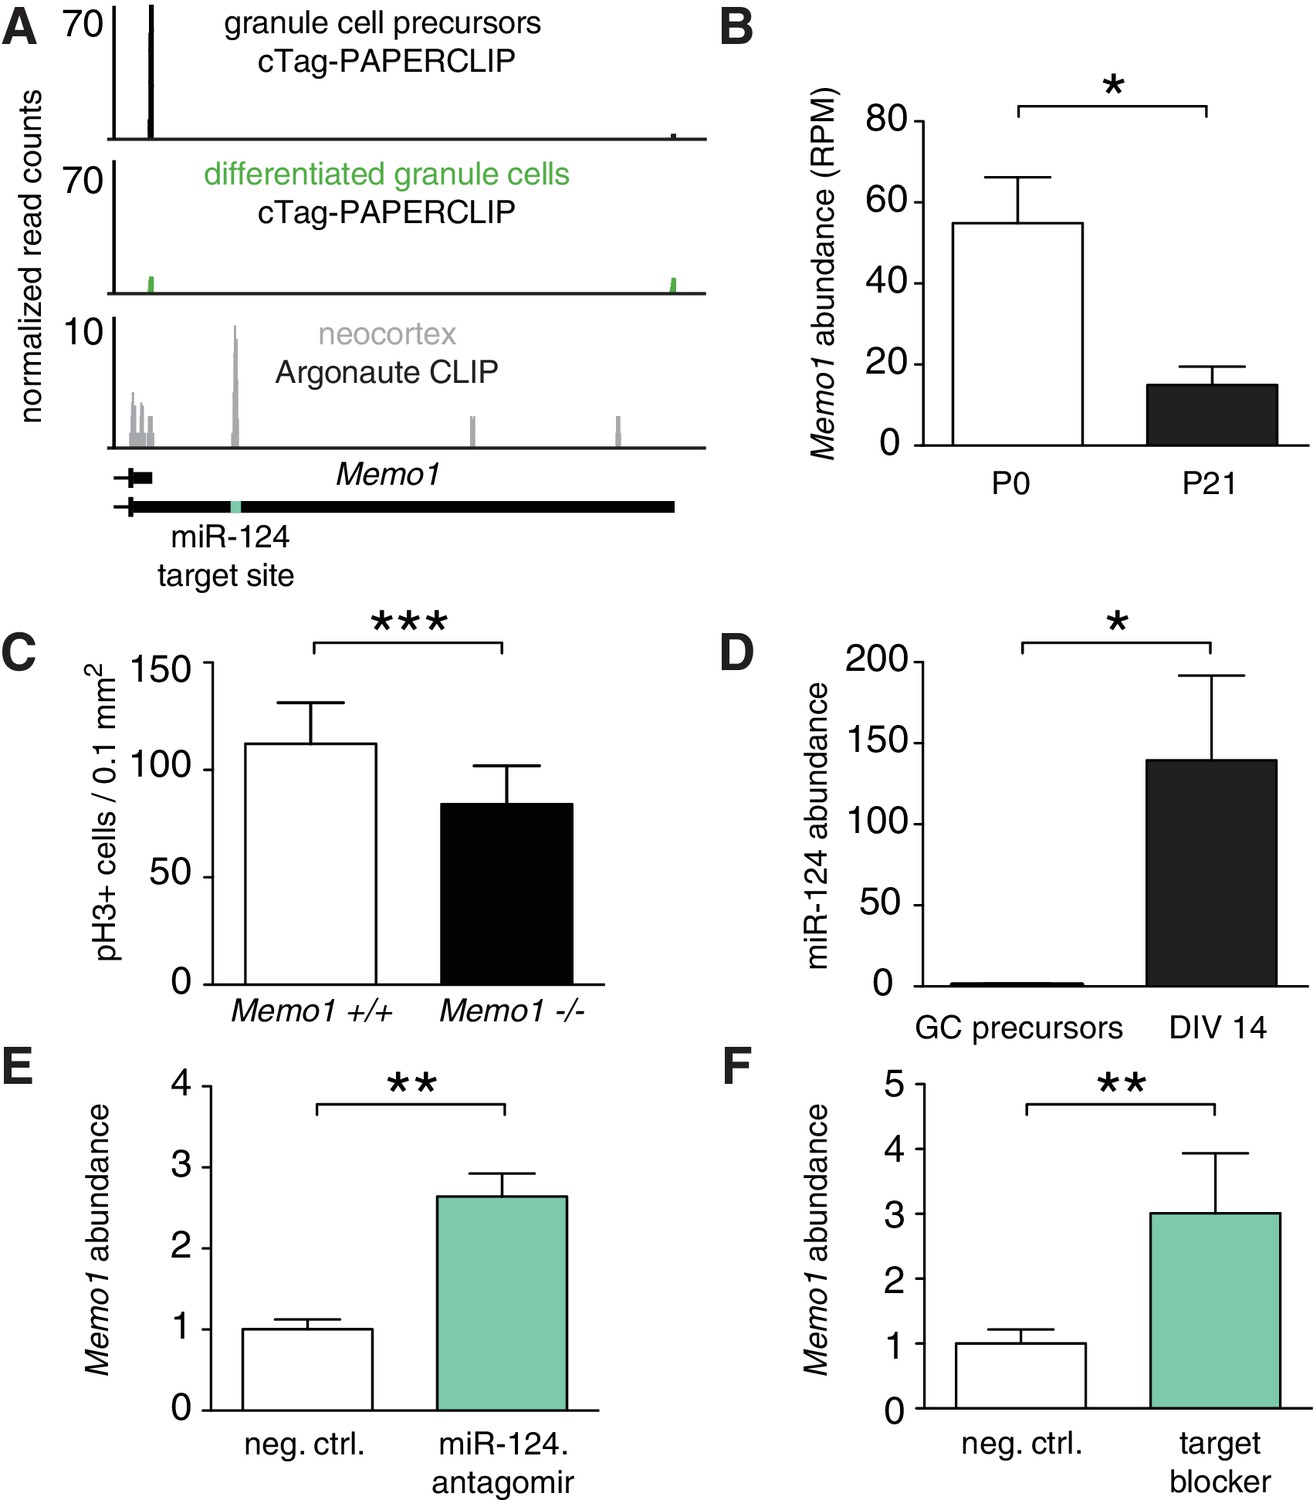
Memo1 expression is developmentally regulated by miR-124 and APA.
(A) cTag-PAPERCLIP reads on Memo1 3’UTR in P0 and P21 granule cells. The location of miR-124 target site is indicated by the green bar. The data represents and average of three cTag-PAPERCLIP replicates and twelve replicates of Argonaute CLIP. (B) Expression of Memo1 gene as determined by cTag-PAPERCLIP. The y-axis represents the number of total unique reads per gene normalized to sequencing depth (RPM – reads per million). Two-tailed t-test. N = 3 for each time point. p-value<0.031 Error bars: standard error. (C) Density of phospho-H3 positive (i.e. mitotic) cells in the external granule layer of E18.5 cerebella of wild-type and Memo1 knockout mice. Two-way ANOVA, N = 3, p-value<0.0001 (see Materials and methods). Error bars: standard error. (D) Relative abundance of miR-124 in purified granule cell precursors (GC precursors), after 14 days in culture (DIV 14, two-tailed t-test, N = 3 for each time point, p-value<0.010). Error bars: standard error. (E) Relative abundance of long Memo1 isoform in cultured primary granule cells after treatment with scrambled control (neg. ctrl.) and miR-124 antagomir. Two tailed t-test. N = 2 for both conditions, p-value<0.003. Error bars: standard error. (F) Relative abundance of long Memo1 isoform in cultured primary granule cells after treatment with scrambled control (neg. ctrl.) and Memo1 miR-124 target site blocker oligonucleotide (target blocker). Two tailed t-test. N = 3 for both conditions. p-value<0.006. Error bars: standard error.
Figure 5—figure supplement 1
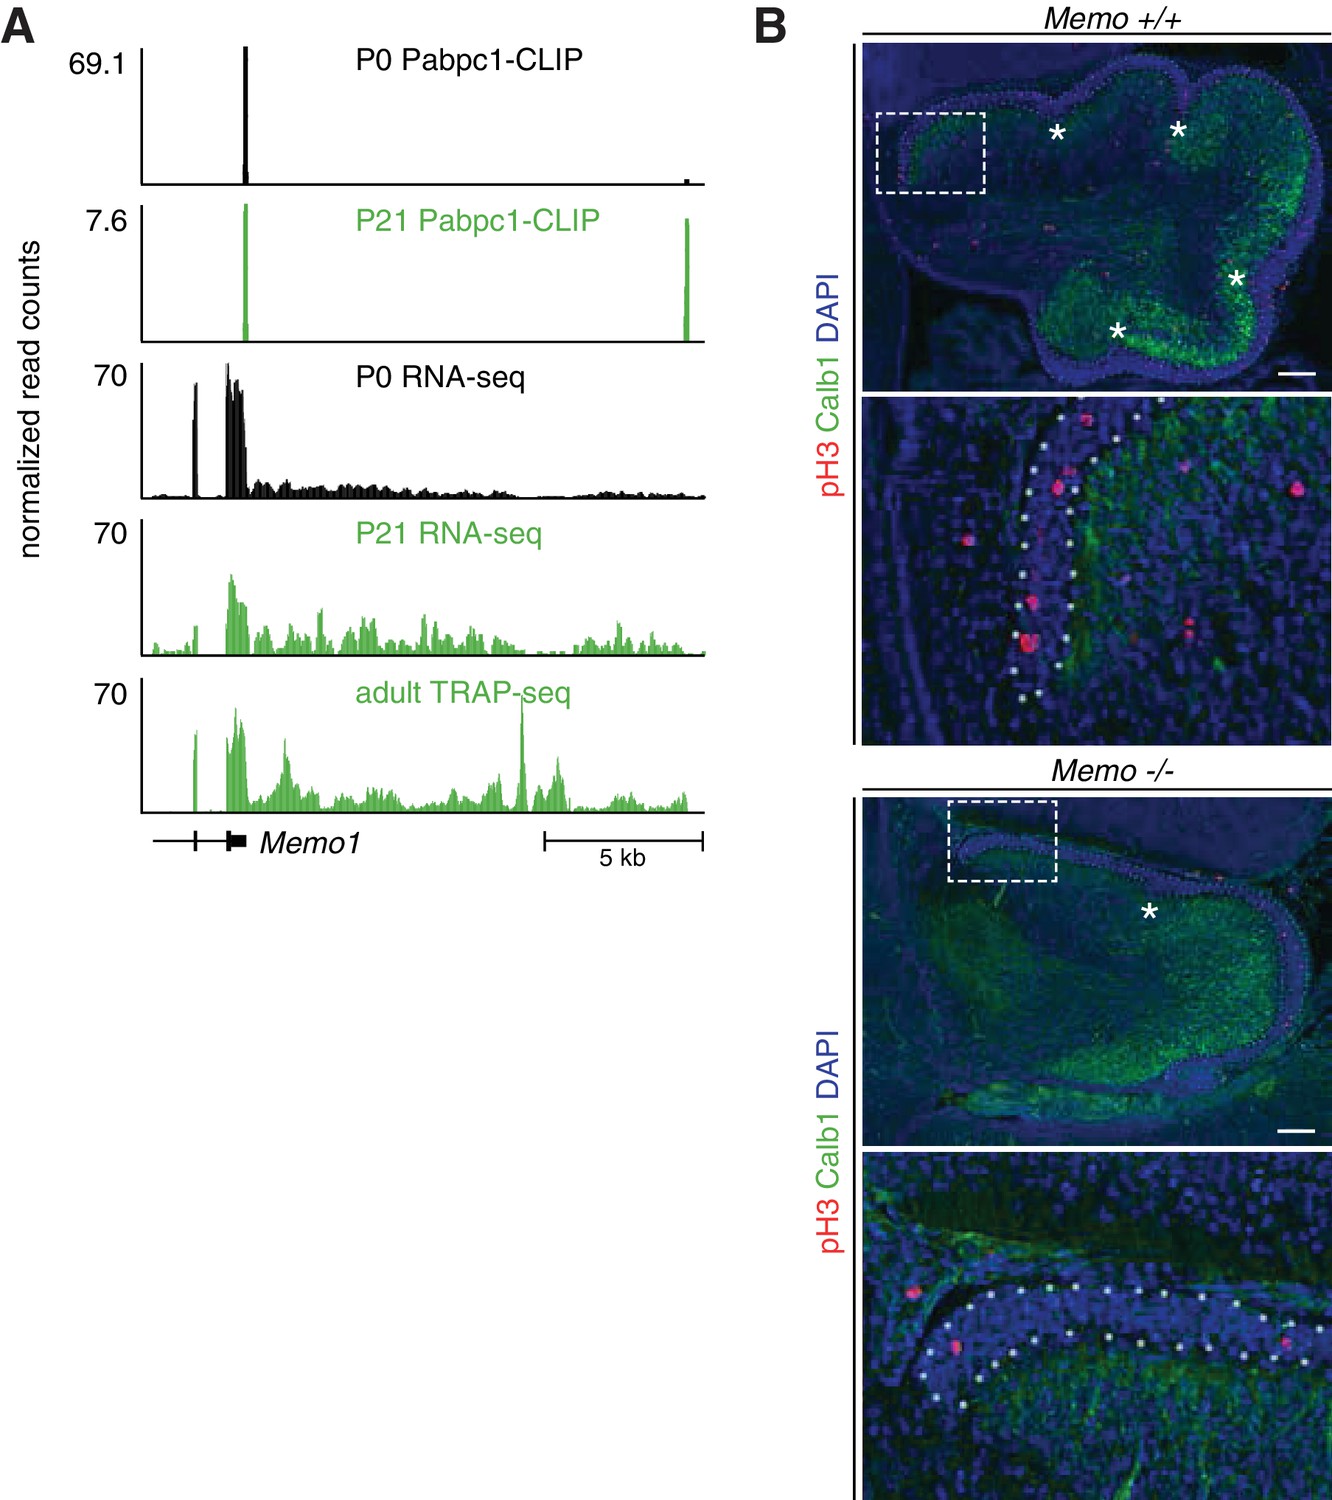
Memo1 changes APA during granule cell development and regulates granule cell precursor proliferation.
(A) Additional data showing Memo1 APA change during granule cell development. The first two tracks from above represent cTag-PAPERCLIP data from P0 and P21 granule cells. The tracks below cTag-PAPERCLIP represent RNA-sequencing data from FACS sorted P0 and P21 granule cells and TRAP-Seq data from mature granule cells (Mellén et al., 2012). In the lower left corner, Ensembl annotation for Memo1 is shown. The data represents and average of three replicates for cTag-PAPERCLIP and RNA-seq data and four replicates for TRAP-seq data. (B) Immunofluorescence of Memo1 +/+ and -/- mouse cerebella at E18.5. Purkinje cell layer was stained with anti-Calb1 antibody (to visualize the border between external granule layer and developing Purkinje cell layer) and anti-phospho-H3 antibody was used to stain all cells undergoing mitosis. In the first picture for each genotype, external granule layer is marked with a white dotted line and white asterisks denote developing fissures. The second picture for each genotype is a close-up marked with white rectangle in the first picture. Scale bars: 50 μm.
Figure 5—figure supplement 2
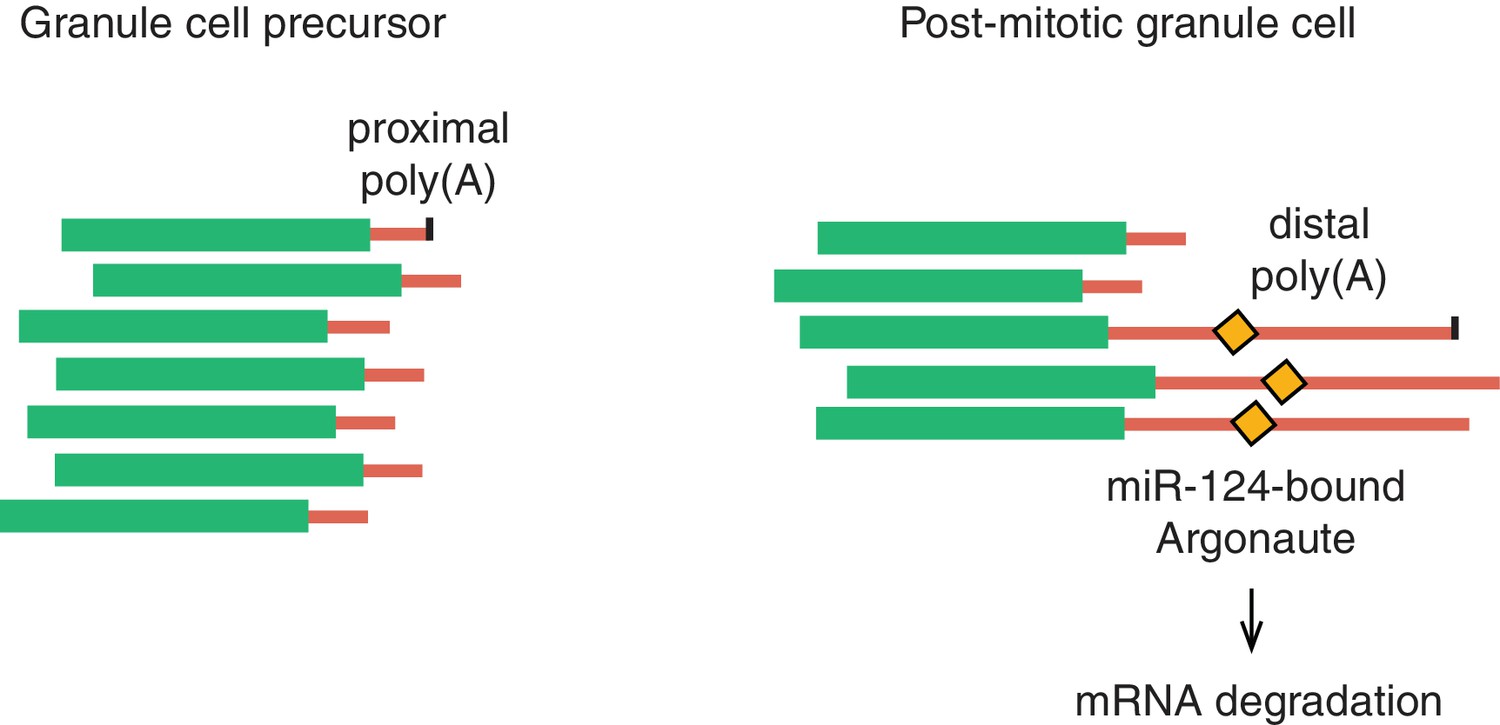
A model for Memo1 post-transcriptional regulation during development.
In the model, Memo1 acquires a longer 3’UTR during granule cell development, which subsequently leads to its downregulation due to the presence of a conserved miR-124 binding site on the long 3’UTR.
Author response image 1
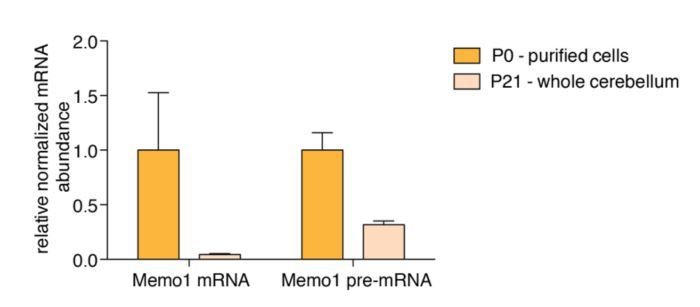
Memo1 mature mRNA and pre-mRNA expression.
RT-qPCR data showing relative abundance of Memo1 mature mRNA and pre-mRNA in purified granule cells from P0 cerebella and whole P21 cerebella.N=3, Error bars: SEM. Memo1 mRNA and pre-mRNA fold changes between the two conditions (P0 and P21) are 23.8 and 3.2 fold, respectively. P-value for difference in log2(FC P0/P21) = 0.0292.
Tables
Key resources table
| Reagent type (species) or resource | Designation | Source or reference | Identifiers | Additional information |
|---|---|---|---|---|
| Gene (Mus musculus) | Memo1 | NA | Entrez gene ID: 76890, Memo1 short isoform RefSeq ID: NM_133771.2 | |
| Genetic reagent (M. musculus) | Neurod1-Cre | The Jackson Laboratory | 028364 | |
| Genetic reagent (M. musculus) | Pcp2-Cre | The Jackson Laboratory | 004146 | |
| Genetic reagent (M. musculus) | Atoh1-Cre | The Jackson Laboratory | 011104 | |
| Genetic reagent (M. musculus) | Pabpc1-cTag | Hwang et al. (2017) | PMID: 28910620 | |
| Genetic reagent (M. musculus) | (Tg(Neurod1-Egfp-L10a) | Heiman et al. (2008) | PMID: 19013281 | |
| Genetic reagent (M. musculus) | (Tg(Pcp2-Egfp-L10a) | Heiman et al. (2008) | PMID: 19013281 | |
| Genetic reagent (M. musculus) | Memo1 knockout | Van Otterloo et al., 2016 | PMID: 26746790 | Memo1 ki/ki |
| Antibody | anti-GFP (for cTag-PAPERCLIP) | Heiman et al. (2008) | 19F7 and 19C8 | mouse monoclonal |
| Antibody | anti-Calb1 | Santa Cruz | sc-7691 | goat polyclonal, (1:250) |
| Antibody | anti-GFP (for IF) | Aves Labs | GFP-1020 | chicken polyclonal, (1:1000) |
| Antibody | anti-pH3 | Cell Signaling | 9701 | rabbit polyclonal, (1:100) |
| Antibody | Alexa 488, 555 and 647 secondaries | Thermo Fisher | (1:1000) | |
| Sequence-based reagent | miR-124 antagomir | Exiqon | 4102200–121 | mmu-miR-124–3 p inhibitor 3`-fluorescein labeled, (50 nM) |
| Sequence-based reagent | antagomir negative control | Exiqon | 199006–100 | Negative control A, (50 nM) |
| Sequence-based reagent | Memo1 miR-124 target blocker | Exiqon | 1999993 | Custom miRCURY LNA Power Inhibitor, (50 nM) |
| Sequence-based reagent | target blocker negative control | Exiqon | 199006–111 | Negative control A, (50 nM) |
| Commercial assay or kit | TruSeq RNA Library Prep Kit | Illumina | RS-122–2002 | For preparing RNA-seq libraries |
-
All primers are listed in Supplementary file 7.
Additional files
-
Source Code 1
Supplementary file 4 - source code 1.
Source code to identify genes that exhibit significantly different 3’UTR isoform expression between granule cell precursors and mature granule cells
- https://doi.org/10.7554/eLife.34042.017
-
Supplementary file 1
Genes differing in 3’UTR isoform expression between Purkinje and granule cells
- https://doi.org/10.7554/eLife.34042.018
-
Supplementary file 2
Genes differing in CDS length between Purkinje and granule cells
- https://doi.org/10.7554/eLife.34042.019
-
Supplementary file 3
Functional gene categories enriched among genes that differ in 3’UTR isoform expression between Purkinje and granule cells
- https://doi.org/10.7554/eLife.34042.020
-
Supplementary file 4
Genes differing in 3’UTR isoform expression between granule cell precursors and mature granule cells
- https://doi.org/10.7554/eLife.34042.021
-
Supplementary file 5
Genes differing in CDS length between granule cell precursors and mature granule cells
- https://doi.org/10.7554/eLife.34042.022
-
Supplementary file 6
Functional gene categories enriched among genes that differ in 3’UTR isoform expression between Purkinje and granule cells
- https://doi.org/10.7554/eLife.34042.023
-
Supplementary file 7
List of PCR primers used in the study
- https://doi.org/10.7554/eLife.34042.024
-
Supplementary file 8
Transcripts that express more of the longer 3’UTR isoform in granule cells and are downregulated compared to Purkinje cells
- https://doi.org/10.7554/eLife.34042.025
-
Transparent reporting form
- https://doi.org/10.7554/eLife.34042.026
Download links
A two-part list of links to download the article, or parts of the article, in various formats.
Downloads (link to download the article as PDF)
Open citations (links to open the citations from this article in various online reference manager services)
Cite this article (links to download the citations from this article in formats compatible with various reference manager tools)
Differential 3’ processing of specific transcripts expands regulatory and protein diversity across neuronal cell types
eLife 7:e34042.
https://doi.org/10.7554/eLife.34042


