Computational prediction of CTCF/cohesin-based intra-TAD loops that insulate chromatin contacts and gene expression in mouse liver
- Boston University, United States
Figures
Figure 1 with 2 supplements
Features of TAD boundaries and TAD insulator function.
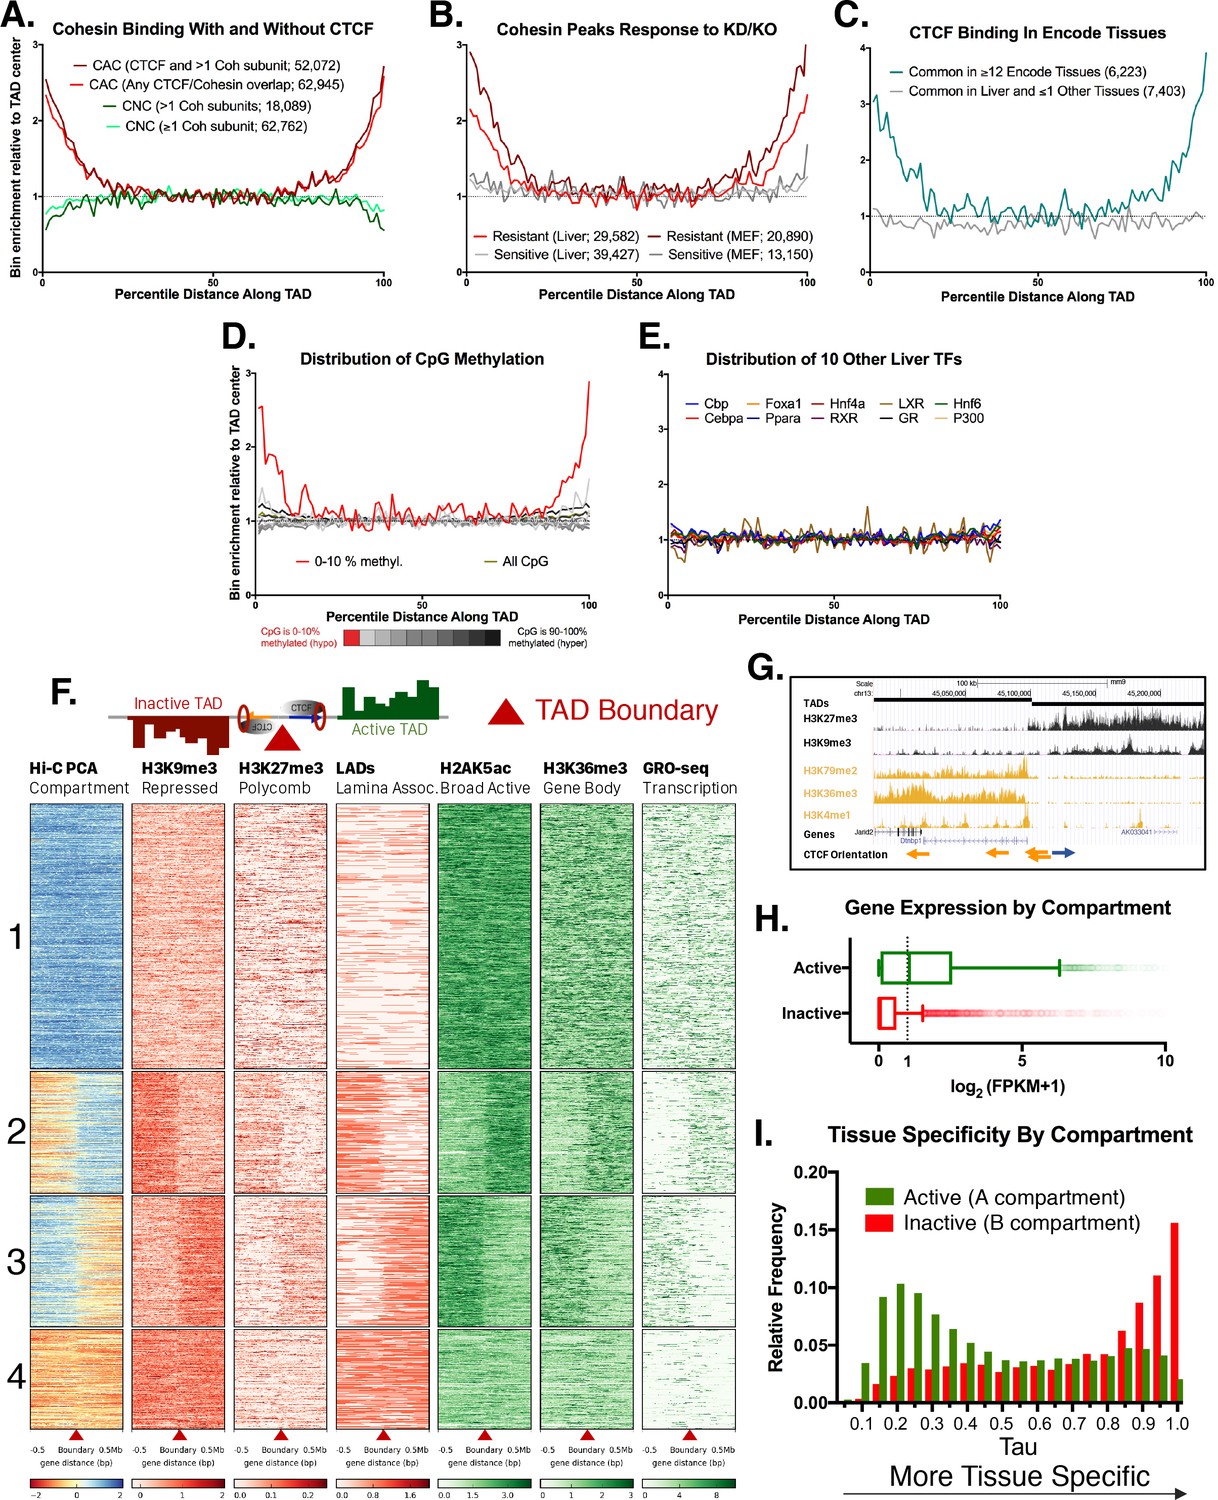
Profiles in A-E represent a normalized aggregate count of peaks or features along the length of all TADs, sub-divided into 100 equally-sized bins per TAD, where bin #1 is the 5’ start of the TAD and bin #100 is at the TAD 3’ end. Normalization was performed to allow comparison of multiple groups with variable peak numbers in a single figure. The y-axis displays the enrichment within a given bin versus the average of the five center bins (bins #48–52). In A-C, the number of binding sites in each group is shown in parenthesis. (A) Cohesin-and-CTCF (CAC) sites are enriched at TAD boundaries, while cohesin-non-CTCF (CNC) sites are weakly depleted. As the cohesin (Coh) complex is a multi-protein complex, the darker color within each group represents a stricter overlap between cohesin subunits (Rad21, Stag1 and Stag2). (B) In both mouse liver and MEFs, cohesin binding sites that are resistant to knockdown (KD) or knockout (KO) of cohesin component subunits (~40% of cohesin binding sites for liver) are strongly enriched for TAD boundaries. Cohesin sites that are sensitive to loss following KD or KO (~60% of sites for liver) are not enriched at TAD boundaries. (C) CTCF binding sites in liver that are deeply-shared across other ENCODE tissues (≥12 out of 15 other tissues examined) are strongly enriched at liver TAD boundaries, while those that are either unique to liver or shared in only one other tissue are not enriched at TAD boundaries. (D) TAD boundaries show greater hypomethylation than the TAD interior. The most hypomethylated CpGs are enriched at TAD boundaries, which likely represents a combination of hypomethylation at gene promoters and hypomethylation at CTCF binding sites. CpG methylation states, determined by liver whole genome bisulfite sequence analysis were subdivided into 10 bins based on the degree of methylation (0–10% methylated, 10–20%, etc.) prior to TAD distribution analysis. (E) 10 liver-expressed TFs are not enriched at TAD boundaries. These profiles are representative of the vast majority of the >50 publically available ChIP peak lists for liver-expressed TFs. Notable exceptions, related to promoter-associated features, marks, and transcription factors, are shown in Figure 1—figure supplement 1B,D. (F) Shown is a heat map of the distribution of the indicated activating and repressive marks and other features determined for male mouse liver across a 1 Mb window around each TAD boundary. TAD clusters, numbered at the left, were defined using k means clustering (k = 4). The boundaries between TADs transition from active to inactive chromatin compartments (or vice versa) for TAD clusters 2 and 3. In downstream analyses based on these results, a TAD was considered active if the boundary at the start of a TAD fell into clusters 1 or 2 and the boundary at the end of the same TAD fell into clusters 1 or 3; inactive TADs are those whose boundaries begin in clusters 3 or 4 and end in clusters 2 or 4 (see Materials and methods). See Supplementary file 1A for a full listing of the 3538 autosomal TADs analyzed and their active/inactive status. (G) UCSC browser screenshot for a transitional TAD boundary on chromosome 13 from TAD cluster 3 in Figure 1F. Arrows at bottom indicate CTCF motif orientation. (H) Box plots showing liver gene expression (RNA-seq) for 12,258 genes in 1930 active TADs and 4643 genes in 1000 inactive TADs (Supplementary file 1A). 939 genes in 473 of the inactive TADs are expressed at >1 FPKM (Supplementary file 1E). Genes found in active compartment TADs are more highly expressed, with the majority of genes showing >1 FPKM, than genes found in inactive TAD compartments. Genes in weakly active and weakly inactive TADs were excluded from these analyses. (I) Genes whose TSS are located in inactive TADs (‘B compartments’) are more tissue specific in their expression pattern than genes found in active TADs (‘A compartments’). The top GO category for expressed genes in the A compartment is RNA binding, while the top category for expressed genes in the B compartment is monooxygenase activity (not shown).
Figure 1—figure supplement 1
Additional Features of TAD boundaries.
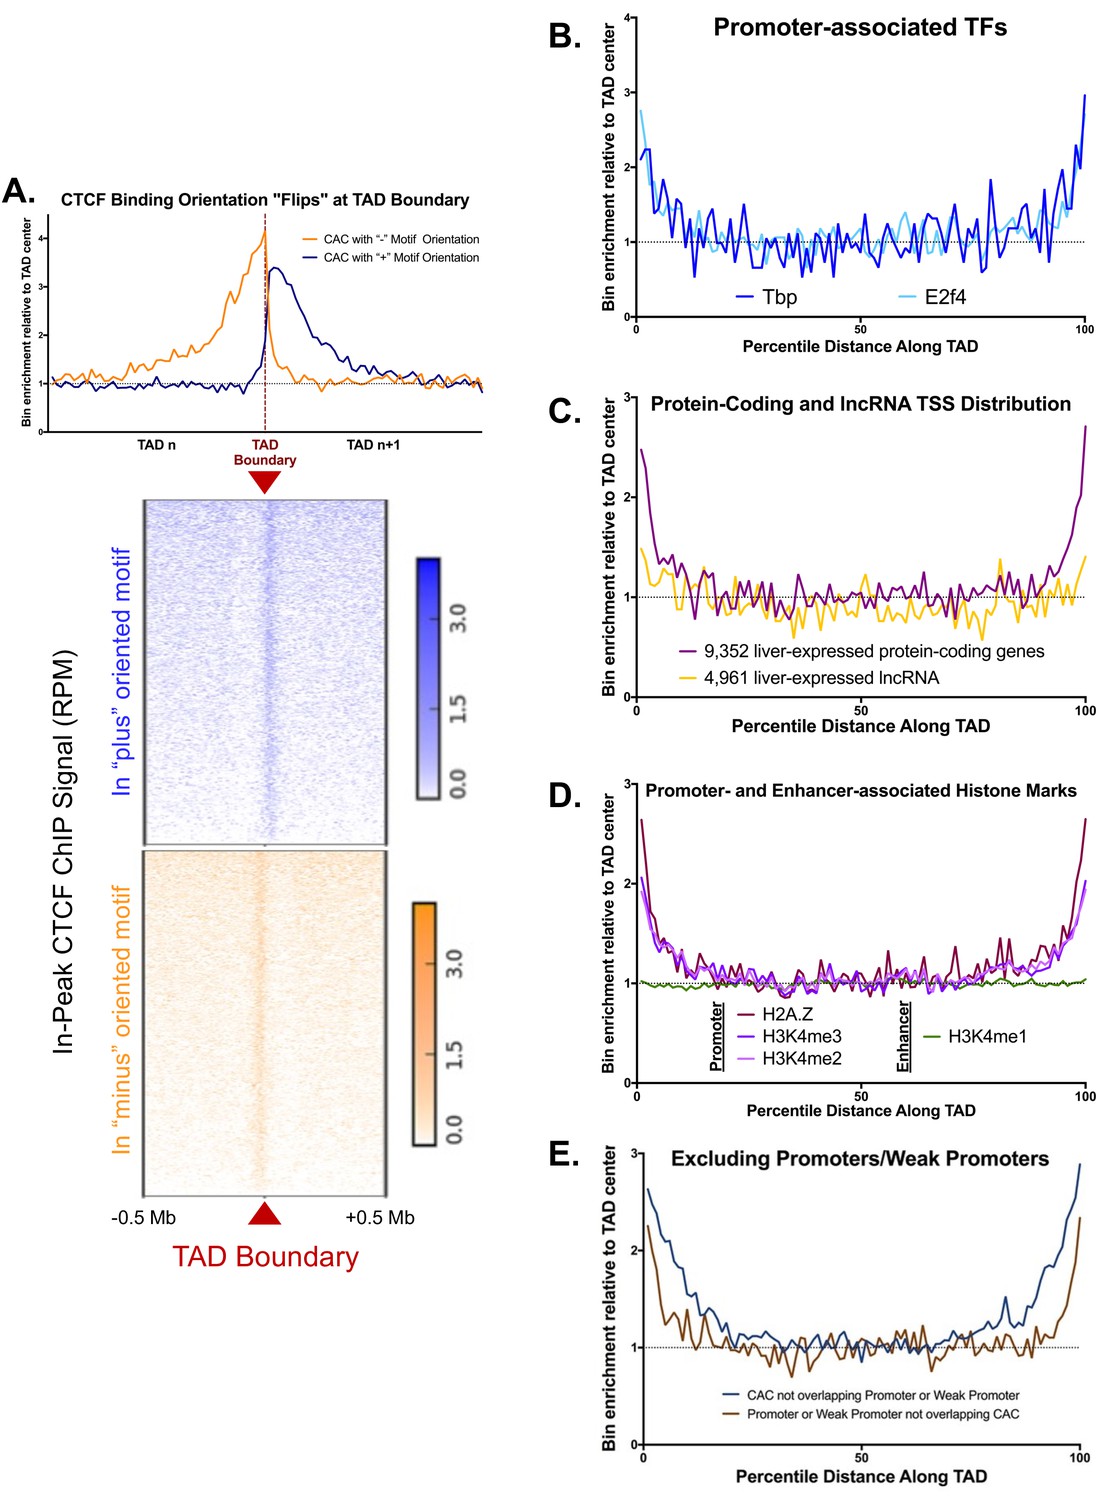
(A) CTCF binding orientations are divergent at TAD boundaries. The top plot indicates bin enrichment relative to the TAD center, as in Figure 1A. The X-axis begins at the midpoint of one TAD, crosses the TAD boundary, and then extends to the midpoint of the subsequent TAD. The lower plot shows the in peak ChIP strength relative to the TAD boundary across a 1 Mb window. Blue shows the signal for CTCF ChIP-seq reads that overlap a (+) CTCF peak, while orange shows the CTCF ChIP-seq reads that overlap a (-) CTCF peak. Reads that either do not overlap a peak or fall in a peak with no CTCF motif are excluded. (B–F) Shown are normalized aggregate count for the indicated peaks or features along the length of all TADs, sub-divided into 100 equally-sized bins per TAD, where bin #1 is at the 5’ end of the TAD and bin #100 is at the TAD 3’ end. Normalization was performed to allow comparison of multiple groups with variable peak numbers and different TAD lengths in a single figure. The y-axis displays the enrichment within a given bin versus the average of the five center bins (bins #48–52). (B) Two TFs, TP and E2F4, show enrichment for TAD boundaries, likely due to their strong bias for binding at gene promoters. (C) The TSS’s of protein-coding genes are enriched at TAD boundaries, while liver-expressed lncRNA TSS show little or no TAD boundary enrichment. (D) Three promoter-associated histone marks, but not the enhancer mark H3K4me1, are enriched at TAD boundaries. This provides further evidence that TAD boundary regions are actively transcribed. (E) Promoters and weak promoters that lack CAC binding are enriched at TAD boundaries. Similarly, CAC that do not overlap promoters or weak promoters are enriched at TAD boundaries. Thus, we expect that promoter and CAC enrichment at TAD boundaries are distinct phenomena and not simply an artifact of CAC binding at some promoters. Promoters and weak promoters were defined by the presence of a DHS and the ratio of H3K4me3 to H3K4me1 signal. (see Materials and methods).
Figure 1—figure supplement 2
Additional Features of TAD boundaries, continued.
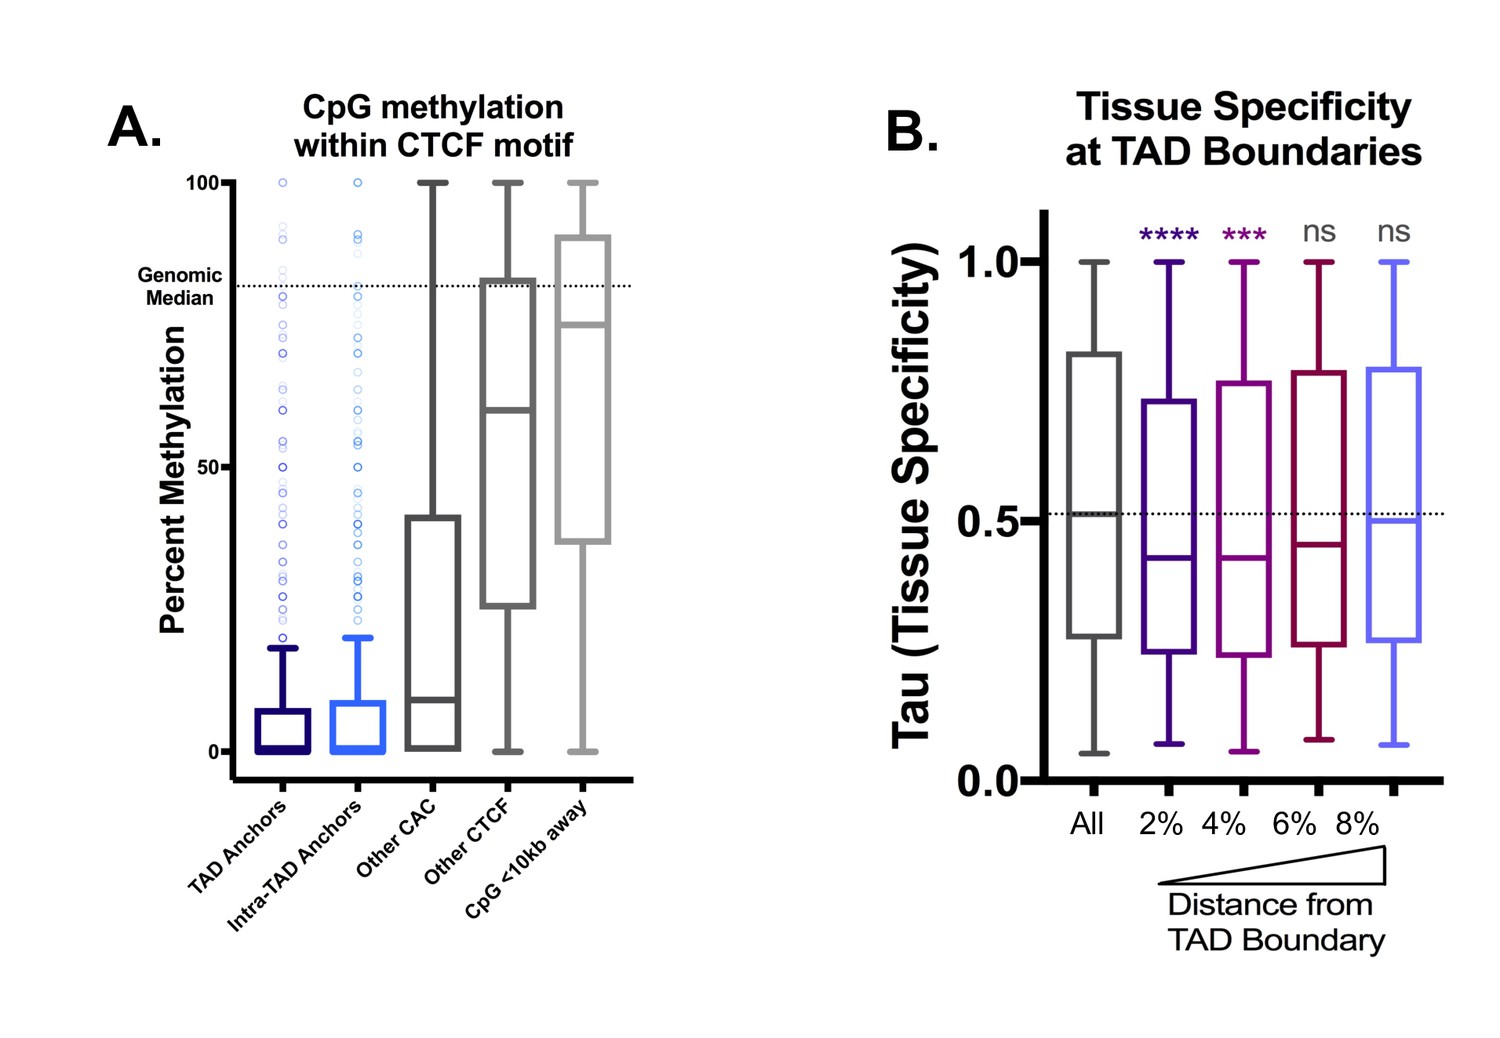
(A) Intra-CTCF-motif CpGs are highly hypomethylated compared to the genome-wide average and to neighboring CpGs within 10 kb (‘CpG <10 kb Away’). This is most pronounced for TAD and intra-TAD anchors. The strength of CTCF binding is more strongly associated with methylation level than with motif score (data not shown). (B) Genes immediately adjacent to TAD boundaries are more tissue ubiquitous in expression (i.e., housekeeping genes). Each bar represents the indicated percentile bin into the adjacent TADs, and by three bins into the TAD from each end (or 6% of the total TAD length), the genes are not significantly (ns) more tissue ubiquitous in expression than the overall genome-wide level (horizontal dashed line). Bins were defined as above, with each TAD divided into 100 bins of equal length per TAD.
Figure 2 with 7 supplements
Predicted intra-TAD loop anchors share many properties of TAD anchors.
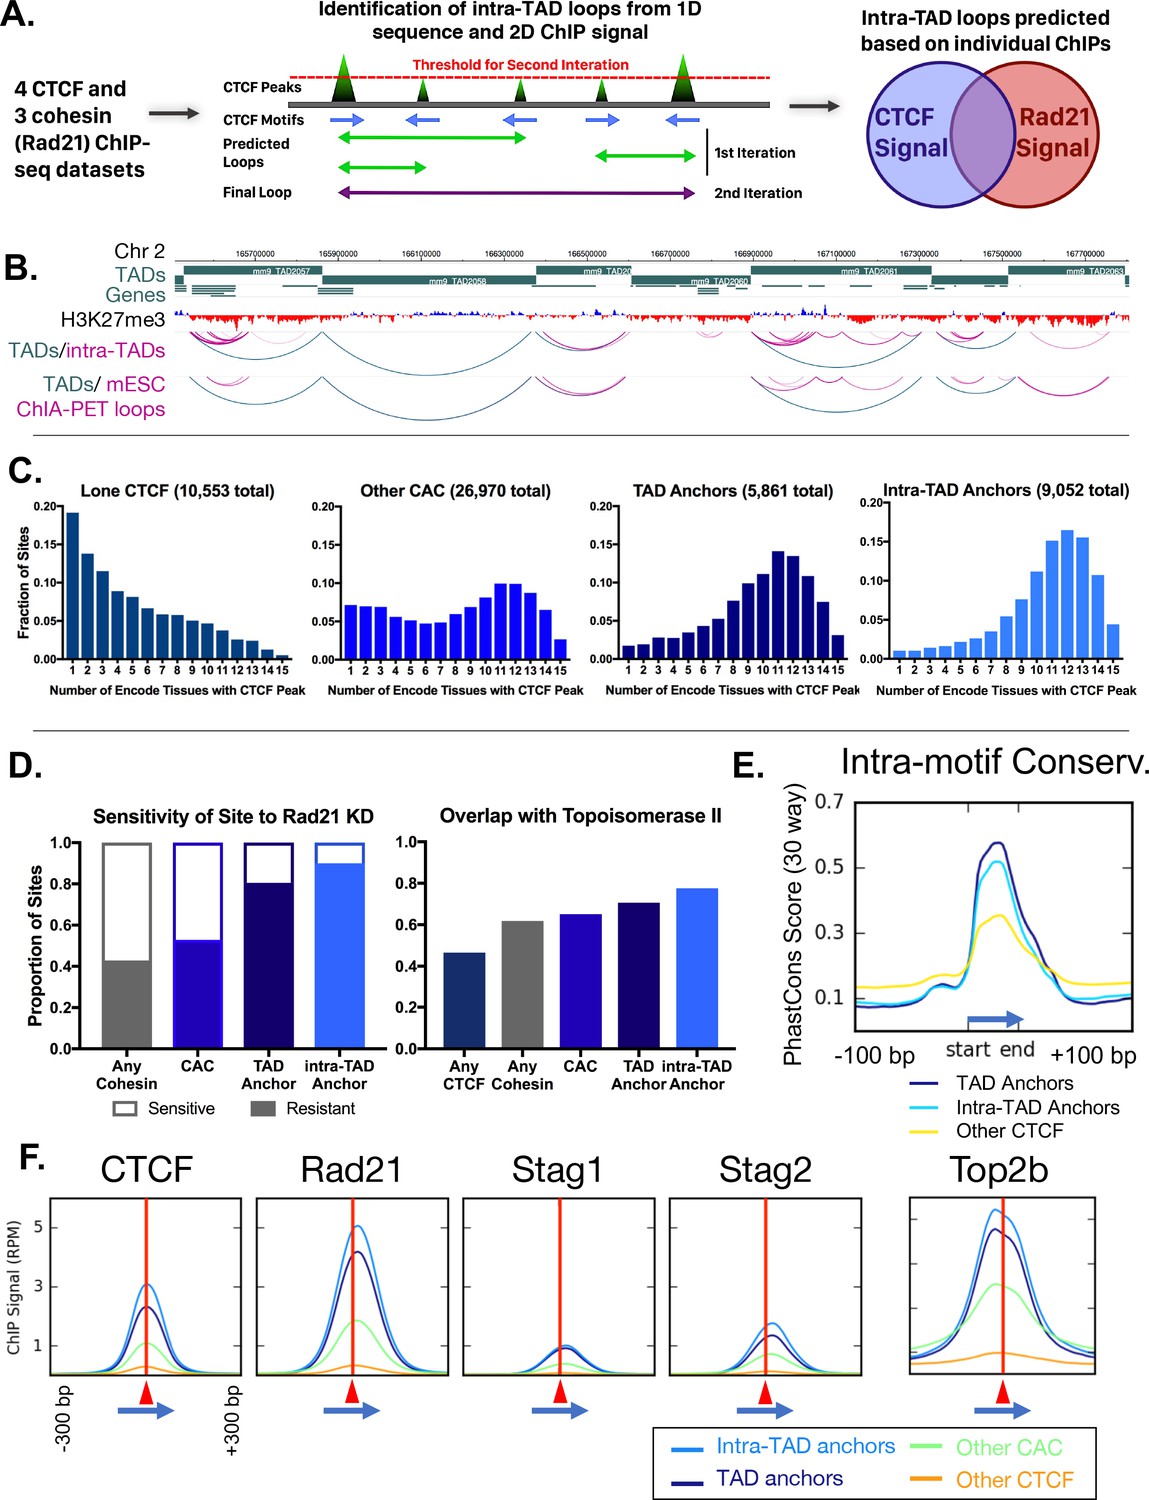
(A) Diagram illustrating intra-TAD loop prediction based on CTCF motif orientation and CTCF and cohesin (Rad21) ChIP-seq binding strength data. Iteration was conducted until 20,000 loops were predicted per sample, prior to filtering and intersection across samples, as detailed in Materials and methods. (B) Shown is a 2 Mb segment of mouse chromosome 2 indicating TAD loops (blue) and intra-TAD loops (pink) in relation to genes. Also shown are cohesin interaction loops identified experimentally in mouse ESC by Smc1 ChIA-PET (Dowen et al., 2014). (C) TAD and predicted intra-TAD loop anchors are more tissue ubiquitous than other categories of CTCF/CAC sites. Each of the four CTCF site subgroups was defined in mouse liver as detailed in Supplementary file 1C. The x-axis indicates the number of ENCODE tissues out of 15 tissues examined that also have CTCF bound, where a higher value indicates more tissue-ubiquitous CTCF binding. These data are shown for ‘lone’ CTCF binding sites (10,553), non-anchor cohesin-and-CTCF sites (‘Other CAC’; 26,970), TAD anchors (5,861), and intra-TAD loop anchors (9,052, which excludes those at a TAD loop anchor). While ‘Other CAC’ sites tend to be weaker (Figure 2F, below), 93% are bound by CTCF in at least one other mouse tissue, and 66% were verified in at least six other tissues. Similarly, for ‘Lone CTCF’, 81% of sites were bound by CTCF in at least one other mouse tissue, and 39% were verified in at least six other tissues (not shown). (D) TAD and intra-TAD loop anchors are more resistant to the knockdown effects of Rad21 ±haploinsufficency than other CAC sites or cohesin-bound regions. A larger fraction is also bound by the novel extrusion complex factor Top2b (Supplementary file 1C). (E) Loop anchors show greater intra-motif conservation than other CTCF-bound regions. Shown are the aggregate PhastCons score for oriented core motifs within either TAD (dark blue) or intra-TAD (light blue) anchors as compared to other CTCF peaks with motifs (yellow). (F) Cohesin interacts with the COOH terminus of CTCF (Xiao et al., 2011), which resulting in a shift of ~20 nt in cohesin ChIP signal relative to the CTCF summit (c.f. shift to the right of vertical red line) regardless of category of CTCF binding site (anchor/non-anchor). Blue arrows indicate the CTCF motif orientation and red triangles and vertical lines indicate position of the CTCF signal summit.
Figure 2—figure supplement 1
Comparison of CTCF Features within TADs and Loop Prediction Improvements.
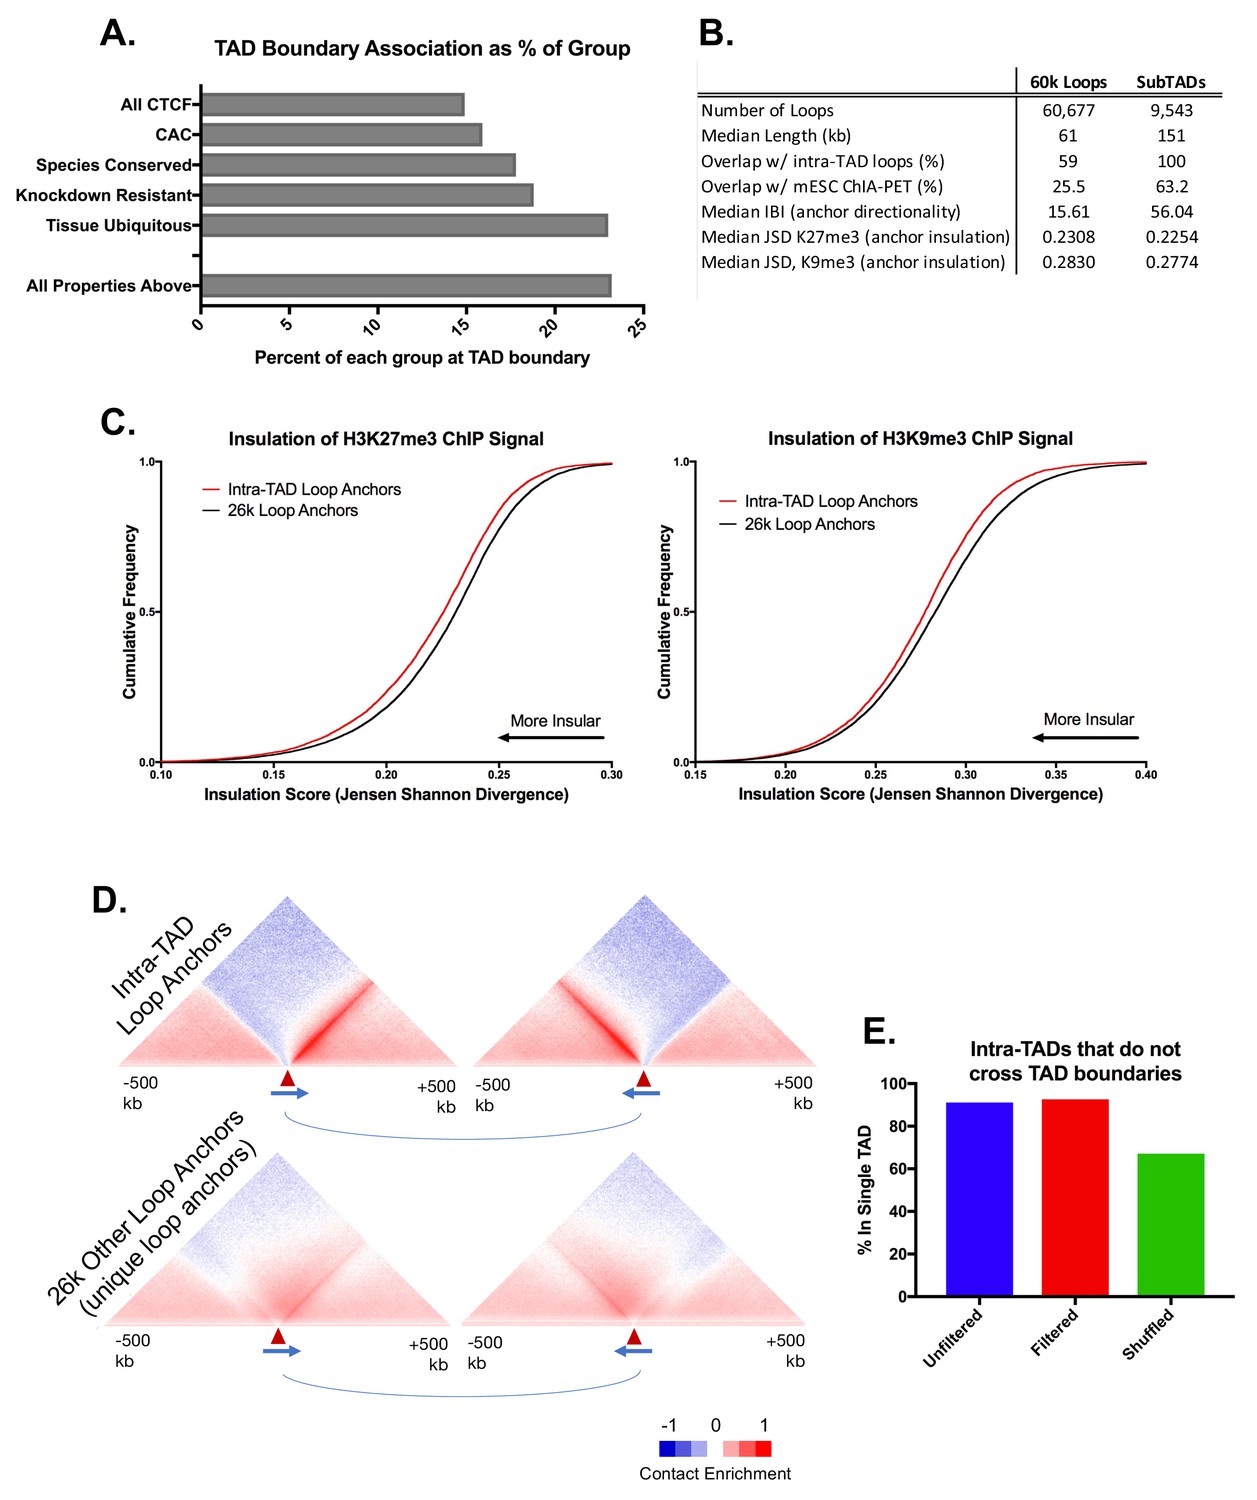
(A) Fewer than 25% of CTCF, CAC, and tissue ubiquitous CTCF sites are within 25 kb of a TAD boundary. While these features are strongly enriched at TAD boundaries (Figure 1A), the vast majority of any subgroup of CTCF sites is still TAD-internal. (B) Comparison of features between the set of 9543 mouse liver intra-TAD loops predicted in this study and an alternative set of 60,677 mouse liver loops predicted using the method described previously (Oti et al., 2016), without any additional filtering. These ‘60 k loops’ tend to be shorter, show much less overlap with mESC ChIA-PET loops, and only capture 59% of intra-TAD loops, as shown. To determine properties of the anchors for the 60 k loop set, we considered a subset comprised of 25,983 unique alternative loop anchors (i.e. loop anchors that are not also anchors of intra-TAD loops or TADs; see Materials and methods). This ‘26 k loop anchor’ subset shows many fewer directional interactions and less insulation (median IBI and JSD, respectively; also see Figure 2—figure supplement 1C,D). (C) The set of 9052 intra-TAD loop anchors (Supplementary file 1B) shows greater insulation of repressive histone marks than the set of 25,983 other putative CTCF-mediated loops (‘26 k anchors’) using a prior iterative loop prediction method (Oti et al., 2016). CTCF peaks identified in the merged sample (combination of all biological replicates) were used as input for computational loop prediction exactly as described in (Oti et al., 2016), without consideration of cohesin strength/binding and without applying any additional filters. This loop list was then filtered to remove any loop that shares an anchor with an intra-TAD loop or whose anchor is within 50 kb of a TAD boundary. Shown here are the insulation scores (JSD) around intra-TAD loop anchors and other putative loop anchors (as defined in panel B) for H3K27me3 and H3K9me3 ChIP-seq read distribution, both of which show greater insulation around intra-TAD loop anchors. (D) Intra-TAD loop anchors show greater insulation of Hi-C data-based interactions as well as stronger directionality of interactions than other putative CTCF loops. The graphic for intra-TAD loop anchors is reproduced from Figure 3C. The 26 k loop anchors defined in panels B were split into left (upstream) and right (downstream) anchors based on CTCF motif orientation. See Figure 3C for further details. (E) 91% of predicted intra-TAD loops are wholly contained within a single TAD, even without filtering for TAD or TSS overlap. This compares to 67% for a random shuffled set of of 9543 regions of equal length and number to the set of intra-TAD loops.
Figure 2—figure supplement 2
Example Screenshots of Predicted intra-TAD Loops with Observable Interactions in CH12-LX (Mouse B-Cells).
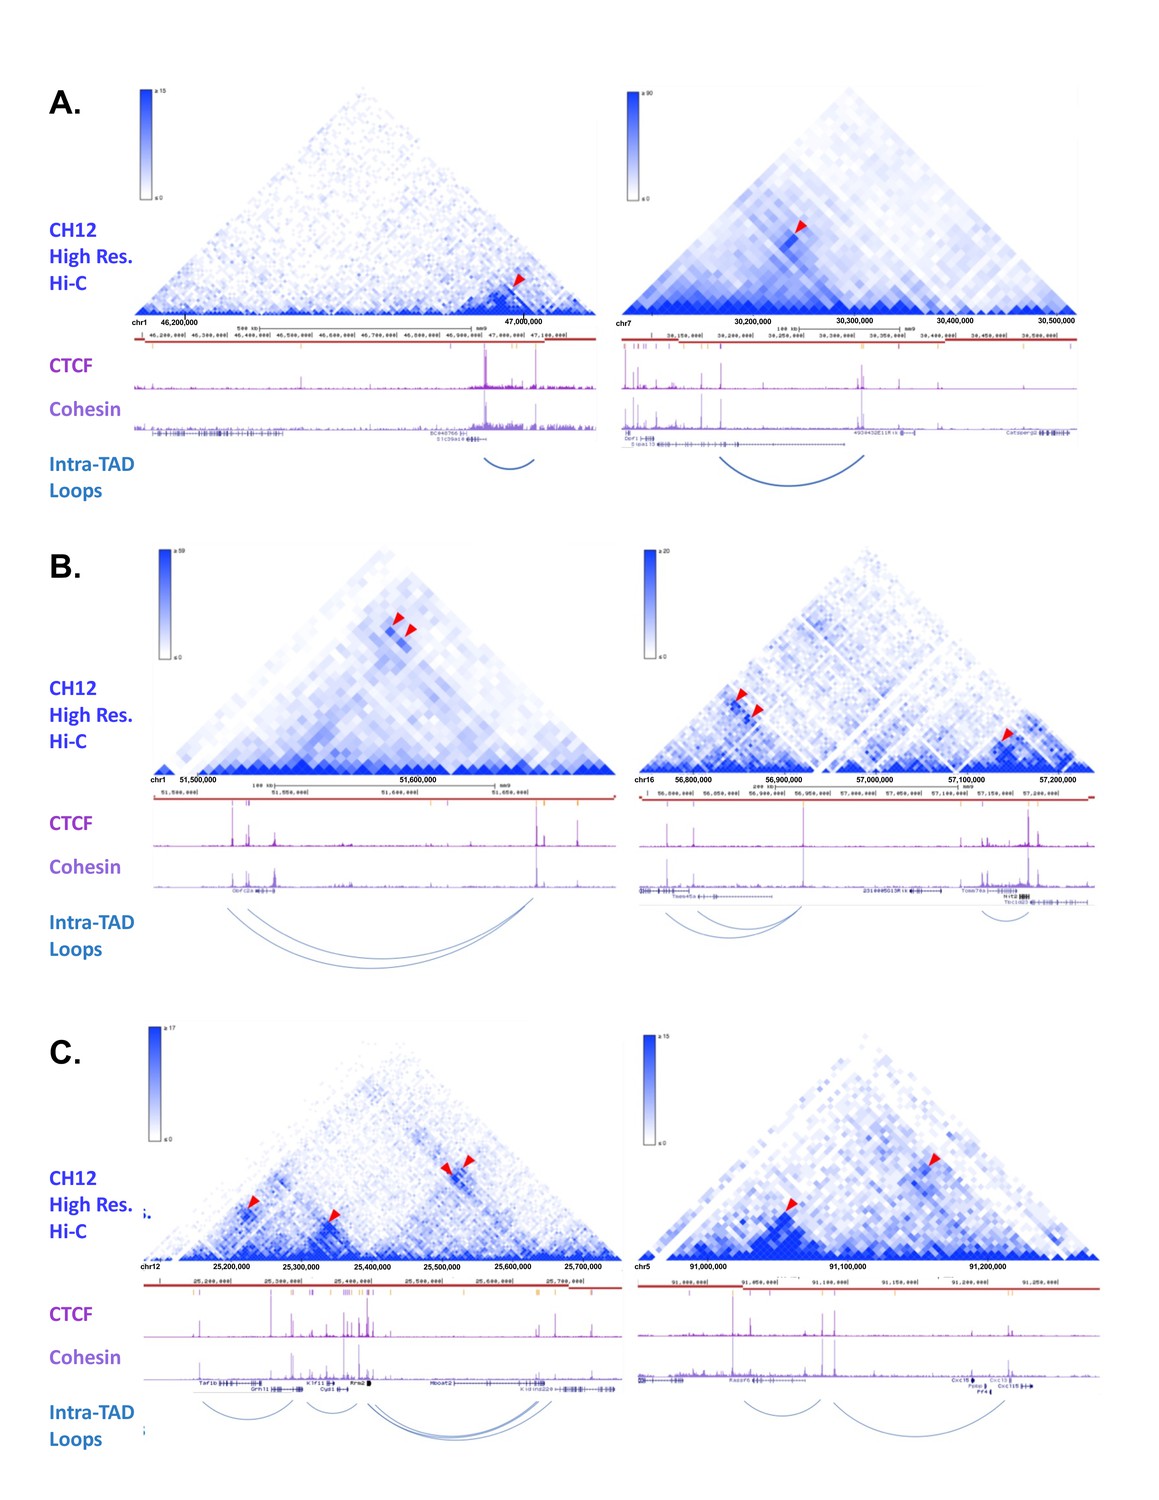
(A-C) Many of the intra-TAD loop structures that we predicted for mouse liver can be seen in the high resolution Hi-C data from the mouse B-cell lymphoma cell line CH12-LX (12). TADs are marked in each panel as horizontal red lines. Shown beneath each red line are the liver CTCF and cohesin ChIP-seq data used to predict the liver intra-TAD loops indicated. Panel F shows two examples of single intra-TAD loops within TADs. Panel G shows examples of nested intra-TAD loops, where one intra-TAD loop anchor is predicted to interact with more than one CAC anchor. Finally, Panel H shows more complex subdivision of TADs into multiple intra-TAD loops. The top section of each panel shows the Hi-C data from CH12-LX cells, while the lower section of each panel presents our data from mouse liver. Red arrowheads mark focal peaks in the contact matrix, which correspond to the midpoints of the predicted intra-TAD loops.
Figure 2—figure supplement 3
Subclasses of CTCF binding events in relation to predicted loops.
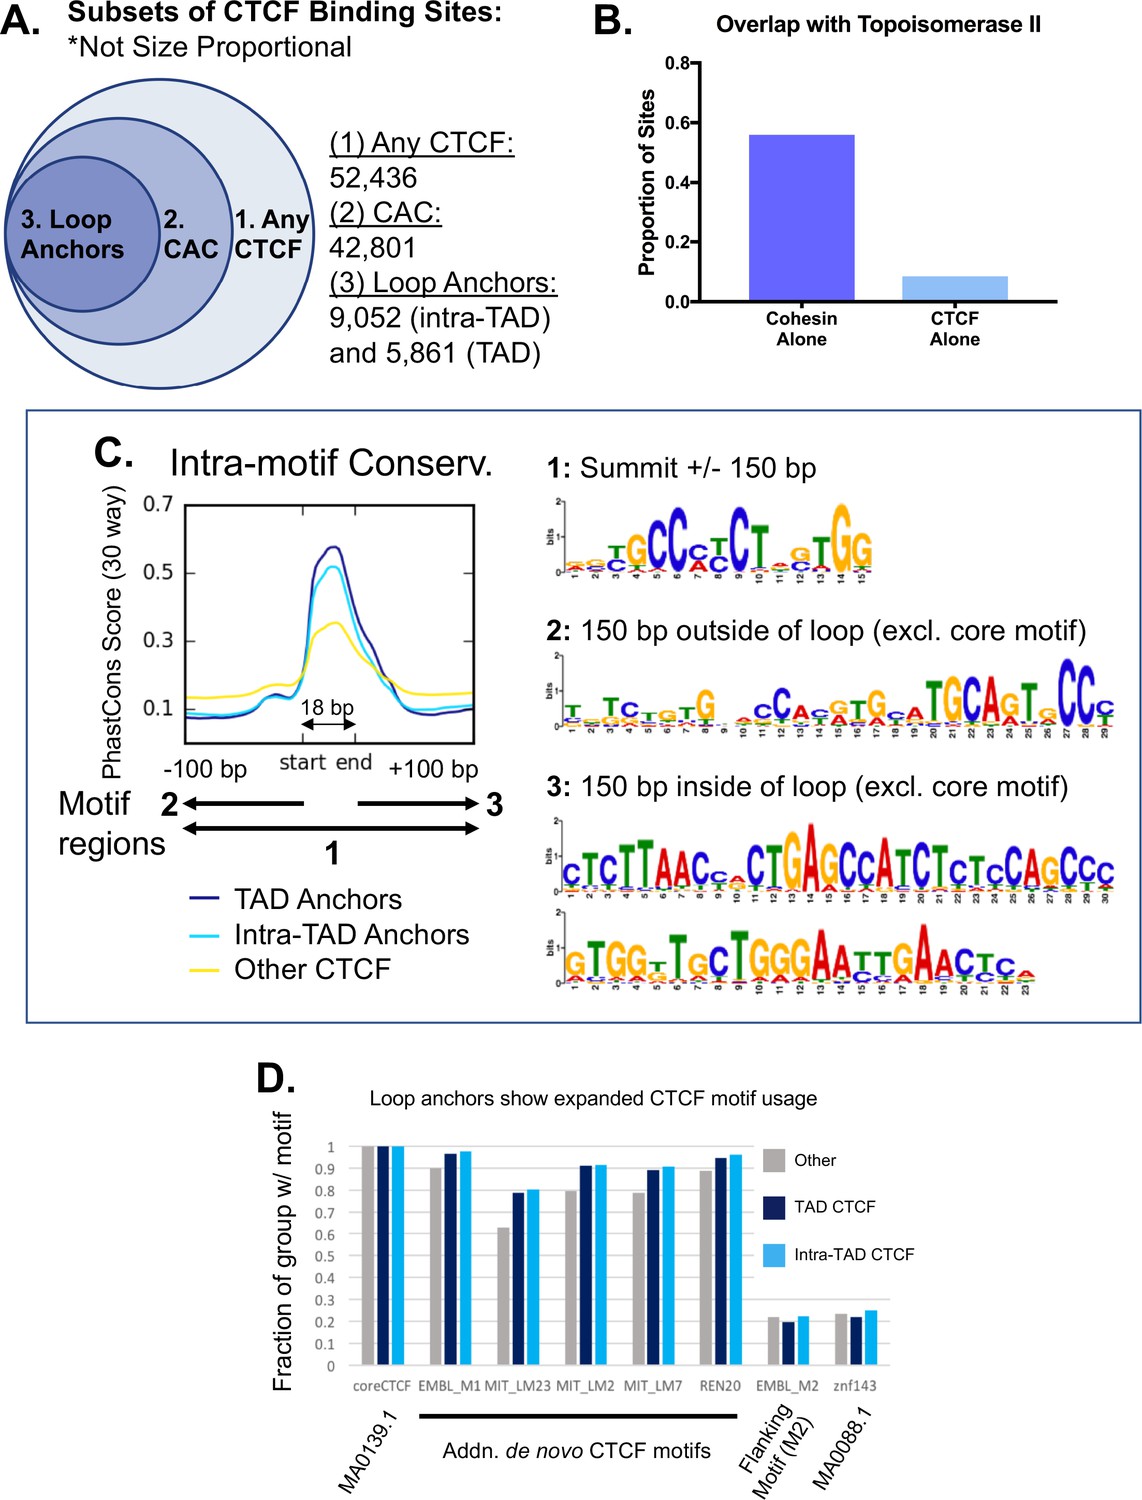
(A) Summary of CTCF sites, CAC sites, TAD loop anchors, and intra-TAD loop anchors in mouse liver based on lists in Supplementary file 1C. (1) CTCF peaks found in at least two biological replicate samples (n = 52,436). (2) The subset of the above CTCF sites that also overlap a cohesin (Rad21) binding site (n = 42,801). (3) CTCF sites predicted to be involved in an intra-TAD loop (9,052) or a TAD loop (5,861). Due to some ambiguity and nesting of many loop structures, the number of intra-TAD loop anchors shown is substantially less than the total number of intra-TAD loops (9,543) multiplied by a factor of 2. (B) Cohesin appears to be the primary contributing factor for topoisomerase-IIβ (Top2b) interaction with CTCF, as Top2b is only present at 8.5% of CTCF sites lacking cohesin, but is found at 56% of cohesin sites lacking CTCF (i.e., CNC sites). (C) De novo motif discovery for loop anchors did not reveal any specific motifs that differentiate loop anchors from other CTCF-bound regions. De novo motif discovery was performed using Homer. In some cases, evidence of expanded CTCF motif usage was observed downstream of the core motif (region 3, loop interior), however, fewer than 5% of the genomic regions analyzed contained any of the specific motifs discovered. We found evidence for the M2 motif (region 2, loop exterior) in all groups, fitting with the small secondary peak of conservation just upstream of the core motif. The PhastCons intra-motif conservation figure duplicates that shown in Figure 2E. (D) Analysis of loop anchors for known motifs did not identify any specific motifs that differentiate loop anchors from other CTCF-bound regions that contain the core CTCF motif (MA0139.1). Some modest degree of sequence optimization may occur at loop anchors, as additional CTCF motifs were consistently present at a higher proportion of loop anchors than at other CTCF-bound regions. The motif for Znf143 and the specific ‘M2’ CTCF motif showed no differences and were found in ~20% of the genomic regions in each group. JASPAR IDs are indicated when available. Position weight matrices for ‘additional de novo CTCF motifs’ can be found at CTCFBSDB 2.0 (http://insulatordb.uthsc.edu/download/CTCFBSDB_PWM.mat).
Figure 2—figure supplement 4
Intra-TAD loop prediction in two other mouse cell types: mESC and NPC.
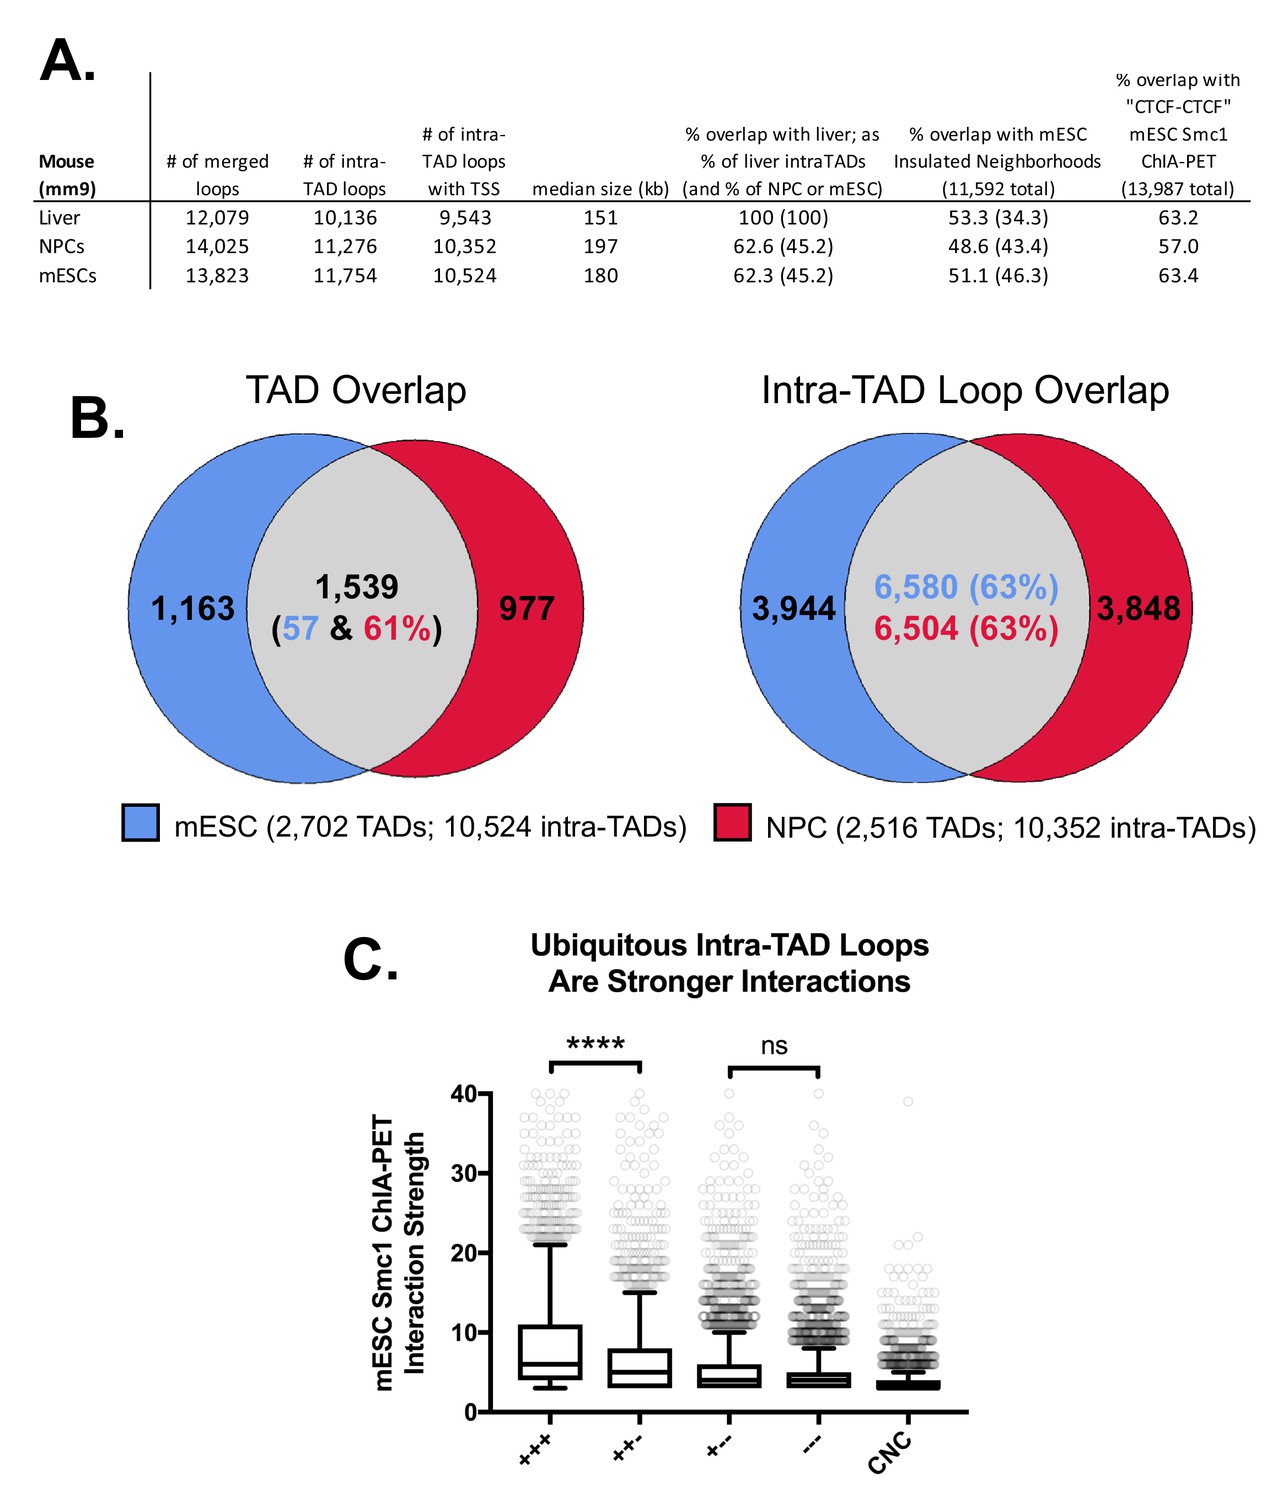
(A) Comparison of CAC-mediated intra-TAD loop predicted for mouse embryonic stem cells (mESCs) and neural progenitor cells (NPCs) with those predicted in mouse liver. The number of loops present after merging predictions across all replicates is shown (column 1), followed by the number of loops that do not substantially overlap TADs (i.e., loops that show <80% reciprocal overlap with TADs; column 2). Column three shows the number of loops that contain ≥1 TSS (either protein-coding gene or multi-exonic long noncoding RNA TSS). Overlaps are presented for this set of filtered loops (column 3) with the sets of intra-TAD loops predicted in liver, Insulated Neighborhoods in mESC (Hnisz et al., 2016), and ‘CTCF-CTCF’ interactions from Smc1 ChIA-PET experiments in mESC (Dowen et al., 2014). As the size of each group is different, overlaps in columns 5 and 6 show the percent overlap relative to the group indicated in the column header (either liver intra-TAD loops or insulated neighborhoods) followed by parentheses showing the percent overlap relative to the row group (either liver, mESC, or NPC intra-TAD loops). (B) Shown is the overlap between mESC and NPC intra-TAD loops (63%), which is similar to the overlap between mESC and NPC TADs. this indicates that intra-TAD loops show a similar, or even somewhat higher, level of tissue ubiquity as do TADs. (C) Tissue-specific intra-TAD loops are weaker than those shared across liver, mESC, and NPCs. To compare the relative strength of loops predicted by our approach, we divided Smc1 ChIA-PET loops (Dowen et al., 2014) into five groups: ‘+++’, meaning ‘CTCF-CTCF’ interactions that overlap intra-TAD loops predicted in all three cell types; ‘++-‘, meaning ‘CTCF-CTCF’ interactions that overlap intra-TAD loops predicted in mESCs and only one other cell type; ‘+--‘, meaning ‘CTCF-CTCF’ interactions that overlap intra-TAD loops predicted in mESCs and no other cell type; ‘---‘, meaning ‘CTCF-CTCF’ interactions that do not overlap any predicted intra-TAD loop in mESC; or ‘CNC’, meaning cohesin-non-CTCF interactions or cohesin-mediated interactions that are not anchored by mESC CTCF binding (primarily enhancer-promoter interactions). There is no significant difference in strength of interaction between mESC-unique intra-TAD loops (+--) and those not predicted in our model (---). Both of these groups are still stronger than CNC-mediated interactions (‘+-- ‘or ‘--- ‘vs CNC), as measured by the number of PETs supporting these interactions.
Figure 2—figure supplement 5

Example Screenshots for intra-TAD Loops in mESC and NPC (Mouse).
(A-C) Screenshots of intra-TAD loops predicted in mESC and NPC cells are shown below high-resolution Hi-C data for each cell type. These data provide support for both tissue-specific and tissue-ubiquitous intra-TAD loops. The same genomic region is shown on the left and on the right of each panel. (A) Intra-TAD loops shared between mESC and NPC cells on mouse chromosome 17. Shown are four shared intra-TADs loops, whose anchor-to-anchor interactions are apparent from the Hi-C data in both mESC and NPC cells (blue arrowheads). Three of the upstream loops are contained within a weaker TAD loop, which can be seen in both cell types (orange arrowhead). (B) Intra-TAD loop on chromosome one that is predicted only in NPCs. This data supports the model that a minority of intra-TAD loops are tissue-specific, as this genomic region shows an intra-TAD loop that was only predicted in NPCs, with an interaction only seen in NPC cells, but not in mESC cells. Contact matrix (green arrowhead). (C) Intra-TAD loops on a segment of chromosome 1, that are predicted only in mESCs or only in NPCs. Tissue-specific intra-TAD loops for mESCs and NPCs are observed, each of which is supported by a corresponding enrichment in their respective Hi-C contact matrix (green arrowhead). Also shown is a tissue-specific loop in NPCs that may represent some other type of looping event (i.e. enhancer-promoter; purple arrowhead).
Figure 2—figure supplement 6
Intra-TAD loop predictions in human cell lines GM12878 and K562.
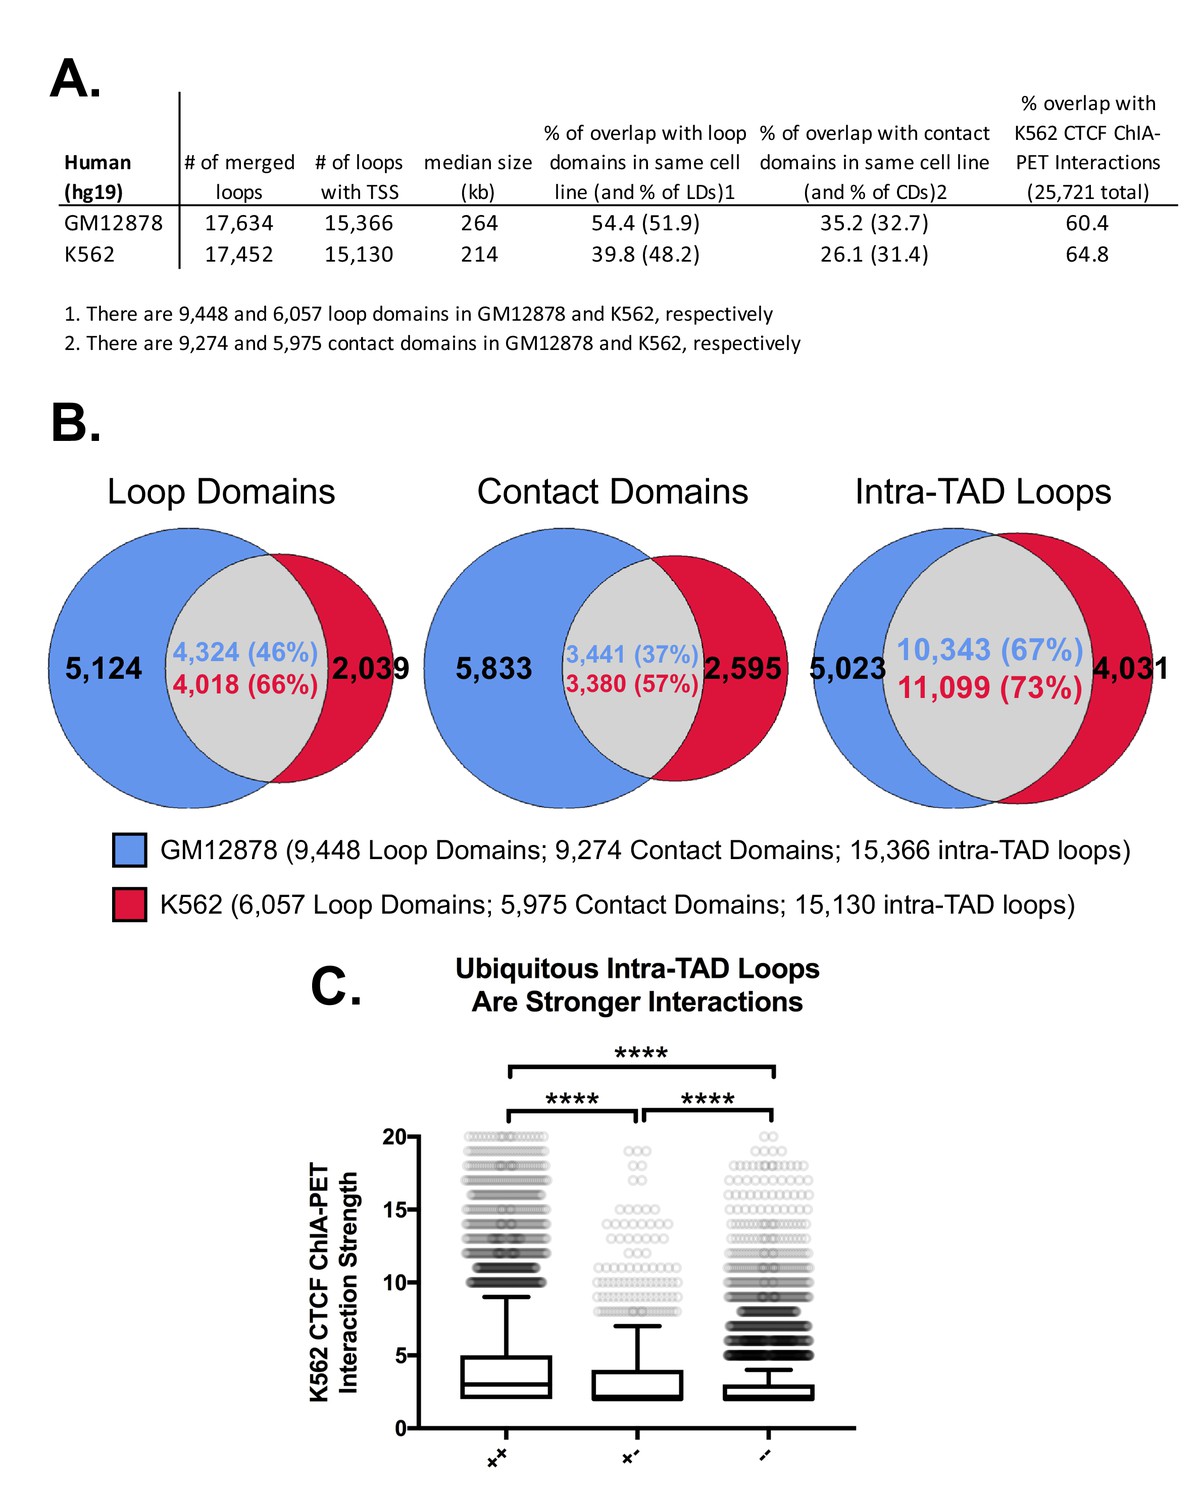
(A) Comparison of CAC-mediated intra-TAD loop predicted in human lymphoblastoid-derived cells (GM12878 cells) and in human chronic myelogenous leukemic cells (K562 cells). The number of loops present after merging predictions across all replicates is shown, followed by filtering to ensure that only loops containing a RefSeq TSS gene are retained. The overlap of each group with its respective sets of loop domains (LD; column 4) and contact domains (CD; column 5) is shown; the percent of intra-TAD loops that overlap loop domains or contact domains is listed first, followed by the percent of loop domains and contact domains that overlap an intra-TAD loop (values in parentheses). The percentage of intra-TAD loops that show CTCF ChIA-PET interactions in K562 cells is shown in the last column. (B) The percent of loop domains (left) and contact domains (middle) that are shared between GM12878 and K562 cells is consistently higher for intra-TAD loops predicted by our method (right) than for loop domains or contact domains. It should be noted that the GM12878 cell dataset was sequenced more deeply and with more replicates than the datasets for K562 cells, which is likely why GM12878 cells show ~50% more loop domains and contact domains than K562 cells. Even comparing the percent overlap relative to the smaller subset of loop domains/contact domains in K562 cells, we observe greater overlap between cell types for the intra-TAD loops predicted by our method. (C) K562-specific loops are significantly weaker than intra-TAD loops predicted in both K562 and GM12878 cells. To compare the relative strength of loops predicted by our method, we divided CTCF ChIA-PET loops from K562 cells (ENCODE: ENCSR436IAJ) into three groups: ‘++’, meaning CTCF ChIA-PET interactions that overlap with intra-TAD loops predicted in both K562 and GM12878 cells; ‘+-‘, meaning CTCF ChIA-PET interactions that overlap intra-TAD loops predicted in K562 cells but not in GM12878 cells; or ‘--', meaning CTCF ChIA-PET interactions that do not overlap any intra-TAD loop in K562 cells. Similar to the results for mouse (Figure 2—figure supplement 4C), the shared intra-TAD loops (++) show significantly higher interaction strength than either the K562-specific or other CTCF loops. Further, the K562-specific loops are stronger than other CTCF loops that do not overlap intra-TADs.
Figure 2—figure supplement 7
Example Screenshots for intra-TAD Loops in K562 and GM12878 (Human).
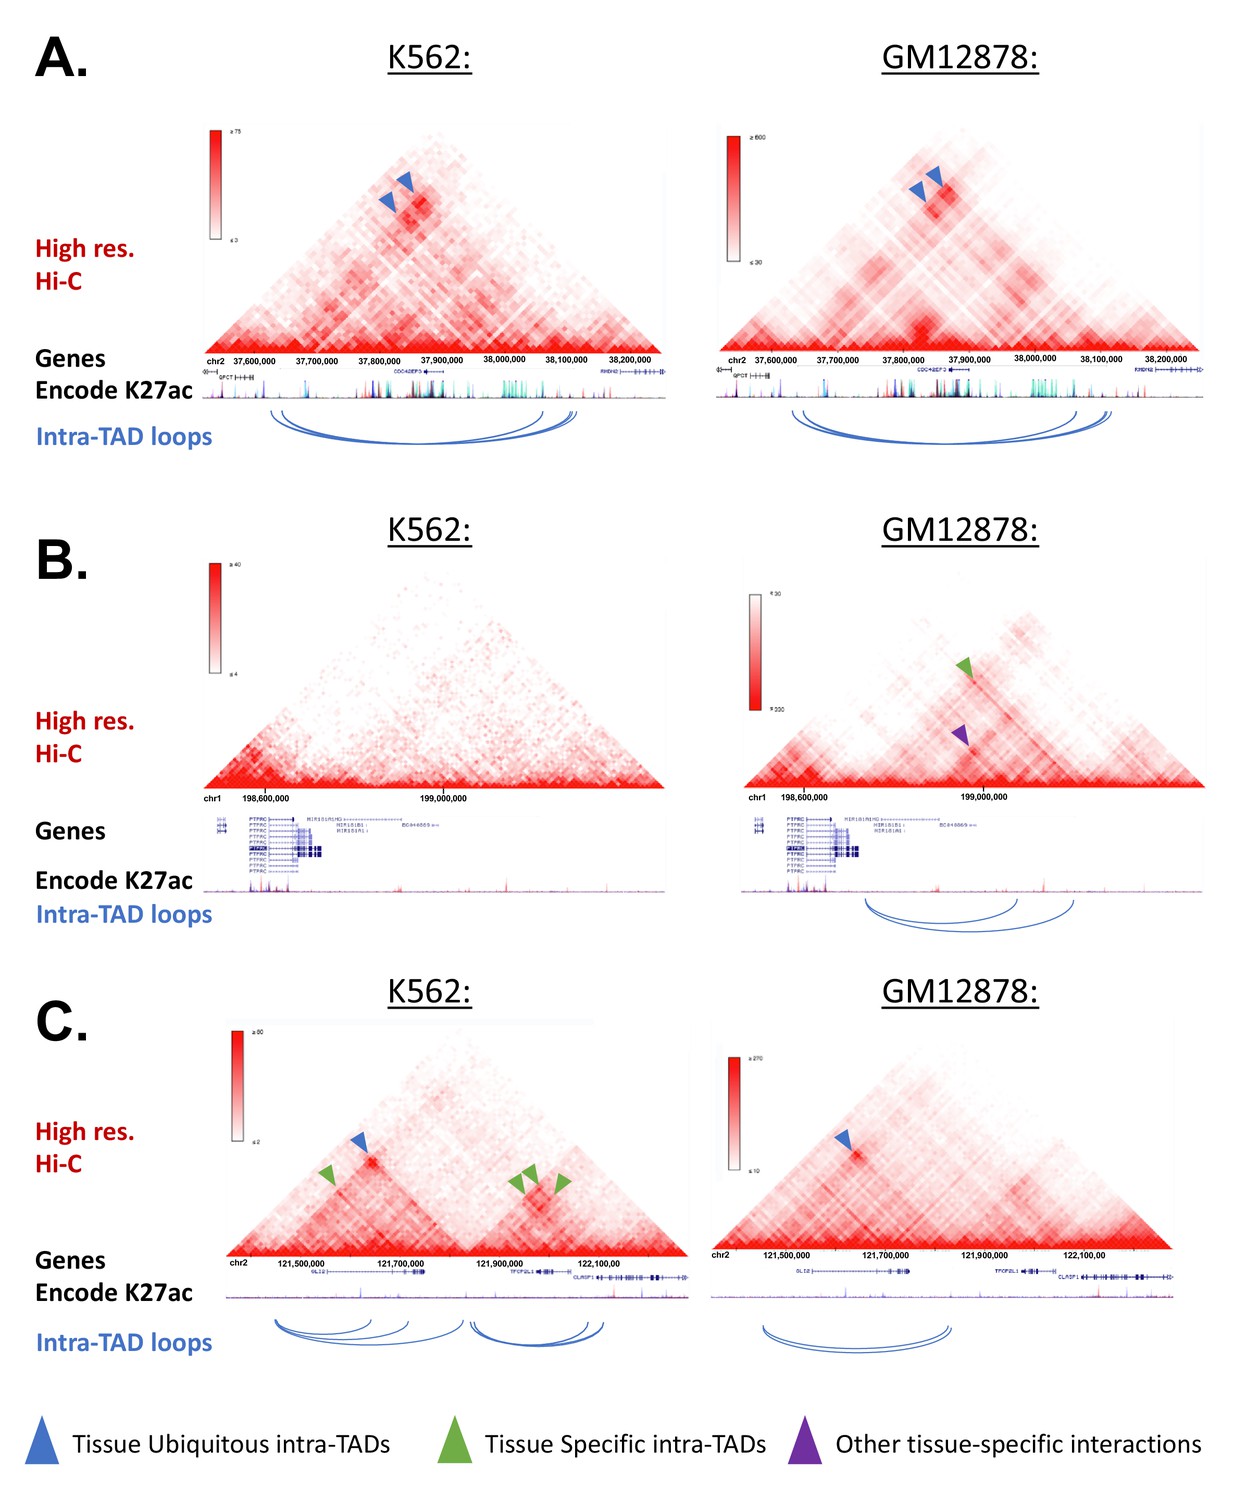
(A-C) Screenshots of intra-TAD loops predicted in K562 and GM12878 cells are shown below high-resolution Hi-C data for each cell line. The same genomic region is shown on the left and on the right of each panel. Shown below each gene track are stacked H3K27ac ChIP-seq tracks for the tier 1 ENCODE cell lines, including K562 (dark blue) and GM12878 cells (red). (A) Intra-TAD loops shared between K562 and GM12878 cells on human chromosome 2. Shown are nested intra-TADs loops whose anchor-to-anchor interactions are apparent in both K562 and GM12878 cells (blue arrowheads). (B) Intra-TAD loop on human chromosome one that is predicted only in GM12878 cells. This supports the model that a minority of intra-TAD loops are tissue-specific, as this region shows an intra-TAD loop predicted only in GM12878 cells, and with an interaction only observed in the GM12878, but not the K562 cell contact matrix (green arrowhead). Other GM12878-specific interactions are observable within the intra-TAD loops between the promoter of MIR181A1HG and upstream GM12878-specific enhancers (purple arrowhead; red H3K27ac track). (C) Intra-TAD loops on human chromosome one that are either predicted only in K562 cells, or are shared between K562 and GM12878 cells. Shown upstream is a K562-specific nesting (green arrowhead) within a larger shared intra-TAD loop (blue arrowhead). Shown downstream are additional examples of tissue-specific intra-TAD loops present in K562 cells, which are supported by corresponding enrichments in the K562 Hi-C contact matrices.
Figure 3 with 2 supplements
Intra-TAD loops show directional interactions and insulate chromatin marks.
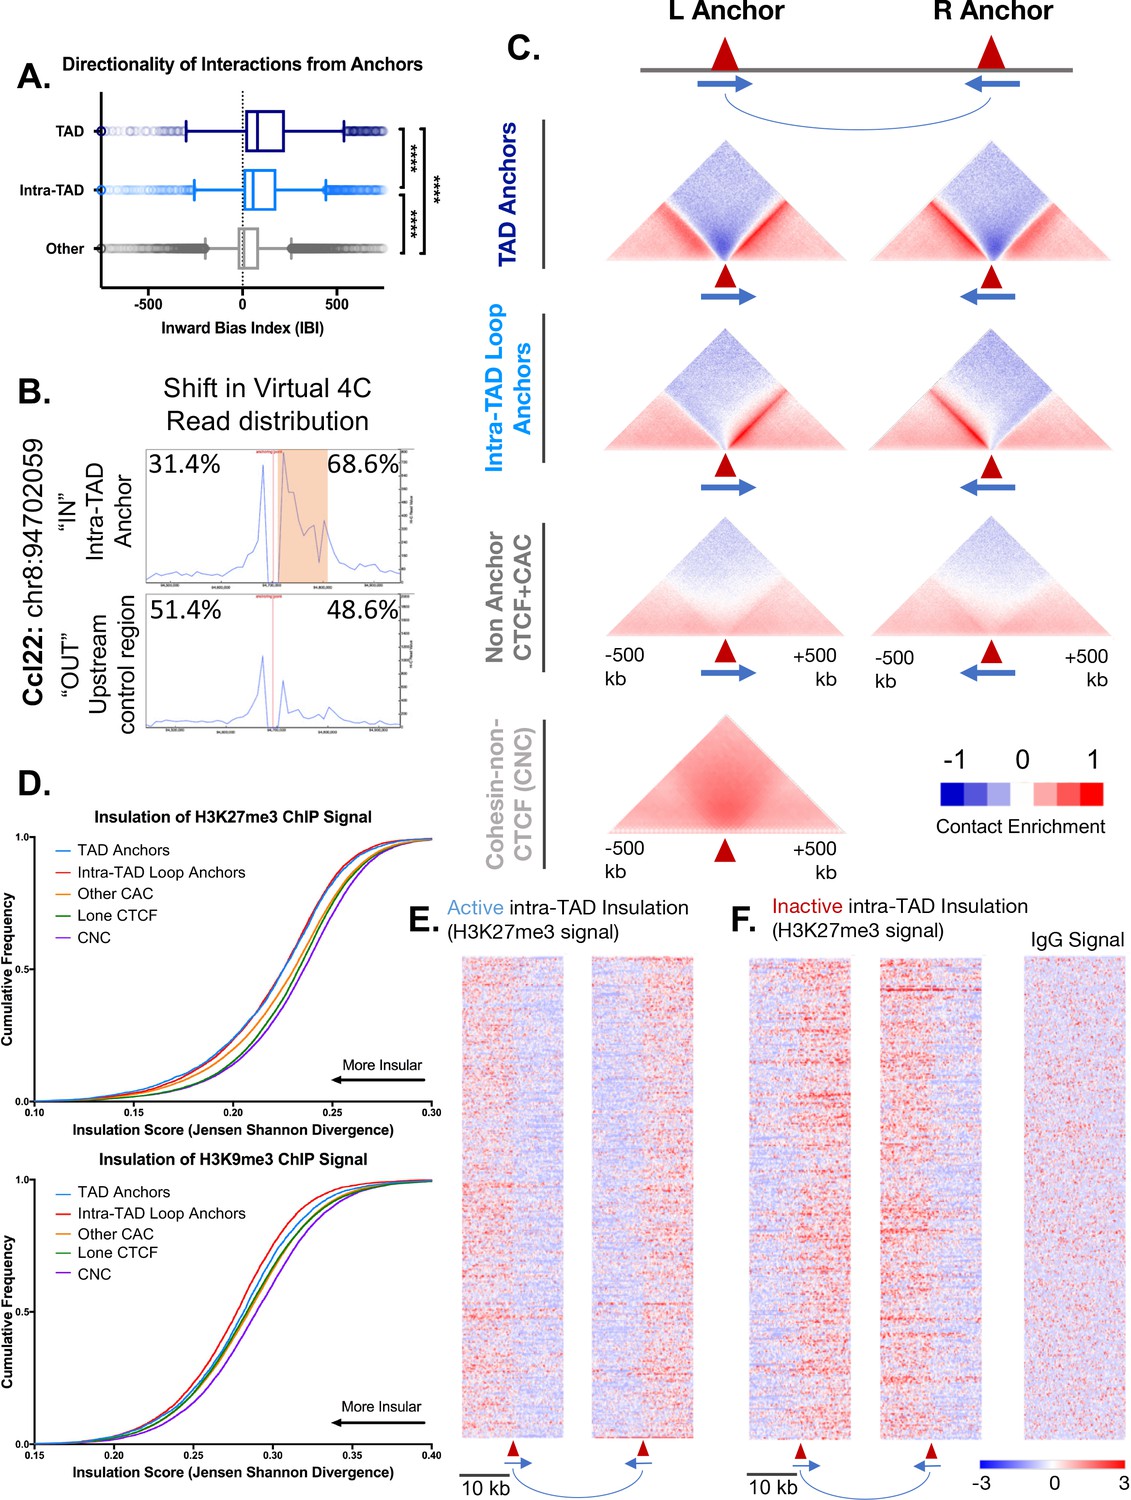
(A) TADs and intra-TAD loops both show a stronger orientation of interactions downstream of the motif than other CTCF-bound regions. TAD anchors also show higher inward bias than intra-TAD loops (p<0.0001, KS t-test for pairwise comparisons). Inward bias is a chi-square-based metric similar to directionality index but defined on a per peak basis and oriented relative to the motif within the anchor/non-anchor peak. For this and all other anchor comparisons, anchors that are shared between TADs and intra-TAD loops were excluded from the intra-TAD group to ensure a fair comparison. Anchors shared between TADs and intra-TAD loops were considered as TAD anchors only. (B) Virtual 4C analysis in mESC for a genomic region nearby Ccl22 on mouse chromosome 8. The data shows a shift in Hi-C read distribution around intra-TAD loop anchors, indicating insulation. mESC Hi-C data from (Bonev et al., 2017) was plotted across a 500 kb window surrounding the virtual 4C viewpoint, which is marked by a verticle red line. Viewpoints were selected to be at the start of an intra-TAD loop (‘IN’) as well as an adjacent upstream control region that does not overlap an intra-TAD loop anchor. The percentages shown indicate the distribution of interaction reads upstream and downstream of the viewpoint, over the 500 kb region, as shown. Orange shading indicates the width of the intra-TAD loop region interrogated. Chromosomal coordinates are for mouse genome mm10. (C) Shown are aggregate plots generated from mouse liver Hi-C data (Vietri Rudan et al., 2015) for each set of TAD and intra-TAD loop anchors, for the set of non-anchor CTCF sites listed in Supplementary file 1C, and for the set of CNC sites (Supplementary file 1D), which serves as a control. In aggregate, TAD and intra-TAD loop anchors show stronger and more directionally-biased interactions (contact enrichment, red) than the non-anchor CTCF bound genomic regions. They also show a greater depletion of distal chromatin interactions (contact depletion, blue). TAD anchors also show greater distal contact enrichment with the anchor and more local contact depletion spanning the anchor than intra-TAD loops. Red triangles indicate locations of left and right loop anchors and blue arrows indicate CTCF motif orientation. Shading indicates an enrichment (red) or depletion (blue) of contact frequency relative to a genome-wide background model. (D) Shown are JSD values for four classes of mutually exclusive CTCF binding sites (TAD anchors, intra-TAD loop anchors, other CAC sites, and CTCF sites lacking cohesin) as well as CNC sites, which are primarily found at enhancers. TAD and intra-TAD loop anchors show greater insulation of the repressive histone marks as measured by Jensen Shannon divergence between H3K27me3 and H3K9me3 ChIP-seq signal upstream and downstream of the anchor region. (E) Shown are the top 500 active insulated intra-TAD loops, based on high H3K27me3 ChIP-seq signal outside the intra-TAD loop (red), and low H3K27me3 signal within the intra-TAD loop (blue). Data are expressed as a Z-score of the H3K27me3 signal per bin relative to all H3K27me3 signals within a 20 kb widow centered on all CTCF-bound regions. (F) Shown are the top 500 inactive insulated intra-TAD loops, based on high signal H3K27me3 signal inside the intra-TAD loops (red) and low H3K27me3 signal in neighboring regions (blue). Signal is shown as a Z-score of H3K27me3 signal, as in E. At right is shown the IgG signal distribution as a negative control for the upstream anchors of inactive intra-TAD loops (see Figure 3—figure supplement 2D for all IgG signal panels).
Figure 3—figure supplement 1
Direct evidence of insulation from the asymmetric read distributions for virtual 4C viewpoints anchored at intra-TAD loop anchors or adjacent upstream regions.
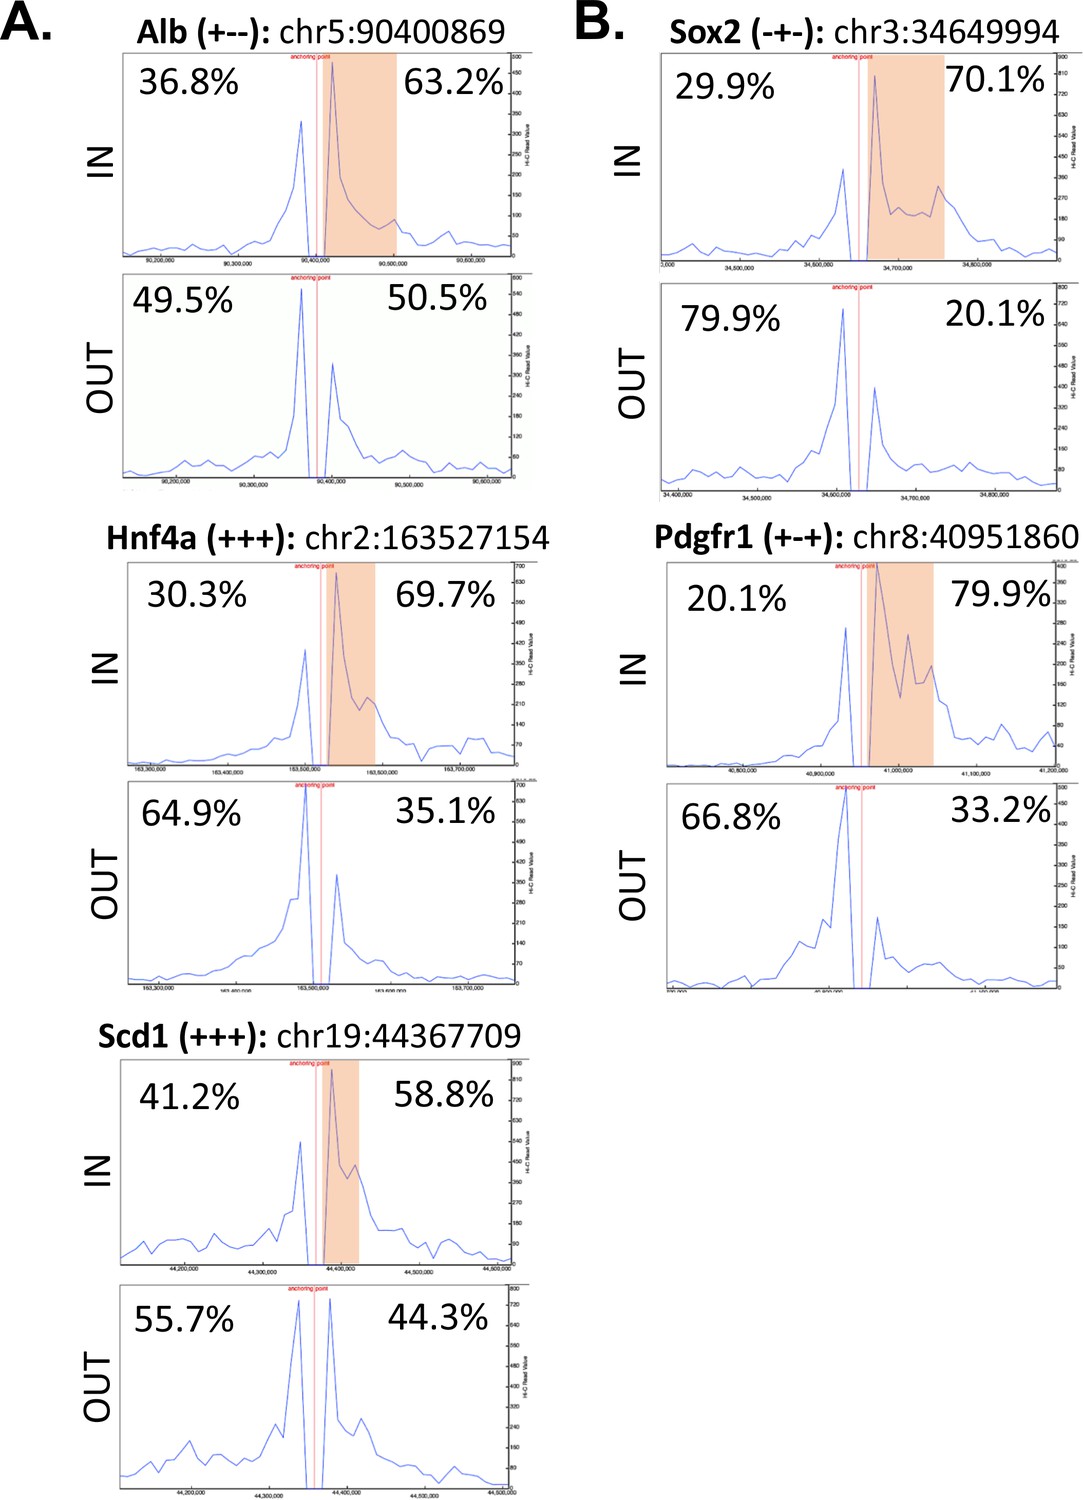
(A) Shown is the distribution of Hi-C sequence reads for three intra-TADs referred to in the main text, which provides evidence of directional interactions and insulation in mESCs. For all plots, mESC Hi-C data from Bonev et al., 2017 (Bonev et al., 2017) was used, plotted for a 500 kb window centered on the viewpoint (250 kb on either side; viewpoint shown as a red vertical line). Viewpoints were selected for the start of an intra-TAD loop (‘IN’) and for an adjacent upstream control region that does not overlap an intra-TAD loop anchor. The gene name in the title is followed by three ‘+’ or ‘- ‘signs to indicate the presence or absence of a given intra-TAD loop in liver, mESC, or NPC, respectively. The percentages represent the proportion of reads either upstream or downstream of the viewpoint divided by the total Hi-C reads within the 500 kb region displayed. The orange box indicates the width of the intra-TAD loop interrogated. Chromosomal coordinates are shown for each ‘IN’ viewpoint using the mm10 genome assembly, as used in (Bonev et al., 2017). (B) The distribution of Hi-C reads for two additional intra-TAD loops, formatted as above.
Figure 3—figure supplement 2
Additional features of intra-TADs and their insulation.
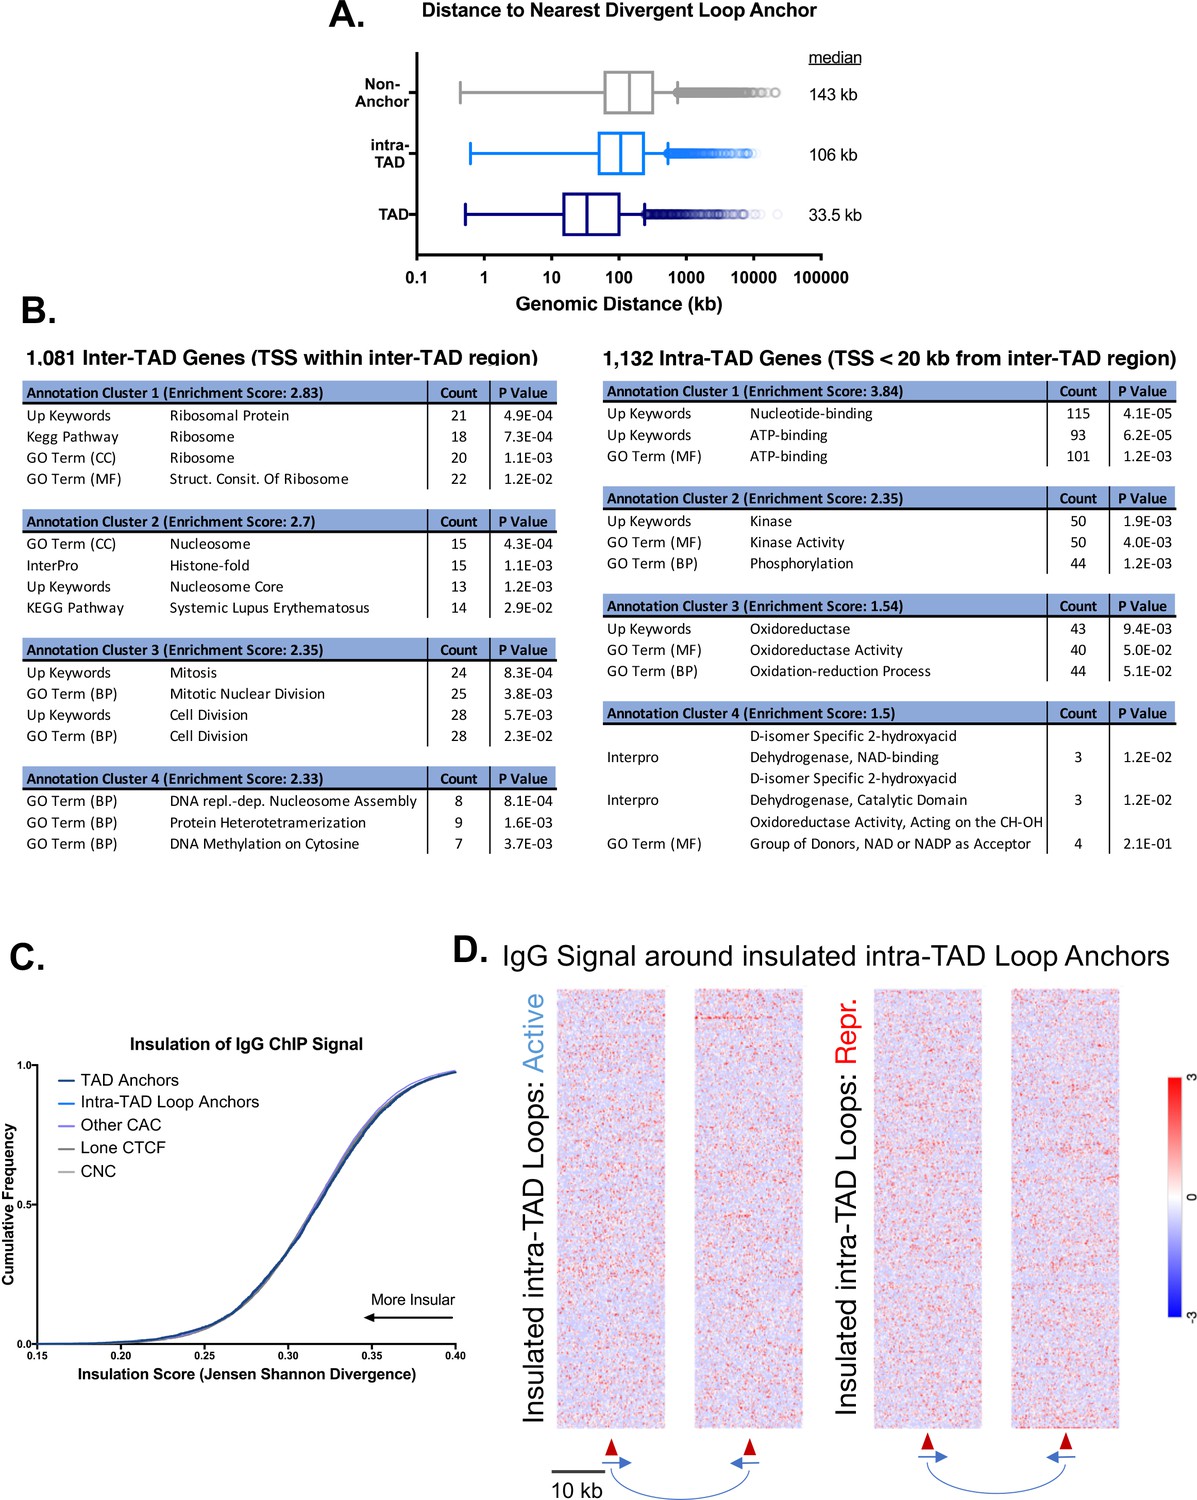
(A) TAD anchors are more proximal to divergently-oriented upstream loop anchors, which may explain their elevated local insulation of chromatin contacts and the more diffuse bidirectional contact enrichment shown in Figure 3C. Numbers to the right of each boxplot indicate the median genomic distance to the nearest TAD/intra-TAD anchor oriented in the opposite direction. (B) Genes whose TSS fall within inter-TAD regions are modestly enriched for housekeeping functions (ribosome, nucleosome, and mitosis) compared to a neighboring gene set whose TSS is found just on the inside (within 20 kb) of the TAD anchors. The distance cutoff of 20 kb was selected to match the test set of 1081 inter-TAD genes to a control set of 1132 intra-TAD genes. Functional annotation clustering was performed using DAVID with high stringency, but otherwise default parameters. (C) Shown is an IgG control for the data presented in Figure 3D. The trend of high insulation of repressive histone marks for loop anchors and low insulation for CNC is not preserved when comparing the presumably random distribution of reads from a control IgG ChIP. This rules out other artefactual phenomena, such as mappability or random antibody pulldown, as contributing factors. The overall insulation scores are higher than indicated in Figure 3D for all groups, which indicates less insulation of IgG ChIP signal compared to H3K27me3. (D) Shown are IgG controls for the data presented in Figure 3E and F. The genomic regions as analyzed in Figure 3E and F do not show an uneven distribution of IgG ChIP reads, which might be expected in the event of mapping differences or other alternative explanations.
Figure 4 with 2 supplements
Categorization of DHS-based regulatory elements in mouse liver.
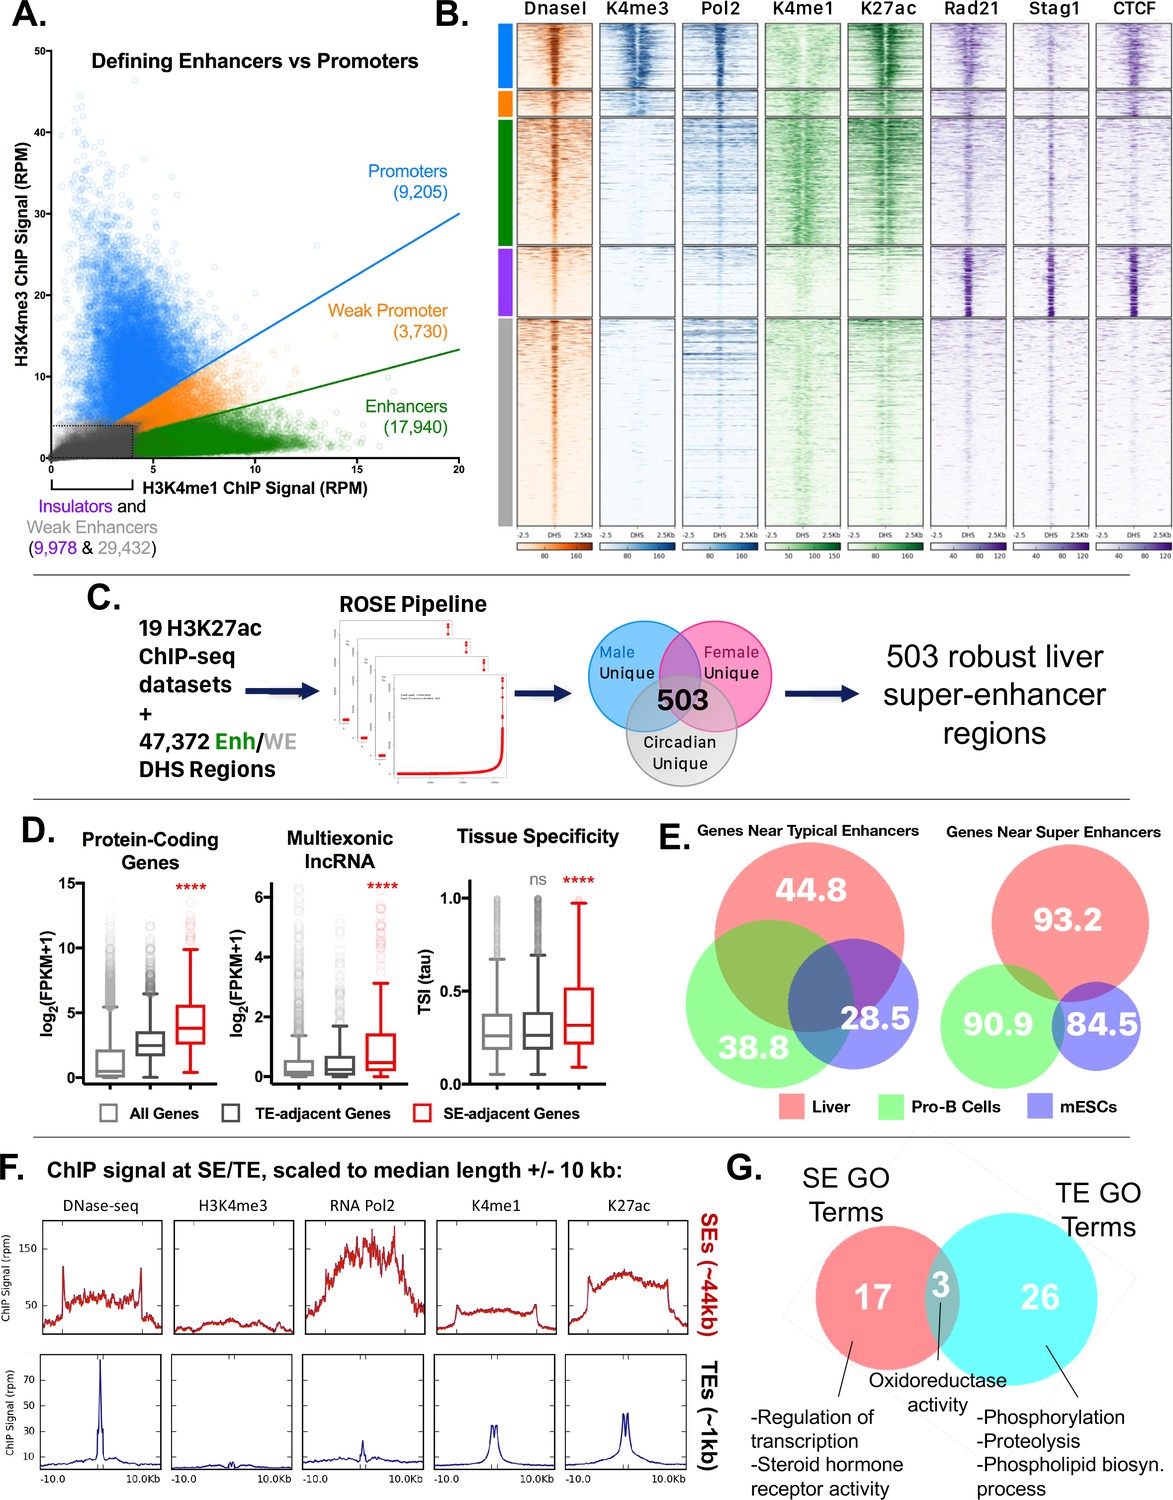
(A) Classification of set of ~70,000 open chromatin regions (DHS) identified in adult male mouse liver, based on relative intensities for a combination of H3K4me1 and H3K4me3 marks, and CTCF ChIP-seq data. Based on the combinatorial signal from these three datasets, five groups of DHS were identified: promoter-DHS, weak promoter-DHS, enhancer-DHS, weak enhancer-DHS, and insulator-DHS, as described in Materials and methods and in Figure 4—figure supplement 1A. (B) Shown is a heatmap representation of the simplified five-class DHS model shown in panel A, which captures features such as CNC enrichment at enhancers and K27ac enrichment at enhancers and promoters, with additional features described in Figure 4—figure supplement 1A. Color bar at the left matches colors used in panel A. (C) Scheme for using 19 published mouse liver H3K27ac ChIP-seq datasets to identify a core set of 503 liver super-enhancers using the ROSE software package (Supplementary file 2B). These 503 super-enhancers were identified in all 19 samples, indicating they are active in both male and female liver, and across multiple circadian time points. Enh, enhancer, WE, weak enhancer. (D) Genes associated with super-enhancers (SE) are more highly expressed (log2(FPKM +1) values) than genes associated with typical enhancers (TE), for both protein coding genes and liver-expressed multi-exonic lncRNA genes. The super-enhancer-adjacent genes are also more tissue specific (higher Tau score) than typical enhancer-adjacent genes. ****, KS t-test, p<0.0001 for pairwise comparisons of SE-adjacent genes vs. TE-adjacent genes. (E) Venn diagrams show substantial overlap between typical enhancer gene targets across tissues (liver, ESCs, ProB cells), but limited overlap between super-enhancer adjacent genes (within 10 kb of the super-enhancer) for the same tissues. The numbers represent the percent of genes targeted in a given tissue by the indicated class of enhancer (typical enhancers or super-enhancers) that are not targets of the corresponding class of enhancers in the other two tissues. For example, 93.2% of genes targeted by liver super-enhancers are not targeted by the set of super-enhancers identified in either Pro-B or mouse ESCs. Gene targets of each enhancer class were identified by GREAT using default parameters, then filtered to keep only those ≤10 kb from the enhancer. (F) ChIP and DNase-seq signal at typical enhancers and super-enhancers, scaled to their median length (1 kb and 44 kb respectively; indicated by distance between hash marks along the x-axis) flanked by 10 kb up- and down-stream. Super-enhancers show much greater accumulation of RNA polymerase 2, despite little or no apparent enrichment for the promoter mark H3K4me3. (G) Super-enhancers (SE) target distinct categories of genes than typical enhancers (TE) in mouse liver. Thus, while GO terms such as oxidoreductase activity are enriched in the set of gene targets for both classes of enhancers, only super-enhancers are enriched for transcription-regulated terms (e.g., Regulation of transcription, Steroid hormone receptor activity) (Supplementary file 2C,D). Numbers represent the overlap of GO terms (either Molecular Function or Biological Process) in any DAVID annotation cluster (with an enrichment score >1.3) enriched for genes regulated by either typical enhancers or super-enhancers.
Figure 4—figure supplement 1
Characteristics of five classes of DHS in mouse liver.
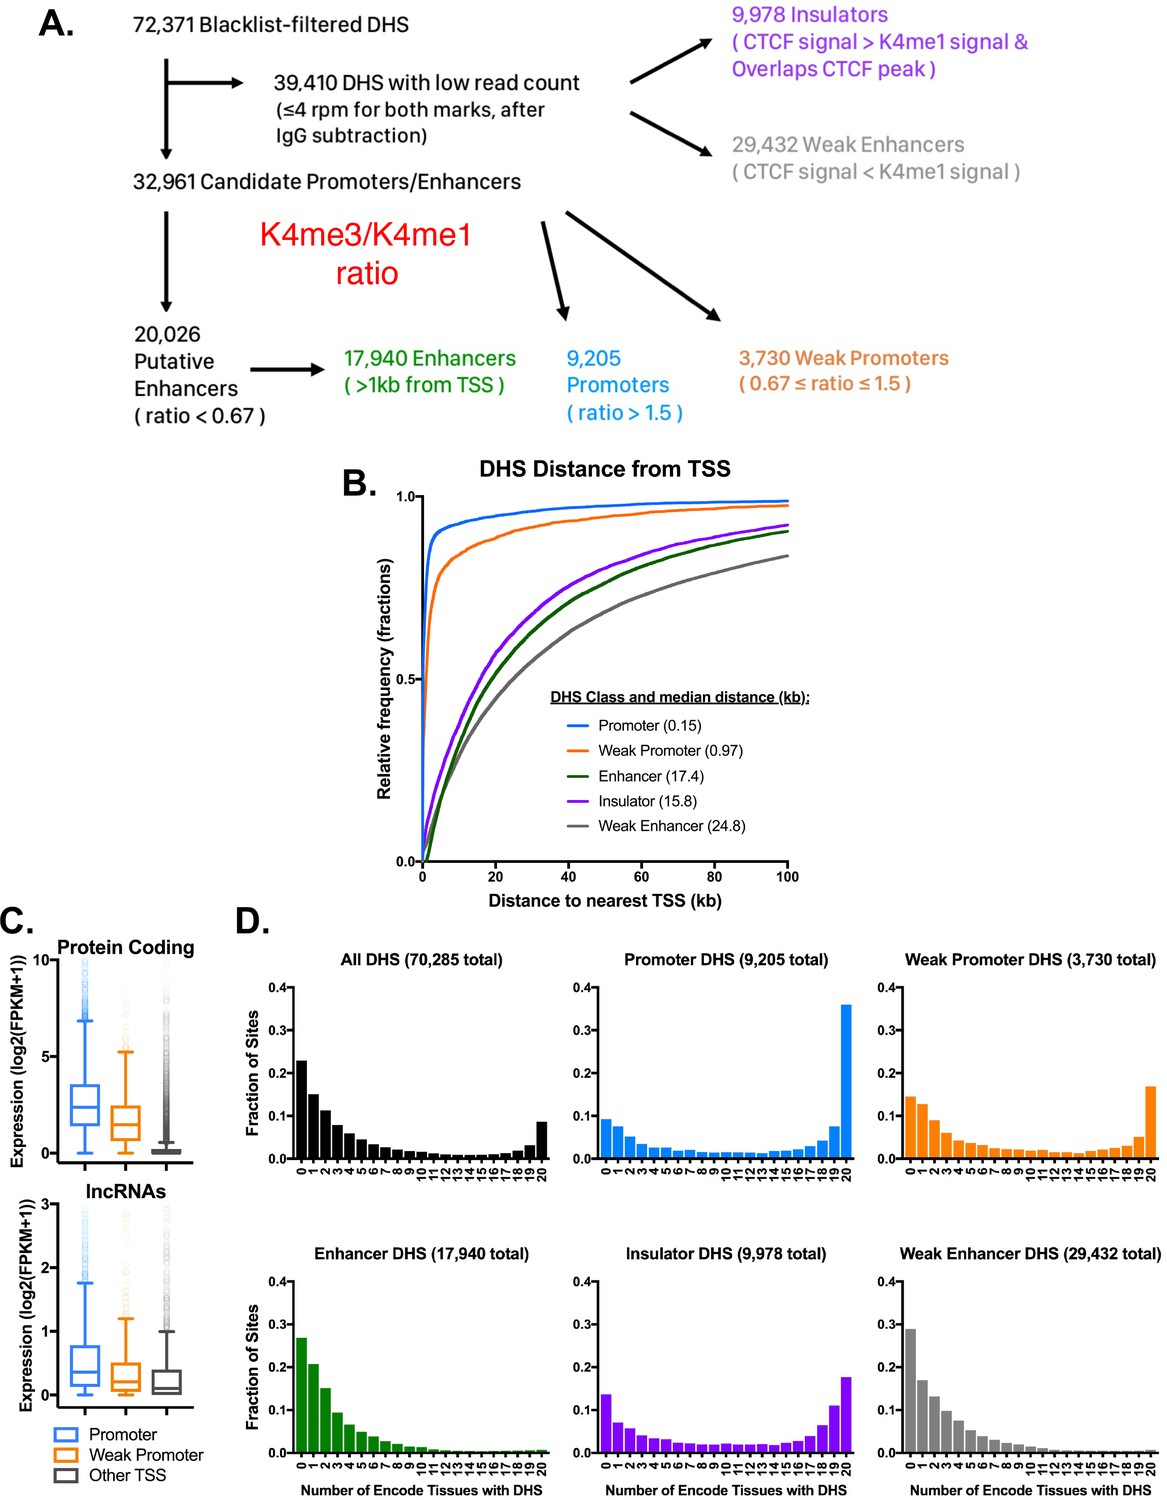
(A) Schematic for the classification of open chromatin regions (DHS) in mouse liver based on their H3K4me1, H3K4me3, and CTCF ChIP-seq signals. DHS with >4 rpm for either H3K4me3 or H3K4me1 were classified based on the ratio of H3K4me3 to H3K4me1 signal, where a high ratio indicates a promoter-like DHS, and a low ratio indicates an enhancer-like DHS regions. For the 39,410 liver DHS with low signal for both histone marks, the H3K4me1 signal was compared to the CTCF signal to classify each DHS. Regions with higher CTCF signal that overlapped a CTCF peak were classified as Insulator-DHS and the remaining group were classified as weak enhancer-DHS (also see Supplementary file 2A). (B) The distance from each of the five DHS classes to the nearest RefSeq TSS. Regions with roughly equal H3K4me3 and H3K4me1 signal were classified as weak promoters based on their proximity to DHS. Similarly, the low signal group (in gray) were classified as weak enhancers based on distance from TSS and low signal for both DNase-seq and H3K4me1 ChIP. (C) Protein coding and lncRNA genes associated with promoter-DHS are both more highly expressed than genes associated with weak promoter-DHS or other TSS without a nearby promoter or weak promoter DHS. All groups are significantly different from one another, (KS test; p<0.001). (D) Tissue specificity of DHS identified in mouse liver. Shown is the fraction of liver DHS that overlap DHS identified in the indicated number of other mouse tissues. Insulator DHS are unique among distal DHS for having a subset that is tissue ubiquitous. Both promoter classes show a significant fraction of sites that are open across all mouse tissues, while the two enhancer classes are much more tissue specific. A value of 0 indicates that the DHS is liver specific, while a value of 20 indicates that it is found in all 20 mouse tissues.
Figure 4—figure supplement 2
Features of super-enhancers and single-TSS intra-TAD loops.
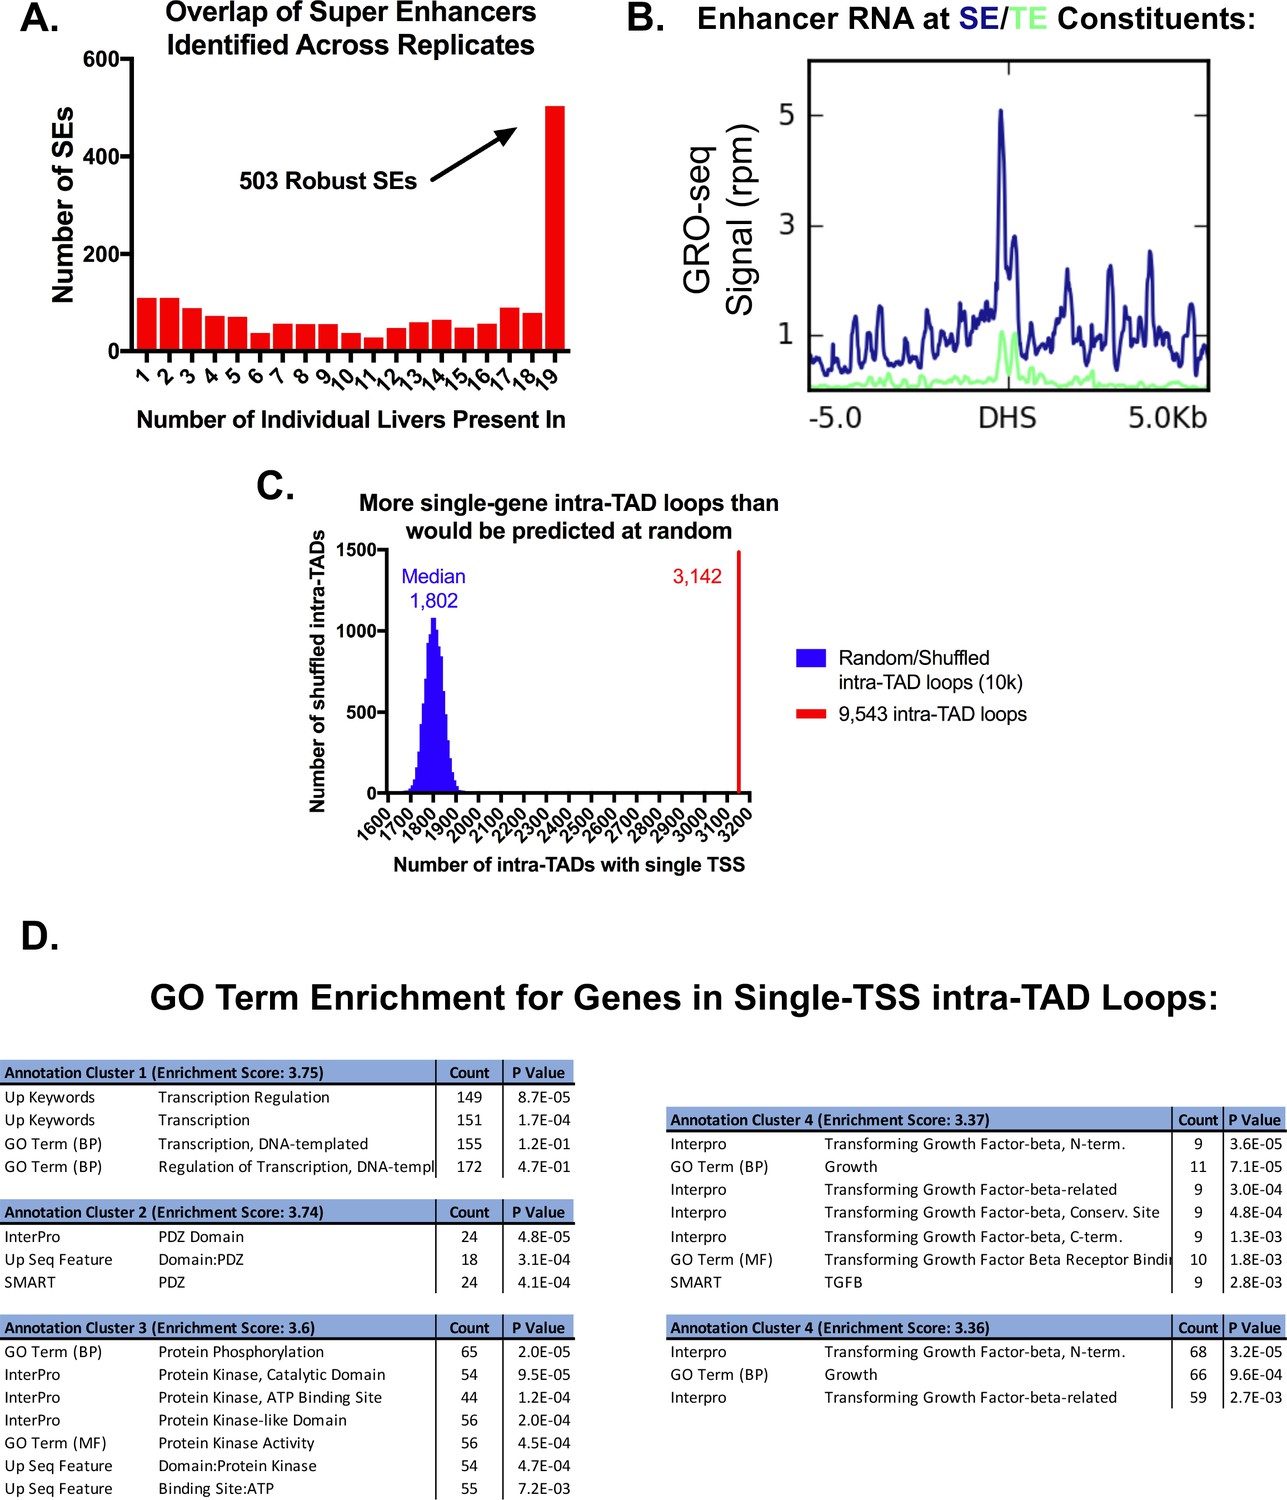
(A) Shown is the overlap of super-enhancers (SE) for all 19 liver H3K27ac ChIP-seq replicates (see Materials and methods). 503 of the super-enhancers were identified in all 19 liver samples, and are termed core (robust) super-enhancers. The x-axis indicates the number of liver samples in which an enhancer cluster exceeded the threshold to be identified as a super-enhancer. (B) Super-enhancer constituents show higher levels of eRNA production than typical enhancers. This is consistent with Figure 4F, which shows greater accumulation of Pol2 but not H3K4me3 than at typical enhancers, suggesting non-promoter transcription. (C) Of the 9543 intra-TAD loops, 3142 (33%) contain a single TSS. This is a higher frequency of single TSS intra-TAD loops than is expected by random chance (expected (median) = 1802 intra-TAD loops across 10,000 shuffled sets). The matched set represents a random list of genomic coordinates of the same size and number. (D) For the set of genes that are in single TSS intra-TAD loops, gene ontology analysis followed by functional annotation clustering revealed an enrichment for transcriptional regulation and kinase activity. Functional annotation clustering was performed using DAVID with high stringency for cluster assignment, but otherwise default parameters.
Figure 5
Impact of intra-TAD loops on gene expression.
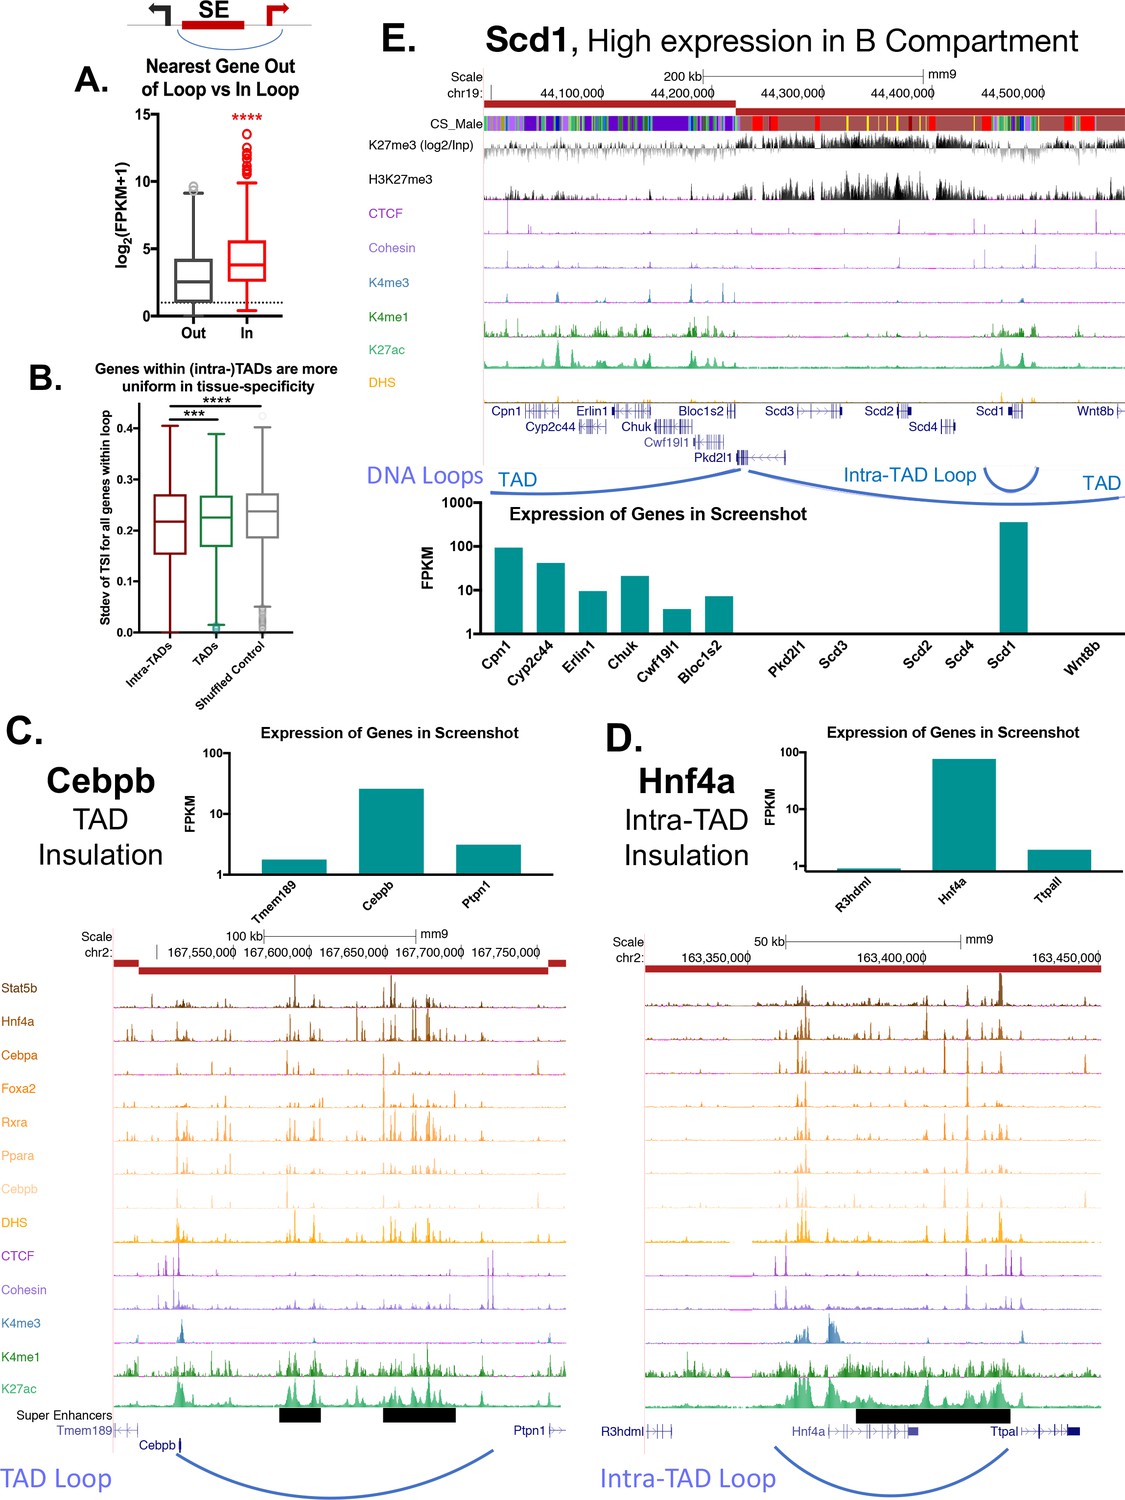
(A) Two possible gene targets were assigned for each super-enhancer within an intra-TAD loop, one target gene for which the TSS is within the intra-TAD loop and another target gene for which the TSS is outside of the intra-TAD loop but is within 25 kb of the intra-TAD loop anchor. Box plots show that gene targets within an intra-TAD loop are significantly more highly expressed than the alternative, linearly more proximal, gene target. (B) Shown is the standard deviation in Tau values (tissue-specificity index) of genes whose TSS’s are within TADs or intra-TAD loops that contain at least three TSS. Genes within intra-TAD loops tend to be more uniformly tissue-specific or tissue-ubiquitous when compared to all genes within TADs, or when compared to a shuffled set of random regions matched in size to intra-TADs. Thus, sets of three or more genes within intra-TAD loops are consistently either more or less tissue specific than random clusters of genes within the same sized genomic spans. (C–D) TAD and intra-TAD loops insulate a subset of super-enhancers (black horizontal bars) with key liver genes, allowing high expression of genes such as the TFs Cebpb and Hnf4a, relative to their immediate neighbors. Cebpb is an example at the TAD scale, while Hnf4a shows an intra-TAD loop. In both cases, the most linearly proximal gene is outside the TAD or intra-TAD loop and is expressed at a lower level than the loop-internal genes (and presumptive gene target). (E) Shown is a UCSC genome browser screenshot of a transition from an active to a repressed TAD, with the expression of genes within the region shown in a bar graph, below. Insulated intra-TAD loops allow for expression of select gene targets within otherwise repressed genomic compartments. The obesity-related gene Scd1 is insulated in an intra-TAD loop and is the only liver expressed gene in its TAD (FPKM >100). H3K27me3 marks are shown both as reads per million signal track (below) and as signal over an IgG input control (above), expressed as log2[(H3K27me3 signal) / (Input signal)].
Figure 6 with 1 supplement
Alb 4C-seq exemplifies intra-TAD insulation and super-enhancer interaction.
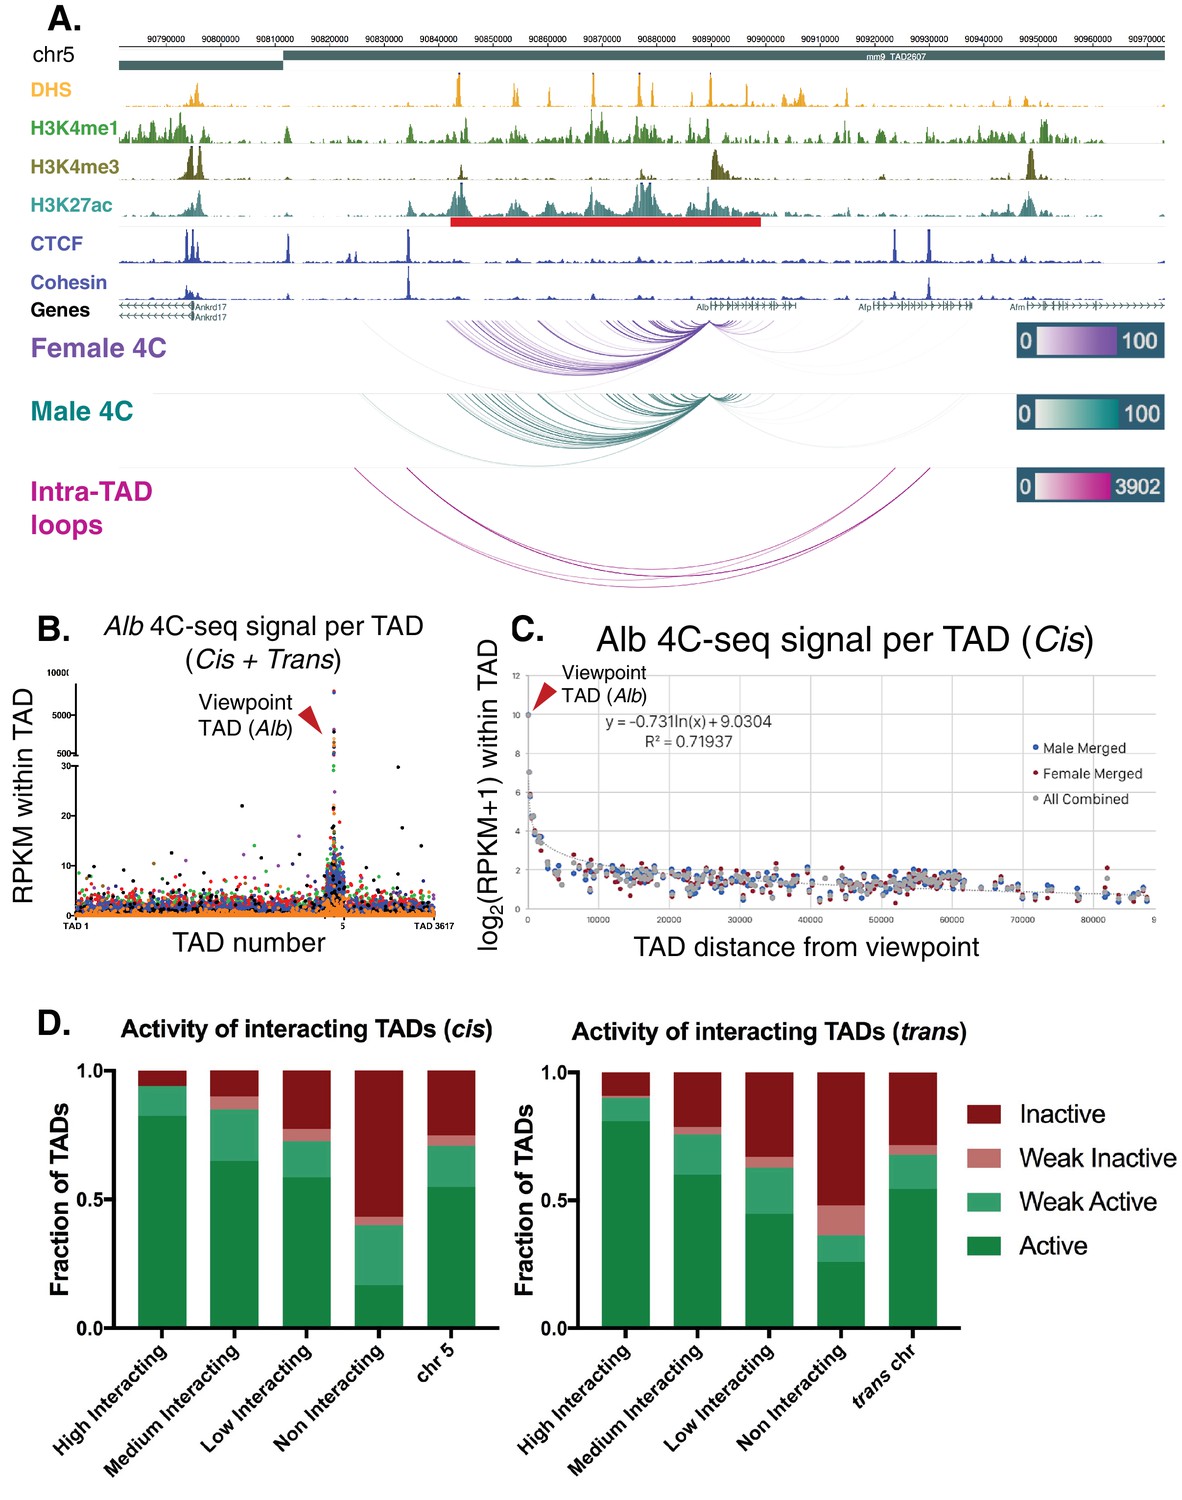
(A) The Alb promoter makes multiple directional contacts with the adjacent super-enhancer region in both male and female mouse liver, as determined by 4C-seq with a viewpoint at the Alb promoter. All reproducible interactions occur within the TAD loop containing the Alb TSS and its super-enhancer (red bar beneath H3K27ac track), and all but two contacts in male liver occur within the predicted intra-TAD loops (pink). 4C-seq interaction scores are shown as –log10(pval) values across replicates, as calculated by R3C-seq (see Materials and methods). Also see Figure 6—figure supplement 1. (B) The 4C-seq interaction signal within the Alb TAD is orders of magnitude above the background signal and generally decays with distance. Far-cis and trans interactions are represented on a per TAD basis, expressed as RPKM per TAD, to control for sequencing depth and TAD length. The overall background within mouse chromosome five is significantly higher than all trans chromosomes; immediately adjacent TADs also show higher 4C-seq signal than the overall cis background. The 4C-seq signal decayed to background levels within ~3 TADs of the Alb viewpoint TAD. Each data point represents a single TAD and each color represents a 4C-seq replicate. (C) Background model used for distal cis interactions, showing a rapid decay in per TAD signal intensity. Each data point represents a single TAD along chromosome 5. (D) Distal cis and trans TADs that highly interact with the Alb promoter tend to be active TADs, while a majority of the TADs that interact less than the background model are predicted to be inactive. A simple inverse logarithmic decay of signal per TAD was used to determine the background signal along the cis chromosome, while the 4Cker package was used to determine high, medium, low, and non-interacting TADs in trans based on a hidden markov model with adaptive windows better suited for low signal regions.
Figure 6—figure supplement 1
Alb 4C-seq replicates and cis/trans 4C-seq signal distribution.
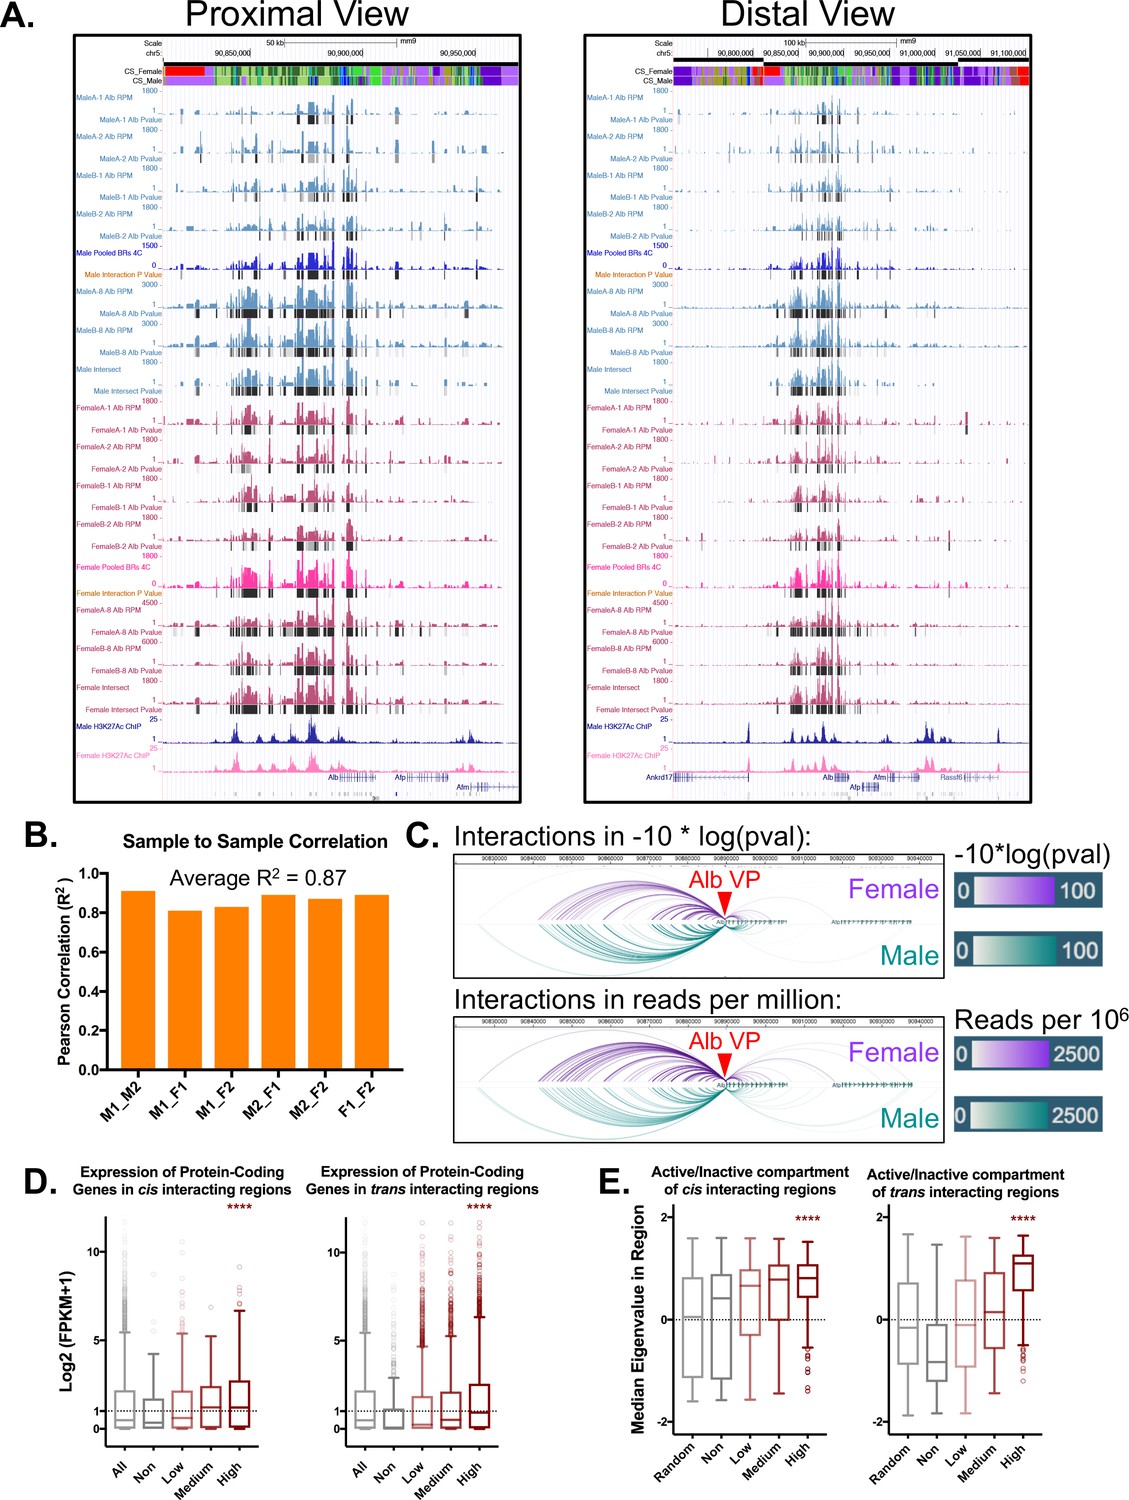
(A) UCSC genome browser screenshots for all biological replicates. The proximal view shows a 150 kb window around the Alb TSS, while the distal view shows a 400 kb view around the Alb TSS. For each sample, the colored track indicates normalized interactions for that region with the viewpoint (Alb promoter) in reads per million. The black bars below the colored signal track are interactions identified by the R3C-seq pipeline, expressed as a –10log of the p-value. (B) Alb promoter interactions are highly reproducible, with an average R2 of 0.87 between pairs of biological replicates between individual male (M) and female (F) mouse livers, as indicated on the x-axis. (C) Interactions originating from the Alb promoter viewpoint show no major apparent sex differences between male and female liver samples. This is visualized both in terms of strength of interaction (−10*log(pval), as above) as well as normalized read depth (reads per million, below). (D) The expression of protein-coding genes within non-, low, medium, or high interacting TADs in cis or trans, expressed as log2(FPKM +1) values. Genes in highly interacting TADs are more highly expressed compared to non-interacting TADs or the genome wide/cis control (p<0.001; KS t-test). This fits with the transcription factory model of compartment organization, as one would expect highly active regions to weakly associate in hubs of active transcription. Genes in TADs that are not interacting with the Alb promoter show the lowest expression of all groups. Shown for comparison is the expression of all genes on chromosome 5 (cis) and also genome-wide (trans). (E) Median eigenvalues within cis or trans non-, low, medium, or high interacting TADs. A positive value indicates a more open/active chromatin compartment (‘A type’), while a negative value indicates a more closed/inactive chromatin compartment (‘B type’). The highest interacting TADs show higher eigenvalues than the background or non-interacting TADs (p<0.001; KS test). Only trans non-interacting TADs show a consistent negative median eigenvalue, indicating a repressed compartment.
Additional files
-
Source Code 1
All code used for the prediction of intra-TAD loops and additional custom scripts.
- https://doi.org/10.7554/eLife.34077.023
-
Supplementary file 1
Intra-TAD loop and CTCF coordinates relevant to Figures 1–3.
- https://doi.org/10.7554/eLife.34077.024
-
Supplementary file 2
Mouse liver DHS and Super-enhancer information relevant to Figure 4.
- https://doi.org/10.7554/eLife.34077.025
-
Supplementary file 3
Genes and GO term enrichments for genes at refined TAD boundaries and in intra-TADs.
- https://doi.org/10.7554/eLife.34077.026
-
Supplementary file 4
Publicly available datasets used and qPCR primers used to validate CTCF/Rad21 ChIPs.
- https://doi.org/10.7554/eLife.34077.027
-
Transparent reporting form
- https://doi.org/10.7554/eLife.34077.028
Download links
A two-part list of links to download the article, or parts of the article, in various formats.
Downloads (link to download the article as PDF)
Open citations (links to open the citations from this article in various online reference manager services)
Cite this article (links to download the citations from this article in formats compatible with various reference manager tools)
Computational prediction of CTCF/cohesin-based intra-TAD loops that insulate chromatin contacts and gene expression in mouse liver
eLife 7:e34077.
https://doi.org/10.7554/eLife.34077


