Gene family innovation, conservation and loss on the animal stem lineage
- Howard Hughes Medical Institute, University of California, Berkeley, United States
- Sorbonne Universités, UPMC Univ Paris 06, CNRS UMR 7144, Adaptation et Diversité en Milieu Marin, Équipe EPEP, Station Biologique de Roscoff, France
- University of California, San Francisco, United States
- Gladstone Institutes, United States
Figures
Figure 1 with 3 supplements

Representative choanoflagellates analyzed in this study.
Choanoflagellates have diverse morphologies, including single cells, multicellular colonies, and the production in some lineages of extracellular structures. (a) Diaphanoeca grandis, within a silica-based extracellular structure called a ‘lorica’. (b) Acanthoeca spectabilis, within lorica. (c) Codosiga hollandica, with a basal organic stalk. (d) A rosette colony of Salpingoeca rosetta; image courtesy of Mark Dayel. (e) Salpingoeca dolichothecata, within an organic extracellular structure called a ‘theca’. (f) Mylnosiga fluctuans, with no extracellular structure. (g) Didymoeca costata, within lorica. (h) Salpingoeca helianthica, within theca. (h’) A rosette colony of S. helianthica. All scale bars represent 5 µm. Prey bacteria are visible in most panels as small black dots. Images of all choanoflagellate species sequenced in this study can be found in Figure 1—figure supplement 1.
Figure 1—figure supplement 1
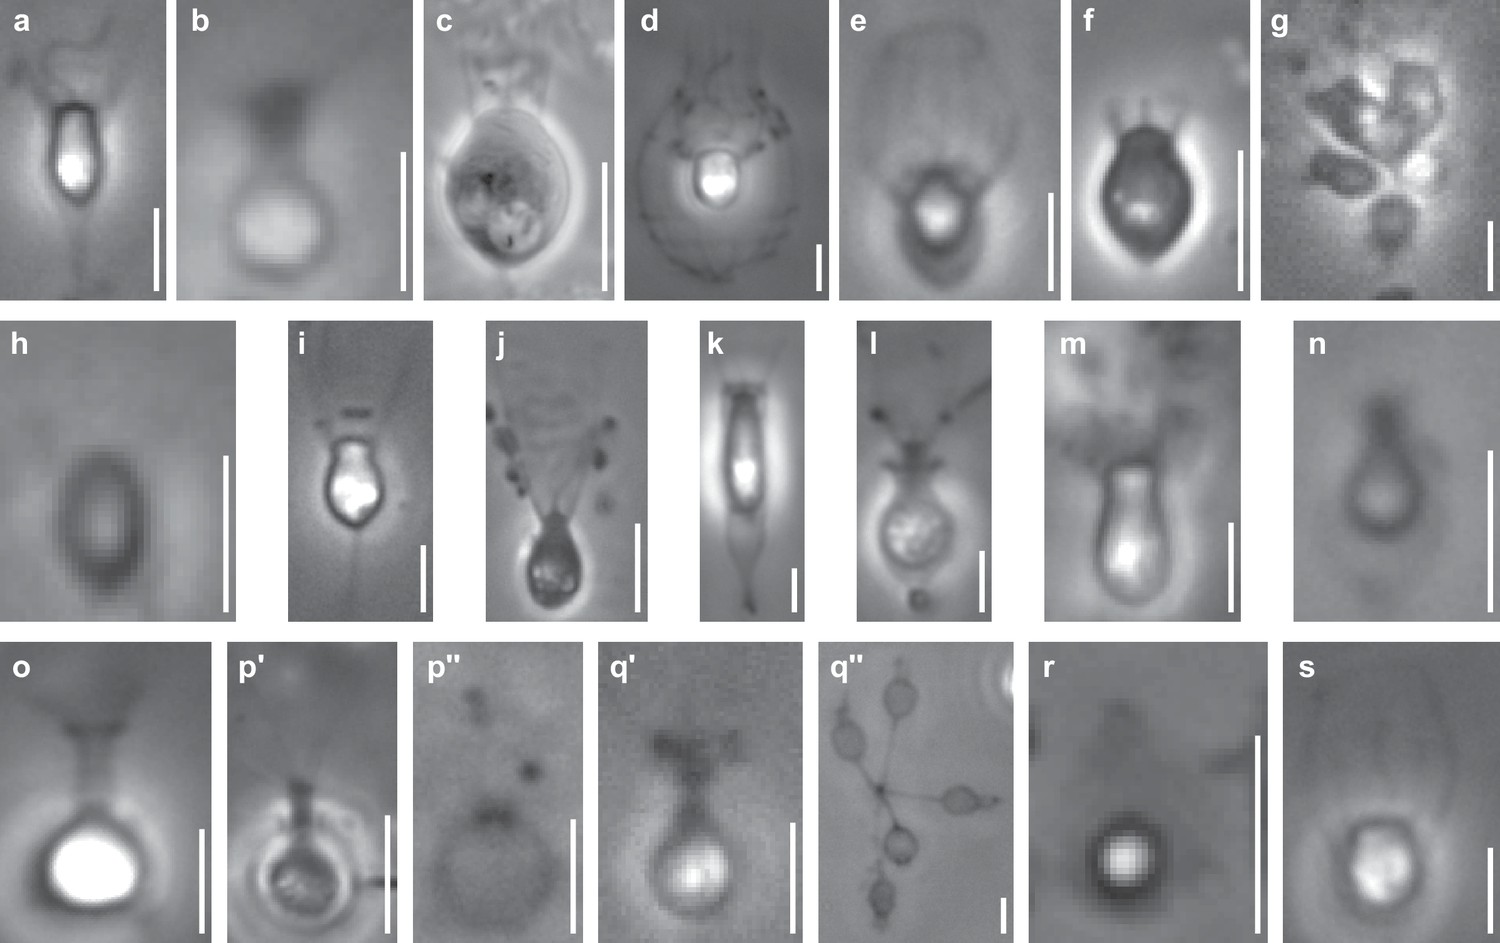
Phase contrast images of species sequenced in this study.
All scale bars are 5 µm. (a) Acanthoeca spectabilis, a nudiform loricate. (b) Choanoeca perplexa, a thecate craspedid. (c) Codosiga hollandica, a naked stalked craspedid. (d) Diaphanoeca grandis, a tectiform loricate. (e) Didymoeca costata, a tectiform loricate. (f) Hartaetosiga balthica, a naked stalked craspedid. (g) Hartaetosiga gracilis, a naked stalked craspedid; the image shows a colony of cells attached to the same stalk. (h) Helgoeca nana, a nudiform loricate. (i) Microstomoeca roanoka, a thecate craspedid. (j) Mylnosiga fluctuans, a naked craspedid. (k) Salpingoeca dolichothecata, a thecate craspedid. (l) Salpingoeca helianthica, a thecate craspedid. (m) Salpingoeca infusionum, a thecate craspedid. (n) Salpingoeca kvevrii, a thecate craspedid. (o) Salpingoeca macrocollata, a thecate craspedid. (p) Salpingoeca punica, a thecate craspedid; p’ represents a live cell within its theca, and p’’ an empty theca. (q) Salpingoeca urceolata, a thecate craspedid; q’ represents a live cell within its theca, and q’’ a group of empty thecae joined at the bases of their stalks. (r) Savillea parva, a nudiform loricate. (s) Stephanoeca diplocostata, a tectiform loricate. See (Leadbeater, 2015; Richter and Nitsche, 2016) for descriptions of choanoflagellate groups and their extracellular structures.
Figure 1—figure supplement 2
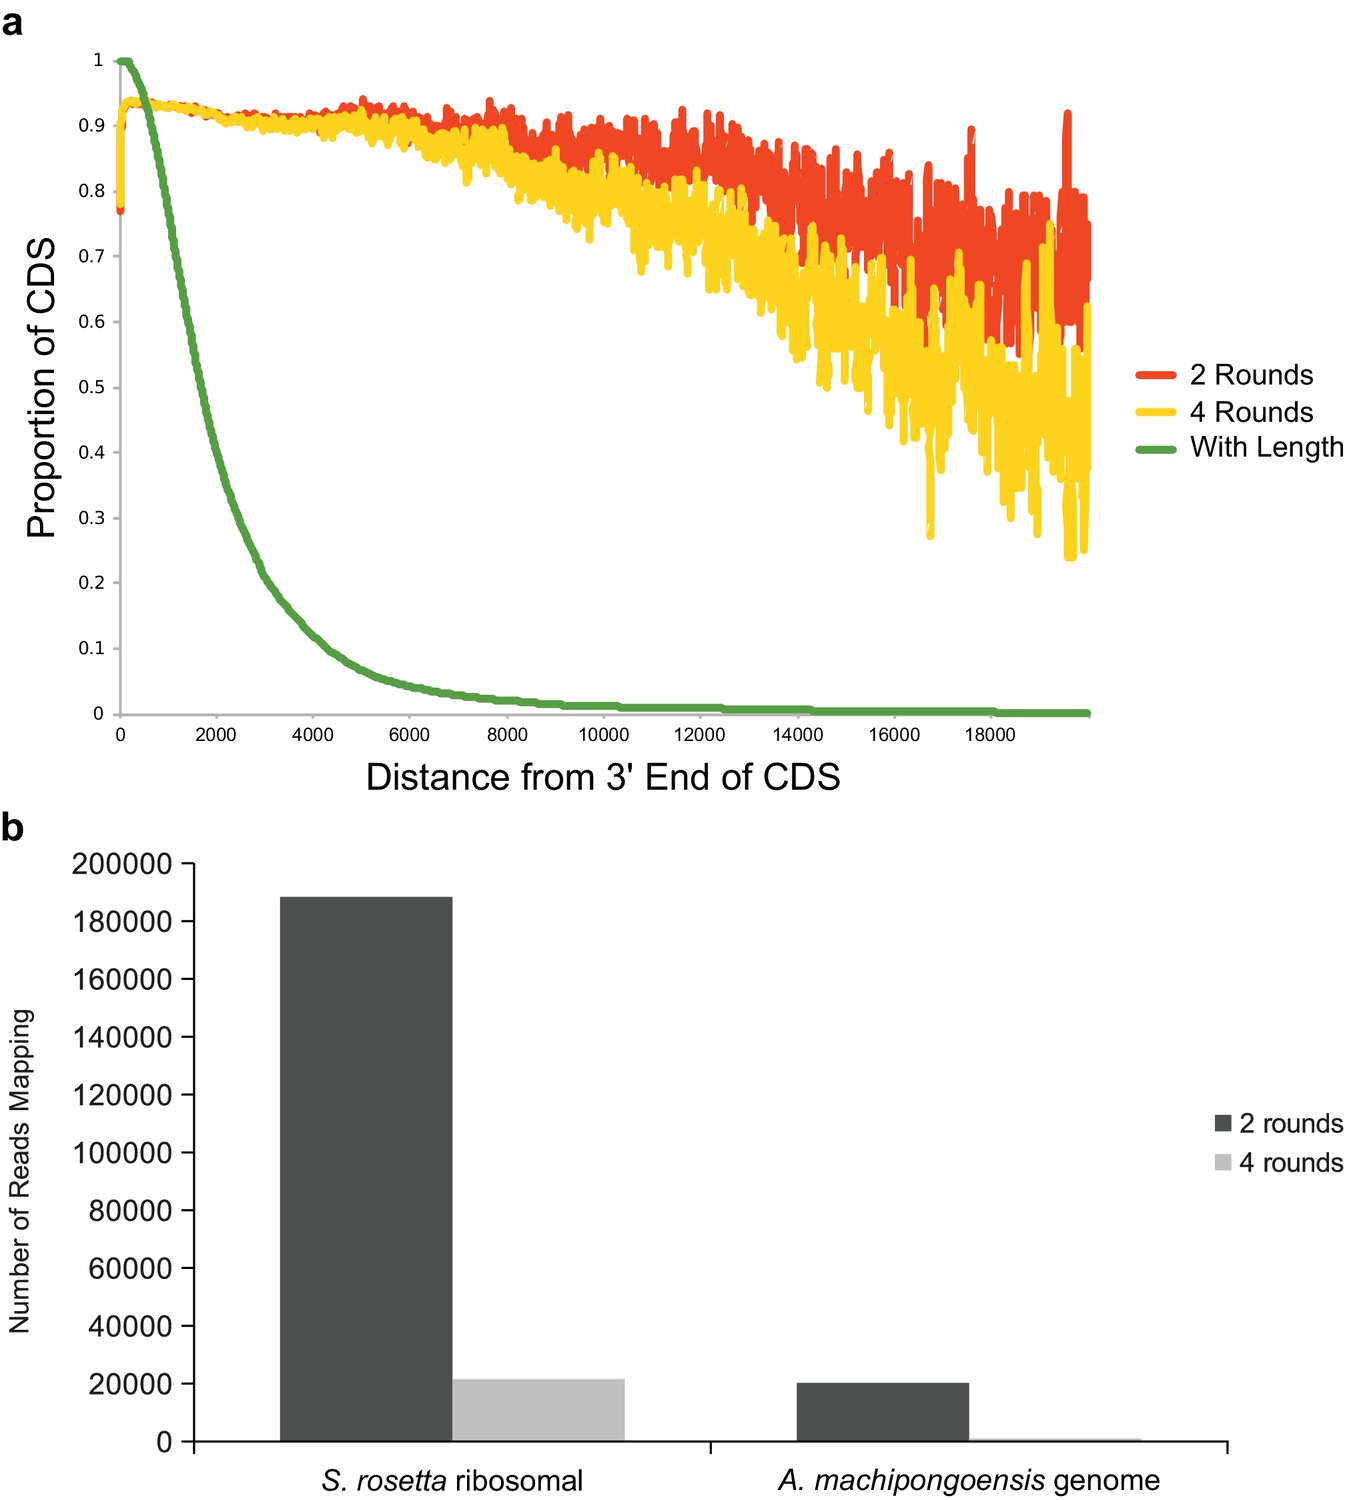
Tests of two versus four rounds of polyA selection.
(a) An additional two rounds of polyA selection does not result in significant loss of read coverage at the 5’ ends of transcripts. The proportion of transcripts with at least one sequence read mapping at each given distance from their 3’ ends is plotted for two rounds (orange) and four rounds (yellow) of polyA + selection. Also shown is the proportion of total transcripts in the S. rosetta genome at each length (green). There is a difference between the two round and four round coverage beginning at approximately 10,000 bases from the 3’ end of transcripts, but this represents only a very small fraction of total transcripts encoded in the S. rosetta genome. Furthermore, for the four round treatment, 93% of the genes predicted in the S. rosetta genome (green line) are represented in its transcriptome over at least 90% of their length (yellow line). (b) The number of S. rosetta reads mapping either to the S. rosetta ribosomal locus or to the genome of its prey bacterium, A. machipongoensis (neither of which produces polyadenylated transcripts), after either two rounds or for rounds of polyA selection. Four rounds of polyA selection removes roughly an order of magnitude more non-polyadenylated RNA.
Figure 1—figure supplement 3
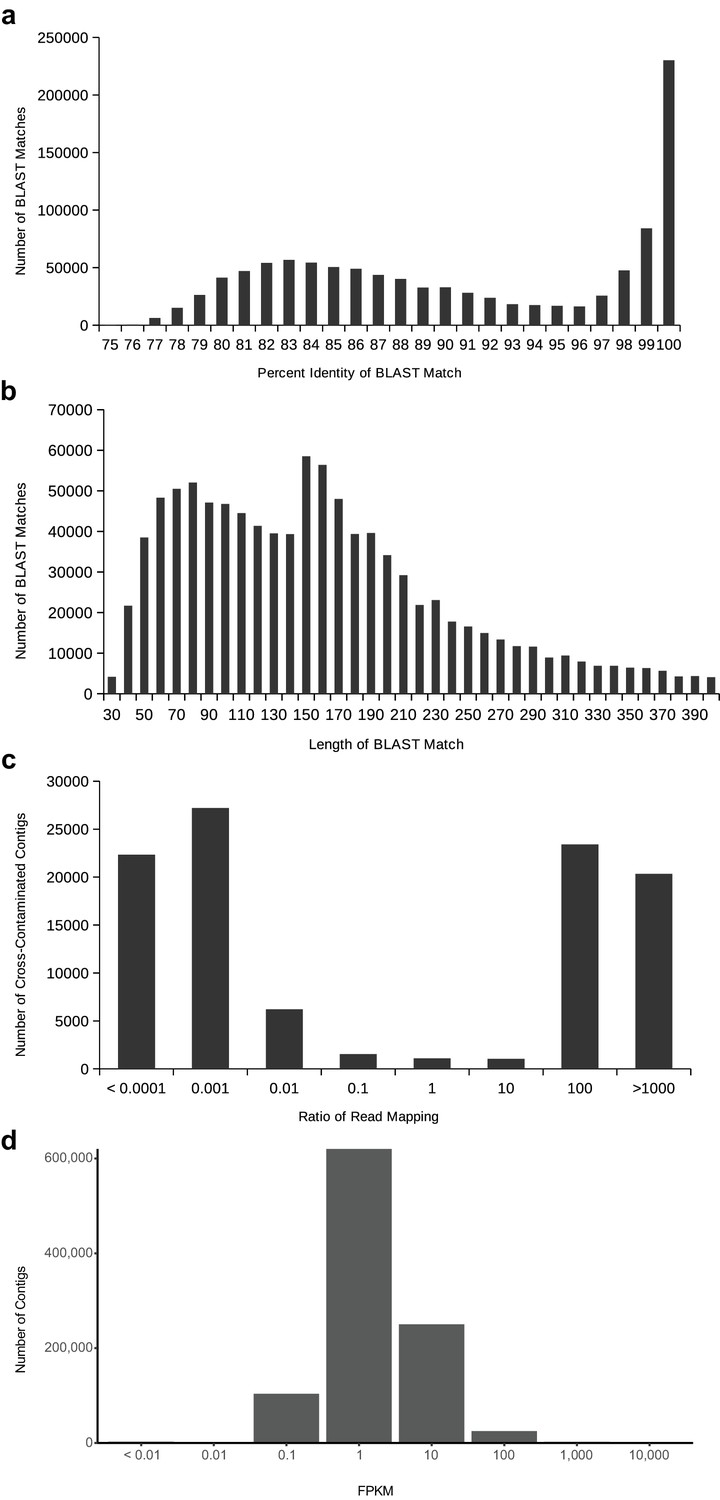
Distributions to establish thresholds within the cross-contamination removal process (a–c) and to eliminate noise contigs by FPKM (d).
(a) The distribution of BLAST percent identities between contigs of different species. On the right, towards 100%, are cross-contaminants occurring on the flow cell due to library index misreading. On the left, around roughly 83%, a broader distribution from conserved homologous sequences. (b) The distribution of BLAST match lengths between contigs of different species. The peak at 150 is due to the minimum contig length of transcriptome assembly. (c) The distribution of read mapping ratios between pairs of contigs that meet the BLAST criteria to be considered putatively cross-contaminated, on a log10 scale. The vast majority of contigs can be easily identified as coming from one species of the pair based on read mapping ratio. (d) The distribution of FPKM values for all contigs in all transcriptome assemblies (after removal of cross-contamination), on a log10 scale.
Figure 2 with 12 supplements
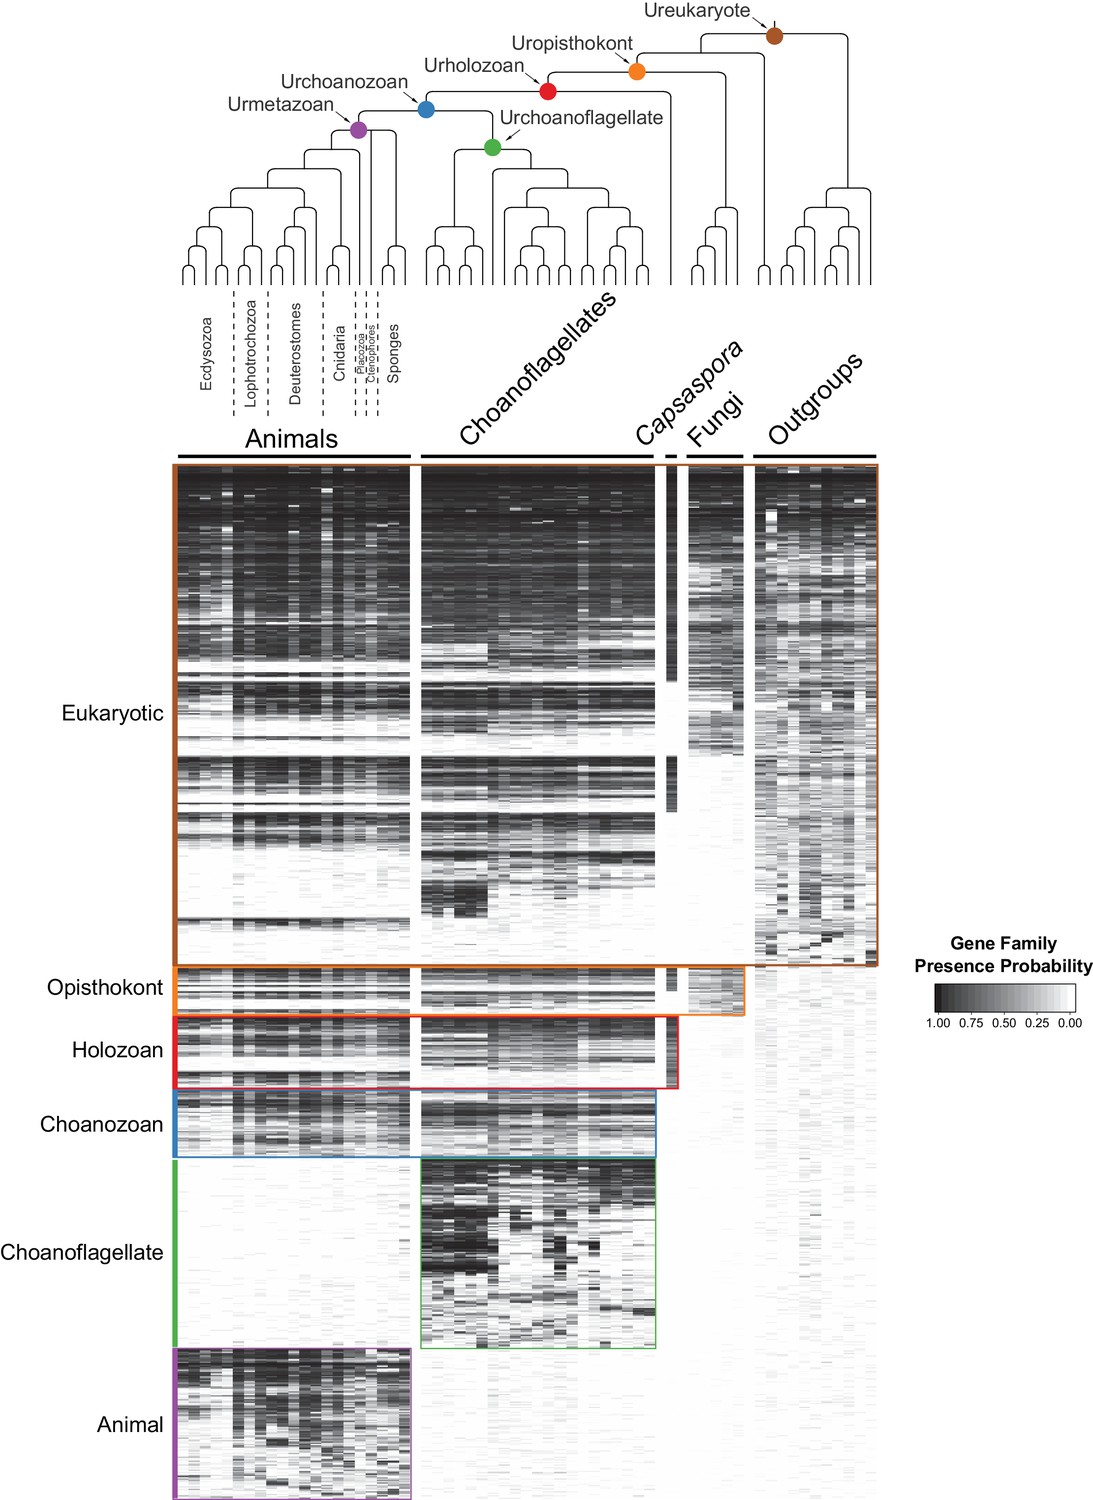
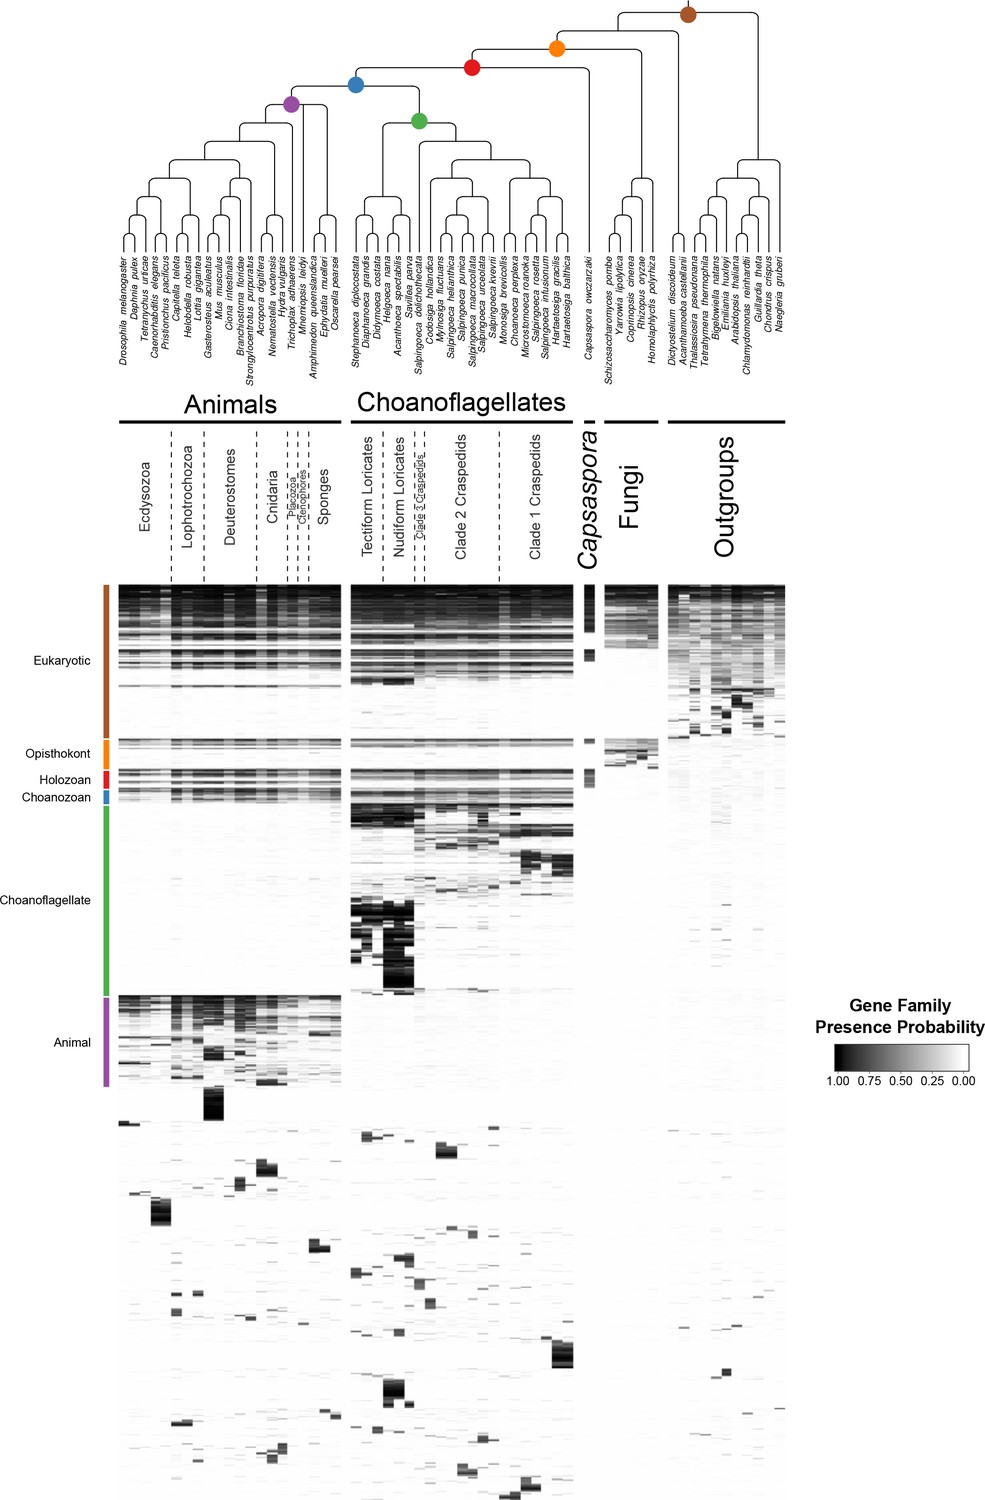
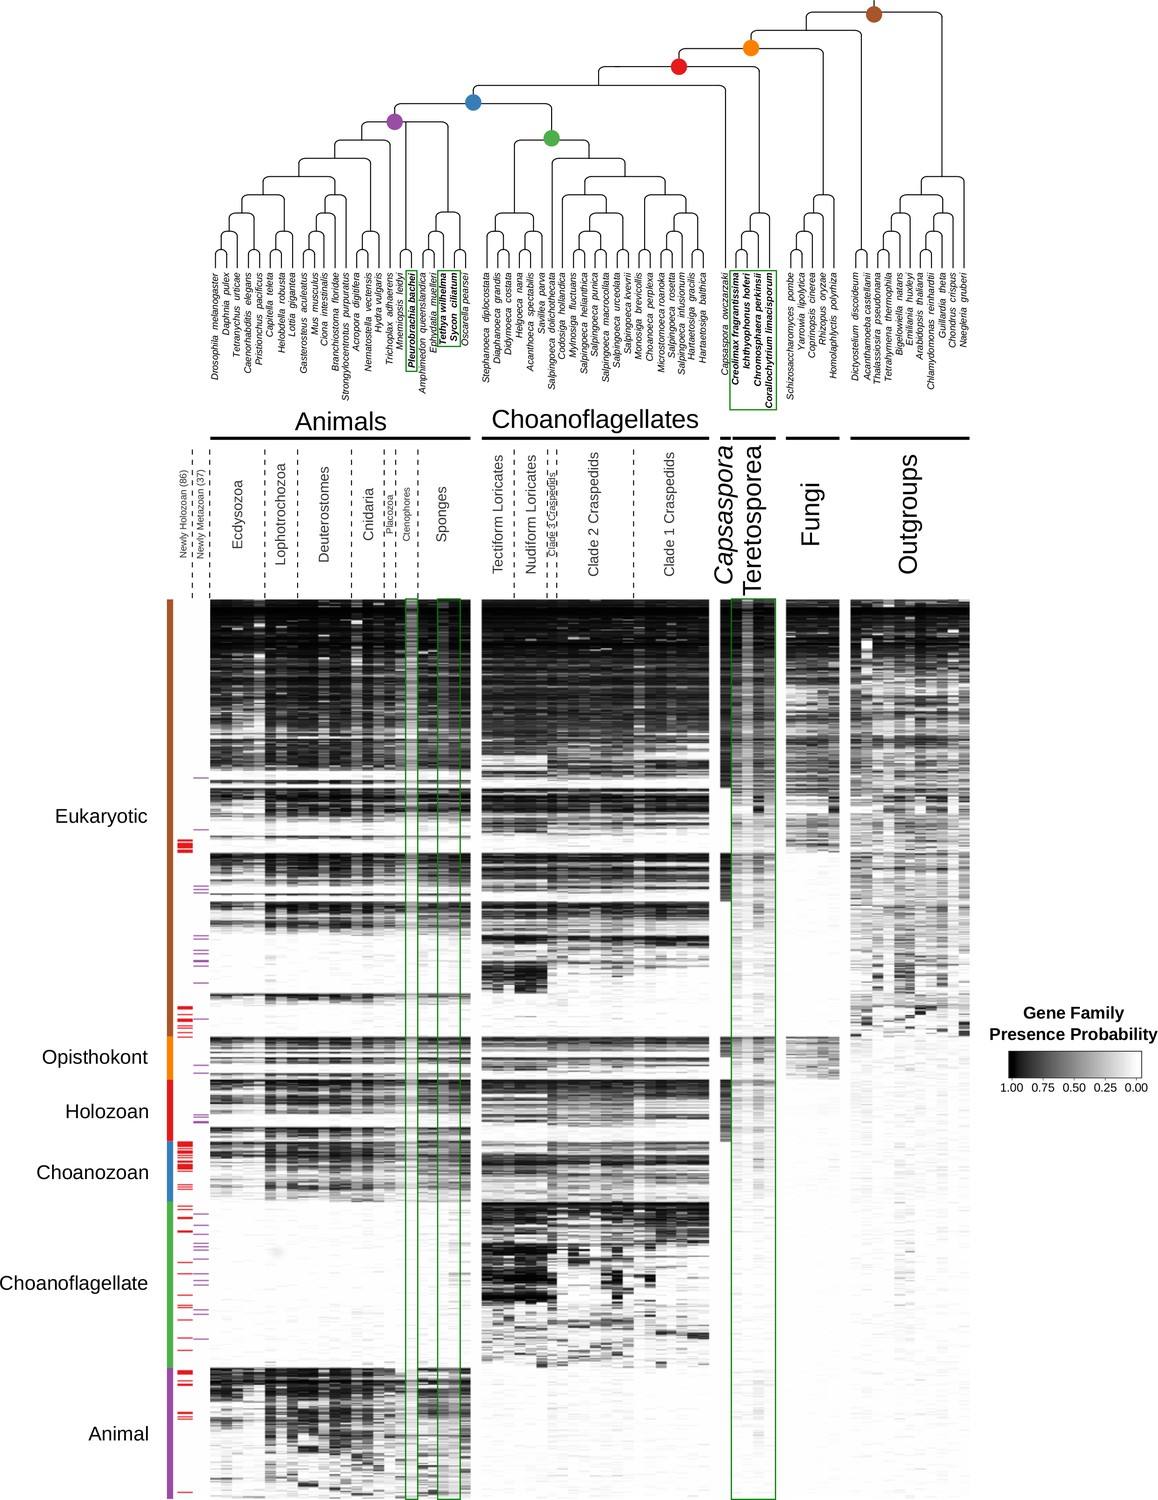
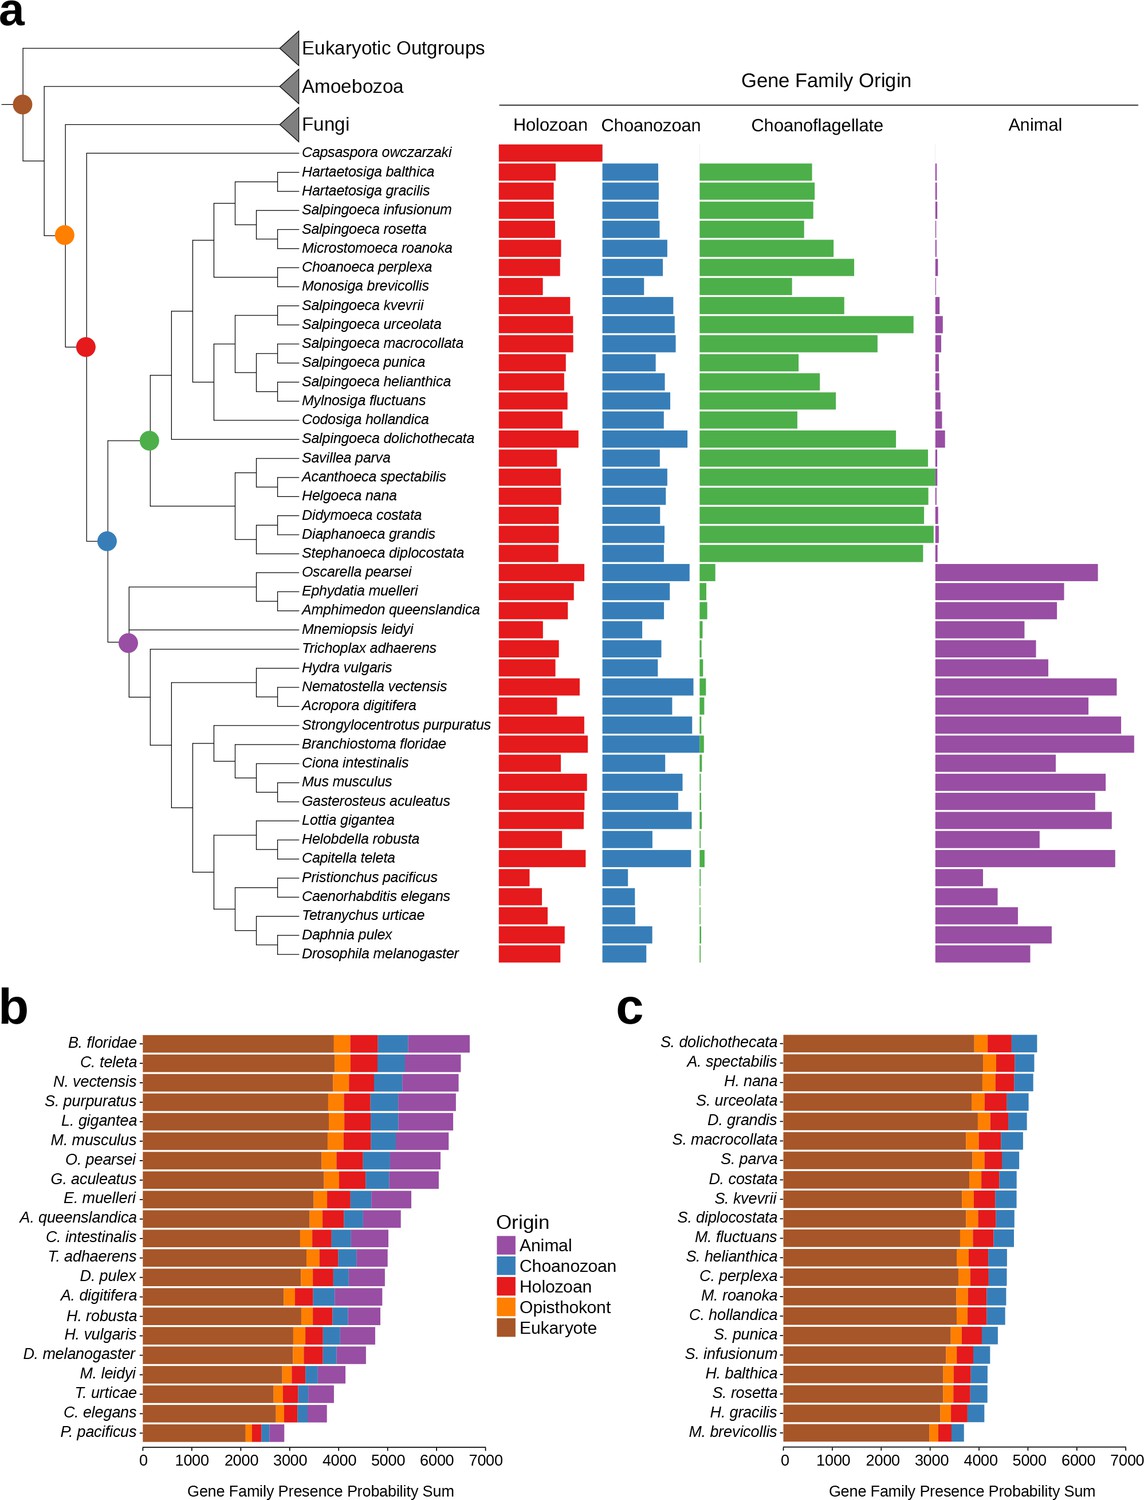
The evolution of gene families in animals, choanoflagellates and their eukaryotic relatives.
Top, a consensus phylogeny (Philippe et al., 2009; Burki et al., 2016; Carr et al., 2017) of the species whose gene contents were compared. Each colored node represents the last common ancestor of a group of species. Bottom, a heat map of the 13,358 orthologous gene families inferred to have been present in at least one of six nodes representing common ancestors of interest: Ureukaryote, Uropisthokont, Urholozoan, Urchoanozoan, Urchoanoflagellate, and Urmetazoan (the full heat map for all gene families is shown in Figure 2—figure supplement 4). Each row represents a gene family. Gene families are sorted by their presence in each group of species, indicated by colored bars and boxes (eukaryotes, opisthokonts, holozoans, choanozoans, choanoflagellates and animals) and subsequently clustered within groups by uncentered Pearson correlation.
-
Figure 2—source data 1
Phylogenetic trees (in phyloXML format) used to test for contamination of choanoflagellate transcriptomes with animal sequences.
Seven protein-coding genes are represented: actin, alpha tubulin, beta tubulin, EF-1A, EFL, HSP70 and HSP90. Each tree includes the top three hits to each species in our database. Branches with bootstrap support below 50 are collapsed.
- https://doi.org/10.7554/eLife.34226.020
Figure 2—figure supplement 1
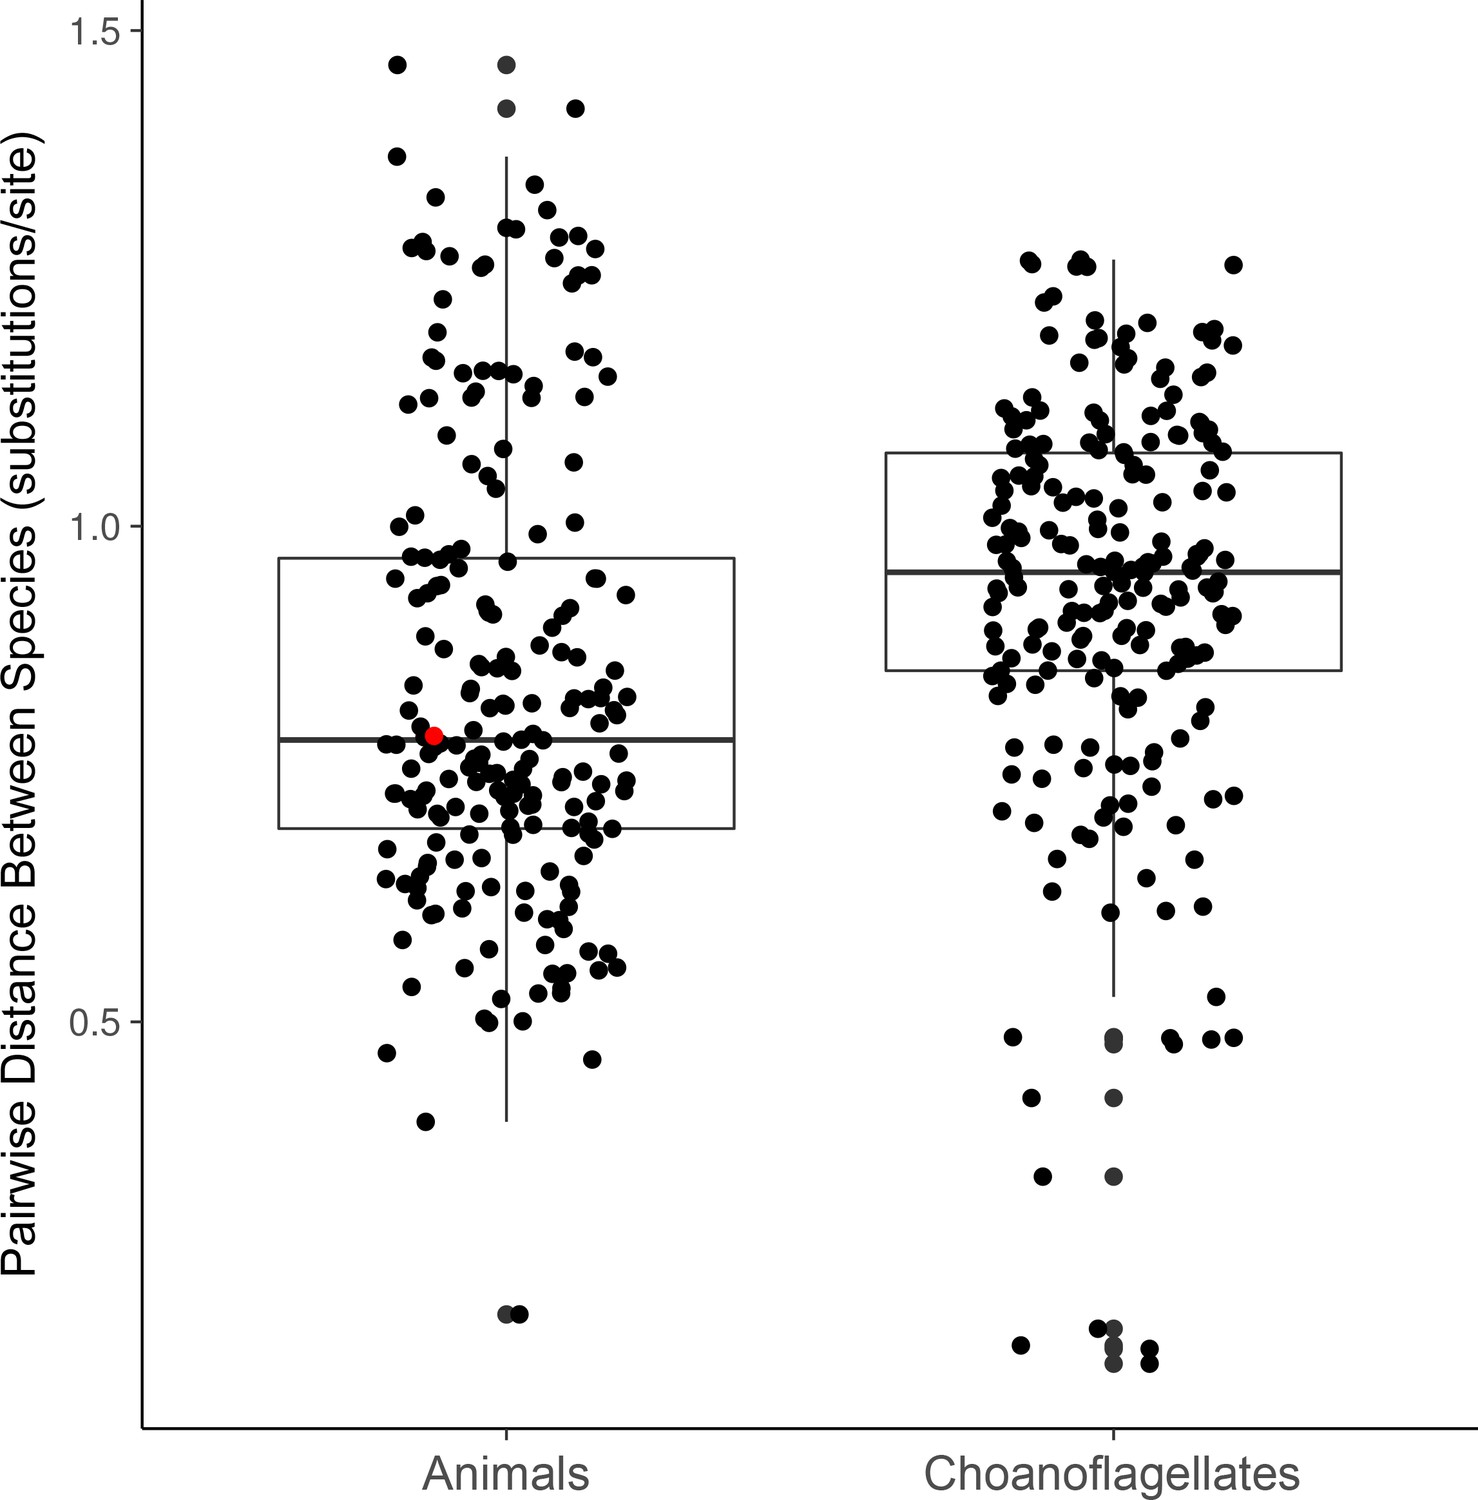
Distributions of phylogenetic diversity within choanoflagellates and within animals in our data set.
Phylogenetic diversity is calculated as the average cophenetic distance (i.e., along branch lengths) between each pair of species from 49 separate phylogenetic trees constructed for conserved genes (Materilas and methods). The red dot marks the cophenetic distance between the mouse Mus musculus and the sponge Amphimedon queenslandica.
Figure 2—figure supplement 2
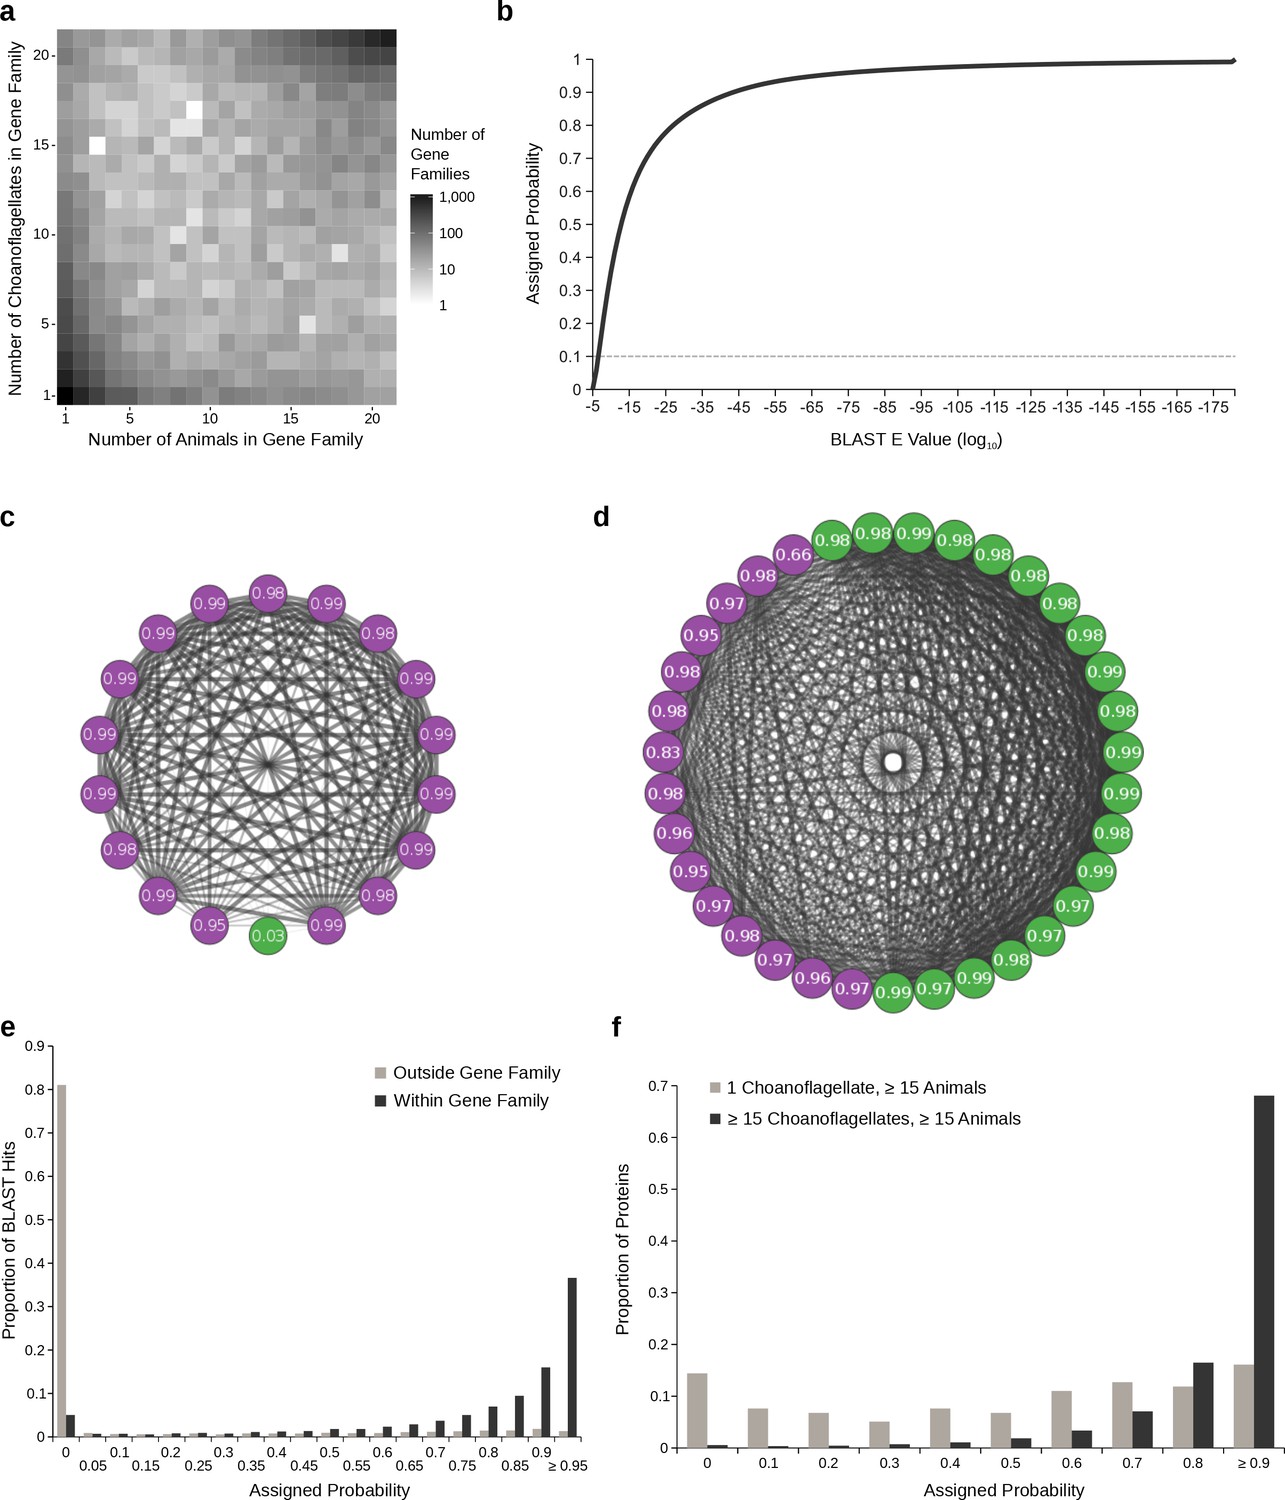
Gene family presence probabilities.
(a) Joint distribution of the number of choanoflagellates and the number of animals in all gene families containing at least one animal and at least one choanoflagellate representative. Most gene families contain a similar number of animals and choanoflagellates, but there are also some gene families with many animals and few choanoflagellates or vice versa; these are candidates to contain false orthologs. (b) The empirical cumulative distribution function (van der Vaart, 1998, p. 265) of all BLAST E values. The x axis represents ordered BLAST E values (in log10, from highest to lowest), and the y axis represents the probability that they were assigned (from 0 to 1). The dashed grey horizontal line indicates an assigned probability of 0.1, corresponding to a BLAST E value between 10−6 and 10−7. (c–d) Network diagrams of BLAST hits among choanoflagellates (green) and animals (purple) and their assigned presence probabilities for two example gene families. Edge width and opacity is inversely proportional to BLAST E value. (c) Gene family 9066, which contains one choanoflagellate and 17 animals. The choanoflagellate protein sequence has high E value hits to only a subset of the other sequences in the cluster, and is assigned a low presence probability. The animal sequences are all connected by low E value hits, resulting in high probabilities. (d) Gene family 5870, which contains 20 choanoflagellates and 15 animals. (e–f) Histograms showing probability distributions. X axis labels reflect the minimum value contained in each bin; for example, in (e), the bin labeled 0 includes values ≥ 0 and <0.05. (e) Probabilities assigned to all BLAST hits, comparing hits between proteins in the same gene families, which are mostly composed of high probability hits with a small proportion of low probability hits that are likely spurious, versus hits to different gene families, which are less likely to represent orthologous relationships and are assigned low probabilities by our procedure. (f) Comparison of probabilities assigned to all BLAST hits within gene families that contain at least 15 choanoflagellates and at least 15 animals, which are likely to be enriched for true orthologs, versus those present in one choanoflagellate and at least 15 animals, which are likely to be enriched for artifactual orthologs. For the first category, probabilities for both choanoflagellate and animal proteins are shown, whereas for the second only choanoflagellate probabilities are plotted.
Figure 2—figure supplement 3
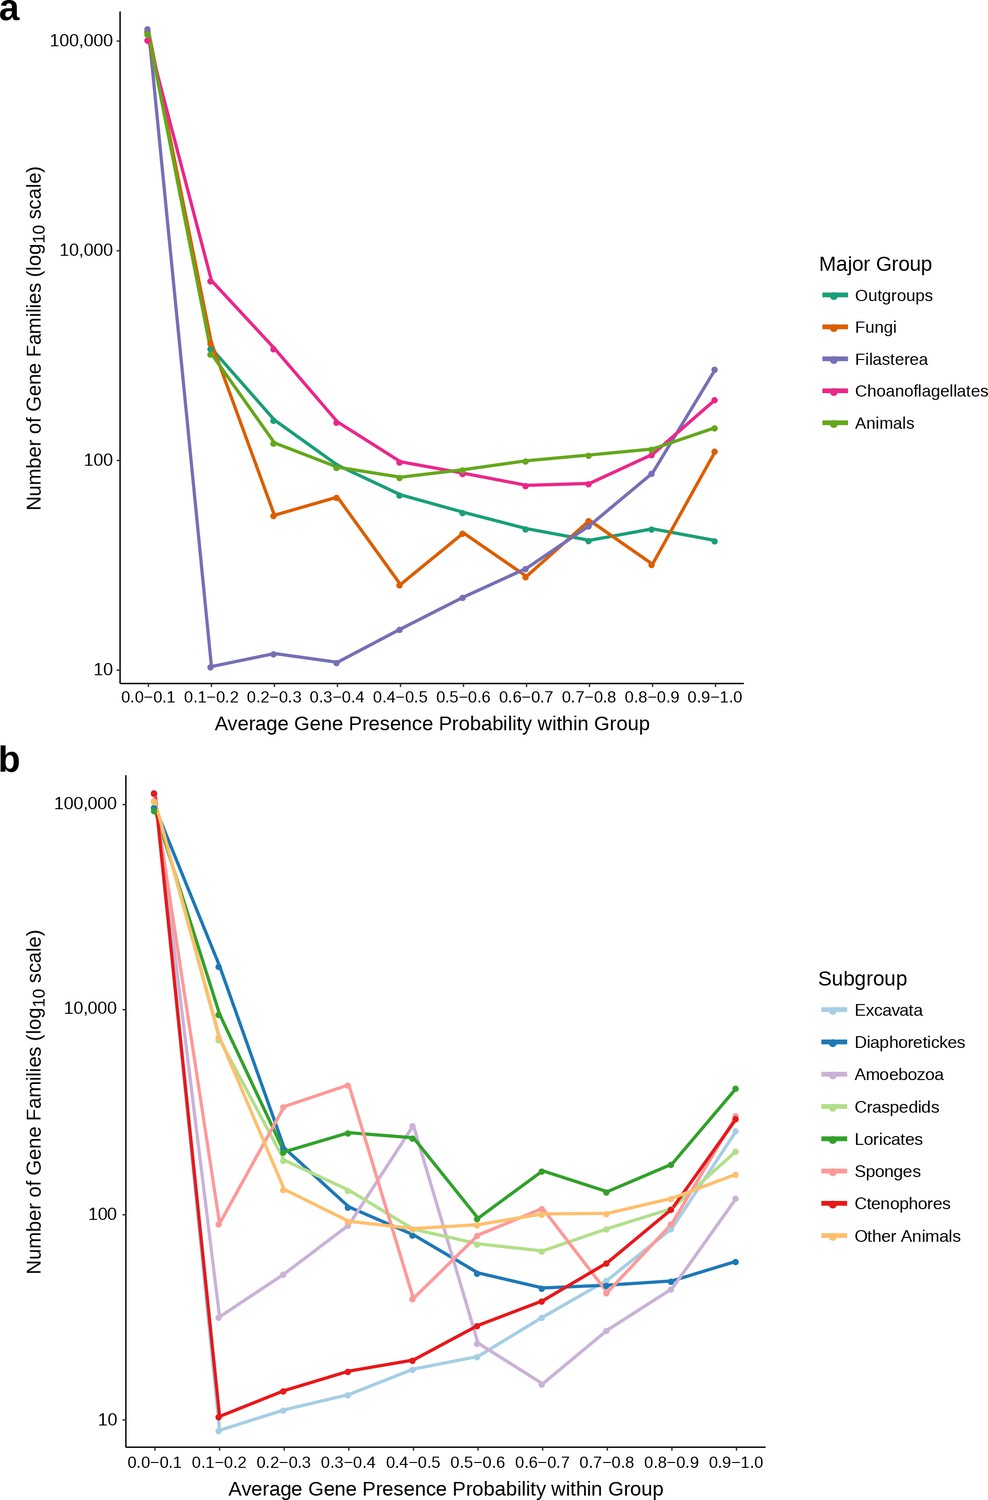
Distributions used to determine the 0.1 average probability threshold for inclusion in gene family analyses.
(a) The average gene presence probability within each major group of species. Filasterea contains only one representative, Capsaspora owczarzaki. (b) The average gene presence probability within each subgroup, used to determine whether a gene family only found in one group was present at the common ancestor of that group; such gene families must pass the 0.1 average probability threshold for at least two subgroups. Outgroups (subgroups: Excavata, Diaphoretickes, Amoebozoa), Choanoflagellates (subgroups: Loricates, Craspedids), Animals (subgroups: Sponges, Ctenophores, Other Animals). Some major groups or subgroups may have distributions that appear jagged because they contain few species. For each group and subgroup, there are (at least) roughly an order of magnitude more gene families with average probability less than 0.1 than any other probability bin, leading us to select 0.1 as the average probability threshold.
Figure 2—figure supplement 4
Full heat map of orthologous gene families present (with probability ≥0.1) in at least two species.
The representation is the same as in Figure 2, with one major difference: gene family origin, indicated on the left, indicates that the average gene family probability within the group is at least 0.1, but does not imply that it was present in the last common ancestor of the group (as is the case in Figure 2).
Figure 2—figure supplement 5
Heat maps with the inclusion of additional species.
There are four additional teretosporeans (Corallochytrium limacisporum, Chromosphaera perkinsii, Ichthyophonus hoferi and Creolimax fragrantissima), two additional sponges (Sycon ciliatum and Tethya wilhelma) and one additional ctenophore (Pleurobrachia bachei). Additional species are in bold and enclosed by dark green boxes. We used the same clustering as in Figure 2 (additional species were given no weight). Previous gene family origin assignments are shown as vertical bars on the left. With the additional species included, there would be 86 gene families newly present in the Urholozoan (red horizontal lines to the left of the heat map), and 37 in the Urmetazoan (purple lines).
Figure 2—figure supplement 6

Presences of selected gene families in holozoans.
Groups of gene families implicated in animal cell adhesion, cell-cell communication, and transcription regulation, in addition to RNAi components, are shown with the evidence for their presence in animals, choanoflagellates and Capsaspora owczarzaki. Criteria for gene family presences are based on diagnostic protein domain architectures (Supplementary file 6). CSL/Su(H): CBF-1/RBPJ-κ/Suppressor of Hairless/Lag-1.
Figure 2—figure supplement 7
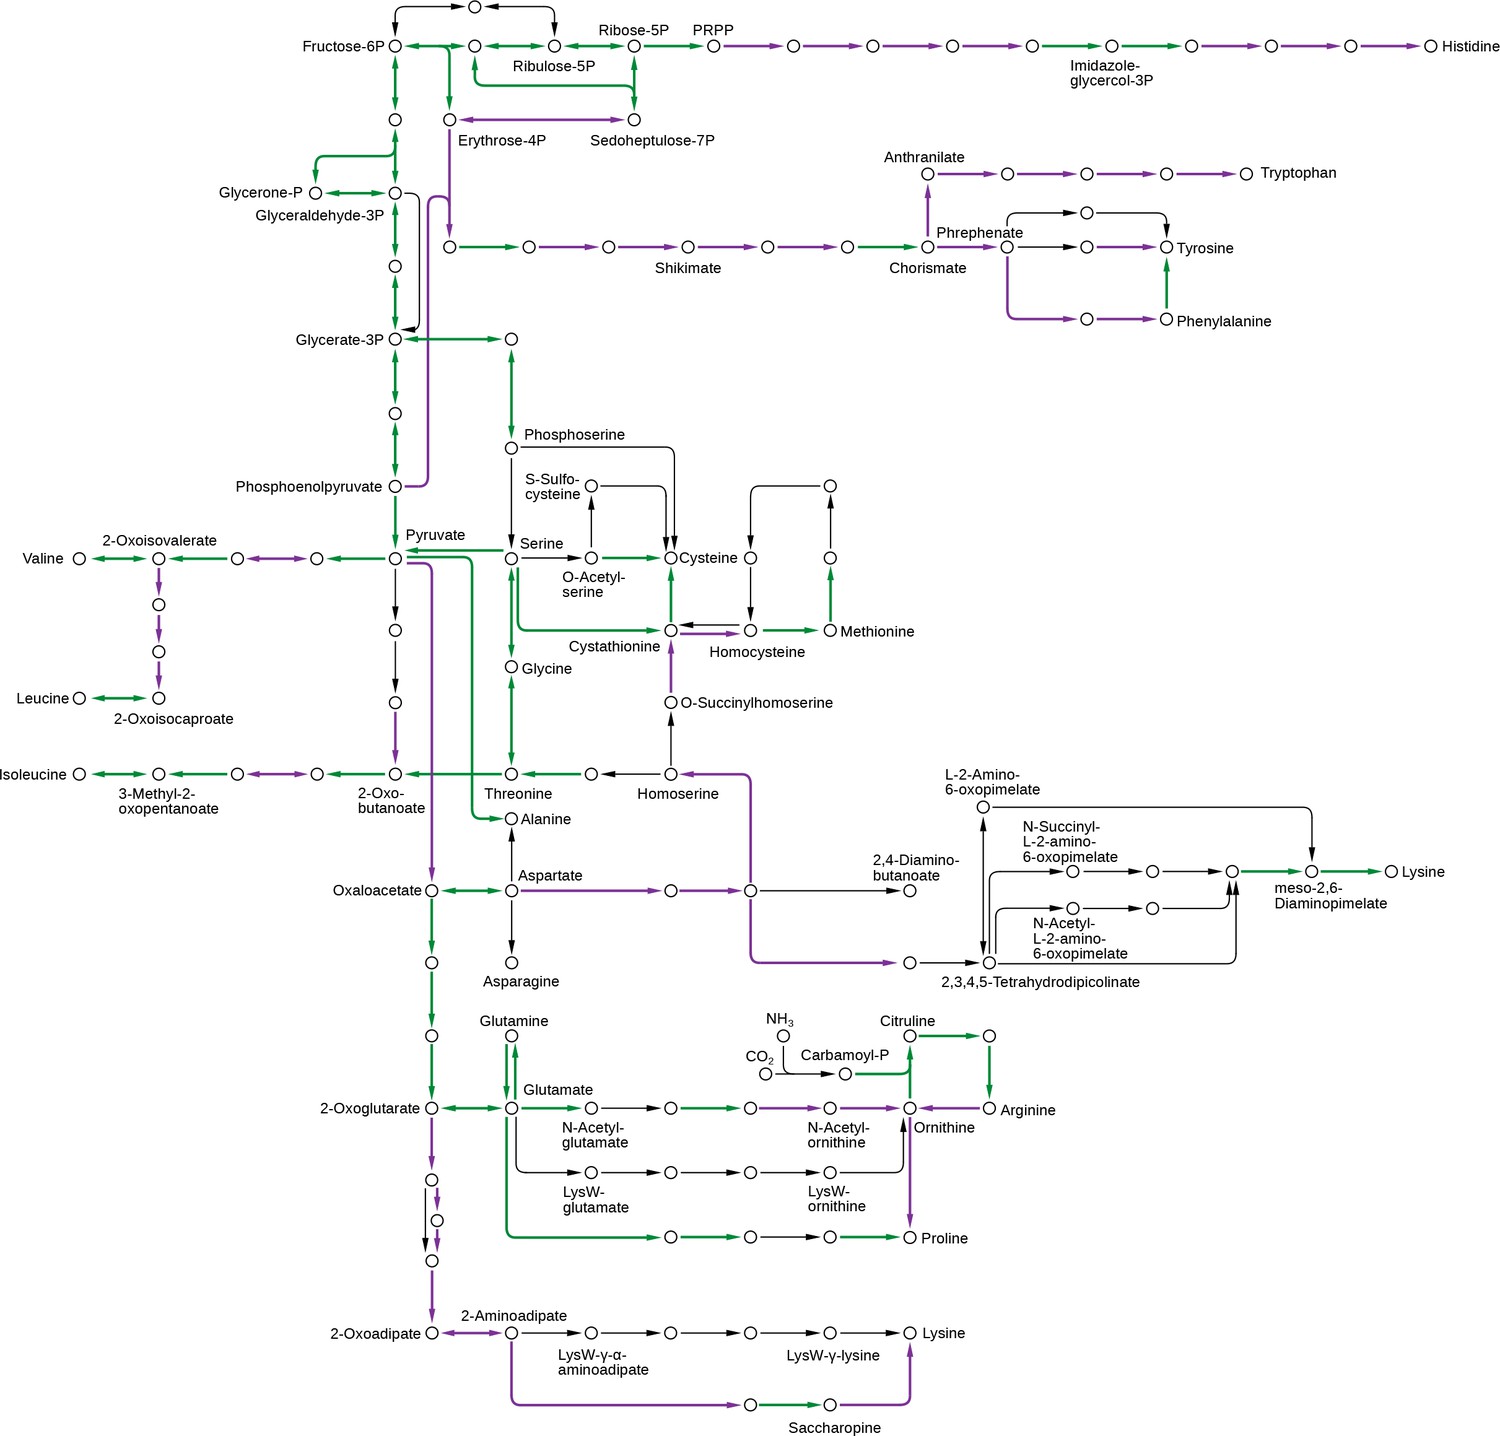
Pathway components necessary for the synthesis of the essential amino acids were lost in animals.
These include the pathways for leucine, valine, isoleucine, histidine, lysine, threonine, tryptophan, phenylalanine and methionine, which were all more complete in the Urchoanozoan than in the Urmetazoan. Green: pathway components present in the Urchoanozoan and the Urmetazoan. Purple: pathway components present in the Urchoanozoan but absent from the Urmetazoan.
Figure 2—figure supplement 8

Protein domain architectures of Notch-domain containing proteins.
Architectures are shown for the proteins within each species that most closely match the animal Notch protein: C. owczarzaki (CAOG_00333), three choanoflagellates, M. brevicollis (26647), S. rosetta (PTSG_03468), M. fluctuans (m.79158), and the sponge A. queenslandica (Aqu1.224719). In the M. brevicollis protein, Stealth (DUF3184) domains are not depicted. In the A. queenslandica protein, the EGF domain variants hEGF and EGF_CA are shown as EGF. Positions of domains in proteins are relative; they reflect ordering, but are not to scale. All protein domains are shown in grey, as they are all of ancient origin. Transmembrane domains are smaller rectangles not labeled with text.
Figure 2—figure supplement 9
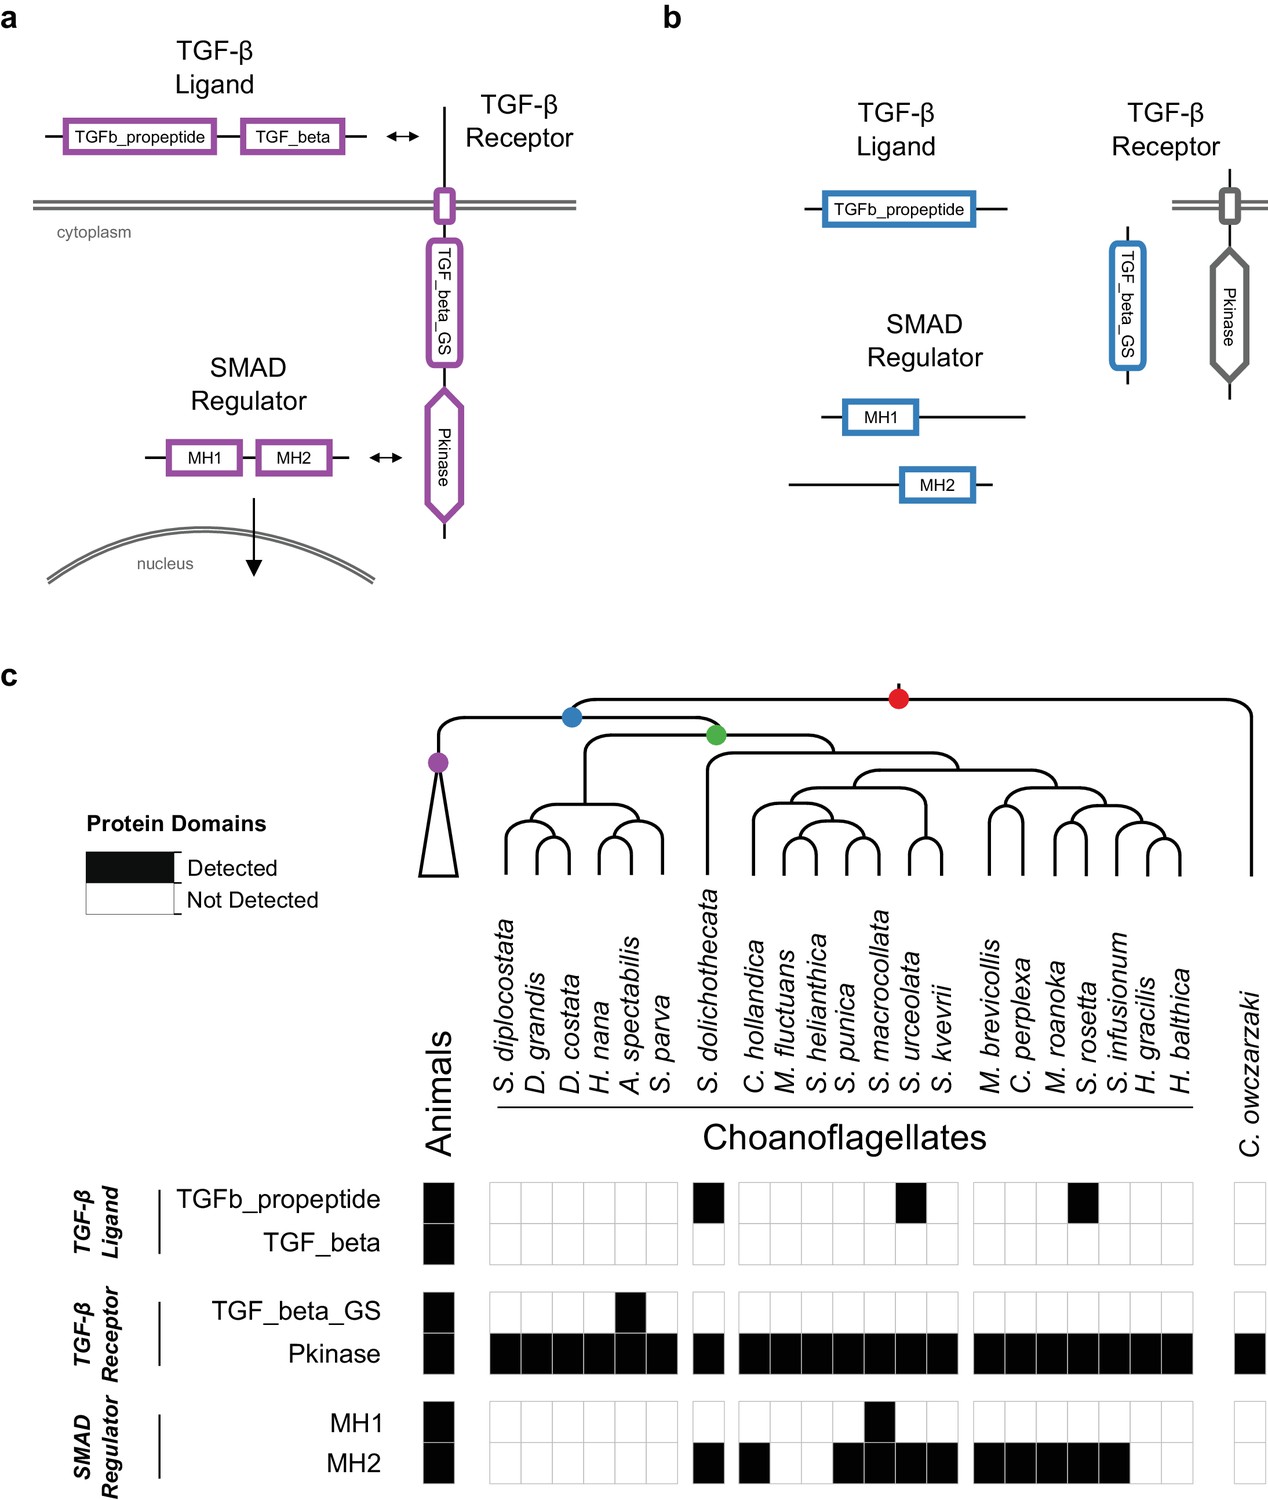
The evolution of the TGF-β signaling pathway in choanozoans.
(a) In the canonical animal TGF-β signaling pathway (in purple), a TGF-β ligand (e.g. BMP, Activin) is cleaved from its TGFb_propeptide (LAP) domain, freeing it to interact with TGF-β receptors. TGF-β receptors form a heterocomplex that leads to the phosphorylation of TGF_beta_GS-containing receptors on their TGF_beta_GS domain. They subsequently phosphorylate SMADs, which translocate to the nucleus in their own oligomeric complexes. (b) Several TGF-β pathway constituent domains evolved on the Urchoanozoan stem lineage (in blue), but none of those domains are found in domain architectures of the animal pathway. (c) Presence of TGF-β constituent domains in animals, choanoflagellates and Capsaspora owczarzaki. The TGFb_propeptide, TGF_beta_GS, MH1 and MH2 domains are found only in choanozoans, and the TGF_beta domain is found only in animals.
Figure 2—figure supplement 10

Phylogenetic tree of gene family 9066 and closely-related sequences from outside the gene family.
This gene family contains numerous animal sequences but only one choanoflagellate sequence, which was assigned a low probability (0.03) of membership in the gene family based on its high E value blastp hits to other members of the family (see also Figure 2—figure supplement 2c). The tree includes all proteins from gene family 9066 and the most closely-related sequence outside the family for each species. Once these sequences are added, it is clear that the choanoflagellate sequence should not be a member of the gene family (although there are two animal sequences that should have been included). The ‘Other’ group is all species that are neither choanoflagellates nor animals. The tree is unrooted. Branches with bootstrap support values below 50% were removed; support for other nodes of interest is indicated. Scale bar represents one substitution/site.
Figure 2—figure supplement 11
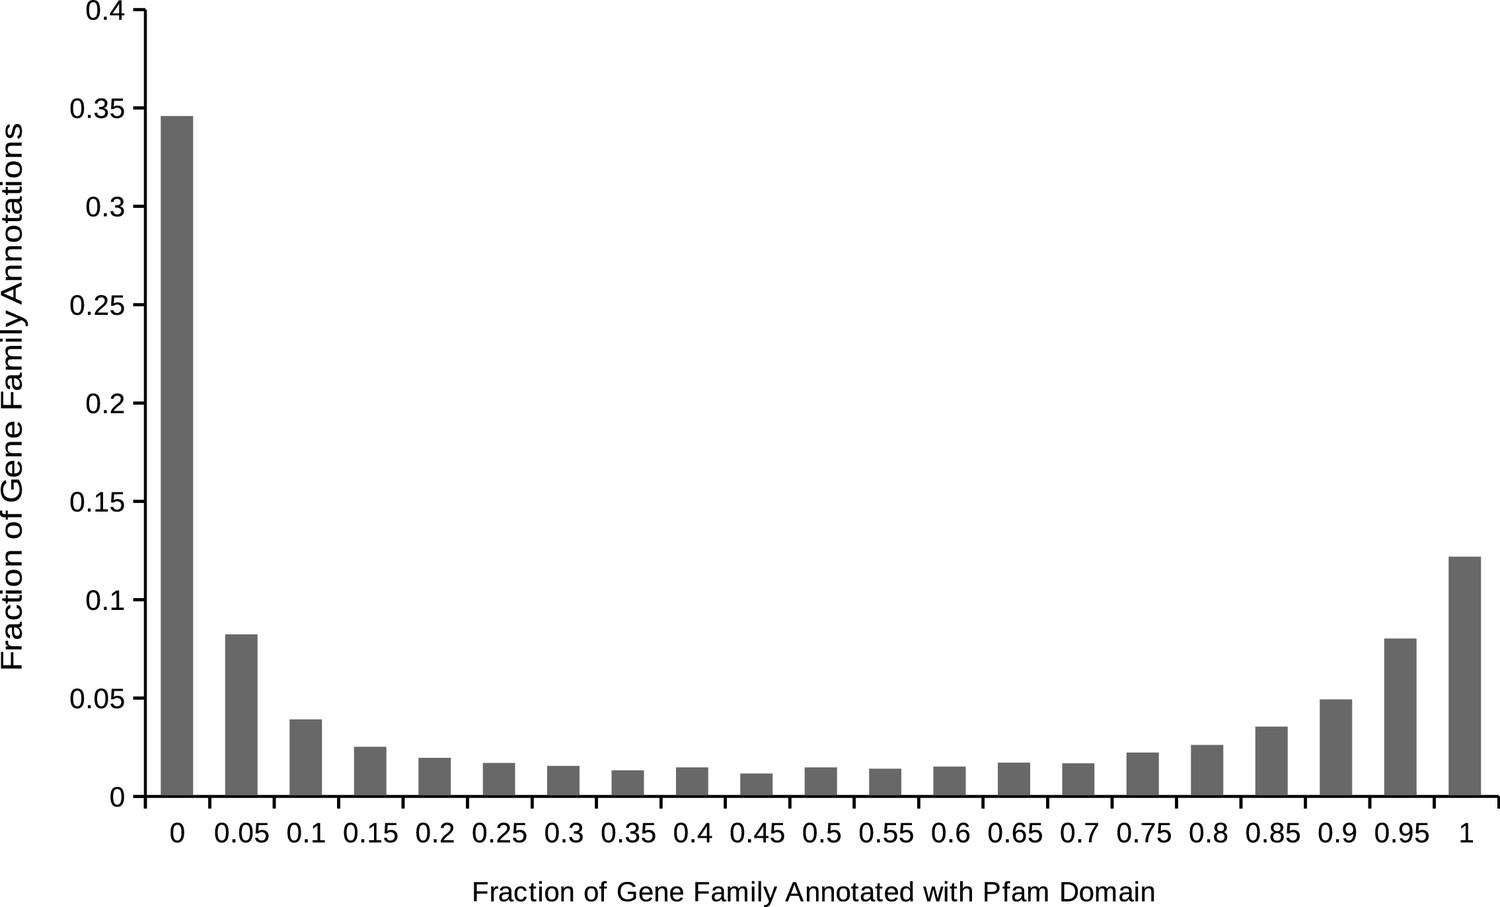
Distribution of gene family Pfam domain annotations within animals.
For each gene family containing one or more proteins annotated with at least one domain, the distribution of the proportion of the proteins in the gene family annotated with each domain. We used this distribution to produce a threshold for a true vs. ‘noise’ domain annotation of the family.
Figure 2—figure supplement 12
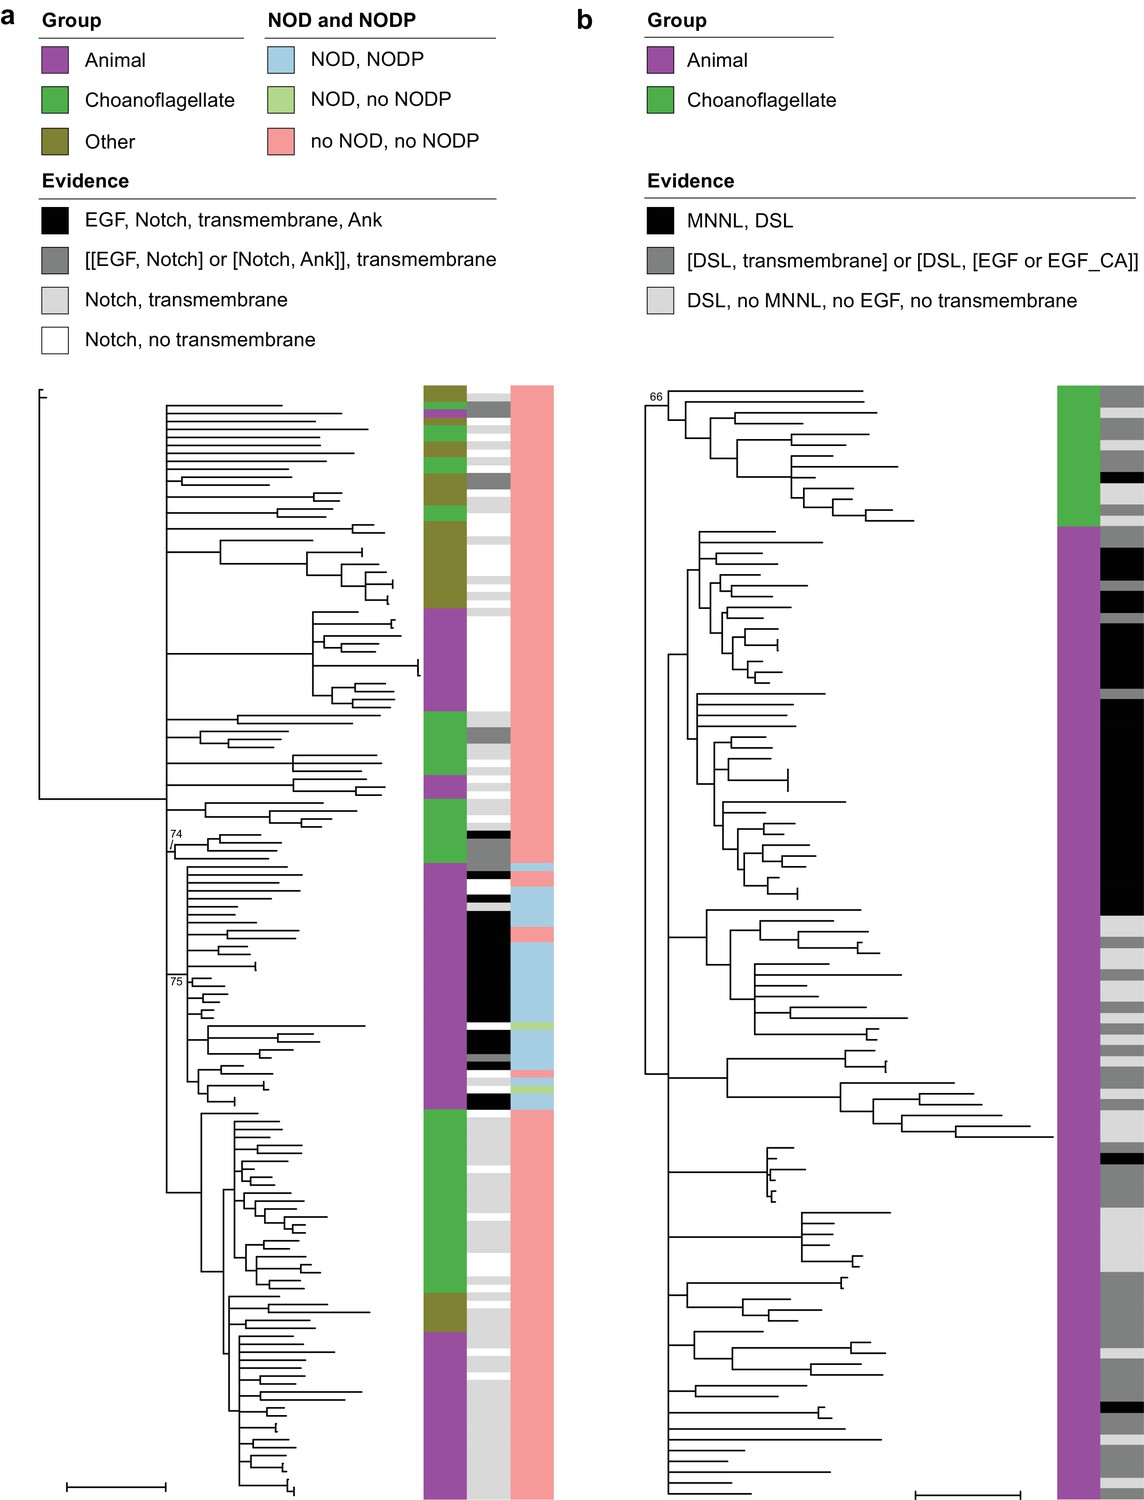
Phylogenetic trees of Notch and Delta/Serrate/Jagged.
The trees are unrooted. Branches with bootstrap support values below 50% were removed; support for other nodes of interest is indicated. Scale bars represent one substitution/site. Evidence levels match those defined in Supplementary File 6. (a) All proteins in our data set that contain a Notch domain. The ‘Other’ group is all species that are neither choanoflagellates nor animals. Proteins with strongly conserved domain architecture (black) were found in either one animal-specific or one choanoflagellate-specific clade, both with partial support. Both NOD and NODP are present in most, but not all, animal proteins with strongly conserved domain architecture. (b) All proteins in our data set that contain a DSL domain. Choanoflagellate proteins form a partially supported sister group to animal proteins.
Figure 3 with 3 supplements
Gene family retention in animals, choanoflagellates, and Capsaspora owczarzaki.
(a) Consensus phylogenetic tree (Philippe et al., 2009; Burki et al., 2016; Carr et al., 2017) with gene family retention. Gene families are divided by their origin in the last common ancestor in different groups: holozoan, choanozoan, choanoflagellate, or animal. Colors correspond to nodes indicated in the phylogenetic tree. Bars represent the sum of presence probabilities for gene families with each origin. (Note that a small sum of probabilities is assigned to certain species of choanoflagellates for animal-specific gene families, and vice versa. This is an expected result, as, in our method, every gene family is assigned a finite probability of presence in every species, producing a small background signal when summed over the approximately two thousand animal- or choanoflagellate-specific gene families. Variation in this background signal across species is due to species-specific effects on BLAST scores arising from database size and other factors, as well as intrinsically noisy scores assigned to weak BLAST hits.) (b–c) Ranked order of gene family retention for (b) animals and (c) choanoflagellates, similar to (a), but with the addition of gene families originating in the last common ancestor of Opisthokonts and of eukaryotes. Gene families originating within choanoflagellates are not included, in order to focus only on those gene families potentially shared with animals.
Figure 3—figure supplement 1

Phylogenetic tree with gene family retention for all species in this study.
Gene families are divided by their origin in the last common ancestor in different groups: eukaryotic, opisthokont, holozoan, choanozoan, choanoflagellate, or animal. Colors correspond to nodes indicated in the phylogenetic tree. Bars represent the sum of presence probabilities for gene families with each origin.
Figure 3—figure supplement 2
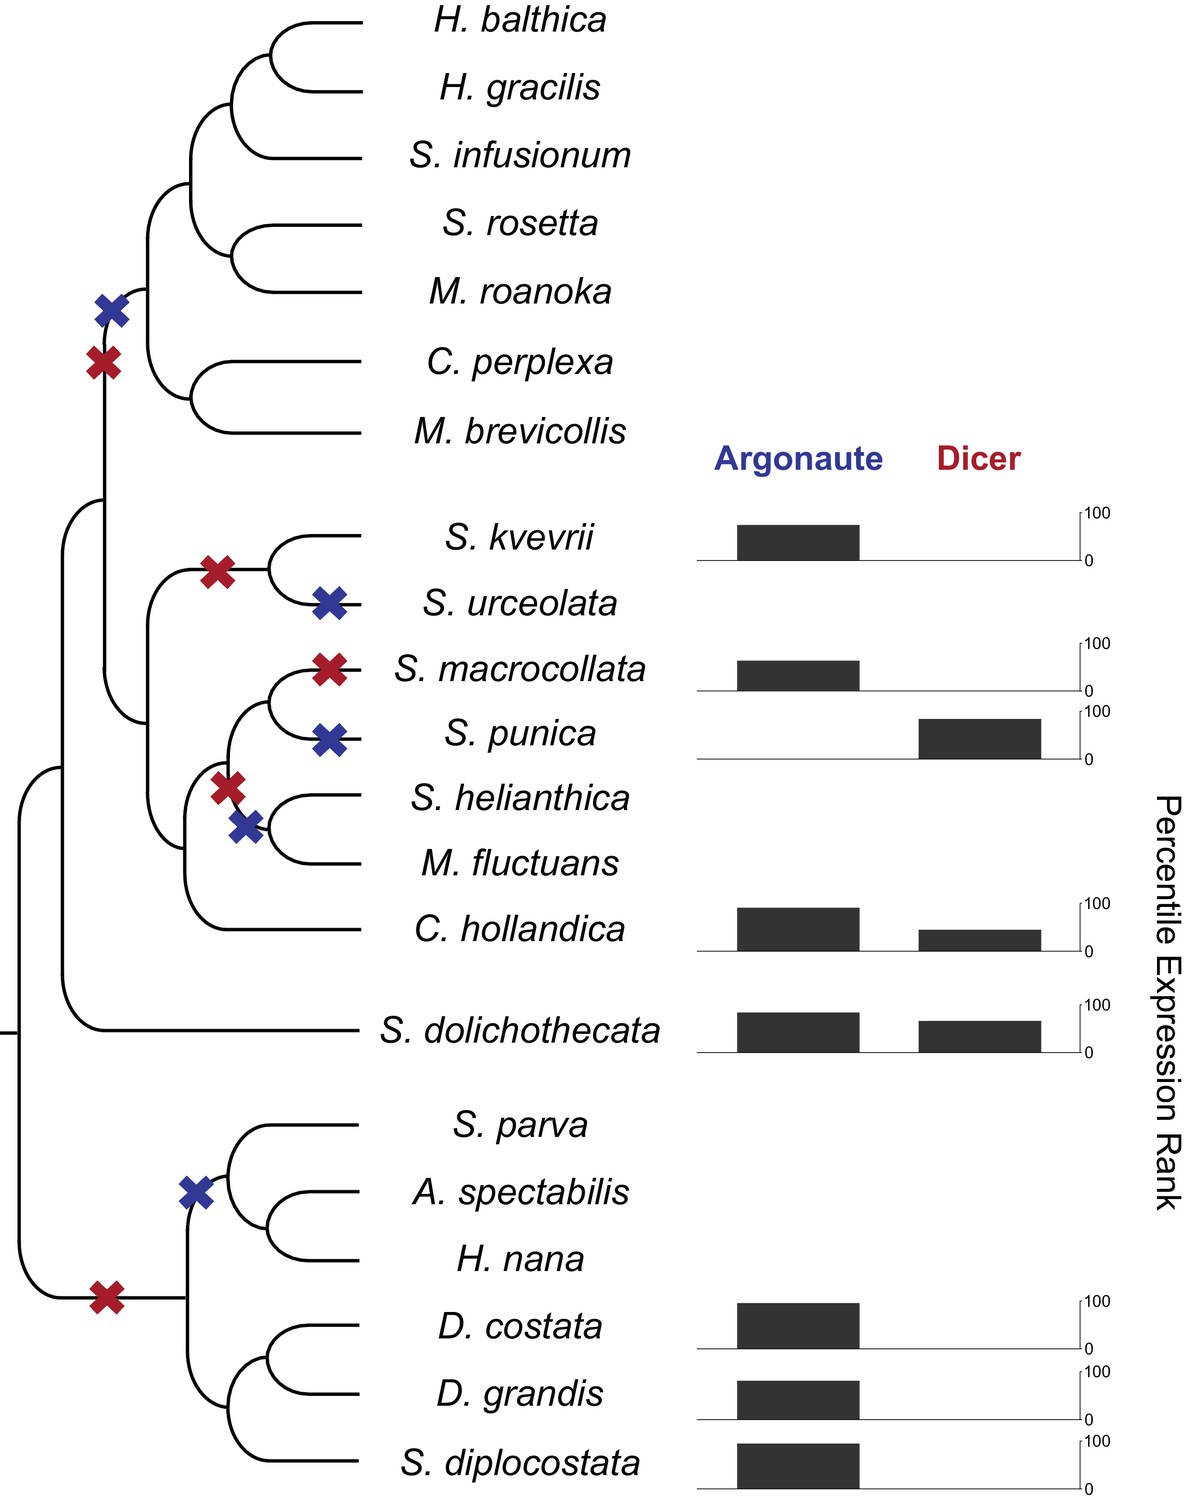
RNAi components in are present in choanoflagellates, but have been lost multiple times in different lineages.
A phylogenetic tree of choanoflagellates with inferred losses of Argonaute (blue) and Dicer (red). For each species with moderate evidence for either Argonaute or Dicer, the expression level of that gene is shown as a percentile FPKM rank within each species. Species lacking a gene have no expression value. Overall, there have been multiple losses of both Argonaute and Dicer, and RNAi machinery appears to be entirely absent in the clade containing the two previously sequenced species, Monosiga brevicollis and Salpingoeca rosetta. In the species with Argonaute, it is highly expressed, and Dicer always shows a lower relative expression level.
Figure 3—figure supplement 3
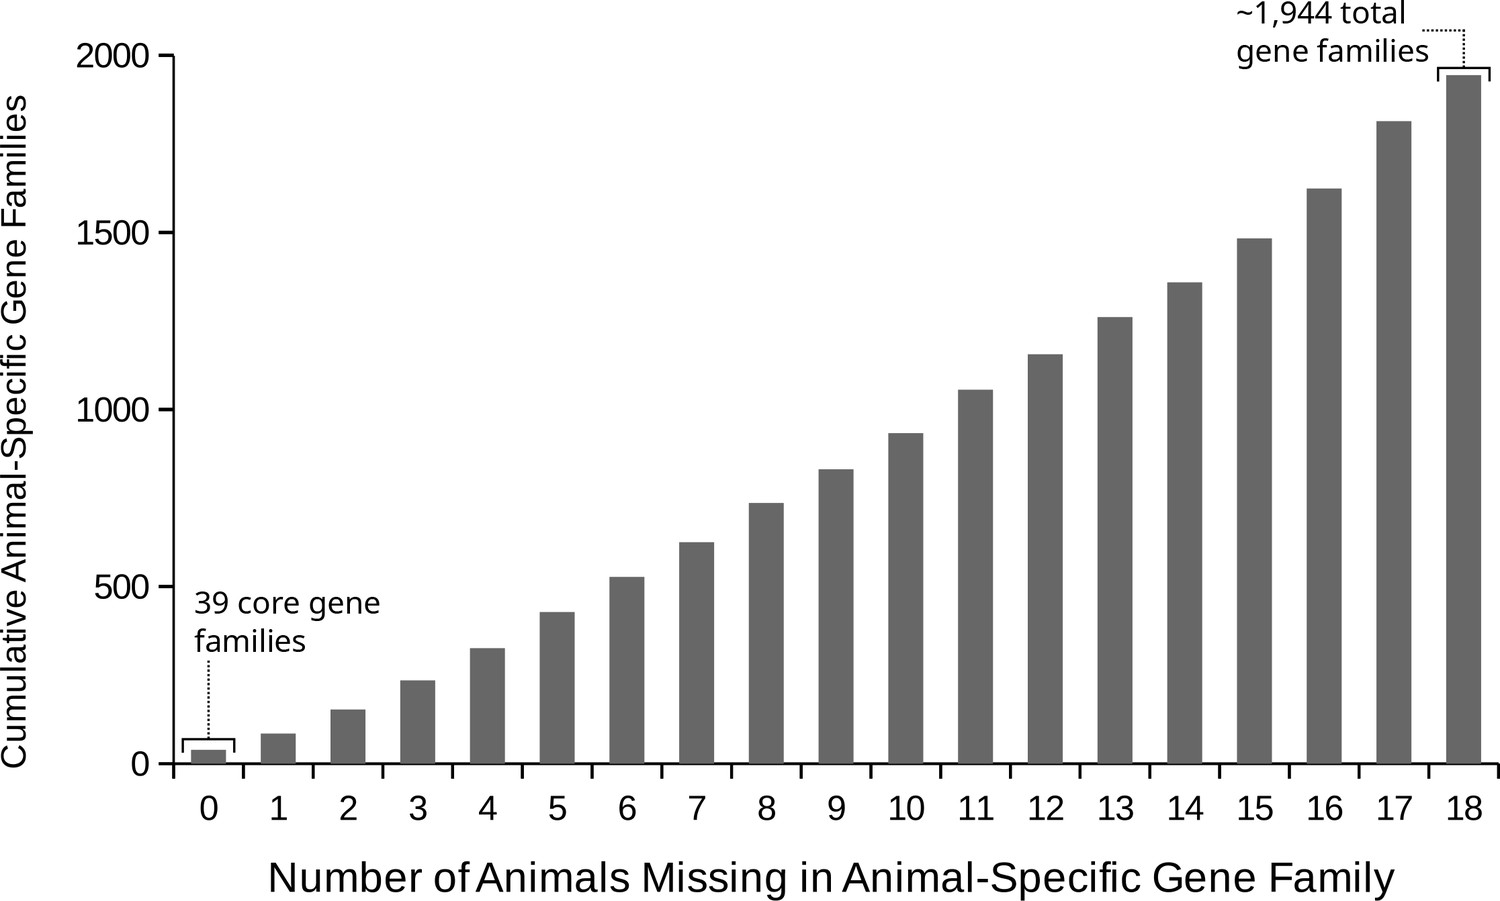
The number of animal species that lost animal-specific gene families.
Out of a total of ~1944 gene families that evolved on the animal stem lineage, the cumulative count that are missing for increasing numbers of animal species. On the x axis, the number of animal species missing, and on the y axis, the count of gene families lost in that many or fewer species. There are 39 ‘core’ animal-specific gene families present in all animals in our data set, although there are also numerous gene families missing only in 1, 2 or three animals.
Figure 4 with 2 supplements
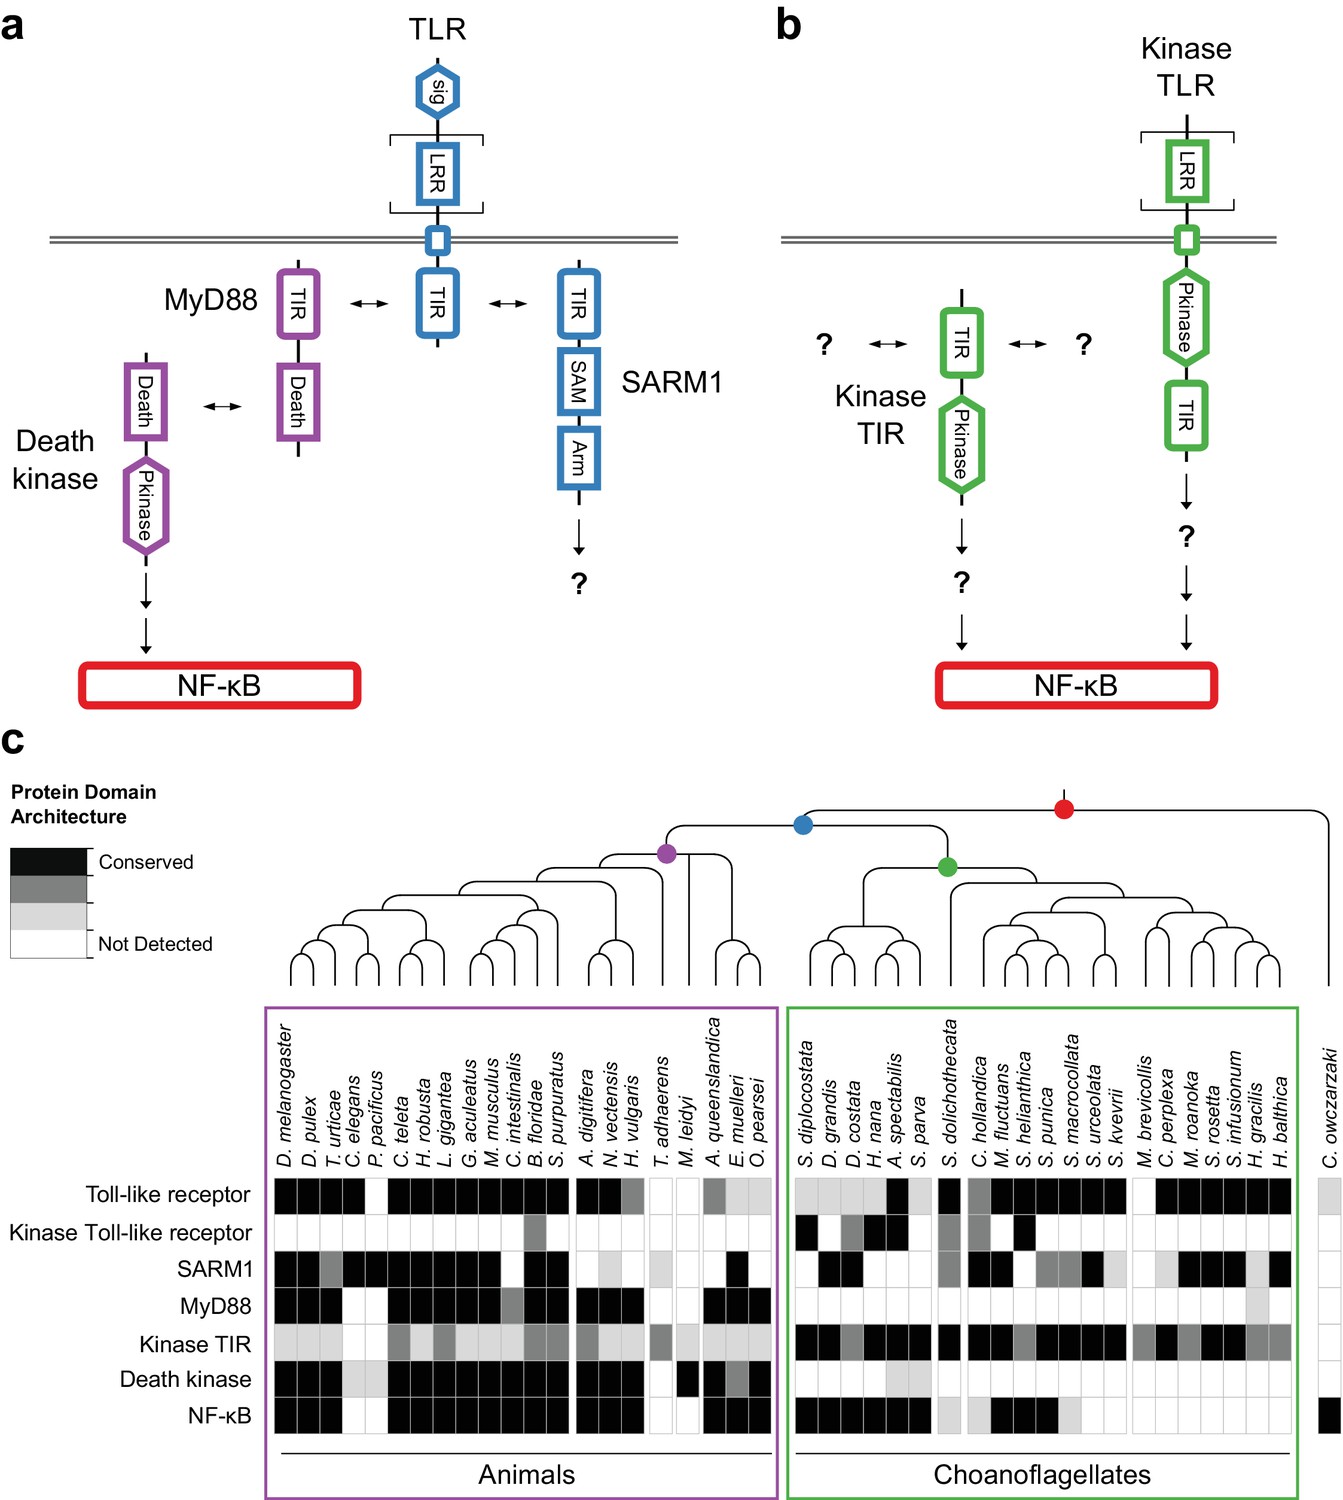
Evolution of the TLR signaling pathway.
Components of the canonical TLR pathway (a) and a potential choanoflagellate Kinase TLR signaling pathway (b), with their canonical domain architectures and colored by their inferred ancestral origin (blue = choanozoan ancestry, purple = metazoan ancestry, green = choanoflagellate ancestry, and red = holozoan ancestry). Question marks denote steps of the signaling pathway and/or interaction partners that are hypothesized, but untested. (c) Presence of receptors, adapters, kinases and the transcription factor NF-κB in animals, choanoflagellates and C. owczarzaki.
Figure 4—figure supplement 1
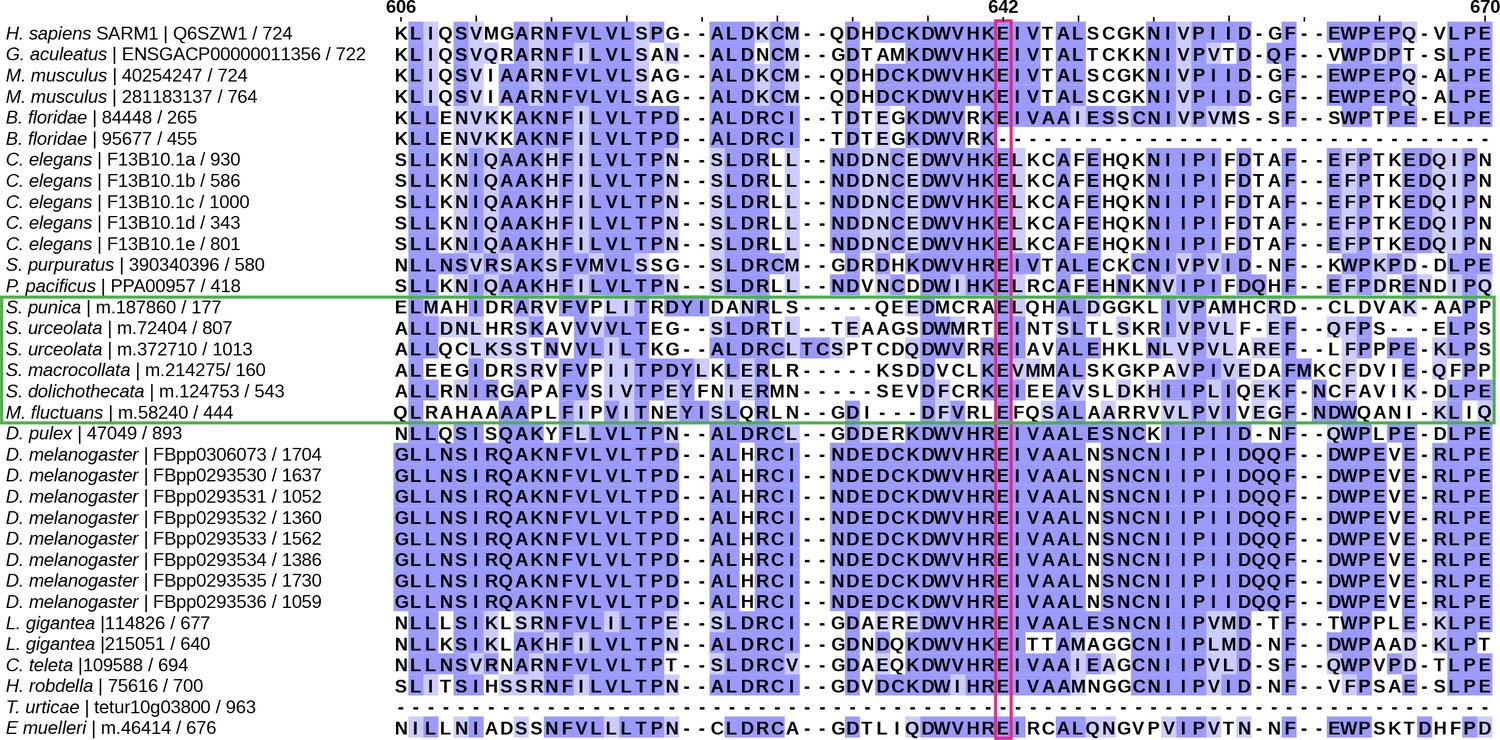
Alignment of gene family 6840, which contains animal SARM1 proteins.
Only a portion of the alignment, surrounding the glutamic acid residue that is necessary but not sufficient for SARM1 function (position 642, magenta box), is depicted. The Homo sapiens SARM1 protein, which was not part of our data set of gene families, but which we included in the alignment, is shown at the top. Choanoflagellate sequences are surrounded by a green box. Positions at the top are given with respect to the human SARM1 protein. Each species is listed with its identifier followed by the length of the protein that was used to build the full alignment.
Figure 4—figure supplement 2
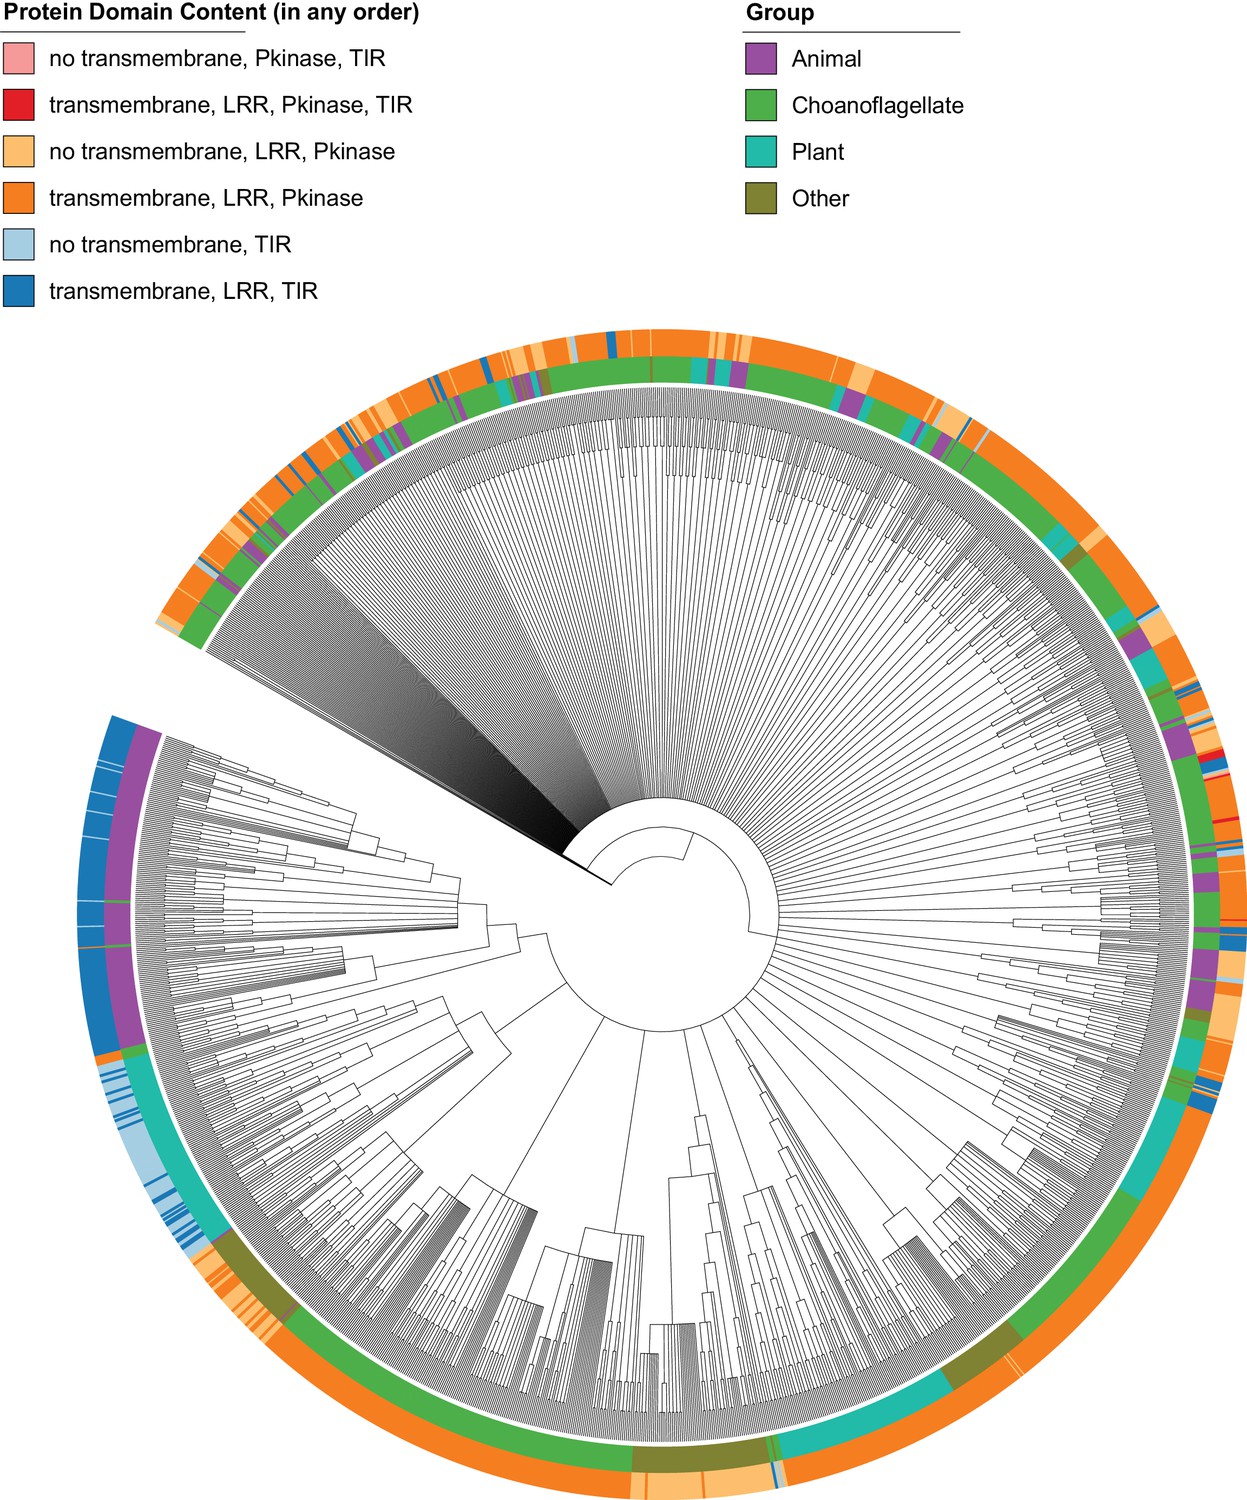
Phylogenetic tree of proteins in our data set containing any of the following pairs of Pfam protein domains: LRR and kinase, kinase and TIR, or LRR and TIR.
The tree is unrooted. Branches with bootstrap support values below 50% were removed. Branch lengths are not shown, for ease of interpretation. Protein domain architecture is not given in order. The ‘Other’ group is all species that are neither animals, choanoflagellates or plants. The tree is largely unresolved, but plant and choanozoan proteins encoding a transmembrane, LRR and TIR domain (dark blue) are never found together in the same resolved clade, supporting their distinct evolutionary histories. ‘Kinase TLRs’ (LRR, transmembrane, Pkinase, TIR; dark red) and ‘Kinase TIRs’ (no transmembrane, Pkinase, TIR; light red) are only found in choanoflagellates.
Tables
Table 1
Core animal-specific gene families that are present in all animals in this study
Representative gene names and annotations are based on a consensus from each gene family (Materials and methods). Gene families are ordered by pathway/function. *: missing in myxozoans, a lineage of parasitic cnidarians (Chang et al., 2015), ** missing in myxozoans and in glass sponges (Schenkelaars et al., 2017), two animal lineages with derived body plans.
| Gene family ID | Representative gene name(s) | Pathway/Function |
|---|---|---|
| 6201 | A-kinase anchor protein 17B | gene regulation |
| 8693 | interleukin enhancer-binding factor 2 | gene regulation |
| 5720 | lethal(2) giant larvae | gene regulation |
| 5290 | mediator subunit | gene regulation |
| 6241 | mediator subunit | gene regulation |
| 7805 | MEX3 B/C | gene regulation |
| 6675 | nuclear factor 1 A/B | gene regulation |
| 3849 | T-box transcription factor TBX 2/3 | gene regulation |
| 6532 | catenin beta | Wnt |
| 4891 | catenin delta | Wnt |
| 6254 | dishevelled 1–3 | Wnt** |
| 3570 | frizzled 1/2/5/7/8 | Wnt* |
| 441 | low-density lipoprotein receptor (LRP) 1/2/4/5/6 | Wnt* |
| 5637 | transcription factor 7 (TCF/LEF) | Wnt |
| 6000 | transcription factor COE 1–4 | Wnt |
| 6831 | fermitin 1–3 | cell-cell adhesion |
| 804 | hemicentin/obscurin/titin | cell-cell adhesion |
| 4442 | integrin alpha 2/5/8 | cell-cell adhesion |
| 7164 | laminin gamma 1–3 | cell-cell adhesion |
| 8024 | vinculin | cell-cell adhesion |
| 4993 | calcium-dependent secretion activator | synapse/vesicle |
| 476 | metabotropic glutamate receptor 1–8 | synapse/vesicle |
| 7929 | receptor-type tyrosine-protein phosphatase-like N | synapse/vesicle |
| 8406 | kinase suppressor of Ras 2 | MAPK/JNK |
| 7174 | MAPK 7 | MAPK/JNK |
| 6010 | MAPK 8–10 | MAPK/JNK |
| 495 | disintegrin and metalloprotease (ADAM) | metalloprotease |
| 4051 | tetraspanin 5/14/17/33 | metalloprotease |
| 2737 | caspase 3/7/9 | apoptosis |
| 5675 | calumenin | calcium ion |
| 6842 | cyclin T 1/2 | cell cycle |
| 621 | dystonin/desmoplakin/plectin | cytoskeleton |
| 7916 | phosphorylase b kinase | glycan |
| 6512 | heparan-sulfate 6-O-sulfotransferase 1–3 | heparan sulfate |
| 7146 | inositol monophosphatase 3 | inositol |
| 6163 | protein kinase C iota/zeta | PI3K |
| 6251 | small G protein signaling modulator 1–2 | Rab GTP |
| 6366 | MAP kinase-activating death domain protein 9–11 | TNF |
| 8587 | BTB/POZ domain-containing protein 9 | ubiquitin |
Additional files
-
Supplementary file 1
Information on each culture sequenced in this study, divided into sections by topic. See Materials and methods for details on each topic. Note that we sequenced and assembled two strains of Stephanoeca diplocostata. We determined their protein catalogs to be equivalent for the purposes of gene family construction, and so we used only one of the two cultures to represent the species (7.2, ATCC 50456 isolated from France). Strain information: information about the cultures used, including American Type Culture Collection (ATCC) number for each culture and NCBI Taxonomy ID for each species. Previous names for cultures indicate prior names used as labels in culture collections or publications, but which were subsequently determined to have been incorrectly applied [some of these species names are no longer valid (Codosiga gracilis, Acanthoecopsis unguiculata, Diplotheca costata, Savillea micropora, Monosiga gracilis and Monosiga ovata), whereas others are still valid at the time of publication, but their descriptions did not match the cultures (Salpingoeca amphoridium, Salpingoeca minuta, Salpingoeca pyxidium, Salpingoeca gracilis and Salpingoeca napiformis)]. Previous names for species were never applied to the cultures used, but are considered to be invalid names that were previously used for the species and have been subsequently replaced. Origin of cultures: source, isolation location and year, if known. Growth media, antibiotic treatments and cell types: the sequence of antibiotic treatments used to obtain a culture for high-volume growth, the growth medium and temperature, and the estimated proportion of each cell type in sequenced cultures. Culture conditions in large batches for harvesting: information on how each culture was grown and harvested for mRNA sequencing. Amount of total RNA used for each sample and groupings for preparation and sequencing: the amount of total RNA used for each culture, based on the estimated proportion of choanoflagellate RNA versus bacterial RNA in each total RNA extraction, with the goal of beginning each sequencing preparation with 2 µg of choanoflagellate total RNA. Library prep. group and Seq. flow cell group are arbitrary labels to indicate which sets of samples were prepared for sequencing at the same time or sequenced on the same flow cell. Read counts and quality trimming: results of sequencing before quality trimming and after quality trimming. Read error correction: parameters for error correction by Reptile, adapted to each set of reads independently. Assembly read counts and N50s: the counts of contigs and predicted proteins at each step of the assembly process. N50 is the length at which 50% of the nucleotides/amino acids in the assembly are contained in contigs/proteins greater than or equal to that length. NCBI Short Read Archive: identifiers to retrieve the raw, unprocessed reads for each library at the NCBI Short Read Archive. NCBI Transcriptome Shotgun Assembly (TSA): identifiers to retrieve the unannotated assembled contigs for each species, the counts of contigs entirely excluded or trimmed due to adapter or bacterial sequences identified during the submission process, and the counts of contigs removed because they were below the minimum length of 200 bases (after trimming) imposed by the TSA.
- https://doi.org/10.7554/eLife.34226.029
-
Supplementary file 2
Results of running BUSCO to search for conserved eukaryotic genes in each species’ protein catalog.
Each value represents a percentage of genes in the BUSCO eukaryotic gene set (eukaryota_odb9).
- https://doi.org/10.7554/eLife.34226.030
-
Supplementary file 3
Species used for gene family construction and their data sources.
Note that we sequenced and assembled two strains of Stephanoeca diplocostata. We determined their protein catalogs to be equivalent for the purposes of gene family construction, and so we used only one of the two cultures to represent the species (ATCC 50456 isolated from France).
- https://doi.org/10.7554/eLife.34226.031
-
Supplementary file 4
Parsimony-based rules used to determine the presence of gene families in last common ancestors of interest and whether they represent gains on that stem lineage.
Gene family presences in the five major groups (Outgroups, Fungi, Filasterea (represented by Capsaspora owczarzaki), Choanoflagellates and Animals) are each based on the 10% average probability threshold, as described in the Materials and methods. The same rules are presented in two alternative formats. (a) Condensed explanation, describing the criteria for presence and gain in each last common ancestor. (b) Expanded explanation, in which a 0 represents absence and a one represents presence according to the 10% average probability threshold. Empty cells represent 0 and are omitted for clarity.
- https://doi.org/10.7554/eLife.34226.032
-
Supplementary file 5
Counts of gene family presence, gain and loss in last common ancestors of interest.
Gains and losses are not shown for the Ureukaryote, as our data set only contained eukaryotic species and was thus not appropriate to quantify changes occurring on the eukaryotic stem lineage.
- https://doi.org/10.7554/eLife.34226.033
-
Supplementary file 6
Evidence levels used to determine the presence of gene families of interest.
Evidence takes the form either of a protein domain architecture, the presence of a representative protein in a gene family, or a combination of the two. Protein domain names are from Pfam (transmembrane domains are from Phobius). When a domain is listed without a suffix consisting of an underscore followed by a digit, then any possible digit is acceptable (e.g., if LRR is listed, LRR_1, LRR_2, LRR_3, etc. are all acceptable). Commas indicate domain combinations, in order. Brackets are used to group combinations in order to avoid ambiguity when multiple possibilities constitute evidence for presence. Gene family IDs are from our OrthoMCL analysis and when listed, presence of a protein within that gene family is considered evidence (with a brief description of the gene family given in parentheses). *: we did not detect a canonical Toll-like receptor in Nematostella vectensis based on our analysis of Pfam domains in the predicted proteins from the genome assembly, but the presence of a canonical TLR has been reported in two other analyses of based on different data sets (Miller et al., 2007; Sullivan et al., 2007). **: we did not detect NF-κB in Capsaspora owczarzaki based on our analysis of Pfam domains in the predicted proteins from the genome assembly, but it has been previously reported to be present (Sebé-Pedrós et al., 2011).
- https://doi.org/10.7554/eLife.34226.034
-
Supplementary file 7
List of the 75 choanoflagellate-specific gene families that are present in all choanoflagellates in this study.
Each feature (Panther, Pfam, Transmembrane, Signal Peptide, GO terms) is preceded by the fraction of proteins in the gene family annotated with the feature. Multiple annotations are separated by semicolons. The column ‘Pfam Kinase/Phosphatase/SH2/SH3’ indicates gene families that contain Pfam domains related to kinase signaling; the value shown represents the kinase-related Pfam domain with the maximum fraction annotated within the gene family.
- https://doi.org/10.7554/eLife.34226.035
-
Supplementary file 8
Results of a MAPLE analysis comparing the gene family content of the Urchoanozoan to the Urmetazoan, to determine gains and losses on the animal stem lineage.
Only those differing in completeness by at least 25% are shown. Classifications and names are from MAPLE.
- https://doi.org/10.7554/eLife.34226.036
-
Supplementary file 9
Results of a MAPLE analysis comparing the gene family content of the Urchoanozoan to the Urchoanoflagellate, to determine gains and losses on the choanoflagellate stem lineage.
Only those differing in completeness by at least 25% are shown. Classifications and names are from MAPLE.
- https://doi.org/10.7554/eLife.34226.037
-
Supplementary file 10
Results of a MAPLE analysis comparing the gene family content of the Urholozoan to the Urchoanozoan, to determine gains and losses on the choanozoan stem lineage.
Only those differing in completeness by at least 25% are shown. Classifications and names are from MAPLE.
- https://doi.org/10.7554/eLife.34226.038
-
Supplementary file 11
Details on antibiotics tested to reduce bacterial diversity and abundance in different choanoflagellate cultures.
- https://doi.org/10.7554/eLife.34226.039
-
Supplementary file 12
Characteristics of growth media used.
n.d.: not determined.
- https://doi.org/10.7554/eLife.34226.040
-
Supplementary file 13
Counts of gene family presence, gain and loss in last common ancestors of interest, as calculated by different ancestral reconstruction methods, and from a previous data set (Fairclough et al., 2013).
Gains and losses are not shown for the last common ancestor of eukaryotes, as our data set only contained eukaryotic species and was thus not appropriate to quantify changes occurring on the eukaryotic stem lineage. Similarly, because the Bayesian analysis (MrBayes) required an outgroup species to be specified within the data set, we could not estimate gene family presences for the last common ancestor of eukaryotes. The data set of Fairclough et al. (2013) included only two choanoflagellates, M. brevicollis and S. rosetta, and did not include any non-choanozoan species within Holozoa. The higher gene family counts produced by Dollo parsimony on our data set in comparison to Fairclough et al. (2013) were due to a combination of true and false positives: the additional species included in our analysis allowed OrthoMCL to identify a larger set of truly orthologous genes, but false positives also resulted from providing many additional species’ protein catalogs as input to OrthoMCL without the subsequent application of a probability-based approach to filter out spurious BLAST hits.
- https://doi.org/10.7554/eLife.34226.041
-
Supplementary file 14
Representative signaling genes in the animal TLR-NFκB pathway with their representatives in mouse (Mus musculus).
Functions and roles are derived from the UniProt database. Pfam domain architectures are separated by tildes (~) and are listed in order. When two architectures are possible, they are separated by ‘or’. Pfam domain architecture phylogenetic distribution represents the phylogenetic group containing all of the species with that architecture in the Pfam database. Similarly, gene family phylogenetic distribution represents the phylogenetic group containing all of the species with representative proteins in the gene family. Notes contains either a description of the species/genes present in the gene family, or a brief summary of the blastp hits in the NCBI nr database for proteins encoded by select species in the gene family, which we used to verify the assignment of the protein to the gene family.
- https://doi.org/10.7554/eLife.34226.042
-
Transparent reporting form
- https://doi.org/10.7554/eLife.34226.043
Download links
A two-part list of links to download the article, or parts of the article, in various formats.
Downloads (link to download the article as PDF)
Open citations (links to open the citations from this article in various online reference manager services)
Cite this article (links to download the citations from this article in formats compatible with various reference manager tools)
Gene family innovation, conservation and loss on the animal stem lineage
eLife 7:e34226.
https://doi.org/10.7554/eLife.34226


