Formation of retinal direction-selective circuitry initiated by starburst amacrine cell homotypic contact
- Duke University School of Medicine, United States
- Vanderbilt University School of Medicine, United States
Figures
Figure 1 with 2 supplements
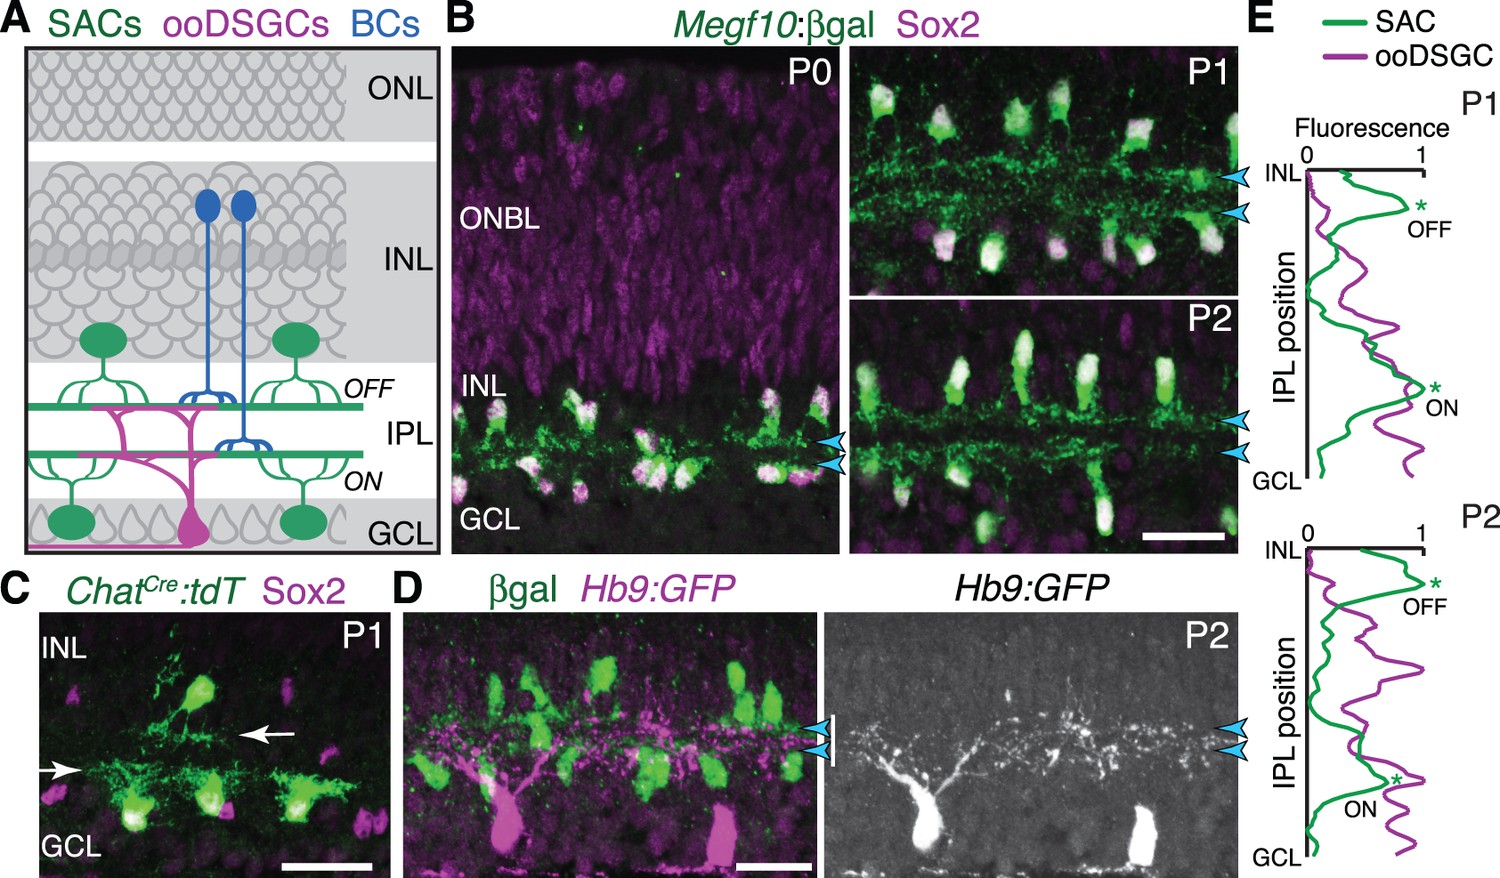
Initial formation of DS circuit IPL sublayers.
(A) Schematic of mature direction-selective (DS) circuit and its cell types, depicted in cross-section. SACs (green) and bipolar cells (blue) project to one of two IPL sublayers (OFF, ON). OFF SACs reside in inner nuclear layer (INL); ON SACs reside in ganglion cell layer (GCL). ooDSGCs (purple) send dendrites to both DS circuit sublayers. ONL, outer nuclear layer. (B) SAC IPL sublayer formation assessed in Megf10lacZ mice. All SACs are double-positive for anti-Sox2 (purple) and anti-βgal (green). Progenitors in outer neuroblast layer (ONBL) also express Sox2. SAC IPL sublayers (arrowheads) begin to appear by P0, and are fully apparent by P1. (C) Sparse labeling of neonatal SACs in ChatCre mice. Individual SACs have laminar-specific projections by P1 (arrows). tdT, tdTomato. (D,E) ooDSGCs (labeled by Hb9-GFP) project diffusely in the IPL at P1-P2, whereas SAC arbors are stratified (arrowheads). (D) retinal cross-sections. Vertical white bar denotes IPL width. E: Fluorescence intensity plots of SAC and ooDSGC dendrite staining across IPL, from representative images (P2 image in D; P1 image in Figure 1—figure supplement 2). ON and OFF strata (asterisks) are clear for SACs but not for ooDSGC dendrites. Scale bars: 25 µm.
Figure 1—figure supplement 1

Characterization of SAC markers in neonatal retina.
(A) Sox2 and Megf10 as SAC markers at P0. Individual color channels of P0 cross-section image shown in Figure 1B. Sox2 (A, left panel) is a pan-SAC nuclear marker. Antibodies to Sox2 strongly label all SACs in the inner nuclear layer (INL) and ganglion cell layer (GCL), as well as astrocytes in the nerve fiber layer (NFL). Progenitor cells in the outer neuroblast layer (ONBL) are weakly labeled. Antibodies to βgal (A, right panel) label the complete SAC population in Megf10lacZ mice. Horizontal cells (HCs) in outer retina are also labeled. (B) Antibodies to MEGF10 (purple) are selective for SACs and label the complete SAC population. ChatmG mice (i.e. ChatCre crossed to membrane-targeted GFP Cre reporter) label a subset of SACs in the neonatal retina (green). Whereas ChatCre is a marker of the full SAC population at later stages, its expression in neonatal retina is more sporadic (Xu et al., 2016). We took advantage of this feature for two purposes: (1) single-cell anatomy studies of SAC dendrite morphology, as shown here; and (2) sporadic early knock-out of genes in a sparse subset of SACs (see Figure 6). Scale bars: 25 µm.
Figure 1—figure supplement 2

ooDSGC stratification in neonatal retina.
(A) Anatomy of P1 ooDSGCs labeled with Hb9-GFP. SACs are labeled by Megf10:βgal. At this age, ooDSGC dendrites are rudimentary with few branches. No IPL stratification is evident. This cell was used for the IPL fluorescence plot shown in Figure 1E. (B) Examples of P2 ooDSGCs that were scored as diffusely projecting (left) or stratified (right). Blue arrowheads, SAC sublayers. Arrow (center panel), arbors that fill IPL in area between SAC strata. See main text for quantification of stratification frequency. Scale bars: 25 µm.
Figure 2 with 3 supplements

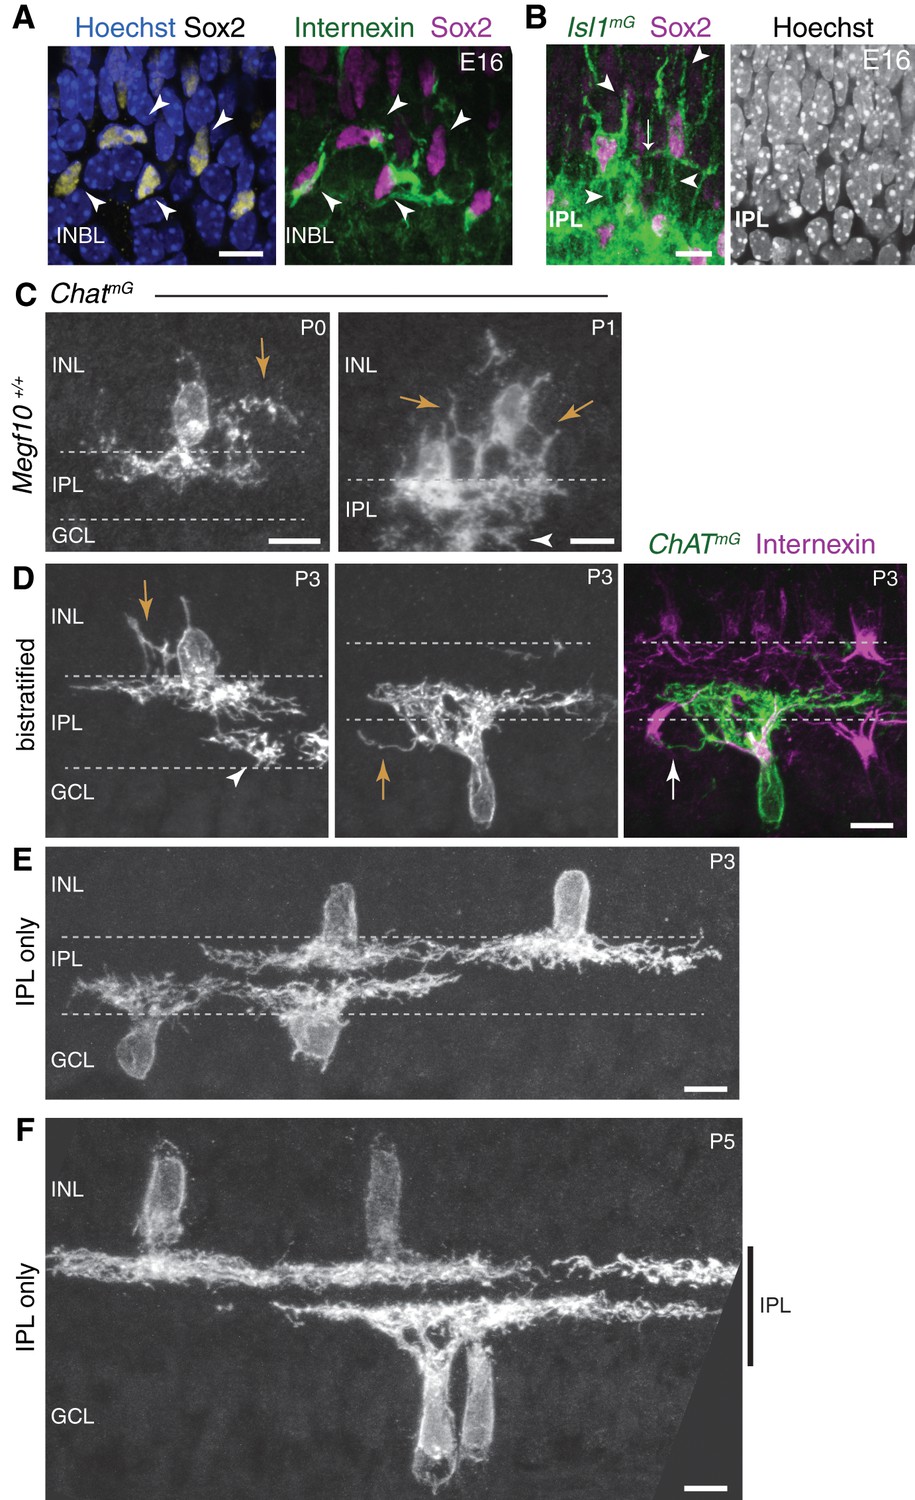
Newborn SACs contact each other via a network of soma layer arbors.
(A,B) Isl1 labels SACs and RGCs in embryonic retina. A, immunostaining; B, mGFP driven by Isl1Cre (Isl1mG). Arrows, newborn SACs migrating apico-basally through ONBL. INBL SACs and RGCs predominantly reside in indicated regions. IPL neuropil (asterisks) exists in discontinuous patches at this age. NFL, nerve fiber layer containing RGC axons. Blue, nuclear counterstain. (B,C) Migrating SACs in ONBL (arrows) have multipolar morphology. They are far from other SACs and do not contact them. (D) Morphology of Sox2+Isl1+ SACs (large arrows) upon arrival at INBL. SACs contact each other outside the IPL (small arrow, connecting arbor). Their migratory morphology and distance from IPL (asterisks) indicate they have not yet innervated IPL (also see Figure 2—figure supplement 2). (E) Internexin immunostaining reveals polarization of SAC primary dendrites. SACs project toward IPL at P2. E16 INBL SACs often project tangentially within INBL, towards neighboring SAC somata (arrows). (F) Quantification of primary dendrite orientation. Left, polar histogram (raw counts) of primary dendrite angles (absolute values). 0˚ was defined as perpendicular towards IPL. Note that E16 and P1 are displayed on different scales; each plot is scaled to size of largest bin, aiding legibility in E16 plot where bin sizes are more evenly distributed. Right, fraction of dendrites oriented towards IPL, ONBL, or tangential quadrants of the polar plot (denoted by dashed lines, labels). Sample size of scored dendrites is indicated. (G) A network of arbors (arrows) connects somata of INBL SACs at E16. The network remains prominent in INL at P0 but is mostly gone by P2. Arrowhead, IPL-directed projection. (H,I) An individual P1 OFF SAC labeled by ChatmG, imaged en face to show its arbor morphology at IPL and INL levels. Full SAC population is revealed using Megf10:βgal. INL arbors (I) make selective contacts with SAC neighbors (purple): GFP+ arbor tips terminate on SAC somata (orange arrow) or SAC arbors (white arrows). Right panel (I) Higher magnification view of touching arbors. Images are Z-projections of confocal stacks encompassing each arbor’s volume (H, 2.0 µm; I, 3.5 µm). Projections are shown for illustration but all contacts were verified across stack volume – see Figure 2—figure supplement 3 for details. (J,K) Individual P1 OFF (K) and ON (L) SACs labeled by ChatmG (green) in cross-section. Purple, full SAC population. Some SACs are bi-laminar with arbors that contact neighboring somata (arrows, left panels); others project only to IPL (right panels). (L) Frequency of soma layer projections across development, determined from single ChatmG cells as in J,K. Error bars, standard error. Sample sizes, see Methods. (M) Schematic of newborn SAC morphology based on B-L. Soma-layer homotypic contacts are established upon completion of migration and are mostly eliminated by P3. Scale bars: 25 µm (A,B); 10 µm (all others).
Figure 2—figure supplement 1

Characterization of internexin as a primary dendrite marker of developing SACs.
(A) Expression pattern of internexin in P2 mouse retina. Internexin (Intnx) immunoreactivity is detected in Sox2+ SACs, and in RGC axons within the nerve fiber layer (NFL). This pattern is typical of the entire first postnatal week. In RGCs, axons are selectively labeled; their cell bodies in the GCL are internexin-negative. In SACs, internexin selectively labels primary dendrites, as well as the portion of the soma from which the primary dendrites arise. Therefore, internexin+ intermediate filaments are trafficked to specific subcellular compartments of both SACs and RGCs. P2 SACs are strongly polarized toward the IPL (also at P1; see D). Note that this image is the same one depicted in Figure 2E, but cropped differently; also, colors have been reversed to match other panels of this figure. (B) An individual E16 INBL SAC (asterisk), surrounded by Isl1mG-positive RGCs (identified as RGCs because they lack Sox2 or internexin staining). At E16, internexin has the same subcellular localization within SACs as at P1-2 (A,D) It localizes to the primary dendrites (arrow) and the side of the cell body from which it emerges. However at E16, SAC primary dendrite orientation is more variable than at P2 (see Figure 2E,F). This SAC sends a primary dendrite toward the outer retina (ONBL) where it could potentially contact migrating SACs as they arrive at the INBL. (C) Antibodies to internexin strongly label SAC primary dendrites originating from the cell body (arrows), but fine dendritic branches within IPL are unlabeled. Occasionally, higher order branches arising from the primary dendrites are weakly labeled. ChatmG was used to reveal the full dendritic arbor. (D) Internexin distinguishes IPL-directed primary dendrites from soma-layer arbors in neonatal SACs. Isl1mG labels full morphology of bi-laminar P1 OFF SACs (asterisks) that project to both INL and IPL. Only IPL-directed primary dendrites of these cells are internexin-positive (middle, right panels). (E) Schematic of method used to measure primary dendrite orientation (Figure 2F). For each cell, the angle between the primary dendrite (arrowhead) and a plumb line directed to IPL was measured. Cells projecting within the labeled quadrants were defined as projecting toward IPL, toward ONBL, or tangentially (Tan). Scale bars: 25 µm (A), 10 µm (B–D).
Figure 2—figure supplement 2
Soma-layer SAC arbors across development.
(A) E16 soma-layer arbor network can be established prior to IPL formation. Right panel, same cells as Figure 2E, showing INBL SACs projecting toward each other. Left panel, same field of view showing Sox2 SAC nuclear marker and Hoechst nuclear stain (blue). These SACs are surrounded by other INBL cell bodies, with no IPL neuropil evident in this retinal region. (B) E16 homotypic SAC soma contacts occur outside the IPL. Left panel, same cells as Figure 2D. Cells have migratory morphology, as shown by their prominent apical and basal processes (arrowheads). They do not make obvious projections into IPL, delineated by dense Isl1mG staining. Contact between the two SACs (arrow) occurs outside of IPL Right panel, Hoeschst nuclear stain confirms location of nascent IPL inferred from Isl1mG labeling. IPL is narrow cell-free gap that corresponds to location of dense GFP+ arbors (left panel). (C) Examples of soma layer-projecting ChatmG-labeled SACs in mice that are wild-type at the Megf10 locus (Megf10+/+), demonstrating that the soma-contacting arbors shown in Figure 2H–K are not a consequence of Megf10 heterozygosity. Arrows, arbors in INL. Arrowhead, arbors arising from a neighboring ON SAC with cell body located in adjacent section. (D–F) Examples of P3 (D–E) and P5 (F) cells used to generate graph in Figure 2L. SAC single-cell morphology was revealed using ChatmG labeling. At P3, most SACs project only to the IPL (E), but some SACs still make soma-layer projections (D). Representative INL-projecting OFF cell (D, left) and GCL-projecting ON cell (D, center, right) are depicted. The ON cell makes contact with the neighboring internexin-positive SAC soma (arrow in right panel of D). Arrows, soma-layer projecting arbors. Arrowhead, arbor of a neighboring ON SAC only partially present in the section. At P5 (F), all SACs project exclusively to IPL (vertical bar). All scale bars: 10 µm.
Figure 2—figure supplement 3
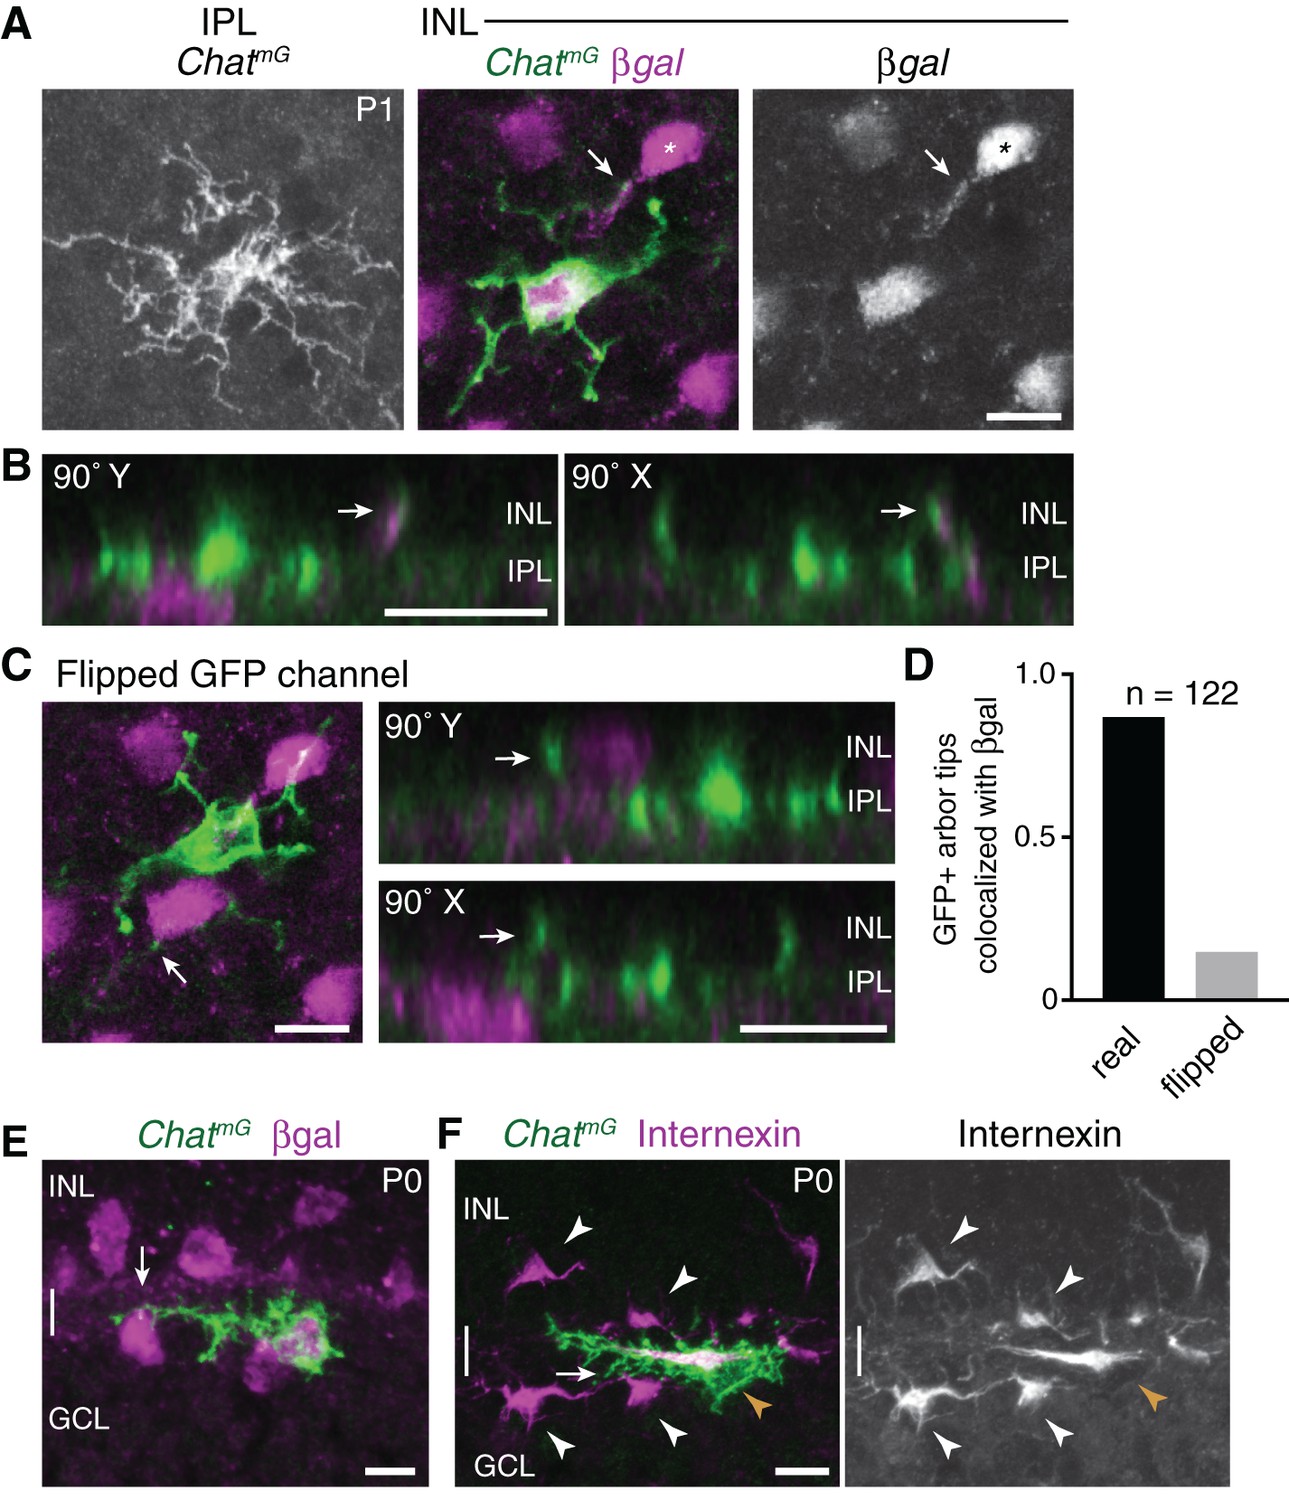
Homotypic specificity of soma-layer SAC projections.
(A) Single SAC from P1 ChatmG retinal whole-mount, imaged at level of IPL (left) and INL (center, right). Megf10:βgal marks the full SAC population. INL images are from a single confocal Z-stack plane. A GFP+ arbor tip that terminates on a βgal-positive neighboring SAC is marked (arrow, arbor tip). Most of the cell’s other arbor tips are outside this focal plane, where several terminate on other SACs (not shown). IPL image is a maximum-intensity projection of 3 Z-stack slices (1.5 µm total distance). (B) Orthogonal (90˚ rotation) views of a Z-stack (0.5 µm Z resolution) through the cell shown in A. Left, Y-axis rotation; right, X-axis rotation. Arrows mark the same interacting INL arbors as in A. Note colocalization of green and purple arbors regardless of whether cell is viewed en face (A), or from the orthogonal perspectives (B). (C) The same cell as in A but with the GFP channel flipped in X and Y. This serves as a negative control to test whether superposition of GFP and βgal signals might occur by chance, given the density and geometry of each staining in the P1 retina. Arrows mark same arbor tip as in A,B. In en face view (left), the arbor crosses a βgal+ cell body but terminates just beyond it. The lack of colocalization between this arbor tip and the adjacent cell body is clear in orthogonal rotation views (right). (D) Quantification of INL arbor homotypic specificity. The fraction of ChatmG-labeled SAC dendrite arbor tips terminating on βgal+ neighbors was counted by examining z-stacks and orthogonal views (as in B). This was done for real image stacks, as well as for stacks with one channel flipped as in C. A high rate of homotypic interaction was observed for the real data (88.8%) but not the flipped negative control data (14.9%). Sample size, n = 122 arbors from 22 SACs, two retinas each genotype. (E,F) ON SACs can contact neighboring SAC somata (arrows) without being bi-laminar. Cross-sections of P0 retina, co-stained for individual SACs (ChatmG) and markers of the complete SAC population (E, Megf10:βgal; F, internexin). The two cells shown here establish soma contact without a separate GCL projection; instead, these cells send fine branches from their IPL arbors to establish contact. These cells are representative of a phenomenon that was observed frequently among ON SACs at P0. The existence of such cells may help explain why the frequency of soma layer-projecting ON SACs is lower than for OFF SACs (Figure 2L). Internexin staining (F) shows that these ON SACs (orange arrowhead) are polarized in the tangential plane along the INL-GCL border towards their neighbors, adopting a horizontal morphology distinct from surrounding OFF and ON SACs (white arrowheads). This morphology is typical of a displaced amacrine cell in the process of crossing from the INL to the GCL (Chow et al., 2015). Scale bars: 10 µm.
Figure 3 with 2 supplements

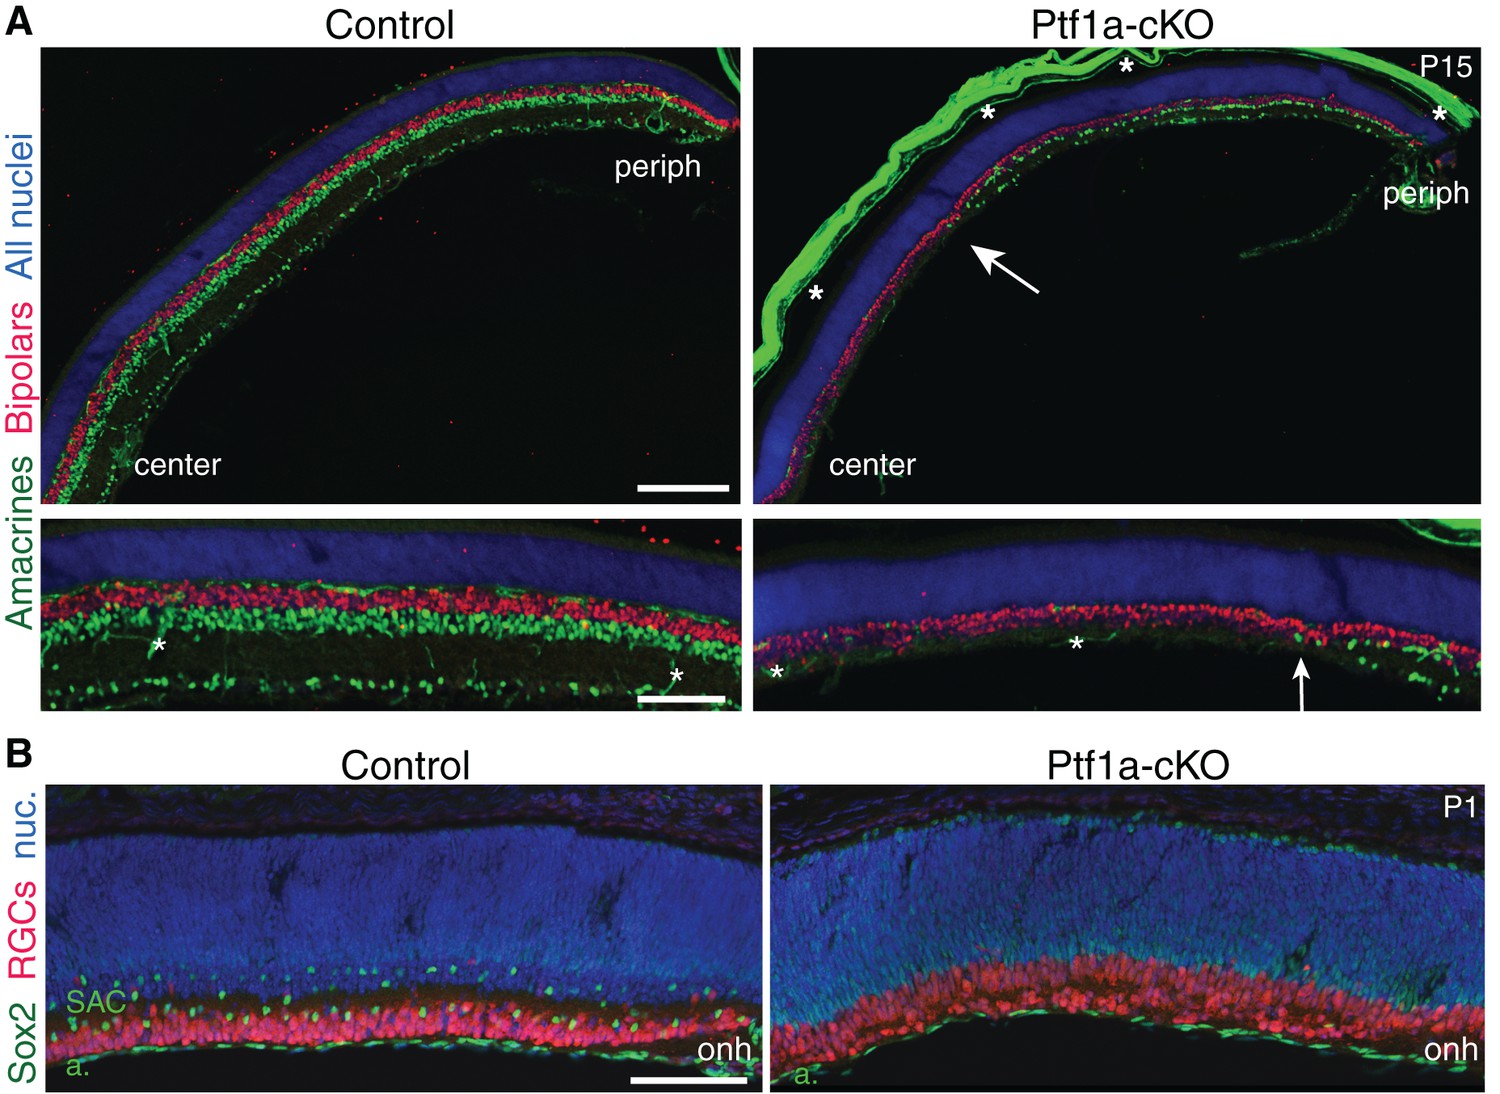
SAC homotypic contact is required for IPL sublayer formation.
(A) Top: Schematic illustrating Six3-Cre expression pattern in retinal cross-section. Bottom: En-face view of Six3-Cre recombination in peripheral retina, revealed using GFP Cre reporter. Asterisks, Cre– regions. (B) Reduced SAC density in Ptf1a-cKO retina. SACs (labeled by Sox2 and Megf10lacZ) are completely eliminated from Ptf1a-cKO central retina; some remain in peripheral retina (boxed regions, right panels). Top, littermate control (Ptf1a+/+). (C) En-face view of SACs in peripheral retina of Ptf1a-cKO and littermate control. Green, GFP Cre reporter. Control SACs were either Cre+ or Cre–. Mutant SACs were Cre– (arrows), indicating that they derive only from cell lineages that maintain Ptf1a function. (D–F) SAC IPL laminar targeting in Ptf1a-cKO (E,F) and littermate control (D). Ptf1a-cKO SACs close enough to touch (E) form IPL strata (blue arrowheads), similar to control SACs (D). Solitary SACs (F) are not polarized toward IPL; they have extensive INL-directed arbors (white arrows) and rudimentary IPL-directed arbors (orange arrows). Some solitary SACs entirely fail to innervate IPL (F, left cell) and resemble migrating E16 SACs (Figure 2B,C); others innervate IPL with minimally branched, non-stratified arbors (F, right cell). (G) Quantification of SAC dendrite phenotypes at P1-2. Left, frequency of soma layer innervation. *p=0.0350; **p=0.0081; ns, p=0.7516. Center, frequency of IPL innervation failure (e.g. F, left). ***p=4.0×10⁻⁷; ns, p=0.3723. Right, frequency of cells that send arbors into IPL but fail to stratify (e.g. F, right). *p=0.0110; ***p<1.0×10⁻⁷. Dots, individual animals. Error bars, S.E.M. p-values, Tukey’s post-hoc test. Sample sizes, see Methods. (H) Summary of Ptf1a-cKO SAC phenotype. Touching SACs are similar to wild-type SACs (Figure 2M); they are able to innervate the IPL and form sublayers. Solitary SACs remain multipolar, similar to migrating SACs, and fail to innervate the IPL. Soma layer arbors are more elaborate than in wild-type or touching SACs. Scale bars: 25 µm (A,C); 200 µm (B, left), 50 µm (B, right), 10 µm (D–F).
Figure 3—figure supplement 1
Retinal cell types in Ptf1a-cKO mutants.
(A) Immunostaining with pan-amacrine marker AP2α (green) and pan-bipolar marker Chx10 (red), in littermate control and Ptf1a-cKO retinal cross-sections. Blue, Hoechst nuclear counterstain. Top panels: low-power view illustrating center-peripheral differences in amacrine number that arise due to Cre expression pattern (see Figure 3A–C). Bottom panels: Higher magnification views of mid-peripheral retina. AP2α+ cells are completely eliminated from Ptf1a-cKO central retina. Some amacrines that have escaped Cre recombination (see Figure 3C) are produced in the periphery, albeit at lower density than controls. Arrow marks central-most amacrine cells. Bipolar cell number is not obviously different between genotypes. Asterisks, non-specific staining, due to anti-mouse secondary antibody, in blood vessels and sclera. Note that sclera became detached from control section prior to imaging. (B) Cross-sections through central retina of littermate control and Ptf1a-cKO mutant, stained for pan-RGC marker RBPMS (red) and Sox2 (green) to mark SACs. Blue, Hoechst nuclear counterstain (nuc). Optic nerve head (onh) marks center of retina. In Ptf1a-cKO mice, SACs are entirely absent from central retina, but Sox2+ astrocytes (a) in nerve fiber layer are present in normal numbers. RGC cell number appears to be increased, consistent with previous observations in embryonic retina of Ptf1a null mice (Fujitani et al., 2006; Nakhai et al., 2007). Scale bars: 200 µm (A top); 100 µm (A bottom, (B).
Figure 3—figure supplement 2

SAC anatomy in Ptf1a-cKO mutants.
(A–D) Additional representative examples of SACs in Ptf1a-cKO retinal cross-sections, from dataset used to compile graph in Figure 3G. Neurons were validated as SACs by co-expression of Megf10:βgal and Sox2. Touching SACs (D) stratify their arbors normally (arrowhead). Note that the right-hand cell appears to be polarized toward the left-hand cell, suggesting asymmetric growth toward the side with homotypic contact and away from the side lacking it. Representative solitary SACs are shown in A-C. A depicts same cells as Figure 3F (βgal channel only) in grayscale to highlight arbor morphology. Two cells (A, left; B) are examples of the class that failed to project to the IPL. The other cells (A, right; C) exemplify the class that sends only abnormal unbranched, unstratified arbors into the IPL. The cell in C also has particularly exuberant arbors in the INL that were much larger than those seen in any cells that touched their neighbors (e.g. D; also see Figure 3D,E). White arrows, soma-layer arbors. Orange arrows, IPL arbors. (E,F) SAC errors in Ptf1a-cKO mutants persist to maturity. P15 littermate control (E) and mutant (F) retinal cross-sections stained for anti-ChAT to label SACs (red) and anti-GAD65 to label a broad non-SAC amacrine population (green). Control SACs no longer have soma layer arbors at this age; the only processes not directed toward the IPL were very short and minimal (E, arrowhead). In mutant retina, SACs from low-density regions often innervated the INL (F, white arrowheads), or failed to innervate gaps in the SAC IPL network (F, orange arrowhead). SACs that made errors likely interacted in the IPL with GAD65+ amacrine cell arbors (F, arrows) because these arbors completely filled the IPL in the region innervated by the SAC dendrites. This suggests that generic amacrine contacts are not sufficient to prevent SAC errors. Instead, because these SACs had few homotypic neighbors, the errors were likely due to paucity of SAC-SAC interactions. Scale bars: 10 µm (A–D); 25 µm (E,F).
Figure 4
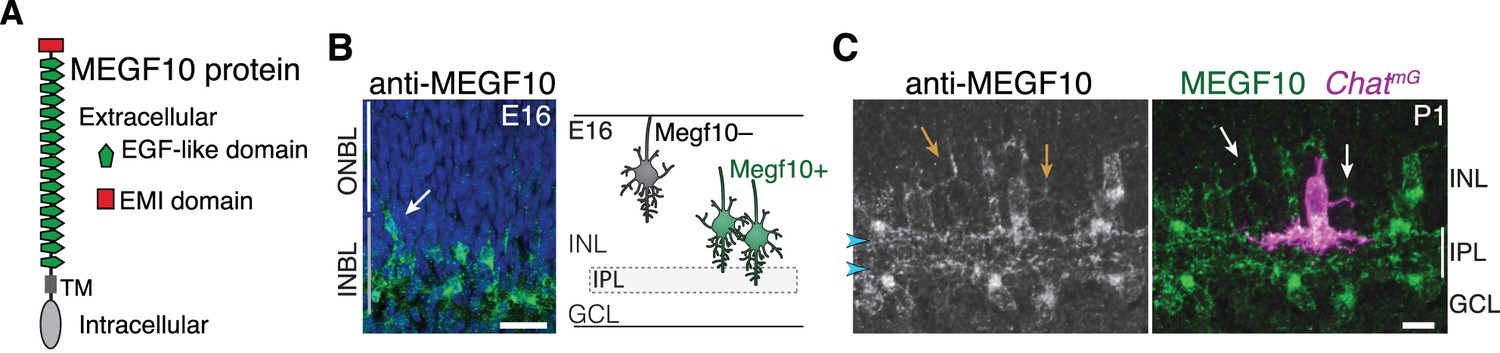
MEGF10 is expressed by SACs during early homotypic contact.
(A) Schematic of MEGF10 protein. TM, transmembrane domain. (B) Left, MEGF10 immunostaining at E16 reveals onset of protein expression at conclusion of radial migration. INBL SACs express MEGF10, but SACs migrating through ONBL do not. Arrow, INBL SAC with migratory morphology suggesting it is newly arrived. Right: Schematic illustrating timing of Megf10 expression onset in SACs (also see Kay et al., 2012). (C) SAC arbors in the INL (arrows) express MEGF10 protein. IPL dendrites are also labeled (arrowheads). Scale bars: 25 µm (B); 10 µm (C).
Figure 5 with 1 supplement
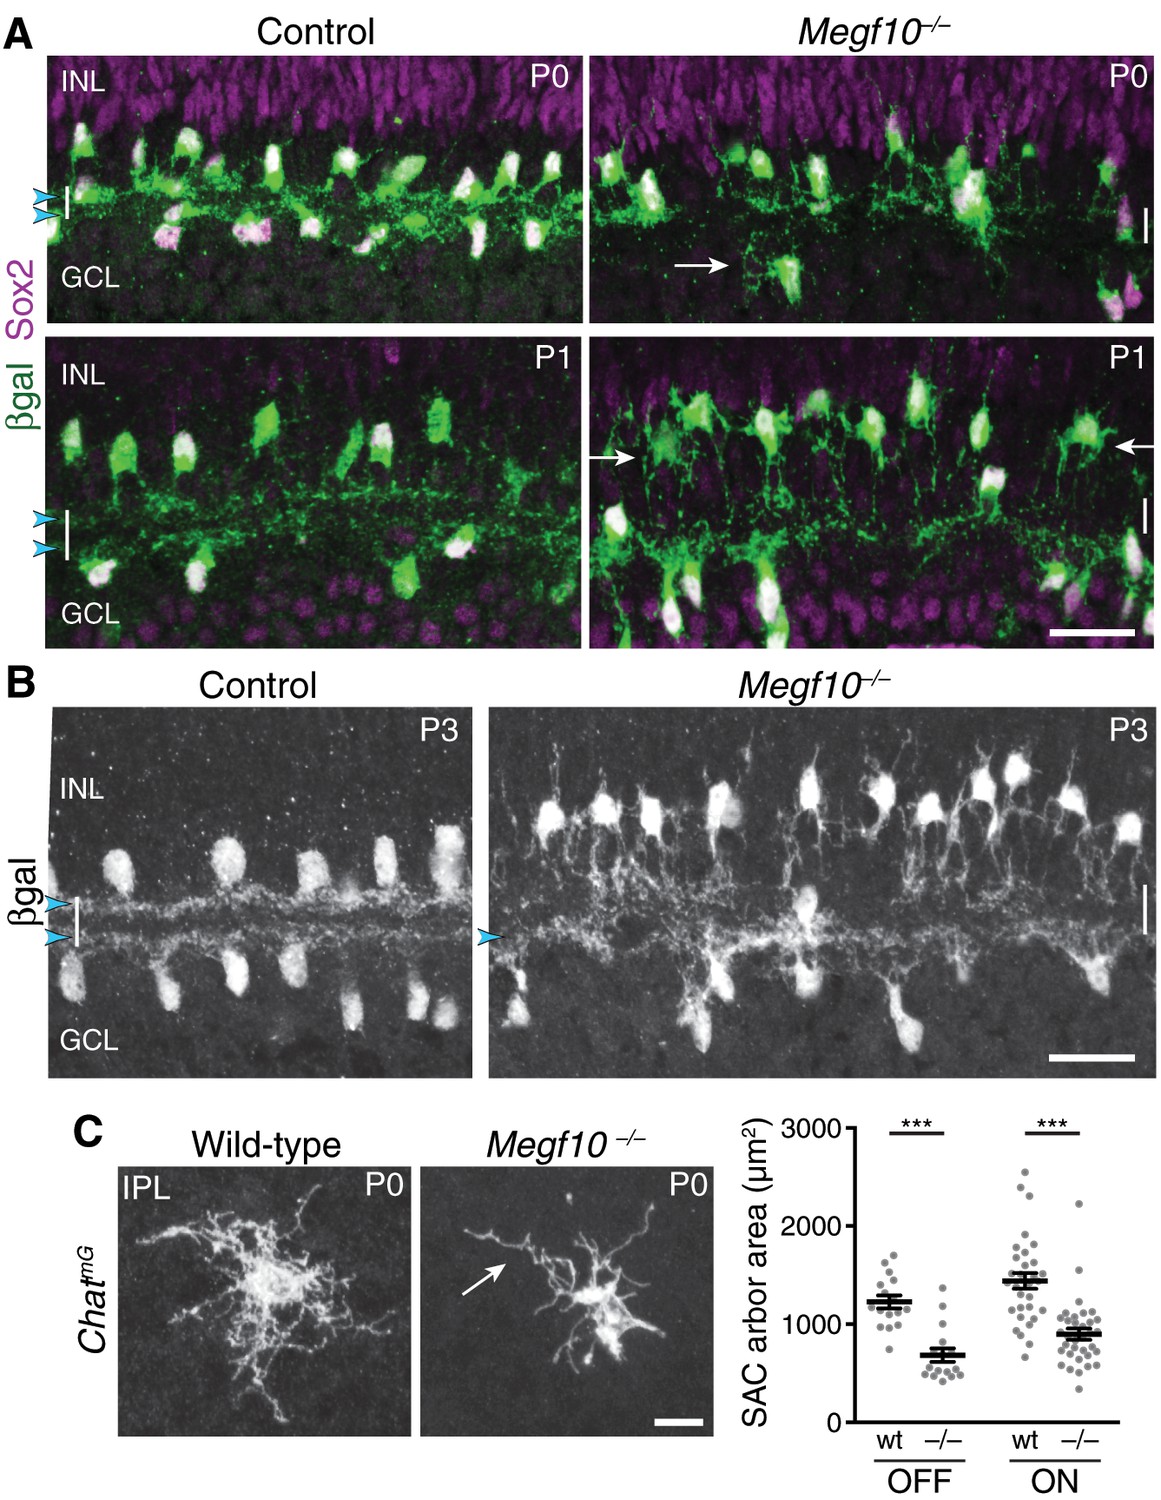
Megf10 is required for initial formation of SAC IPL sublayers.
(A) SAC sublayers are absent from P0-1 Megf10 mutant IPL. Antibodies to Sox2 and βgal reveal SACs in retinal cross-sections. Littermate control, Megf10lacZ/+. Vertical white lines denote IPL location. Arrowheads, SAC IPL strata. Arrows, exuberant arbor growth in mutant INL and GCL. Note that mutant somata abut the IPL at P0, indicating their radial migration was similar to controls. By P1 OFF somata have moved apically. (B) At P3, SAC IPL sublayers remain disrupted in Megf10 mutants. Mutant OFF SACs mostly fail to ramify arbors in IPL; instead they arborize in INL (also see Figure 6). INL projections are absent from controls. Some ON SACs are stratified in mutants (arrowhead) but have not yet formed a continuous restricted sublayer as is seen in controls. (C) Individual SACs show IPL innervation deficits in Megf10 mutants. En-face whole-mount view of single P0 OFF SAC IPL arbors. Mutant SAC IPL dendrites appear undifferentiated, with less branching (arrow). Their arbors cover smaller retinal territories than SACs from wild-type (wt) littermate controls (quantified at right, mean ± s. e. m.). Images are Z-projections of slices encompassing full IPL arbor volume. ***p(on)<1.0×10⁻⁷, p(off)=9.38×10⁻⁵; one-way ANOVA/Tukey’s post-hoc test. Sample size, see Methods. Scale bars: 25 µm (A,B); 10 µm (C).
Figure 5—figure supplement 1

Gad1-GFP+amacrine cells show normal dendrite projections in Megf10 mutants.
(A) Retinal cross-sections from P1 mice carrying Gad1-GFP transgene. GFP labels a large subset of amacrine cells in INL. Sox2+ SACs do not express GFP. Therefore, the GFP+ cells constitute a broad non-SAC amacrine population. (B); Retinal cross-sections from P1 Megf10 mutants and littermate (Megf10+/–) controls carrying Gad1-GFP. Unlike SACs (Figure 5A), Gad1-GFP+ amacrine cells innervated the INL normally in Megf10 mutants, and did not make exuberant projections within the INL. Scale bars: 25 µm.
Figure 6 with 1 supplement
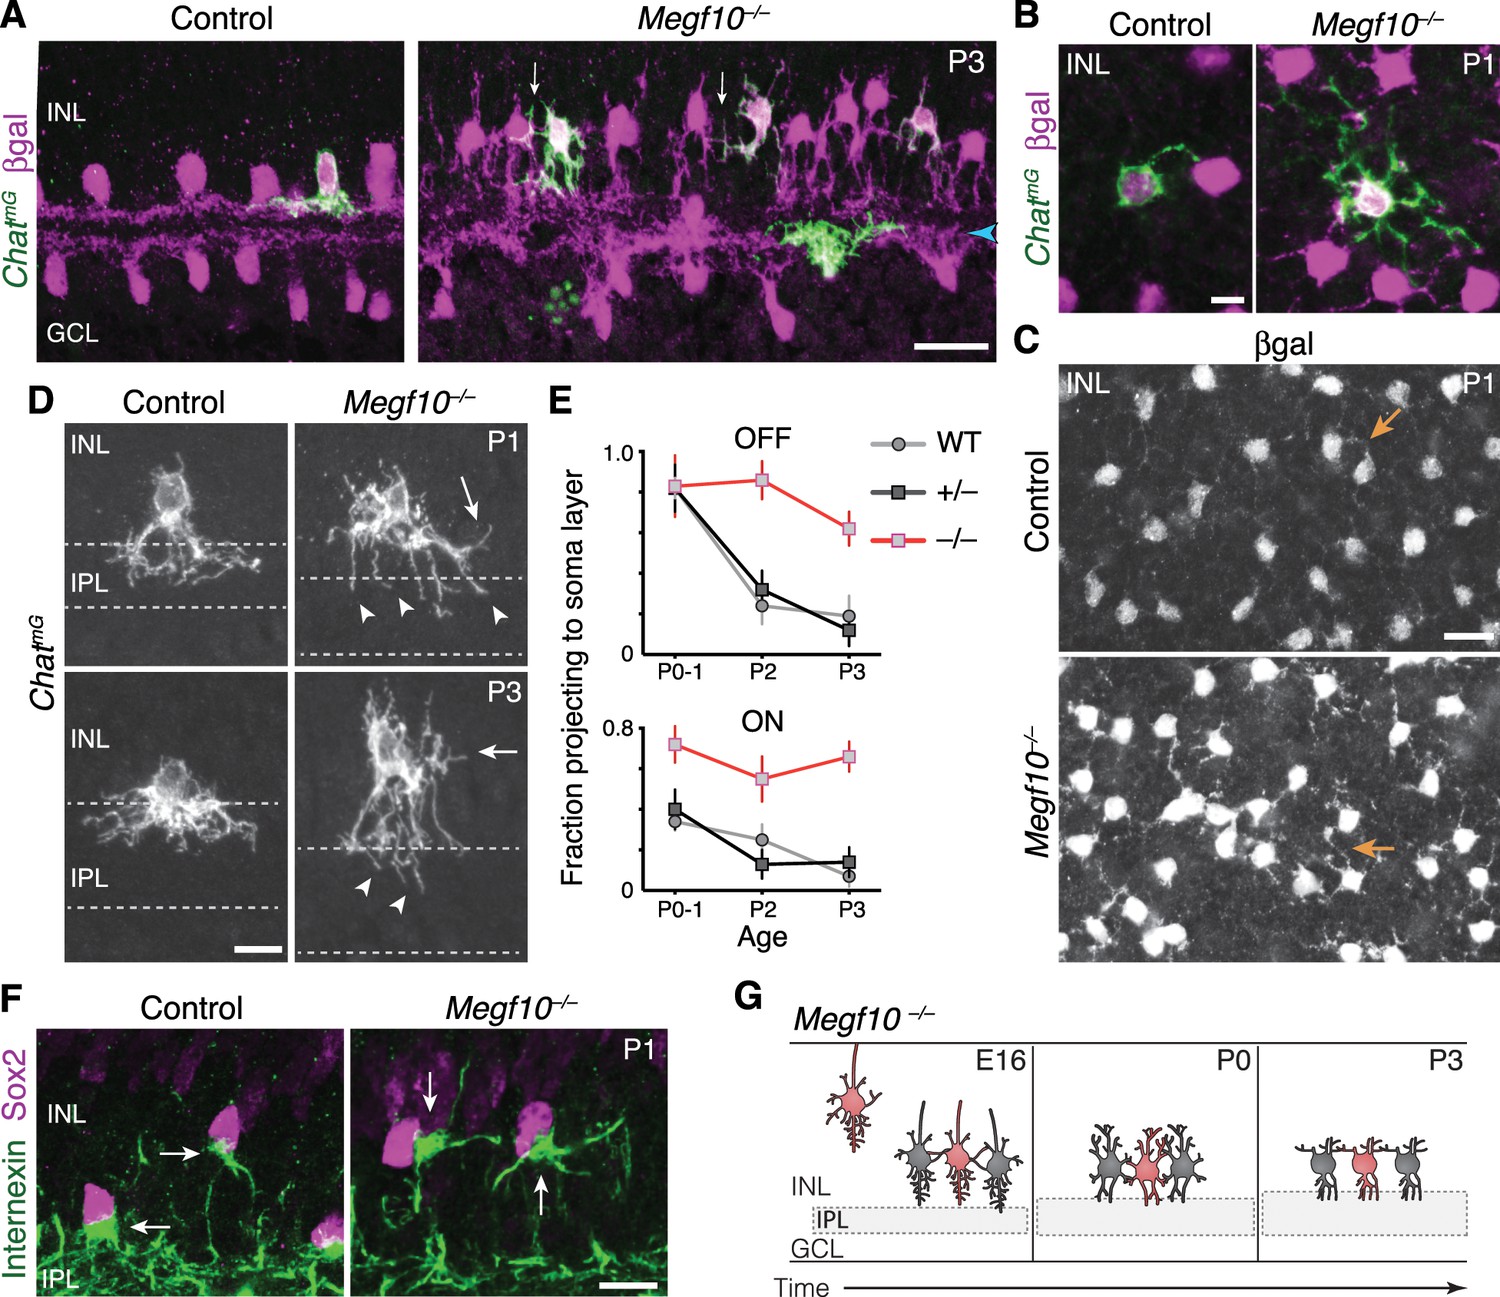
Exuberant soma-layer innervation by Megf10 mutant SACs.
(A,B) Individual SACs seen in cross-section (A) and whole-mount en face view (B) of ChatmG tissue at indicated ages. Megf10 mutant SACs have more extensive branches in INL than littermate Megf10+/– SACs. Images in B are Z-projections of confocal slices encompassing each cell’s INL arbors. (C) En face images of βgal staining to show complete SAC INL network at P1. INL projections (arrows) are present at this age in controls (top); however, they are much more prominent in mutants (bottom), consistent with single-cell anatomy (B). Images are Z-projections of confocal slices encompassing volume of 2.0 µm (bottom) or 2.4 µm (top). (D) Higher-magnification view of individual OFF SACs labeled as in A. Genotypes and ages are indicated. Arrows, arbors in INL. Dashed lines denote borders of IPL. Mutant IPL projections (arrowheads) fail to arborize or stratify. See Figure 6—figure supplement 1 for ON SACs. (E) Frequency of soma layer projections across development in mutants (–/–) and littermate controls (+/–), determined from single ChatmG cells as in D. Wild-type (WT) data replotted from Figure 2L to show that +/– controls resemble WT. Error bars, standard error. Sample size, see Materials and methods. (F) Internexin immunoreactivity reveals orientation of SAC primary dendrites (arrows) at P1. Right: Example of mutant SACs projecting primary dendrites in tangential plane, within soma layer. Control primary dendrites were almost exclusively oriented towards IPL (left). (G) Summary of Megf10–/– phenotype. After initial contact at E16, mutant SACs do not immediately innervate the IPL, instead overgrowing arbors in cell body layers. This leads to delayed sublayer formation and persistent soma-layer projections at P3. Scale bars: 25 µm (A,C); 10 µm (B,D,F).
Figure 6—figure supplement 1
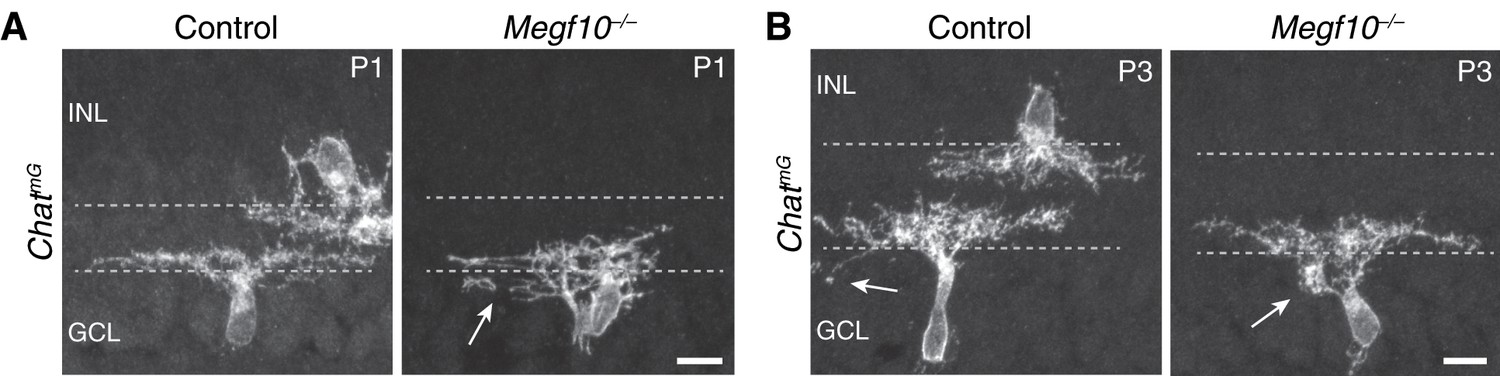
ON SACs also make exuberant soma-layer projections in Megf10 mutants.
(A,B) Examples of P1 (B) and P3 (C) ChatmG-labeled ON SACs that were part of the dataset used to generate graphs in Figure 6E. At P1 (B) many mutant ON cells are bi-laminar, with projections in both IPL and GCL (arrow, GCL arbor). IPL projections were underdeveloped relative to controls, and not sufficient to generate a clear sublayer (Figure 5A). C: P3 control and mutant ON SACs, both of which project to the GCL. The control cell sends a single arbor to the GCL (left, arrow), typical of those few SACs that still project to the soma layers at this age. The mutant cell (right) makes a dense dendritic arborization in the GCL (right, arrow), which was never seen in P3 controls. Scale bars: 10 µm.
Figure 7 with 2 supplements

Megf10 mediates transcellular SAC signals for dendrite development.
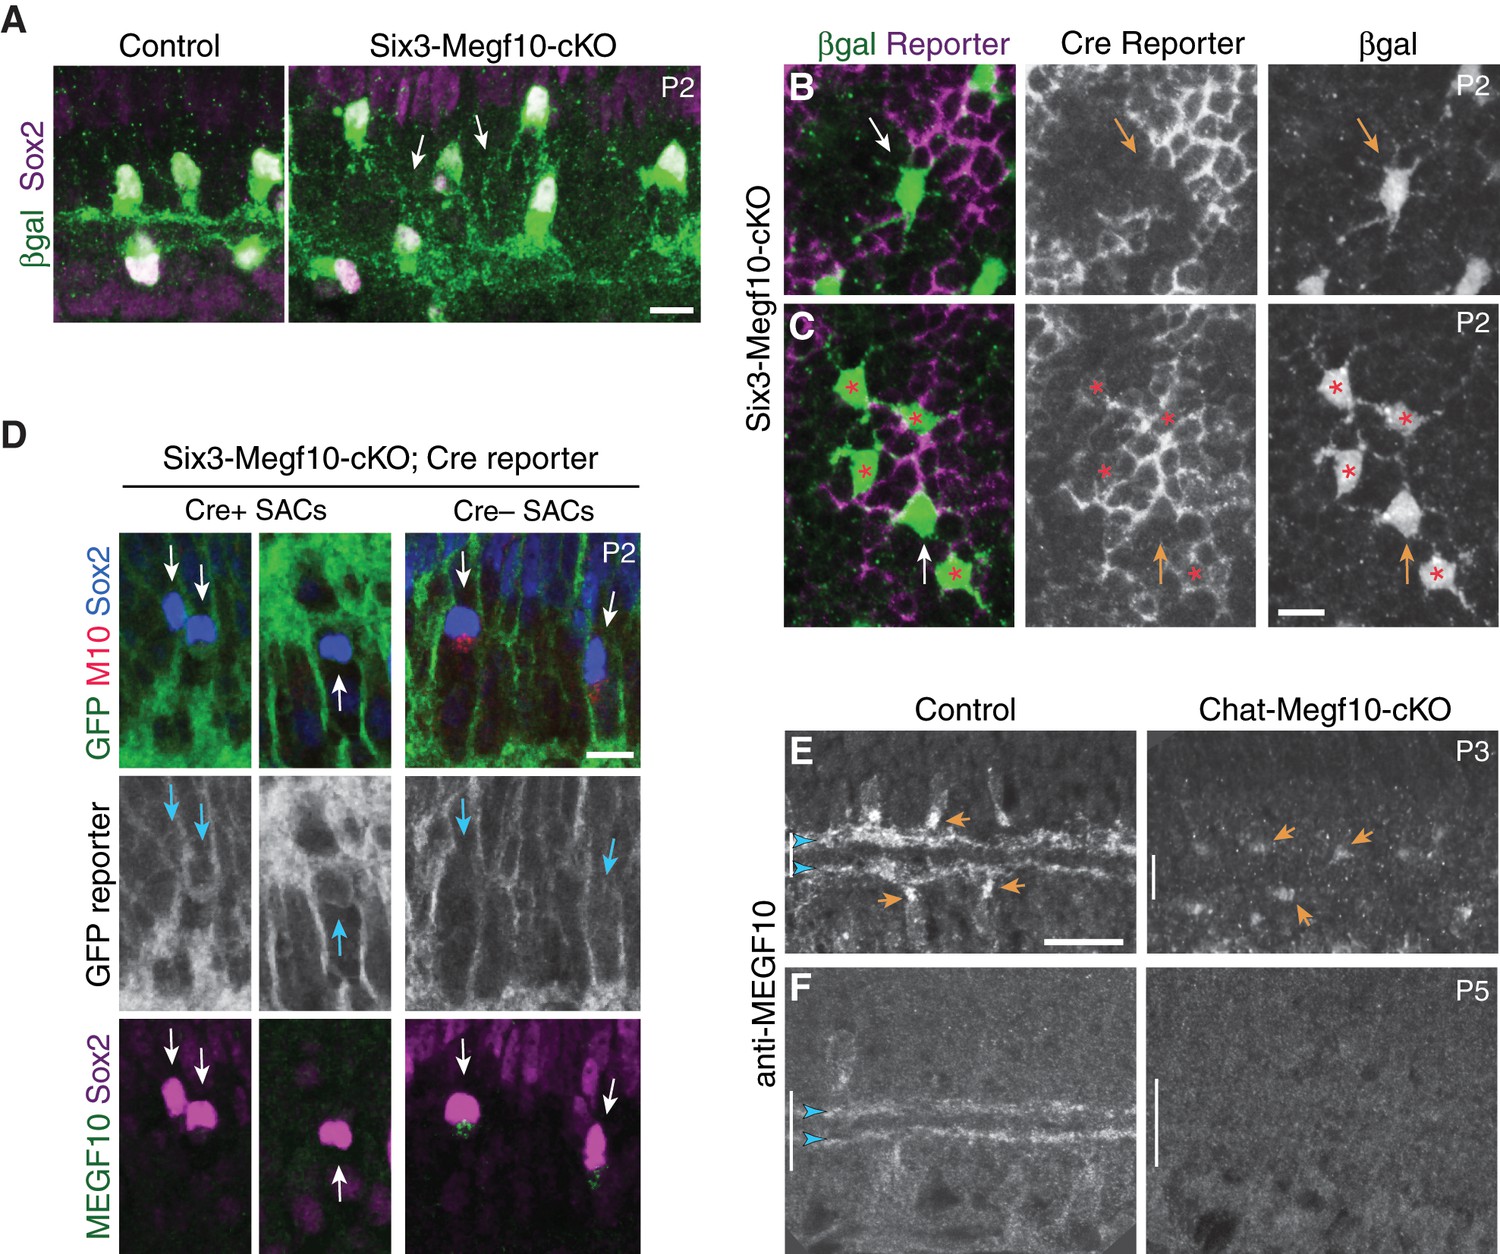
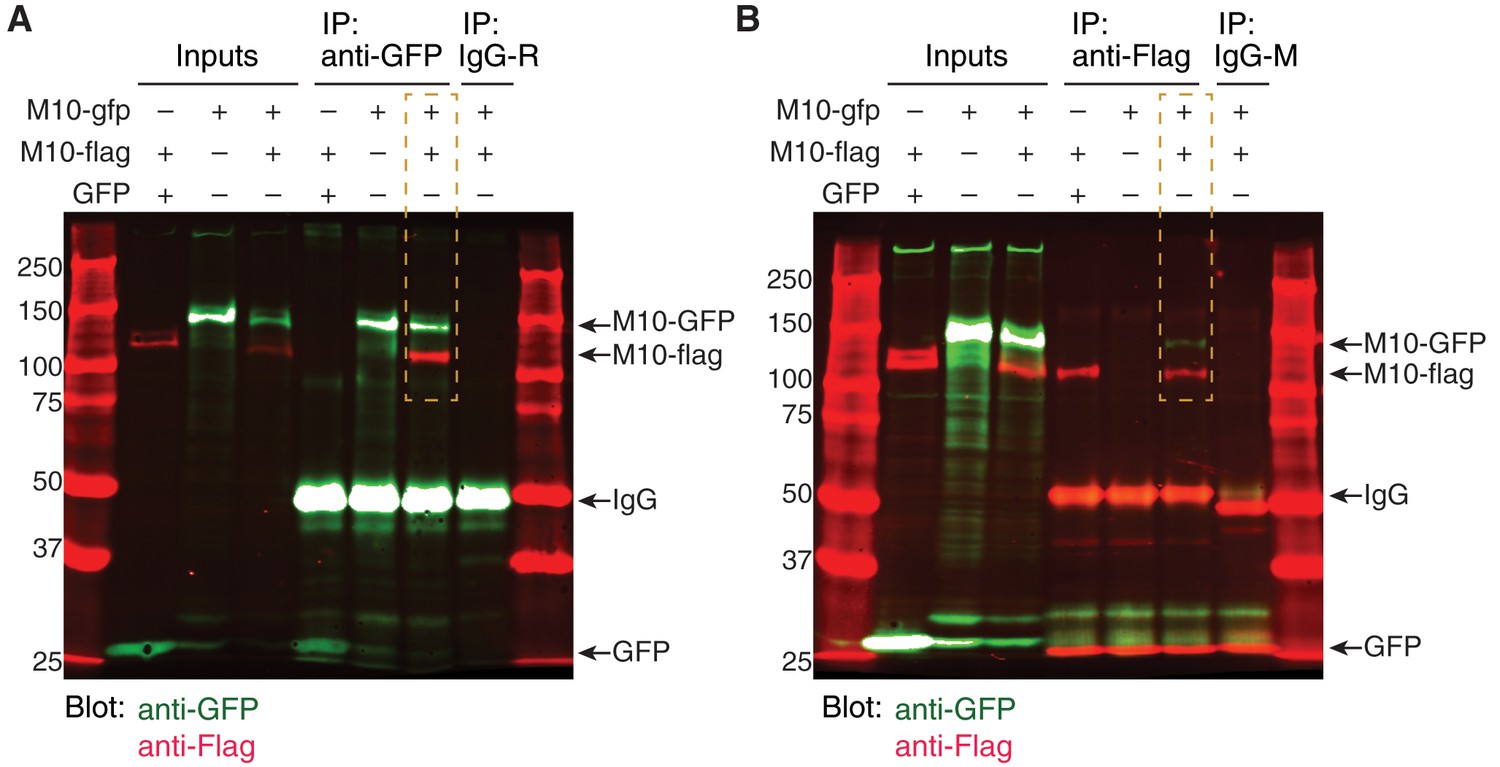
(A,B) En-face images of INL in Six3-Megf10-cKO retinas stained for GFP Cre reporter (A) and βgal SAC marker (B). Reporter expression indicates loss of MEGF10 (see Figure 7—figure supplement 1). In central retina (top row), most SAC are mutant, and project extensive INL dendrites (B, arrows; compare to C). In peripheral retina (bottom row), some cells escape Cre (asterisks) and retain MEGF10 but still make ectopic INL projections. Purple, Cre reporter; green, βgal. (C) Littermate control retina imaged as in B; SACs rarely project INL dendrites at P2. (D) Quantification of P2 INL projection phenotypes illustrated in A-C. Six3-Megf10-cKO (cKO) SACs that escape Cre (M10+) make projection errors at similar rate as surrounding mutant cells from the same tissue (M10–). (E–G) Chat-Megf10-cKO phenotype. Morphology of single SACs, revealed by ChatmG in cross-sections. Anti-MEGF10 (M10) distinguished two classes of cKO SACs (orange arrows): Those that express MEGF10 (F) are anatomically similar to littermate control SACs (E). Those lacking MEGF10 (G) arborize extensively in INL (yellow arrowheads) but minimally in IPL (blue arrowheads). Vertical line, IPL. (H) SAC soma-layer projection frequency at P3. Sparse M10 deletion (blue, –) phenocopied germline null (red). Chat-Megf10-cKO cells that retained M10 (blue, +) resembled controls (flox/+). (I) Schematic of MEGF10 proteins used for co-immunoprecipitation (IP). Intracellular domain was deleted (ΔICD) and replaced with epitope tags (Flag or GFP). Ex, extracellular; TM, transmembrane. (J) Co-IP from lysates of HEK 293 T cells transfected with indicated constructs (I). Western blot with antibodies to GFP (green) and Flag (red). IP with anti-GFP, but not rabbit IgG control, pulled down both MEGF10-ΔICD constructs (2nd lane from right, orange text). IP with anti-Flag gave similar result (Figure 7—figure supplement 2). GFP alone did not co-IP with M10-Flag. Ladder molecular weights (kDa) at left. Full blots in Figure 7—figure supplement 2. (K) Model of MEGF10 function in early SAC dendrite development. Left, soma-layer contact between neighboring SACs initiates MEGF10-mediated signaling in each cell. This signal inhibits soma-layer dendrite growth and promotes arborization in IPL (see green cell, right panel). Purple, phenotype of SACs that fail to receive MEGF10 signals, either because neighbors do not have MEGF10, or because the cell itself lacks MEGF10 as a receptor. These SACs project exuberant soma-layer arbors and fail to ramify dendrites in IPL. Error bars, 95% confidence interval. Sample sizes, see Methods. Scale bars: 25 µm (A), 10 µm (B–G).
Figure 7—figure supplement 1
Megf10 cell autonomy: Characterization of conditional mutant mice.
(A) Six3-Megf10-cKO mice phenocopy SAC sublayer formation errors seen in null mutants. Cross-sections through central retina of P2 Six3-Megf10-cKO and littermate control mice. Immunostaining for Megf10:βgal and Sox2 revealed SAC morphology. Control SACs (left) have formed IPL sublayers by P2 and they rarely project to soma layers. In Six3-Megf10-cKO mice (right), sublayers are absent and SACs project exuberantly to soma layers (arrows). (B) The same Six3-Megf10-cKO Cre-negative SAC from Figure 6B (arrow). βgal and GFP (Cre reporter) channels are shown separately (middle, bottom) to demonstrate lack of GFP expression in this cell. (C) Another example of a Cre reporter-negative Six3-Megf10-cKO SAC (arrow) surrounded by mutant Cre-positive cells (asterisks). All five cells, including the unrecombined one, participate in an aberrant INL dendritic network (bottom). (D) GFP Cre reporter is a reliable proxy for MEGF10 protein expression status in Six3-Megf10-cKO mice. Cre+ SACs (left, center panels) express the GFP reporter and lack MEGF10 immunoreactivity. Cre– SACs lack GFP reporter expression and retain MEGF10 immunoreactivity. Arrows, Sox2+ SACs (or their position). (E,F) Timing of MEGF10 protein loss in Chat-Megf10-cKO mice. At P3 (E), MEGF10 immunoreactivity is much lower in mutants (right) than in littermate controls (ChatCre; Megf10flox/+,left), but most SACs still express some protein (arrows indicate examples of MEGF10-positive cells). At P5 (F), MEGF10 immunoreactivity is virtually absent in mutants but readily detectable in controls. Arrowheads, SAC IPL strata. Vertical bar, IPL. Scale bars: 10 µm (A–D); 25 µm (E,F). Scale bar in C applies to B, and bar in E applies to F.
Figure 7—figure supplement 2
MEGF10 co-immunoprecipitation experiments.
(A) Uncropped blot image for co-IP experiment depicted in Figure 6J. Anti-GFP was used for pull-down. Blot was stained for anti-GFP (green) and anti-Flag (red). Orange box indicates the condition in which cells were transfected with both MEGF10-ΔICD constructs. In this condition, pull-down with anti-GFP precipitated both MEGF10-ΔICD-GFP and MEGF10-ΔICD-Flag constructs, demonstrating that they interact. Ladder markings in kDa. Expected sizes for MEGF10-ΔICD constructs, GFP, and IgG are indicated (arrows). R, rabbit IgG control. See Figure 6I for illustration of in MEGF10-ΔICD construct design. (B) Independent replicate of MEGF10-ΔICD co-IP experiment, using anti-Flag for pull-down. Labels as in F. IP with anti-Flag co-precipitated both GFP and Flag-tagged MEGF10-ΔICD constructs (orange box). Mouse (M) IgG control did not precipitate MEGF10 constructs, and MEGF10-ΔICD-Flag did not co-precipitate with GFP alone.
Figure 8 with 1 supplement

SAC IPL errors persist to maturity in Megf10 mutants.
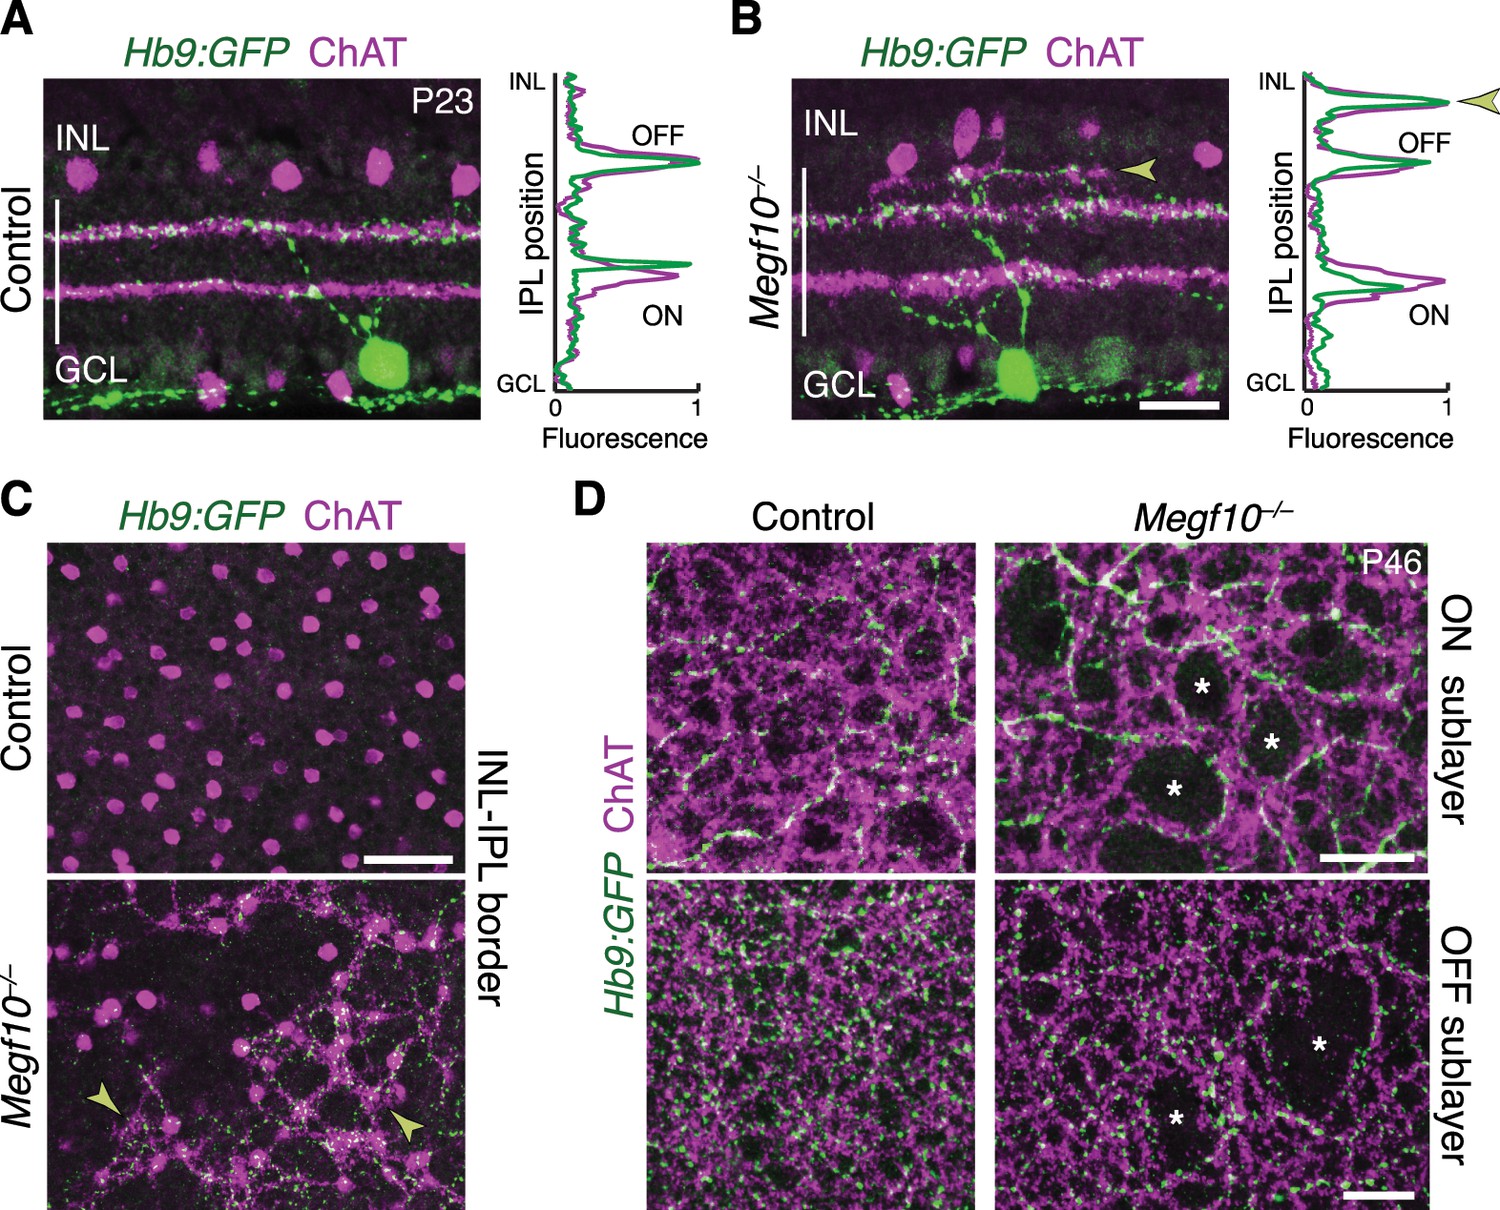
(A,B) SAC IPL phenotype in mature (two-week-old) retina, cross-section view. Blue, soma counterstain. Control IPL has two continuous SAC dendrite bands (blue arrowheads). Mutant IPL has sporadic ectopic SAC arbors (yellow arrowheads) or laminar gaps (white arrows). (C) En-face views of SAC dendrites, stained with anti-ChAT, in adult retinal whole-mounts. The same fields of view are shown at two different Z-stack planes, corresponding to OFF and ON SAC sublayers. SAC dendrite plexus is uniform in littermate controls, but has holes (arrows) and large gaps (asterisks) in mutants. Note that errors are not spatially correlated between OFF and ON sublayers. Images are Z-projections of 5 slices encompassing 2.0 µm in Z. (D) Single SAC labeling in adult (3 month old) mice, via ChatCre-dependent viral fluorescent protein expression. Megf10–/– SACs have relatively normal morphology but are significantly smaller than wild-type (WT) control cells (***p=4.6×10⁻⁶, two-tailed t-test). Sample size, see Materials and methods. (E) En-face images reveal extent of ectopic mutant SAC dendrite network. Same fields of view as C, but at different Z-planes depicting OFF IPL (at IPL-INL border). In mutant but not control, SAC dendrite fascicles (arrows) are evident at this IPL level. Images are Z-projections of 3 (left) or 2 (right) slices spaced 0.4 µm in Z. (F,G) Dendrite targeting of individual OFF SACs assessed across development. Fraction of mutant SACs projecting into ectopic network does not change over time (F). However, location of ectopic arbors shifts from INL to IPL (G), starting at P5, when cells projected to either or both locations (G,H). In F, P0-3 data are replotted from Figure 6E, with both control groups combined. Sample sizes, see Materials and methods. (H) Example P5 SACs from Megf10 mutant and littermate control. A mutant SAC projects to three different locations: (1) correct IPL sublayer (blue arrowhead); (2) ectopic IPL sublayer (yellow arrowhead); (3) ectopic INL arbor aggregate (orange arrowhead). ON SACs also make ectopic IPL projections (white arrowhead). Control cells are monostratified in IPL (left). Note that SAC sublayers have formed by P5 in mutants. Error bars, 95% confidence intervals. Scale bars: 50 µm (C–E); 25 µm (A,B,H).
Figure 8—figure supplement 1

SAC phenotypes in Megf10 mutants at P5 and at maturity.
(A) Specificity of Megf10–/– SAC IPL innervation phenotype. The same cross-sections from Figure 8A are shown here, overlaid with anti-Vglut3 staining (green) to label amacrine cells that project to an IPL sublayer between the SAC strata (arrowheads). Regions of mutant IPL not innervated by SACs (arrow) are still innervated by Vglut3+ amacrine cells, demonstrating that absence of ChAT+ arbors is not due to histology artifact and that impaired IPL innervation is a SAC-specific phenotype. (B,C) Anatomy of mutant SAC ectopic network at P5 provides further evidence that it shifts from INL to IPL. Megf10:βgal staining seen en face at level of INL (B), and in cross-section (C). Mutant SAC arbors are aggregated and fascicular by P5; this contrasts with P3 when exuberant INL arbors are more diffuse (Figure 6). Unlike later stages (Figure 8A), when fascicles are only found in IPL, P5 fascicles could be located in the INL (B). Some arbor fascicles crossed the INL-IPL boundary at P5 (C, orange arrowhead). This was not seen at earlier or later ages (Figure 6A; Figure 8A), suggesting P5 is a transitional age in the INL-to-IPL shift. (D,E) ON SAC ectopic projections transition to the IPL at P5 in Megf10 mutants, similar to OFF SAC projections (Figure 8F,G). Frequency of mutant ectopic ON SAC projections does not decline over development (D), even though arbor anatomy changes by P5 (E). P0-3 data in D replotted from Figure 6E, with both control groups combined. E: As with mutant OFF SACs, ON SACs can make ectopic projection errors either within the GCL or the IPL at P5. (F) Megf10 mutant ON SAC phenotype at P5, revealed using ChatmG to label single cells and Megf10:βgal to label the full SAC population. Control SACs (left panels) are monostratified within the DS circuit IPL sublayers (blue arrowheads). Right: Example of a mutant ON SAC that makes an ectopic projection to inappropriate IPL sublayer (yellow arrowhead) while also projecting to the expected DS circuit sublayer (blue arrowheads). OFF SACs in this same field of view make ectopic projections within the INL (orange arrowhead), illustrating the simultaneous soma-layer and IPL ectopias observed only at P5. Scale bars: 25 µm.
Figure 9 with 1 supplement
Temporal requirements for MEGF10 in SAC IPL stratification and mosaic spacing.
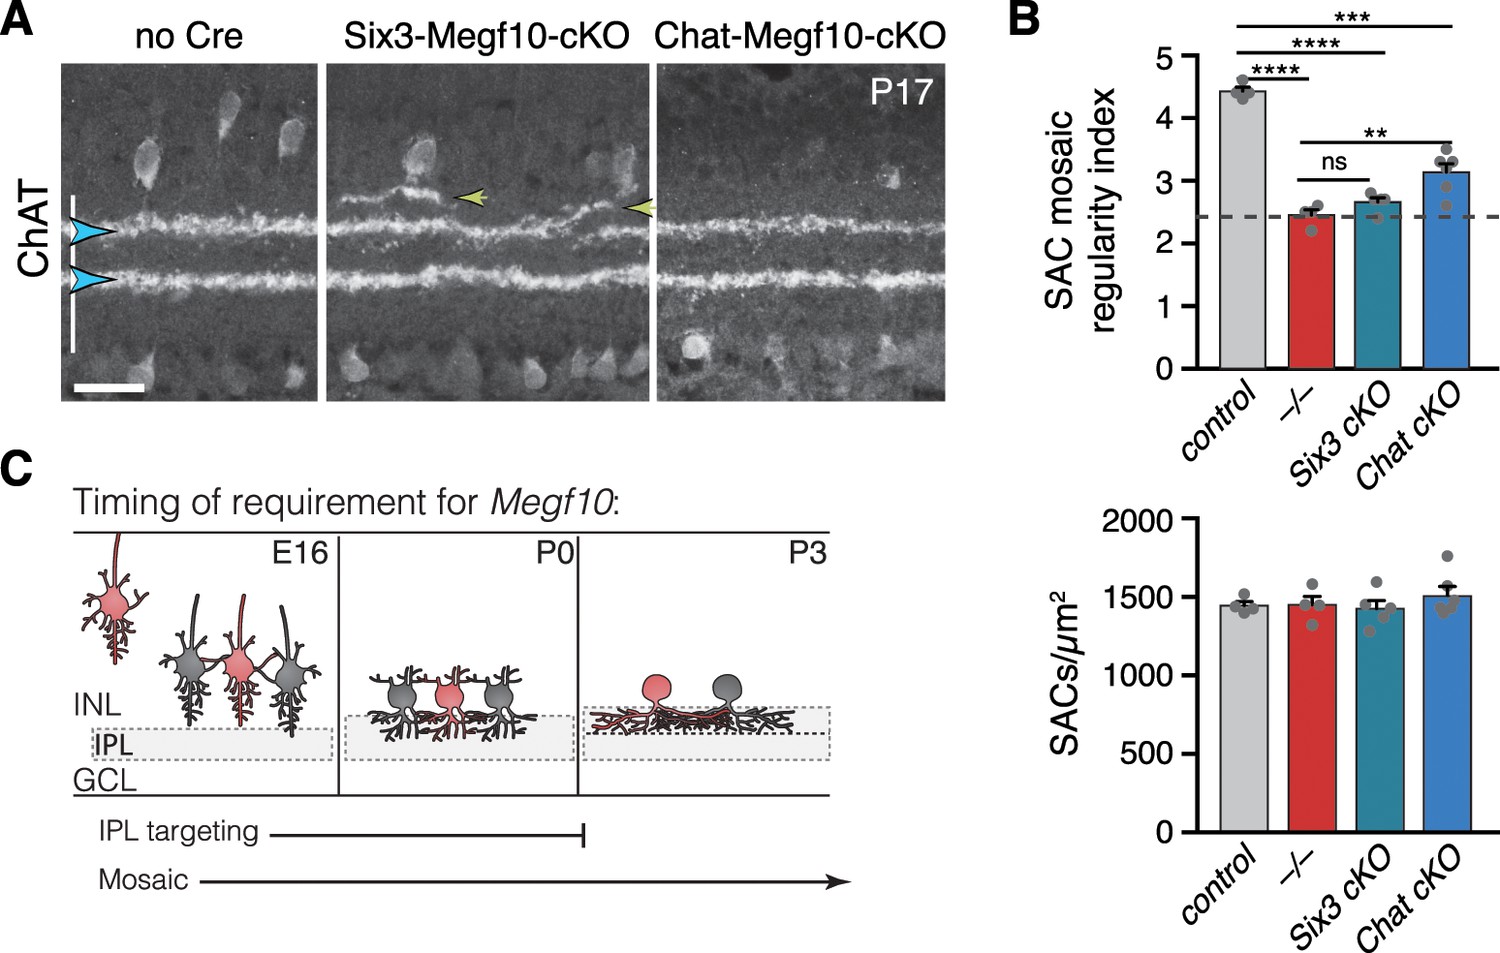
(A) SAC IPL errors (yellow arrowheads) induced by early deletion of Megf10 in Six3-Megf10-cKO mice, but not deletion between P3-5 in Chat-Megf10-cKO mice (see Figure 7—figure supplement 1 for MEGF10 expression in these strains). Blue arrowheads, SAC sublayers. (B) Mosaic spacing phenotype measured at P17 using Voronoi domain regularity index (top graph). Dashed line, index for simulated random SAC arrays. In both Six3 and Chat conditional mutants, SAC positioning is less regular than in controls (ChatCre; Megf10flox/+). Megf10–/– and simulation data from Kay et al. (2012). ns, p=0.6438; **p=0.0023; ***p=2.1×10⁻⁶; ****p<1.0×10⁻⁶ (one-way ANOVA/Tukey’s post-hoc test). Bottom graph, regularity effects are not due to changes in SAC cell density across genotypes. One-way ANOVA, F(3, 15)=0.6063; p=0.6210. (C) Summary of results from all conditional Megf10 mutant studies (A, B; Figure 7). Loss of MEGF10 while soma-layer arbors are present (i.e. prior to P3) disrupts both SAC mosaic patterning and IPL laminar targeting; this conclusion is based on phenotypes of: (1) germline mutant; (2) Six3-Megf10-cKO mutant; (3) occasional cells in Chat-Megf10-cKO mice that lost MEGF10 prior to P3 (Figure 7F–H). When MEGF10 is lost after P3, as is the case for most Chat-Megf10-cKO SACs (Figure 7—figure supplement 1), only mosaic is disrupted (A,B). Thus, MEGF10 acts at distinct, albeit partially overlapping times, to influence these two distinct SAC developmental events. Error bars, S.E.M. Scale bar, 25 µm.
Figure 9—figure supplement 1
Severity of Megf10–/– SAC mosaic phenotype does not correlate with IPL targeting error rate.
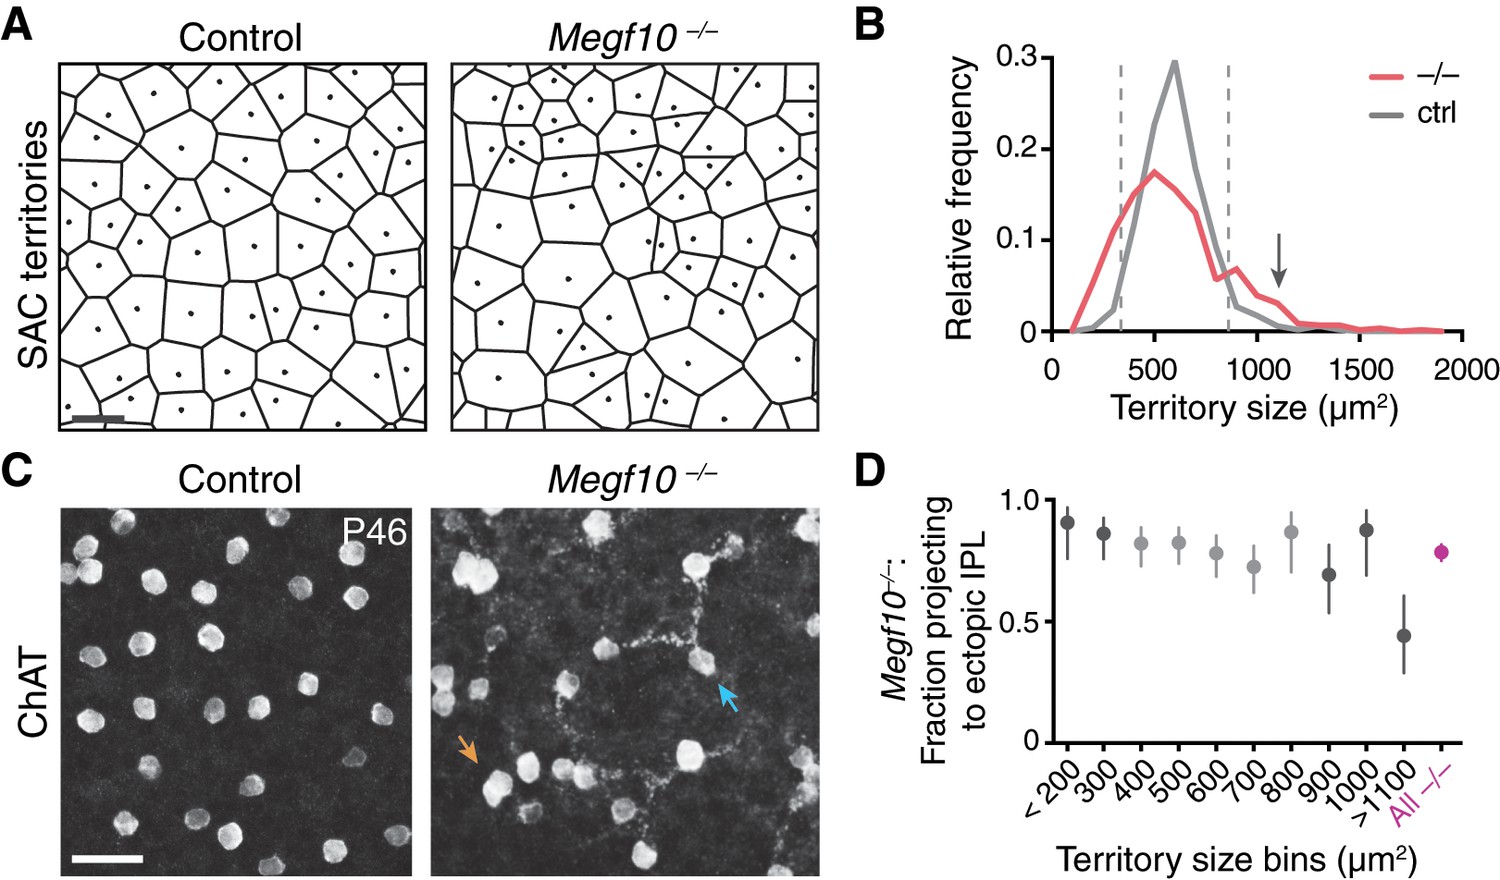
(A,B) Strategy for quantifying severity of mosaic phenotype on single-cell level. The Voronoi domain (A; see Materials and methods) is determined by the position of a cell relative to all its neighbors and therefore serves as a useful single-cell measure of local cell positioning (see Materials and methods). In control retina, the position of SACs relative to their neighbors is constrained by local cell-cell repulsion. This can be seen in the uniform size distribution of their Voronoi territories: A, representative Voronoi domain images (dots, cell body positions); B, histogram of SAC territory (i.e. Voronoi domain) sizes. Control distribution (gray line) has a sharp peak. In Megf10 mutants, the arrangement of SAC cell bodies is random; as a result, there are many mutant cells that, by chance, are positioned quite normally relative to their neighbors, while other SACs are abnormally near or far. This population-level phenotype manifests as a broader distribution of SAC territory sizes (B, red line). For individual mutant SACs, their position along this size distribution curve can be used as a measure of mosaic phenotype severity. Dashed lines (B), upper and lower 95% tolerance intervals of the control distribution. Mutant cells outside these lines experience crowding or isolation rarely seen in control retina. Arrow in B denotes largest bin in D. Bin size = 100 µm2. Sample sizes: n = 515 cells from two littermate control (Megf10+/–) mice; n = 584 cells from 2 Megf10–/– mice. (C) No obvious correlation between a mutant cell’s local neighborhood density and its projection to ectopic IPL network. En-face view of SAC cell bodies and outer IPL, generated by Z-projecting part of a confocal stack corresponding to these layers (Z distances: left, 4.4 µm, right 4.0 µm). Controls lack SAC dendrites at this IPL level. Arrows, examples of cells that are unusually far from their neighbors yet join the ectopic network (blue arrow), or that are unusually crowded yet do not join (orange arrow). (D) Frequency of ectopic IPL projections for mutant SACs in each 100 µm bin of histogram in D. Dark shading, bins outside dashed lines in D. Smallest and largest bins were pooled to ensure adequate sample size (n ≥ 24 SACs per bin; see Materials and methods for bin sizes). Across all bins except the largest one (denoted in B by arrow), error rate was similar to the overall mutant error rate (red). Even in this last bin, SACs still made errors about 50% of the time. These results demonstrate that ectopic IPL lamination errors are largely independent of soma positioning errors. X values denote bin center (aside from pooled bins < 200 µm2 and >1100 µm2). Error bars, 95% confidence intervals. Scale bars, 25 µm.
Figure 10 with 1 supplement
SACs guide IPL sublayer choice by ooDSGCs.
(A,B) SACs (ChAT, purple) and ooDSGCs (Hb9-GFP, green) labeled in cross-sections. Right panels, fluorescence profile plots across IPL showing position of ON and OFF sublayers. In both controls (A) and Megf10 mutants (B) ooDSGC dendrites strictly co-localize with SAC arbors. Arrowhead (B), ectopic sublayer. (C) En-face view of OFF IPL near INL border. Same fields of view as Figure 8E. In Megf10 mutants (bottom), the ectopic SAC network is extensively innervated by ooDSGC dendrites (arrowheads). Control retina (top) lacks DS circuit arborization at this IPL level. (D) En-face view of ON (top) and OFF (bottom) SAC IPL sublayers. In Megf10 mutants, ooDSGC dendrites (green) fail to enter IPL regions (asterisks) that are not innervated by SACs (purple). Images in C,D are Z projections of confocal slices encompassing ≥1.2 µm (C) or 2–4 µm (D). All scale bars: 25 µm. Also see Figure 10—figure supplement 1 for phenotype of Drd4-GFP ooDSGCs.
Figure 10—figure supplement 1
IPL innervation by ooDSGCs in Megf10 mutants.
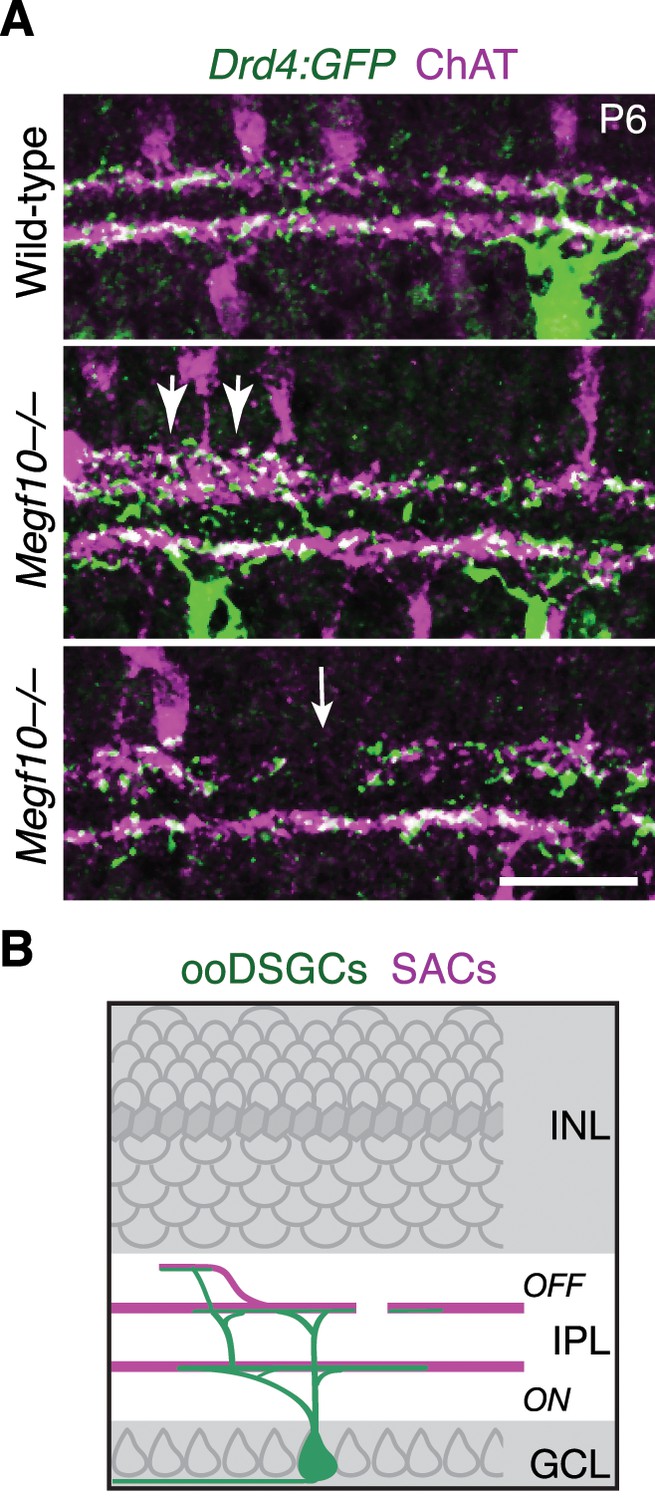
(A) Drd4-GFP mouse line was used to label a subset of ooDSGCs that is mutually exclusive with Hb9-GFP. IPL laminar targeting by Drd4-GFP+ ooDSGCs was assessed in cross-sections of Megf10–/– and littermate control retinas, co-stained for ChAT to reveal SAC dendrites. In mutants, Drd4-GFP+ cells made the same laminar targeting errors observed in the Hb9-GFP line (Figure 10): When SACs projected to inappropriate laminar locations, ooDSGC dendrites were recruited to join them (center panel, large arrows). GFP+ dendrites also failed to enter IPL regions not innervated by SACs (bottom panel, white arrow). (B) Summary of ooDSGC laminar targeting errors in Megf10 mutants. Dendrites of ooDSGCs go to ectopic IPL locations when SACs do so, and fail to enter SAC IPL gaps. Scale bar: 25 µm.
Figure 11 with 1 supplement
SACs guide IPL sublaminar targeting by DS circuit bipolar cells.
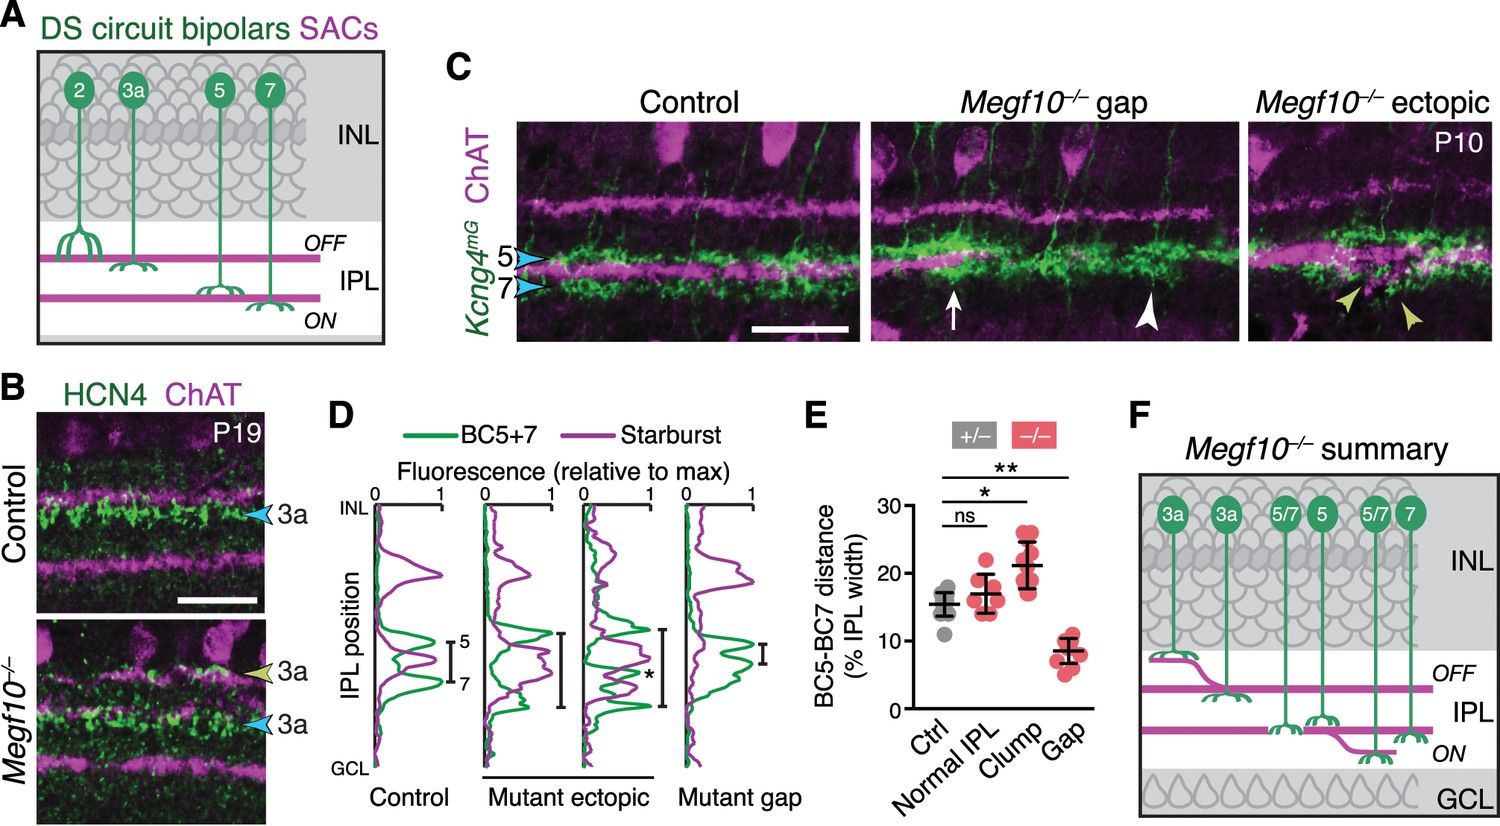
(A) Illustration depicting anatomy of four bipolar cell types known to participate in DS circuit. BC3a, BC5, and BC7 arborize axons in narrow sublayers directly adjacent to SAC strata. BC2 projects more broadly through OFF IPL, overlapping with SAC sublayer (see Figure 11—figure supplement 1). (B) BC3a IPL projections assessed with anti-HCN4. Blue arrowhead, normal BC3a stratum. Yellow arrowhead, ectopic stratum containing SAC dendrites (purple) and BC3a axons (green). (C,D) BC5 and BC7 IPL projections (blue arrowheads), labeled in Kcng4mG mice. C, images; D, representative fluorescence plots of Kcng4mG (green) and ChAT (purple) across IPL. In littermate controls, or normal regions of mutant IPL (C, arrow), BC5 and BC7 arborize in sublayers immediately adjacent to ON SAC layer, but do not enter it. In Megf10 mutants, ectopic SAC arbors displace BC5+7 terminals to new IPL locations, where they remain adjacent to SACs but non-overlapping (C, yellow arrowheads; D, center plots). Asterisk (D) ectopic BC arbors between normal and ectopic SAC strata. BC5/7 arbors can innervate gaps in the SAC stratum (C, center panel); in these cases, their terminals are abnormally close together (C, white arrowhead; D, right plot). Vertical bars in D: distance between BC5/7 strata. (E) Quantification of BC5-BC7 distance in normal IPL and in presence of SAC innervation gaps or ectopic arbor clumps. *p=0.0219; **p=0.0012; ns, p=0.3965 (Tukey’s post-hoc test). Sample sizes, see Methods. Error bars, S.E.M. (F) Summary of Megf10–/– bipolar cell phenotypes. BC3a, BC5, and BC7 are illustrated here (see Figure 11—figure supplement 1 for BC2). Each of these cell types can either make errors (left cell in each pair) or project normally (right cell). All three cell types show recruitment to ectopic IPL locations. BC5 and BC7 terminals innervating SAC gaps colonize the sublayer normally occupied by SACs. Error bars, 25 µm.
Figure 11—figure supplement 1
IPL innervation by DS circuit bipolar cells in Megf10 mutants.
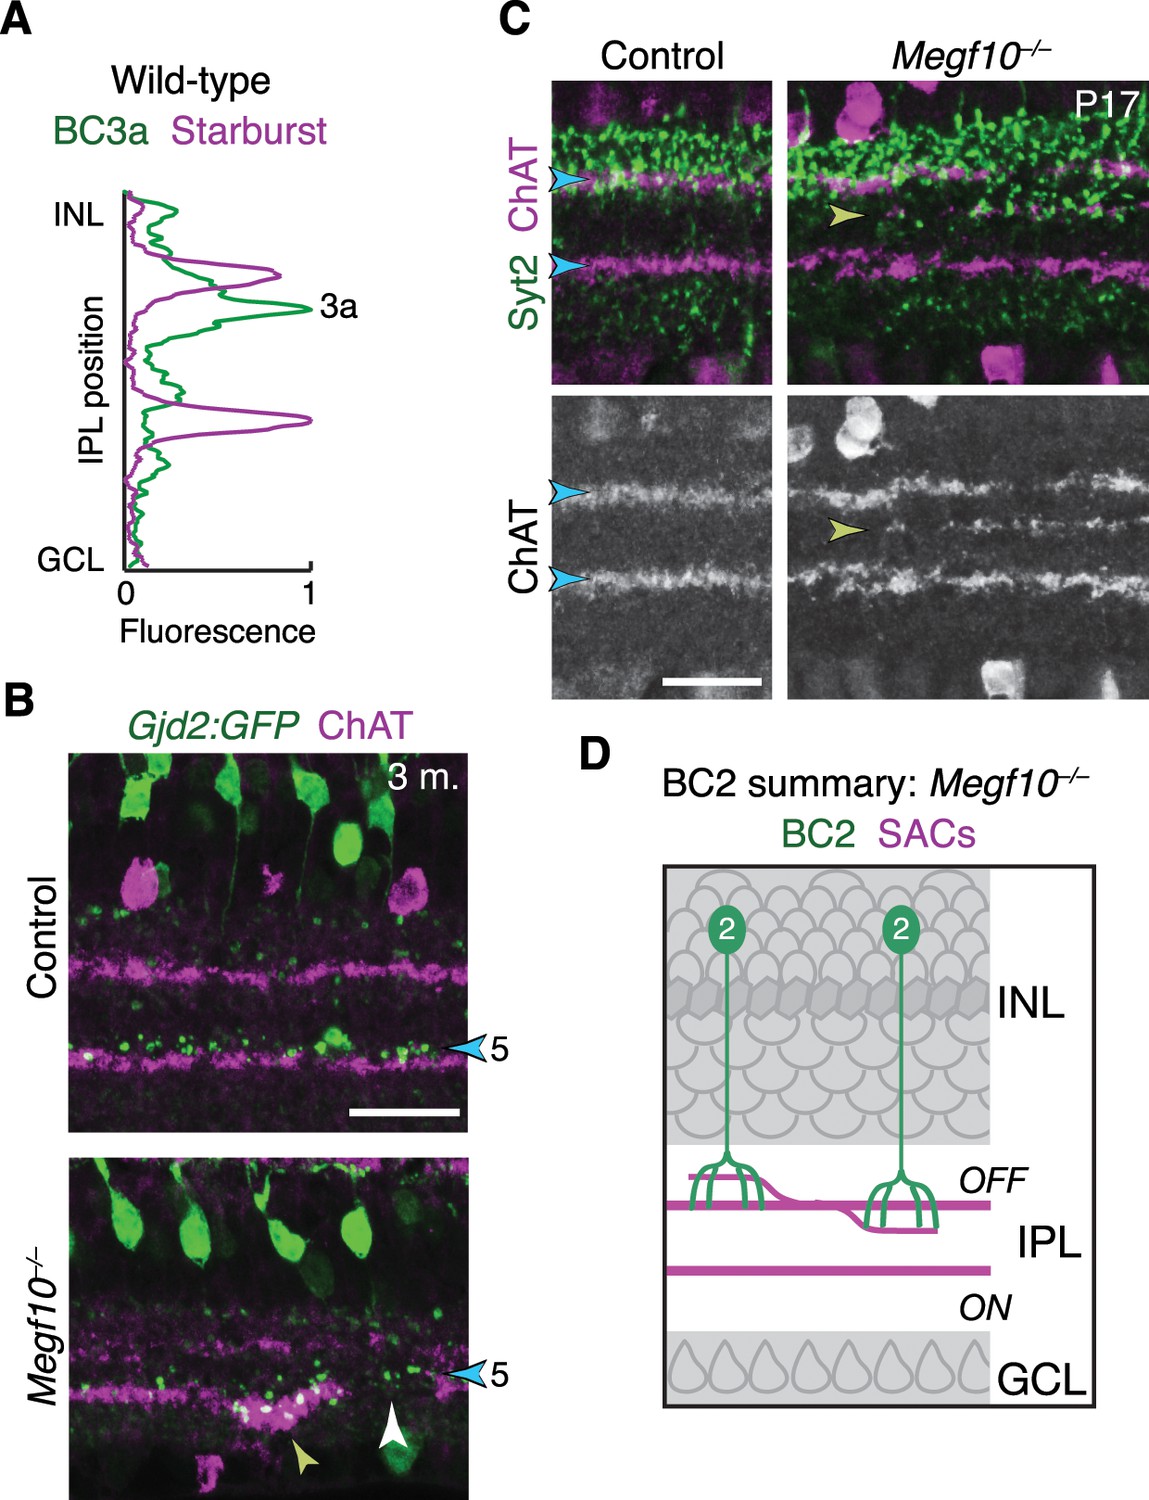
(A) Fluorescence intensity plot across IPL obtained from a wild-type image similar to Figure 11B – i.e. tissue stained with anti-ChAT (purple) and the BC3a marker HCN4 (green). BC3a arbors are excluded from the OFF SAC sublayer and arborize adjacent to it, similar to the behavior of BC5 and BC7 (Figure 11D). (B) Gjd2-GFP mouse line was used as an independent marker of BC5 bipolar cells. In cross-sections of adult retinas stained for anti-GFP (green) and anti-ChAT (red), GFP was found to label BC5 neurons arborizing in their characteristic position adjacent to the ON SAC sublayer (blue arrowhead). Thus, unlike the Kcng4mG line in which both BC5 and BC7 were labeled, this line could be used to specifically assess BC5 phenotypes. In Megf10 mutants, an ectopic SAC projection near the GCL border (yellow arrowhead) recruited BC5 terminals to an inappropriate IPL location. BC5 terminals are also seen innervating a gap in the SAC sublayer (white arrowhead). These phenotypes are similar to observations in Kcng4mG mice (Figure 11C–E). (C,D) Laminar targeting errors by BC2 bipolar cells in Megf10 mutants. In control retina, BC2 axon terminals (stained with anti-Syt2, green) fill the entire IPL region between the INL border and the OFF SAC layer. This is the same region in which OFF SAC misprojection errors typically were found in mutants (e.g. Figure 9A); therefore, most mutant errors did not probe whether BC2 axons could be recruited to new IPL regions. However, we did find a small number of cases, such as the one shown here, in which OFF SACs project inappropriately to central IPL regions where BC2 terminals are not normally found (yellow arrowhead). In these cases BC2 arbors are recruited to join SAC arbors in their abnormal laminar location. Thus, BC2 IPL projections are likely guided by similar SAC-derived cues as the other DS circuit-projecting bipolar cell types. D, summary of the BC2 projection phenotype in Megf10 mutants, showing SAC errors that occurred within the normal BC2 domain (left) as well as those that recruited BC2 arbors to new laminar positions.Scale bars: 25 µm.
Figure 12 with 1 supplement
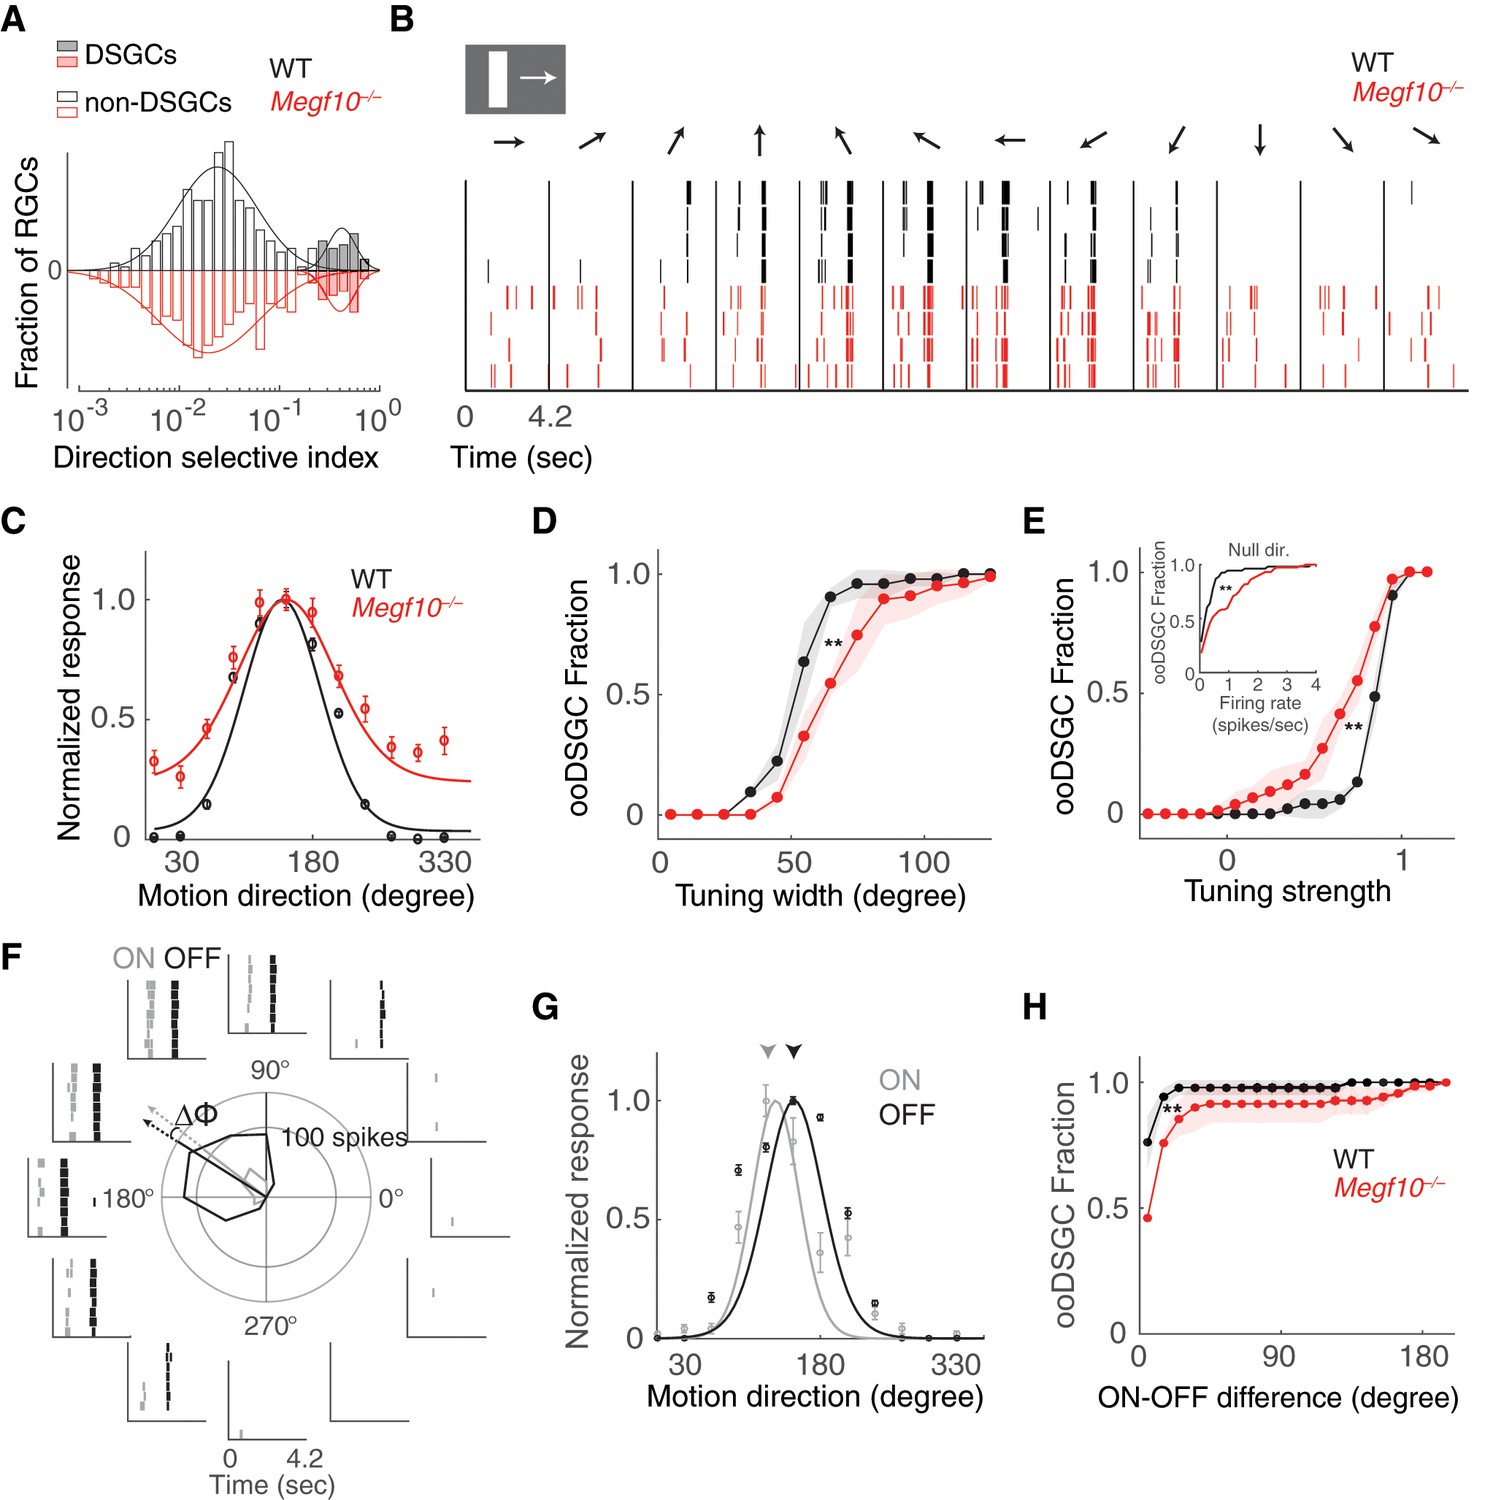
Broader and weaker direction tuning of ooDSGCs in Megf10 mutants.
(A) Histograms of RGC direction selectivity indices, measured on a multielectrode array, for wild-type (WT, black) and Megf10–/– (red) retinas. Bimodal histograms fit with two-Gaussian mixture model distinguished DSGCs (filled bars) from non-DSGCs (open bars). (B) Spike rasters from representative WT and Megf10–/– posterior-preferring ooDSGCs in response to a bright bar moving along 12 directions (arrows). (C) Direction tuning curves from cells in B normalized to the maximum response (line: von Mises fit). Non-zero values at tails of mutant curve reflect increase in null-direction spikes (B, left- and right-most bins). (D,E) Cumulative distribution of tuning widths (D) and tuning strengths (E) for all ooDSGCs recorded from two retinas of each genotype (WT n = 80 cells; Megf10–/–n = 74 cells). Mutant ooDSGC population is tuned more broadly (D, right shift of red curve) and more weakly (E, left shift of red curve) than WT. Similar results were obtained when ON and OFF responses were considered separately (not shown). Mutant ooDSGCs also exhibit higher firing rate to null direction motion (E, inset). **p=0.005 (D), p=0.003 (E), paired KS-test. (F) Rasters and polar plot of a representative WT ooDSGC, highlighting preferred directions of ON (gray) and OFF (black) responses (arrows). Δϕ, angular difference between preferred directions of ON and OFF responses. (G) ON and OFF direction tuning curves for cell in F (line, von Mises fit). ON and OFF preferred directions (arrowheads) are well aligned in WT retina. (H) Cumulative distribution across all ooDSGCs of ON-OFF preferred direction difference (Δϕ). Same cells as in D,E. Rightward shift of mutant curve indicates larger ON-OFF misalignment. **p=0.004, paired KS test. For all panels, background light level was photopic (104 P*/M-cone/sec; contrast of moving bar was 60%). Error bars/bands, S.E.M. Also see Figure 12—figure supplement 1.
Figure 12—figure supplement 1
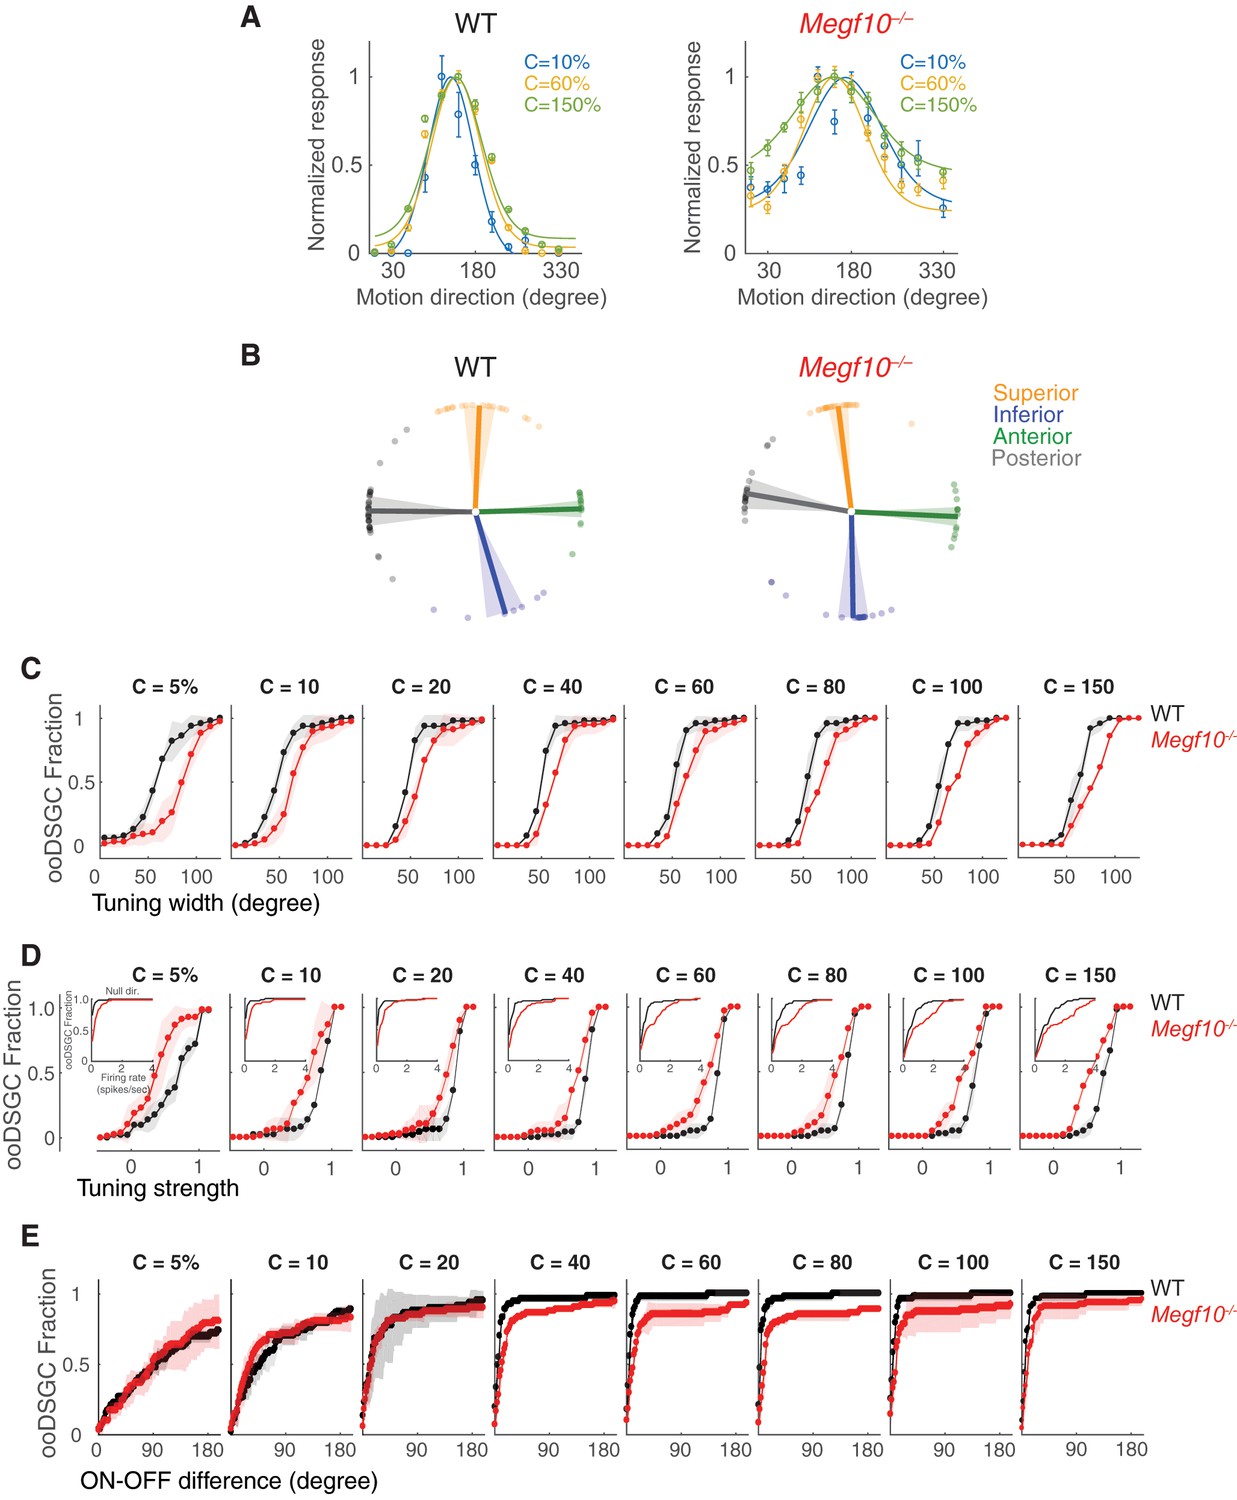
Contrast-dependence of direction-tuning phenotypes in Megf10–/– ooDSGCs.
(A) Tuning curves from representative wild-type (WT) and Megf10 mutant ooDSGCs measured at three contrasts (10, 60%–150% Weber contrast). Circles show responses, solid lines show von Mises fits. Mutant tuning curves are broader than controls at all three contrasts. (B) Preferred directions of WT ooDSGCs (left) align to the four cardinal ocular axes: superior, inferior, anterior and posterior (Oyster and Barlow, 1967). K-means clustering was used to separate the recorded ooDSGC population into these four subtypes (see Materials and methods). Population mean (solid line) and standard deviation (shaded region) of preferred directions for each subtype is plotted; circles denote preferred direction of individual ooDSGCs. Preferred directions of Megf10–/– ooDSGCs (right) were also aligned to the cardinal axes, and there was no appreciable change in the fraction of ooDSGCs populating each subtype. (C–E) Cumulative distributions of tuning width (quantified by circular standard deviation; C), tuning strength (D), and ON-OFF preferred direction difference (E), measured at different bar contrasts (identified at the top of each plot) for WT and Megf10–/– ooDSGC populations. Insets (D) show responses to null direction stimuli. The analyzed RGC populations were the same as for data shown in Figure 10 (n = 80 WT and 74 mutant ooDSGCs, two retinas each genotype). The width and speed of the moving bar was 1200 µm and 550 µm/sec, respectively. Error bars/bands, S.E.M.
Tables
Key resources table
| Reagent type | Designation | Source or reference | Identifier | Additional information |
|---|---|---|---|---|
| Antibody | Megf10: rabbit, 1:1000 | Kay et al. (2012) | ||
| Antibody | Sox2: rabbit, 1:500 | Abcam | ab97959 | |
| Antibody | Sox2: goat, 1:500 | Santa Cruz | sc-17320 | |
| Antibody | ChAT: goat, 1:400 | EMD Millipore | AB144P | |
| Antibody | Beta Galactosidase: rabbit, 1:5000 | other | Antibody was a gift of J.R. Sanes, Harvard | |
| Antibody | GFP: chicken, 1:1000 | Life Technologies | A10262 | |
| Antibody | GFP (Co-IP): rabbit, 1:1000 | Thermo Fisher Scientific | A-6455 | |
| Antibody | AP-2a: mouse, 1:200 | Developmental Studies Hybridoma Bank | 3B5 | |
| Antibody | RBPMS: guinea pig, 1:2000 | other | Antibody was a gift of N. Brecha, UCLA | |
| Antibody | Chx10: sheep, 1:300 | Exalpha | X1180P | |
| Antibody | Chx10: goat, 1:500 | Santa Cruz | sc-21690 | |
| Antibody | GAD65: rabbit, 1:1000 | Millipore | AB1511 | |
| Antibody | FLAG: mouse, 1:500 | Sigma Aldrich | F-1804 | |
| Antibody | VGLUT3 guinea pig | synaptic systems | 135 204 | |
| Antibody | Synaptotagmin-2 (Syt2), mouse, 1:250 | Zebrafish International Resource Center | ZDB-ATB-081002–25 | |
| Antibody | Isl1: mouse, 1:25 | Developmental Studies Hybridoma Bank | 39.4D5 | |
| Antibody | Internexin: rabbit, 1:1000 | EMD Millipore | AB5354 | |
| Antibody | Normal Rabbit IgG | Cell Signaling Technology | 2729S | |
| Antibody | Normal Mouse IgG | Cell Signaling Technology | 5415S | |
| Antibody | Alexa Fluor 488 AffiniPure Donkey Anti-Chicken: 1:1000 | Jackson ImmunoResearch | 703-545-155 | |
| Antibody | Alexa Fluor 488 AffiniPure Donkey Anti-rabbit: 1:1000 | Jackson ImmunoResearch | 711-545-152 | |
| Antibody | Alexa Fluor 488 AffiniPure Donkey Anti-goat: 1:1000 | Jackson ImmunoResearch | 705-545-147 | |
| Antibody | Alexa Fluor 488 AffiniPure Donkey Anti-mouse: 1:1000 | Jackson ImmunoResearch | 706-605-148 | |
| Antibody | Alexa Fluor 647 AffiniPure Donkey Anti-rabbit: 1:1000 | Jackson ImmunoResearch | 705-605-147 | |
| Antibody | Cy3-AffiniPure Donkey Anti-rabbit: 1:1000 | Jackson ImmunoResearch | 715-165-151 | |
| Antibody | Cy3-AffiniPure Donkey Anti-Guinea Pig: 1:1000 | Jackson ImmunoResearch | 706-165-148 | |
| Antibody | Cy3-AffiniPure Donkey Anti-Goat: 1:1000 | Jackson ImmunoResearch | 705-165-147 | |
| Antibody | IRDye 680RD Donkey anti-Mouse IgG (H + L): 1:1000 | Li-Cor Biosciences | 925–68072 | |
| Antibody | IRDye 800CW Donkey anti-Rabbit IgG (H + L): 1:1000 | Li-Cor Biosciences | 925–32213 | |
| Biological sample (AAV) | AAV9.hEF1a.lox.TagBFP.lox.eYFP.lox.WPRE.hGH-InvBYF(Harvard) | Penn Vector Core | AV-9-PV2453 | |
| Biological sample (AAV) | AAV9.hEF1a.lox.mCherry.lox.mTFP1.lox.WPRE.hGH-InvCheTF(Harvard) | Penn Vector Core | AV-9-PV2454 | |
| Chemical compound | Fetal Bovine Serum | Life Technologies | 16250–078 | |
| Chemical compound | Opti-MEM I Reduced Serum Medium | Thermo Fisher Scientific | 31985070 | |
| Chemical compound | Polyethylenimine (PEI), Linear (MW 25,000) | VWR/Polysiciences | 23966–2 | |
| Chemical compound | 16% Paraformaldehyde | Electron Microscopy Sciences | 15710 | |
| Chemical compound | Normal Donkey Serum | Jackson ImmunoResearch | 017-000-121 | |
| Other | Immun-Blot Low Fluorescence PVDF membrane | Bio-Rad | 1620264 | |
| Chemical compound | Fluoromount G | SouthernBiotech | 0100–01 | |
| Chemical compound | Hoechst 33258 | Invitrogen | H21491 | |
| Chemical compound | Isothesia: Isoflurane | Henry Schein | 11695–6776 | |
| Chemical compound | Tissue Freezing Medium | VWR | 15148–031 | |
| Chemical compound | Acrylamide/Bis solution | Bio-Rad | 161–0158 | |
| Chemical compound | 4x Laemmli Sample Buffer | Bio-Rad | 1610747 | |
| Chemical compound | Immun-Blot Low Fluorescence PVDF membrane | Bio-Rad | 1620264 | |
| Chemical compound | Odyssey Blocking Buffer | Li-Cor Biosciences | 927–40000 | |
| Chemical compound | Dynabeads Protein G for Immunoprecipitation | Thermo Fisher Scientific | 10003D | |
| Chemical compound | cOmplete, Mini, EDTA-free Protease Inhibitor Cocktail Tablets | Roche | 4693159001 | |
| commercial assay or kit | Bio-Rad DC Protein Assay Kit | Bio-Rad | 5000112 | |
| Strain (mus musculus) | Mouse: Megf10LacZ | Kay et al. (2012) | Megf10tm1b(KOMP)Jrs | |
| Strain (mus musculus) | Mouse: Megf10flox | this study | Megf10tm1c | see Methods, ‘Animals’ section |
| Strain (mus musculus) | Mouse: Ptf1a-cKO | Krah et al., 2015 | Ptf1atm3Cvw | |
| Strain (mus musculus) | Mouse: Isl1Cre | Jackson Labs 024242 | Isl1tm1(cre)Sev/J | |
| Strain (mus musculus) | Mouse: Hb9-GFP | Jackson Labs 005029 | B6.Cg-Tg(Hlxb9-GFP)1Tmj/J | |
| Strain (mus musculus) | Mouse: ChATCre | Jackson Labs 006410 | Chattm2(cre)Lowl | |
| Strain (mus musculus) | Mouse: Six3-Cre | Jackson Labs 019755 | Tg(Six3-cre)69Frty | |
| Strain (mus musculus) | Mouse: Kcng4Cre | Jackson Labs 029414 | Kcng4tm1.1(cre)Jrs | |
| Strain (mus musculus) | Mouse: Drd4-GFP | Huberman et al. (2009) | Tg(Drd4-EGFP)W18Gsat | |
| Strain (mus musculus) | Mouse: Gjd2-GFP | MMRRC | Tg(Gjd2-EGFP)JM16Gsat/Mmucd; RRID:MMRRC_030611-UCD | |
| Strain (mus musculus) | Mouse: Rosa26mTmG | Jackson Labs 007676 | Gt(ROSA)26Sortm4(ACTB-tdTomato,-EGFP)Luo | |
| Strain (mus musculus) | Mouse: Rosa26fGFP | Rawlins et al. (2009) | Gt(ROSA)26Sortm1(CAG-EGFP)Blh | |
| Strain (mus musculus) | Mouse: Rosa26Ai14 | Jackson Labs 007914 | B6.Cg-Gt(ROSA)26Sortm14(CAG-tdTomato)Hze/J | |
| Strain (mus musculus) | Mouse: ACTB:FLPe | Jackson Labs 003800 | B6;SJL-Tg(ACTFLPe)9205Dym/J | |
| Strain (mus musculus) | Mouse: Gad1-GFP | Jackson Labs 007677 | Tg(Gad1-EGFP)G42Zjh | |
| Strain (mus musculus) | Mouse: C57Bl6/J | Jackson Labs 000664 | C57BL/6J | |
| Cell line (human) | HEK293T | ATCC | 293T (ATCC CRL-3216) | Cell line was authenticated by ATCC at time of purchase |
| Recombinant DNA reagent | CMV-M10-FLAG | this paper | see Methods,‘Generation of MEGF10-ΔICD constructs’ section | |
| Recombinant DNA reagent | CMV-M10-GFP | Kay et al. (2012) | ||
| Recombinant DNA reagent | pCMV-MEGF10-ΔICD-GFP | Kay et al. (2012) | ||
| Recombinant DNA reagent | MEGF10-ΔICD-Flag | this paper | see Methods, ‘Generation of MEGF10-ΔICD Constructs’ section | |
| Recombinant DNA reagent | pAAV-EF1a-Brainbow-tagBFP-EYFP-WPRE | Addgene | 45185 | |
| Recombinant DNA reagent | pAAV-EF1a-Brainbow-mTFP1-Cherry-WPRE | Addgene | 45816 | |
| Software | Fiji/ImageJ | Schindelin et al. (2012) | ||
| Software | Prism | GraphPad | ||
| Software | NIS Elements | Nikon Instruments | ||
| Software | Custom JAVA scripts for spike sorting | Yu et al., 2017 | ||
| Software | Custom MATLAB scripts for data analysis | this paper | https://github.com/Field-Lab/megf10-dstuning | see Methods,‘Multielectrode Array Recordings’;‘Quantification and Statistical Analysis’ sections |
| Software | Matlab | Mathworks, Natick, MA | ||
| Software | Image StudioTM | LI-COR Biosciences | ||
| Software | Photoshop | Adobe | ||
| Sequence-based reagent | M10flagNotI_Rev | IDT | ATAGCGGCCGCttaCTTGTCGTCATCGTCTTTGTAGTCttcactgctgctgctgctgctg | |
| Sequence-based reagent | M10flag_Fwd | IDT | GGTACATGCCTGTGCGAAGCA | |
| Sequence-based reagent | Cyto9_flag_Rev1 | IDT | 5’ATAGCGGCCGCttaCTTGTCGTCATCGTCTTTGTAGTC TTCCTTCCTCTTCTGCTTGTGT |
Additional files
-
Transparent reporting form
- https://doi.org/10.7554/eLife.34241.031
Download links
A two-part list of links to download the article, or parts of the article, in various formats.
Downloads (link to download the article as PDF)
Open citations (links to open the citations from this article in various online reference manager services)
Cite this article (links to download the citations from this article in formats compatible with various reference manager tools)
Formation of retinal direction-selective circuitry initiated by starburst amacrine cell homotypic contact
eLife 7:e34241.
https://doi.org/10.7554/eLife.34241


