Dynamics of ribosomes and release factors during translation termination in E. coli
- Max Planck Institute for Biophysical Chemistry, Germany
Figures
Figure 1 with 3 supplements
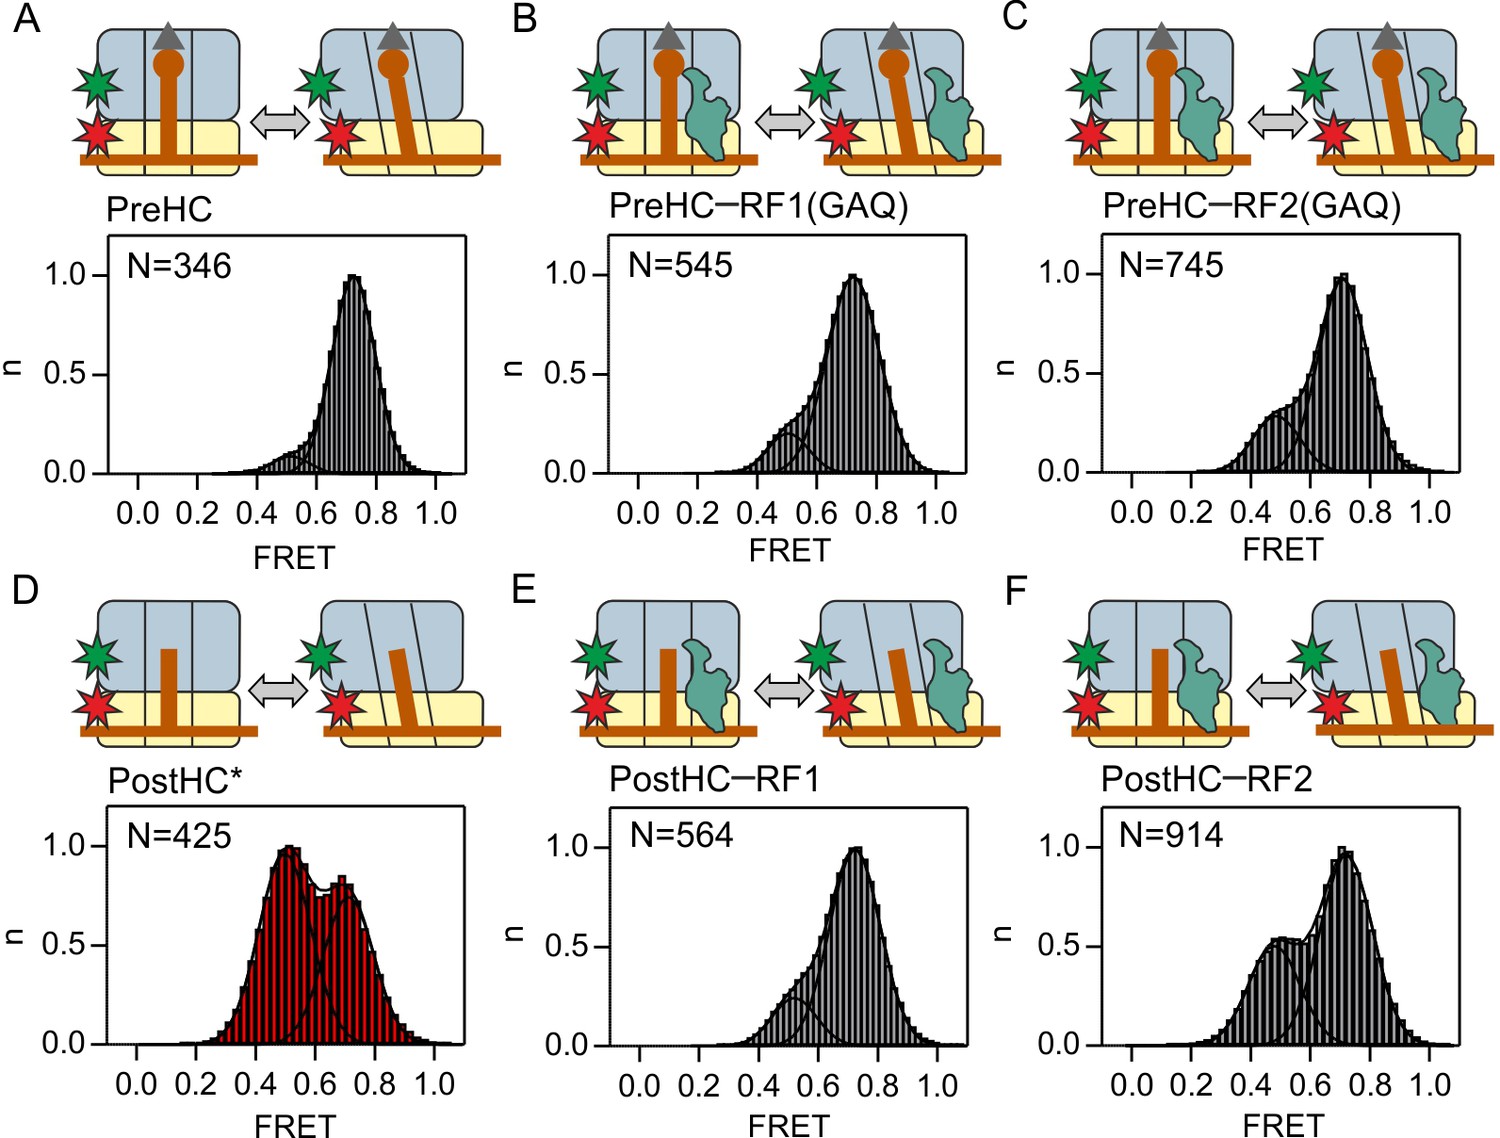
Subunit rotation of termination complexes in the presence of release factors.
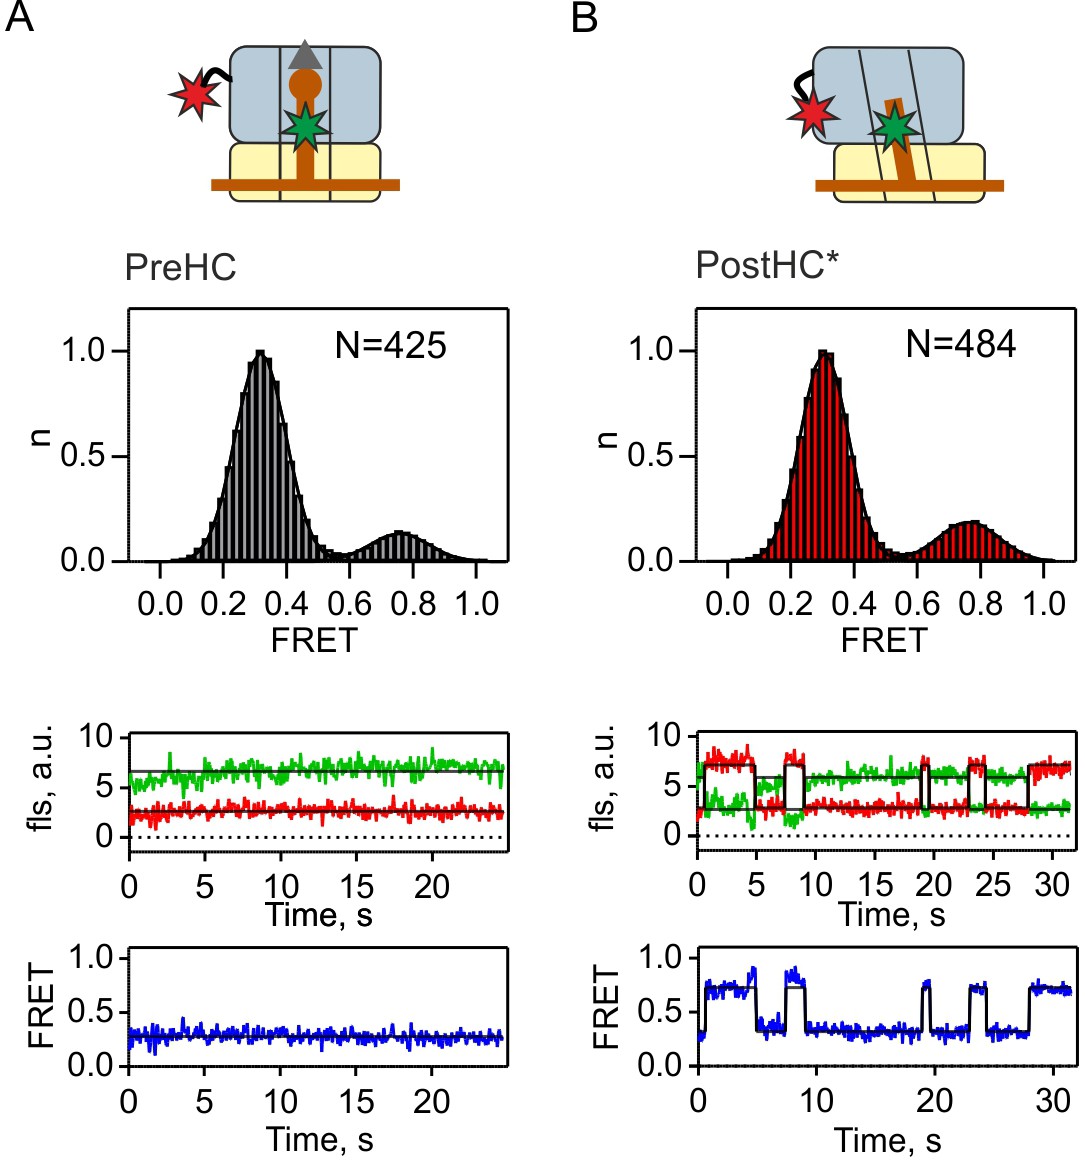
Histograms and Gaussian fits of normalized FRET distributions of S6/L9-labeled termination complexes in the presence of saturating RF1/RF2 concentrations. (A,D) PreHC and PostHC in the absence of RFs. In (D) PostHC* was generated by addition of puromycin to PreHC. (B,E) Same as A,D in the presence of RF1(GAQ) (1 µM) and RF1 (1 µM), respectively. PostHC is formed by the action of RF1. (C,F) Same as B,E in the presence of RF2(GAQ) (1 µM) and RF2 (1 µM), respectively. Cartoons show the complex composition. Grey triangles and brown circles represent the formyl group and the amino acid of fMet, respectively; stars indicate the positions of the Cy3 (green) and Cy5 (red) labels. The red shade of histogram in (D) indicates frequent reversible transitions between N and R states. The grey shade of all other histograms indicates that transitions were observed in less than 20% of traces. FRET values (Supplementary file 1) are calculated from three independent data sets. See also Figure 1—figure supplement 1, Figure 1—figure supplement 2 Figure 1—figure supplement 3 and Supplementary file 1.
Figure 1—figure supplement 1
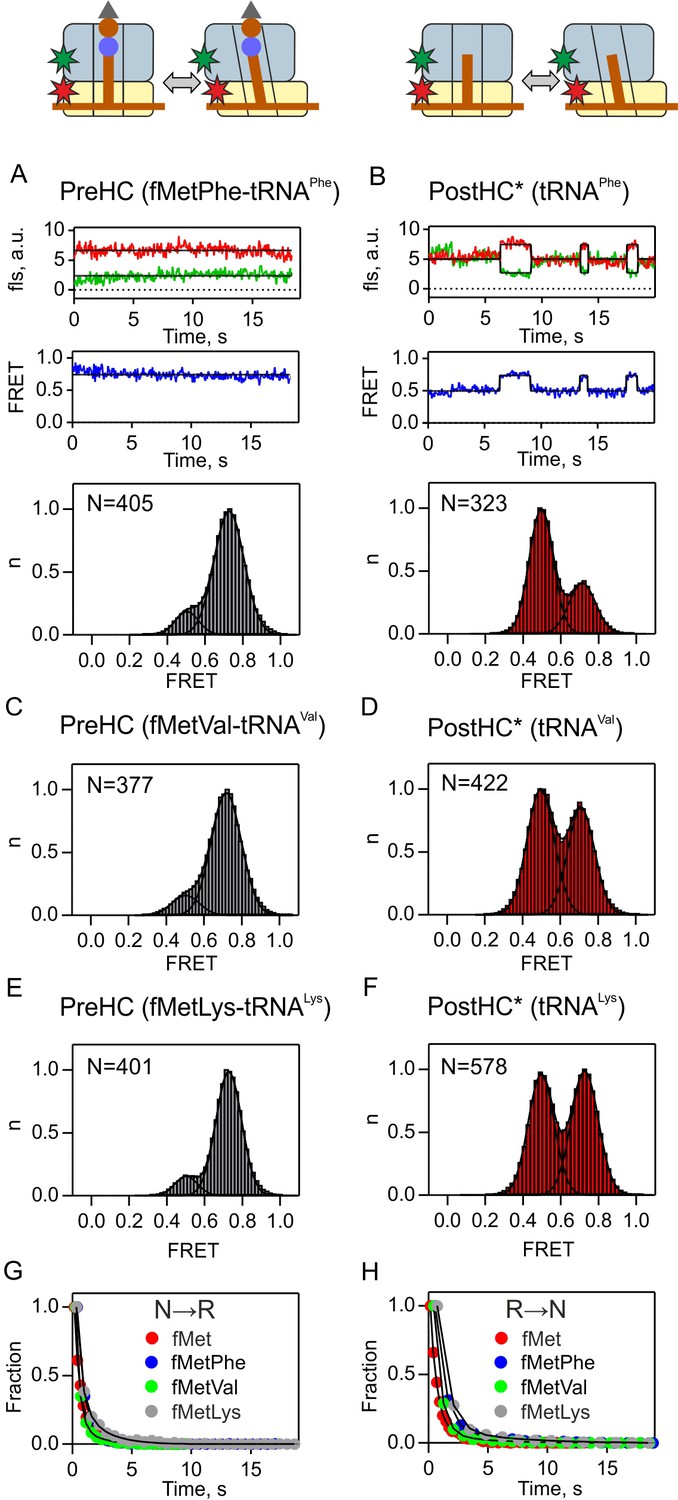
Subunit rotation of termination complexes in the absence of release factors.
FRET signals monitored using S6/L9-labeled PreHC (A,C,E) and PostHC* (B,D,F) with different tRNAs in the P site. PostHC* was generated by addition of puromycin (1 mM) to PreHC. (A,B) Representative examples of time courses are shown for fMetPhe-tRNAPhe and tRNAPhe (C–F). Histograms showing the normalized distribution of FRET states. N is the number of traces entering the histogram. (G,H) Dwell time distributions obtained from the Hidden-Markov fits of FRET time traces. Transition rates from the N to the R state (kN→R) and from the R to the N state (kR→N) were determined by exponential curve fitting of the dwell-time distribution histograms. FRET values and rate constants (mean ±sd) were calculated from three independent data sets and are summarized in Supplementary file 1.
Figure 1—figure supplement 2
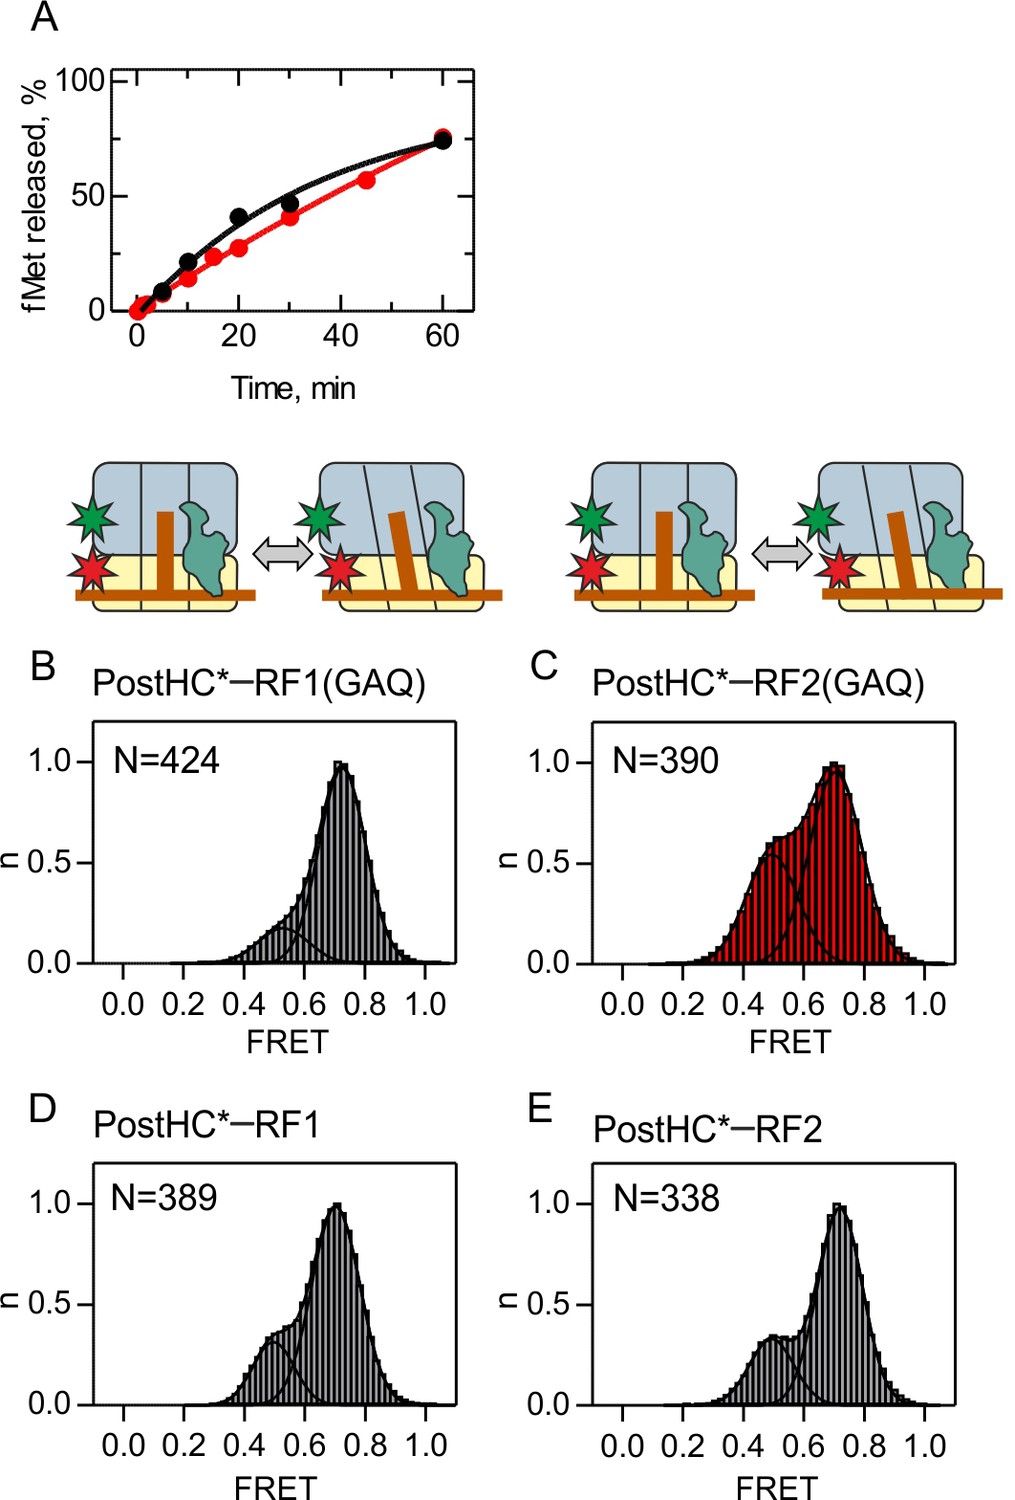
Peptide hydrolysis by RF1/RF2(GAQ) mutants and subunit rotation of Post HC* monitored using FRET between S6-Cy5 and L9-Cy3.
(A) Time courses of peptide hydrolysis were started by incubation of PreHC (100 nM) with RF1(GAQ) (10 nM, black curve) and RF2(GAQ) (10 nM, red curve) at 23°C in TAKM7 buffer. The amount of [3H]fMet-tRNAfMet was quantified by scintillation counting. The rate of peptide hydrolysis is (3.8 ± 0.1)x10−4 s−1 for RF1(GAQ) and (3.2 ± 0.1)x10−4 s−1 for RF2(GAQ), compared to 13 s−1 and 8 s−1 measured with wt RF1 and RF2 respectively (Indrisiunaite et al., 2015). During the typical steady-state smFRET experiment (10 min), less than 10% of the PreHC is converted to PostHC. (B,C,D,E) Histograms showing the normalized distribution of FRET states obtained with S6/L9-labeled PostHC*. PostHC* was generated using puromycin. (B,D) In the presence of RF1 or RF1(GAQ) (1 µM). (C,E) In the presence of RF2 or RF2(GAQ) (1 µM). FRET values (mean ± sd; Supplementary file 1) were calculated from three independent data sets.
Figure 1—figure supplement 3
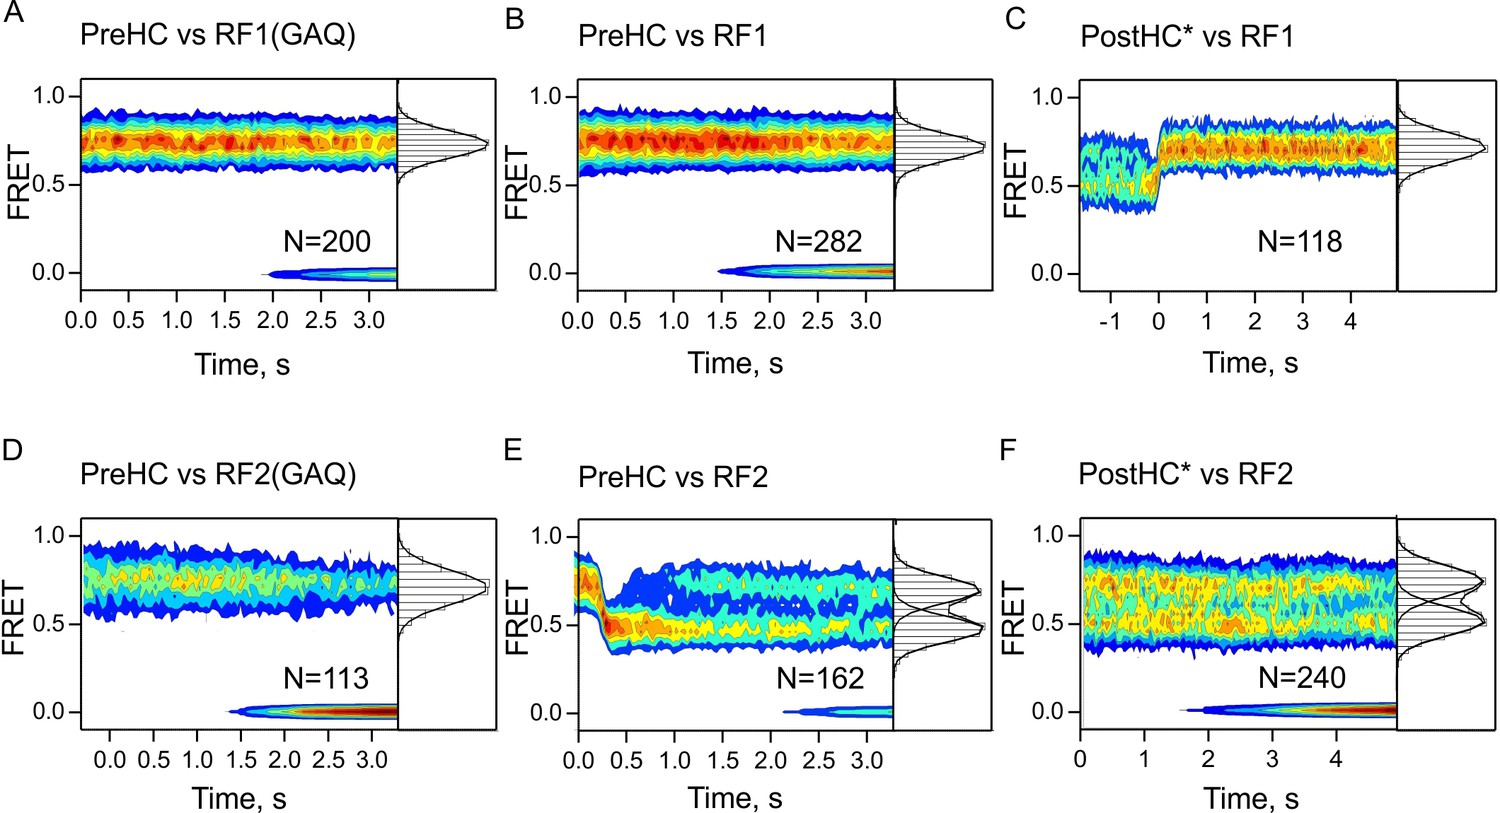
Time-resolved subunit rotation.
FRET time courses measured with S6/L9-labeled termination complexes upon addition of low concentrations (100 nM) of RF1/RF1(GAQ) (A–C), or RF2/RF2(GAQ) (D–F). In (A,B,D) FRET signals did not change over time. In (C) traces are synchronized to the last R to N transition when the N state lasted significantly longer than the spontaneous rotation rate; this selection of particularly long-lived traces explains why photobleaching is not observed. In (E) traces are synchronized to the first N to R transition. FRET values are summarized in one-dimensional FRET histograms to the right of the contour plots. FRET values (mean ±sd) were calculated from three independent experiments and are 0.74 ± 0.01 (A), 0.75 ± 0.01 (B), 0.73 ± 0.01 (C), 0.75 ± 0.02 (D), 0.72 ± 0.02 and 0.49 ± 0.01 (E), 0.73 ± 0.02 and 0.51 ± 0. (F).
Figure 2 with 3 supplements
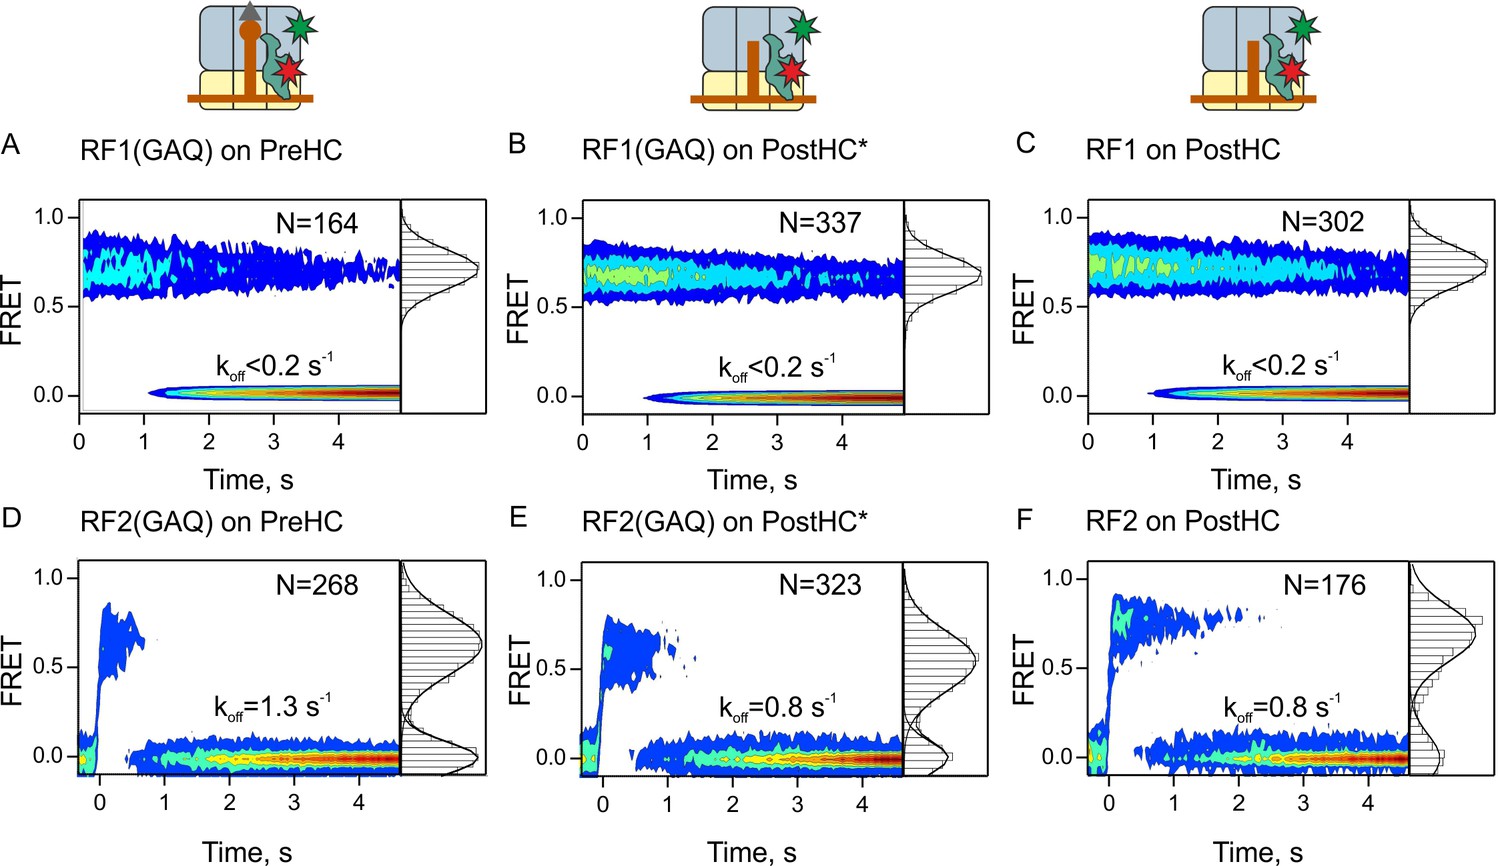
Residence times of RF1 and RF2 on PreHC and PostHC.
(A–C) smFRET upon addition of RF1-Cy5 or RF1(GAQ)-Cy5 to PreHC or PostHC labeled at protein L11 with Cy3. FRET values (mean ± sd) center at 0.72 ± 0.02 (A), 0.71 ± 0.01 (B), and 0.71 ± 0.01 (C). (D–F) smFRET upon addition of RF2-Cy5 or RF2(GAQ)-Cy5 to PreHC or PostHC labeled at protein L11 with Cy3. FRET values (mean ± sd) center at 0.65 ± 0.03 (D), 0.56 ± 0.05 (E), and 0.70 ± 0.04 (F). Experiments were carried out with catalytic amounts of labeled release factors (10 nM). Individual traces were combined in contour plots. FRET histograms are plotted to the right of the contour plots. In (B,E) the peptide was released using puromycin. In the (C,F) peptide was released by RF1 and RF2, respectively. FRET signals were synchronized to the beginning of the FRET signal. koff is the rate of RF1 or RF2 dissociation. Mean FRET values and rate constants with sd were calculated from three independent data sets. See also Figure 2—figure supplement 1, Figure 2—figure supplement 2, Figure 2—figure supplement 3 and Supplementary file 1.
Figure 2—figure supplement 1
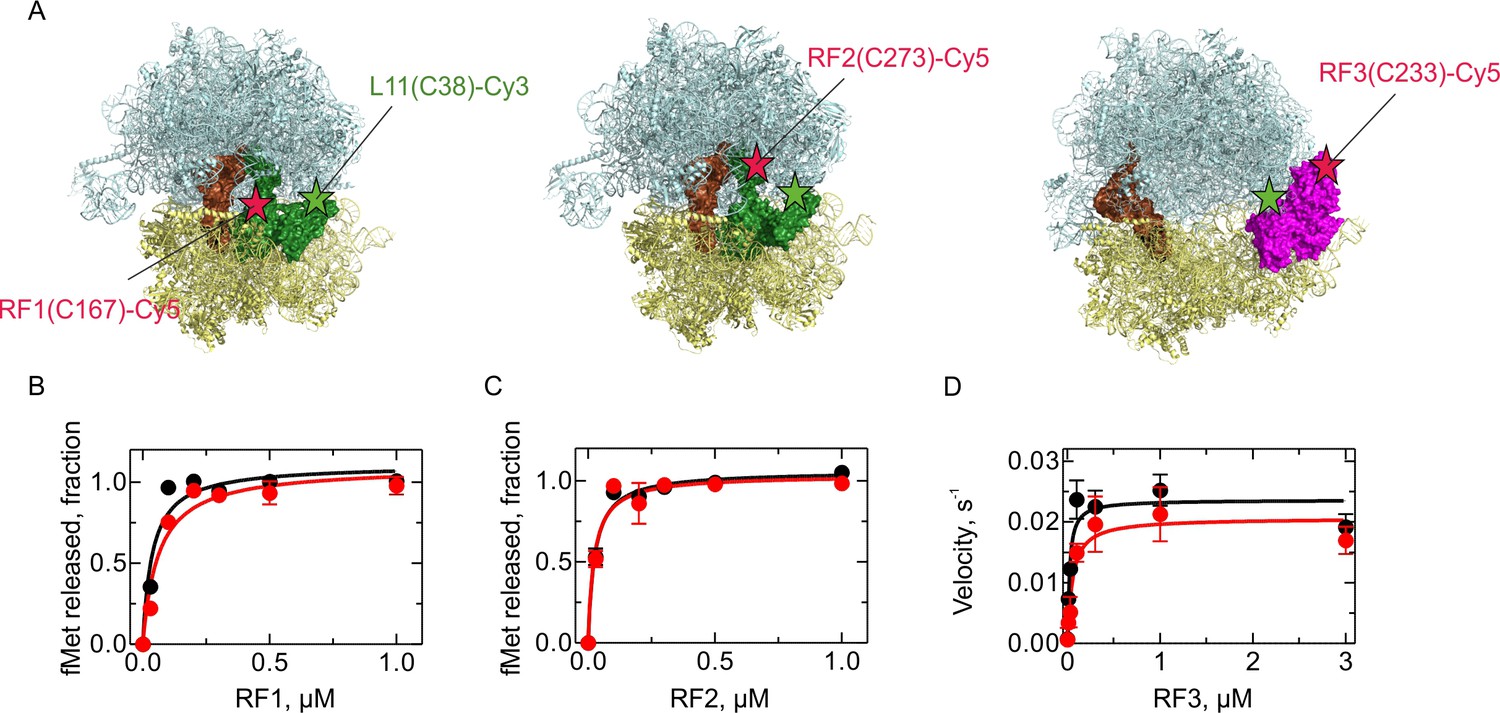
Activity of the fluorescence-labeled RFs.
(A) Labeling positions in RF1, RF2, and RF3 (indicated as red stars) and L11 (green stars). Structural models were prepared using PDB entries 4V7P (Korostelev et al., 2010) (RF1), 5CZP (Pierson et al., 2016) (RF2) and 4V89 (Zhou et al., 2012) (RF3). (B,C) Activity of RF1-Cy5 (B) and RF2-Cy5 (C) (red) compared to the respective wild-type factor (black) as determined by peptide hydrolysis. PreHC (30 nM) was incubated with the indicated concentrations of RF for 10 s. (D) Activity of RF3-Cy5 (red) compared to the wild-type factor (black) as determined by the ability to recycle RF1. PreHC (100 nM) was incubated with RF1 (10 nM) and increasing concentrations of RF3. The rate of peptide hydrolysis was determined by linear fitting of the time courses at initial velocity conditions. Error bars represent the range of values from two independent experiments.
Figure 2—figure supplement 2
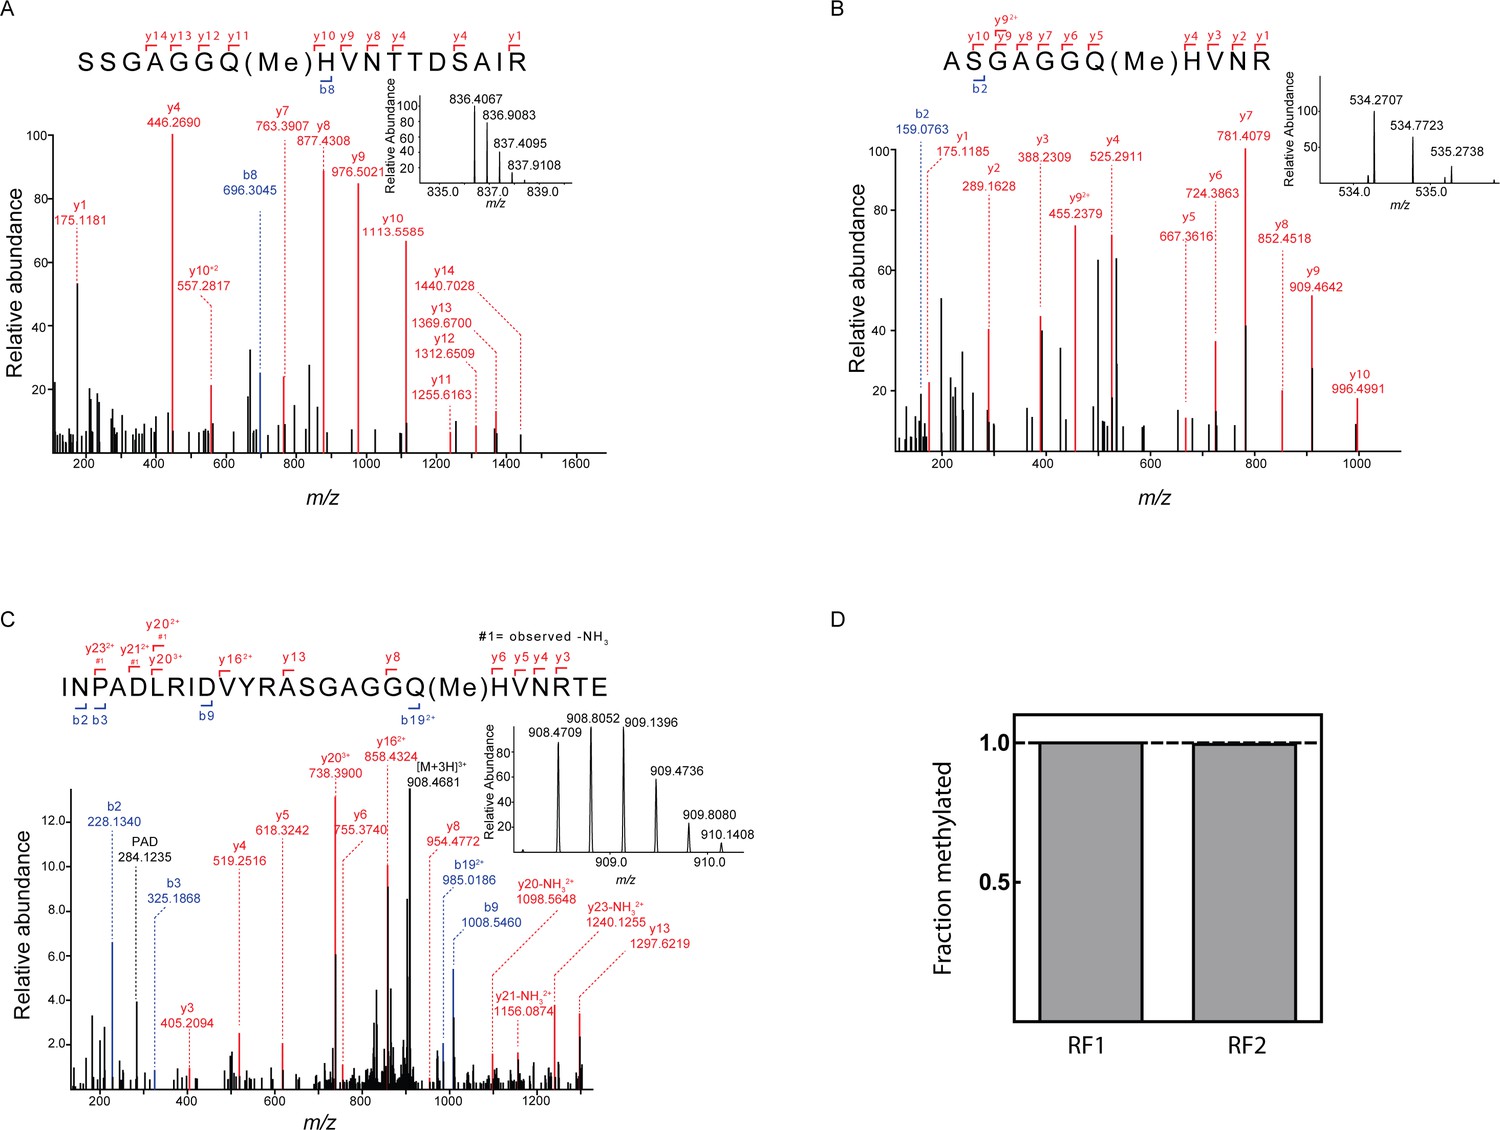
Quantification of release factor methylation by mass spectrometry.
(A) MS/MS spectrum of methylated peptide derived from RF1-Cy5 by proteolysis with trypsine. Inset: MS spectrum (m/z = 836.4059) of the intact methylated peptide (z = 2). (B) MS/MS spectrum of the methylated peptide derived from RF2-Cy5 by proteolysis with trypsine. Inset: MS spectrum (m/z = 534.2707) of the intact methylated peptide (z = 2). The exceptional hydrophilicity of the peptide hampered a reliable relative quantification. (C) MS/MS spectrum of methylated peptide derived from RF2-Cy5 by proteolysis with GluC. Inset: MS spectrum (m/z = 908.4706) of the intact methylated peptide (z = 3). (D) Relative quantification of the methylation efficiency. Methylated and unmethylated peptide was quantified by MS1 full scan filtering and the fraction of methylated peptide was quantified assuming similar ionization properties of both peptides. Mean values were calculated from three technical replicates with error bars (±0.001) representing standard deviation (too small to be seen).
Figure 2—figure supplement 3
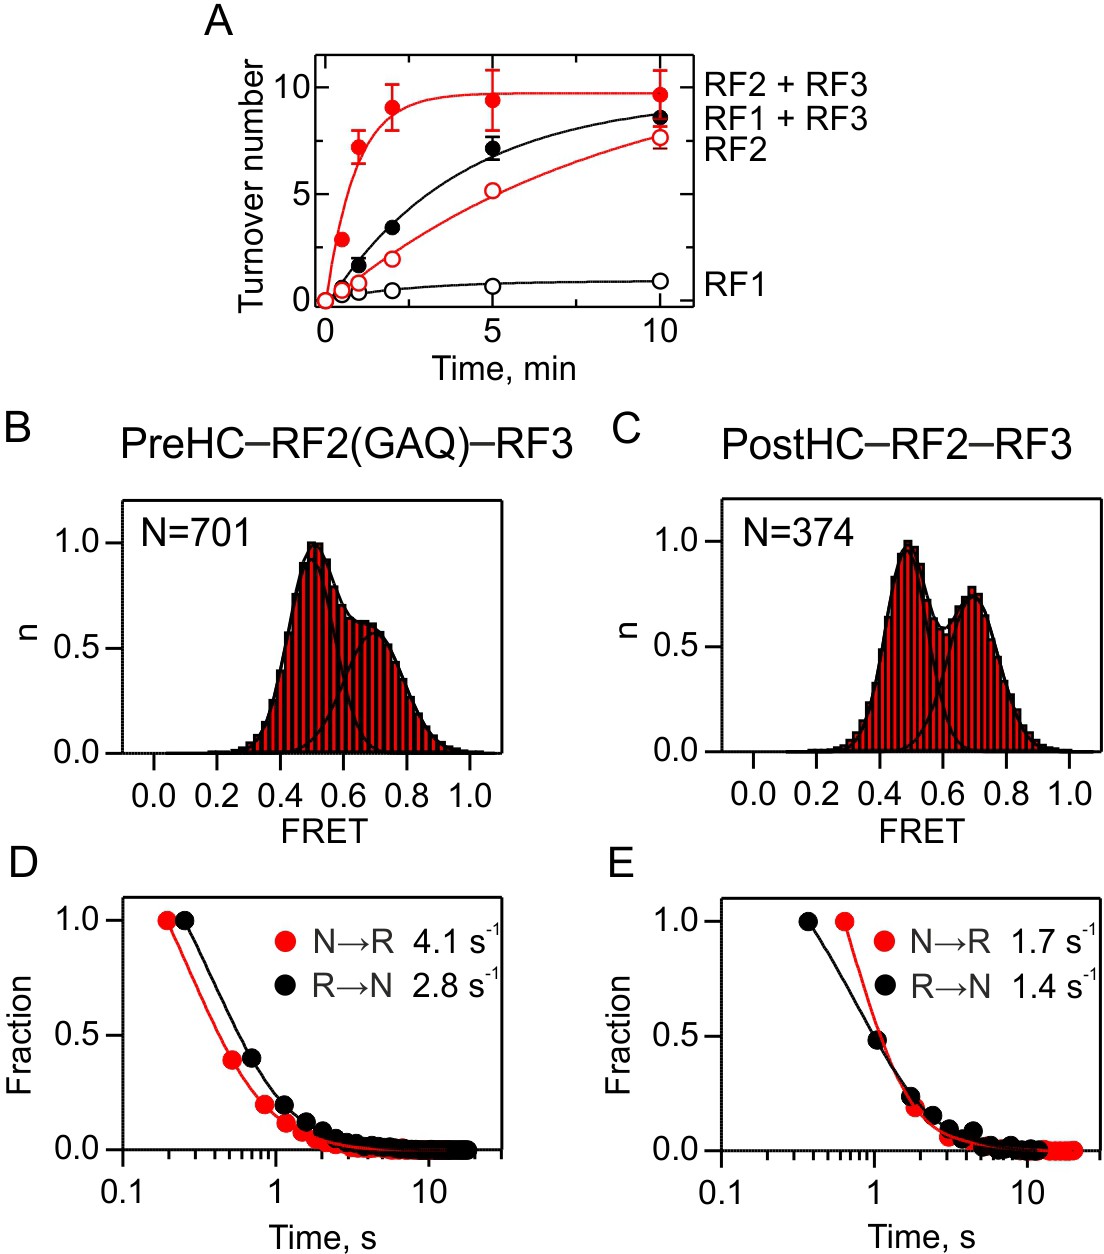
Interplay between RF2 and RF3.
(A) RF3-mediated recycling of RF1 and RF2. Peptide hydrolysis by RF1 (black symbols) and RF2 (red symbols) was monitored at turnover conditions in the absence (open symbols) or in the presence (closed symbols) of RF3. PreHC (100 nM) was incubated with RF1 or RF2 (10 nM) or with RF1 or RF2 (10 nM), RF3 (100 nM) and GTP (1 mM). Error bars represent the standard error of three independent replicates. (B,C) Subunit rotation of S6/L9-labeled PreHC with RF2(GAQ) and RF3-GTP (B) and PostHC with RF2 and RF3-GTP (C). The factor concentration was 1 µM. (D,E) Dwell time distributions of N and R states for PreHC (D) and PostHC (E).
Figure 3 with 1 supplement

Interaction of RF3–GTP with termination complexes.
(A,D) Subunit rotation of S6/L9-labeled PreHC and PostHC* in the presence of excess RF3 (1 µM) with GTP (1 mM). (B,E) Distribution of L1-open and L1-closed states in PreHC and PostHC* labeled at tRNAfMet and protein L1 in the presence of excess RF3 (1 µM) with GTP (1 mM). Smooth red and gray lines show distributions of states without RF3. Color code is the same as in histograms (red, frequent transitions between the states; gray, transitions in less than 20% of traces). (C,F) Contour plots representing the residence time of RF3-Cy5 (10 nM) on PreHC and PostHC* labeled at L11 by Cy3. FRET time courses were synchronized to the beginning of the first FRET event. FRET values (mean ±sd) 0.62 ± 0.02 (C) and 0.64 ± 0.04 (F) are from three independent data sets and plotted to the right of the contour plots. koff is the rate of RF3 dissociation. See also Figure 3—figure supplement 1 and Supplementary file 1.
Figure 3—figure supplement 1
tRNA conformation in PreHC and PostHC*.
Distribution of P/P and P/E-like states in PreHC and PostHC* with FRET labels on tRNAfMet and protein L1 in the absence of termination factors as well as representative example traces. Gaussian fits of FRET signals center at 0.76 ± 0.02 (mean ±sd) and 0.32 ± 0.01 (A) and 0.76 ± 0.01 and 0.31 ± 0.01 (B). FRET values were calculated from three independent datasets.
Figure 4
Interplay between RF1 and RF3–GTP.
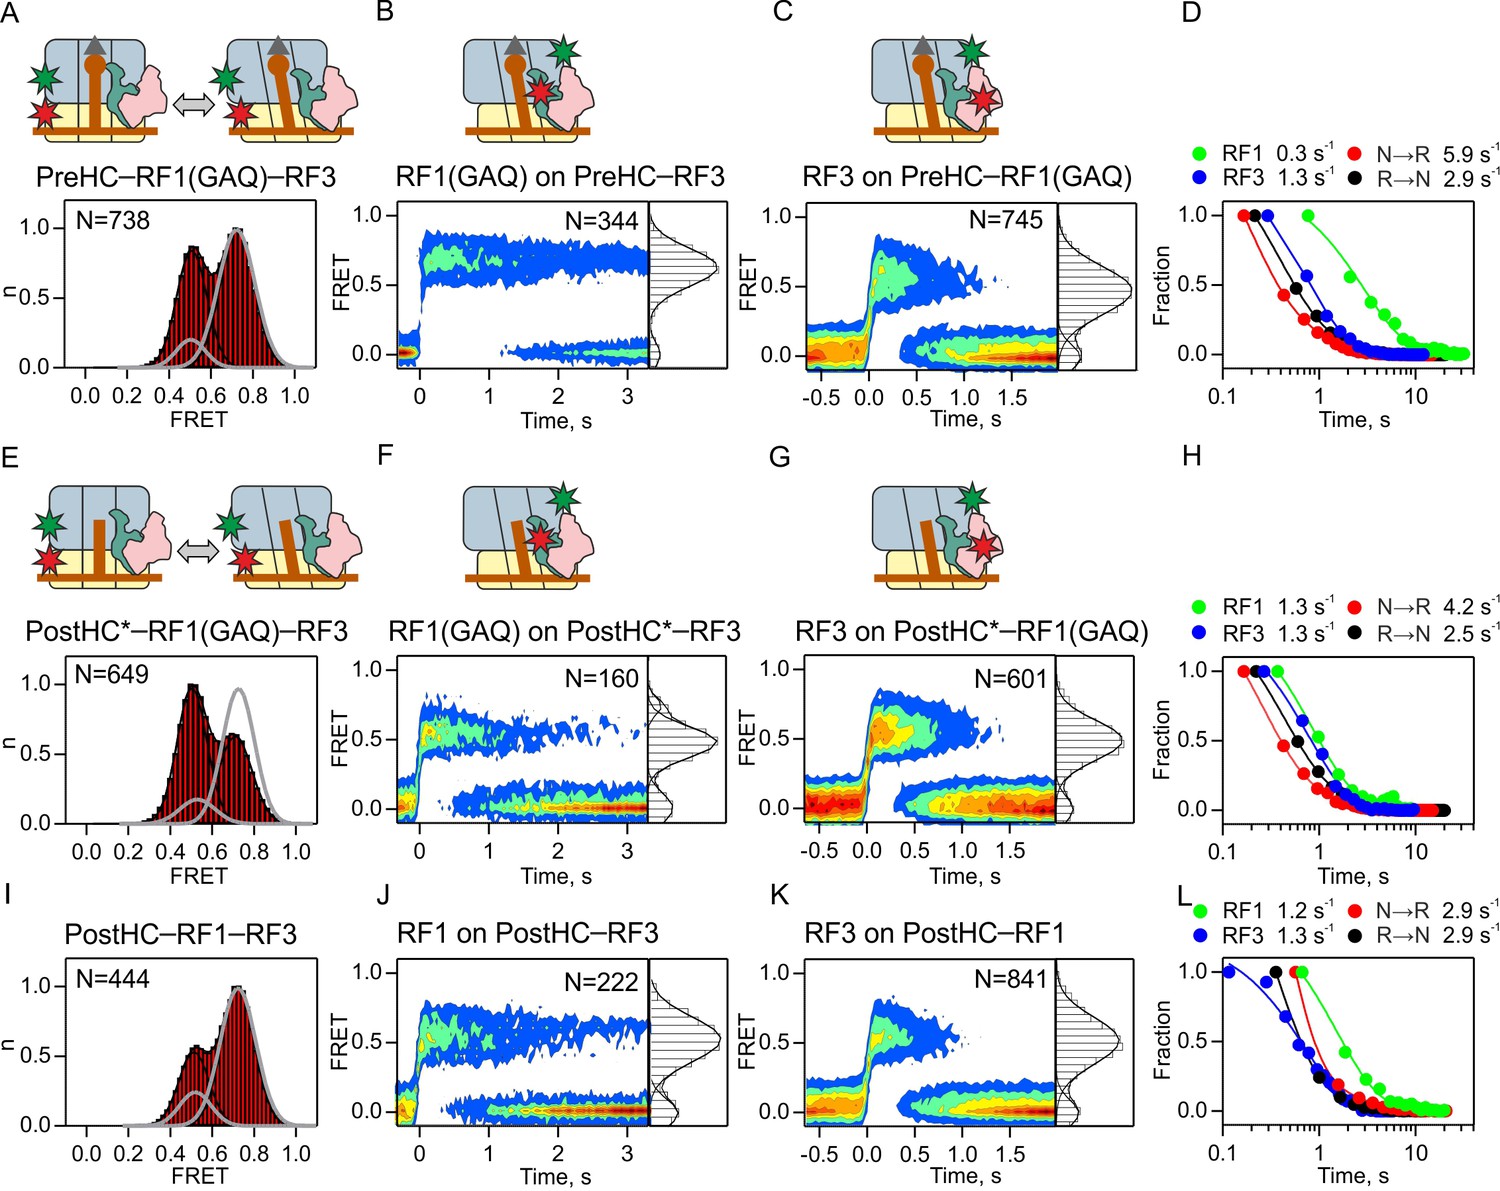
(A,E,I) Subunit rotation of S6/L9-labeled Pre- and PostHC measured at saturating RF1 and RF3–GTP concentrations (1 µM each). Grey line represents FRET distribution in the absence of RF3. (B,F,J) Contour plots representing the residence time of RF1-Cy5/RF1(GAQ)-Cy5 ribosomes labeled at protein L11 by Cy3 in the presence of excess RF3 (1 µM). Time courses were synchronized to the beginning of the FRET signal. FRET values (mean ±sd) are 0.67 ± 0.02 (B), 0.50 ± 0.03 and 0.76 ± 0.02 (F), and 0.53 ± 0.04 (I). (C,G,K) Contour plots representing the residence time of RF3-Cy3 on ribosomes labeled at protein L11 by Cy3 in the presence of excess RF1 or RF1(GAQ) (1 µM). FRET values (mean ± sd) are 0.51 ± 0.03 (C), 0.51 ± 0.03 (G), and 0.51 ± 0.03 (K). (D,H,L) Comparison of the rates of RF1 and RF3 dissociation and subunit rotation. (A–D) Interactions with PreHC. (E–H) Interactions with PostHC* obtained by puromycin treatment. (I–L) Interactions with PostHC which is formed in situ using RF1. All values are mean ± sd from three independent data sets. See also Supplementary file 1.
Figure 5
Dissociation of RF3 from RF1-bound PostHC in the presence of Api.
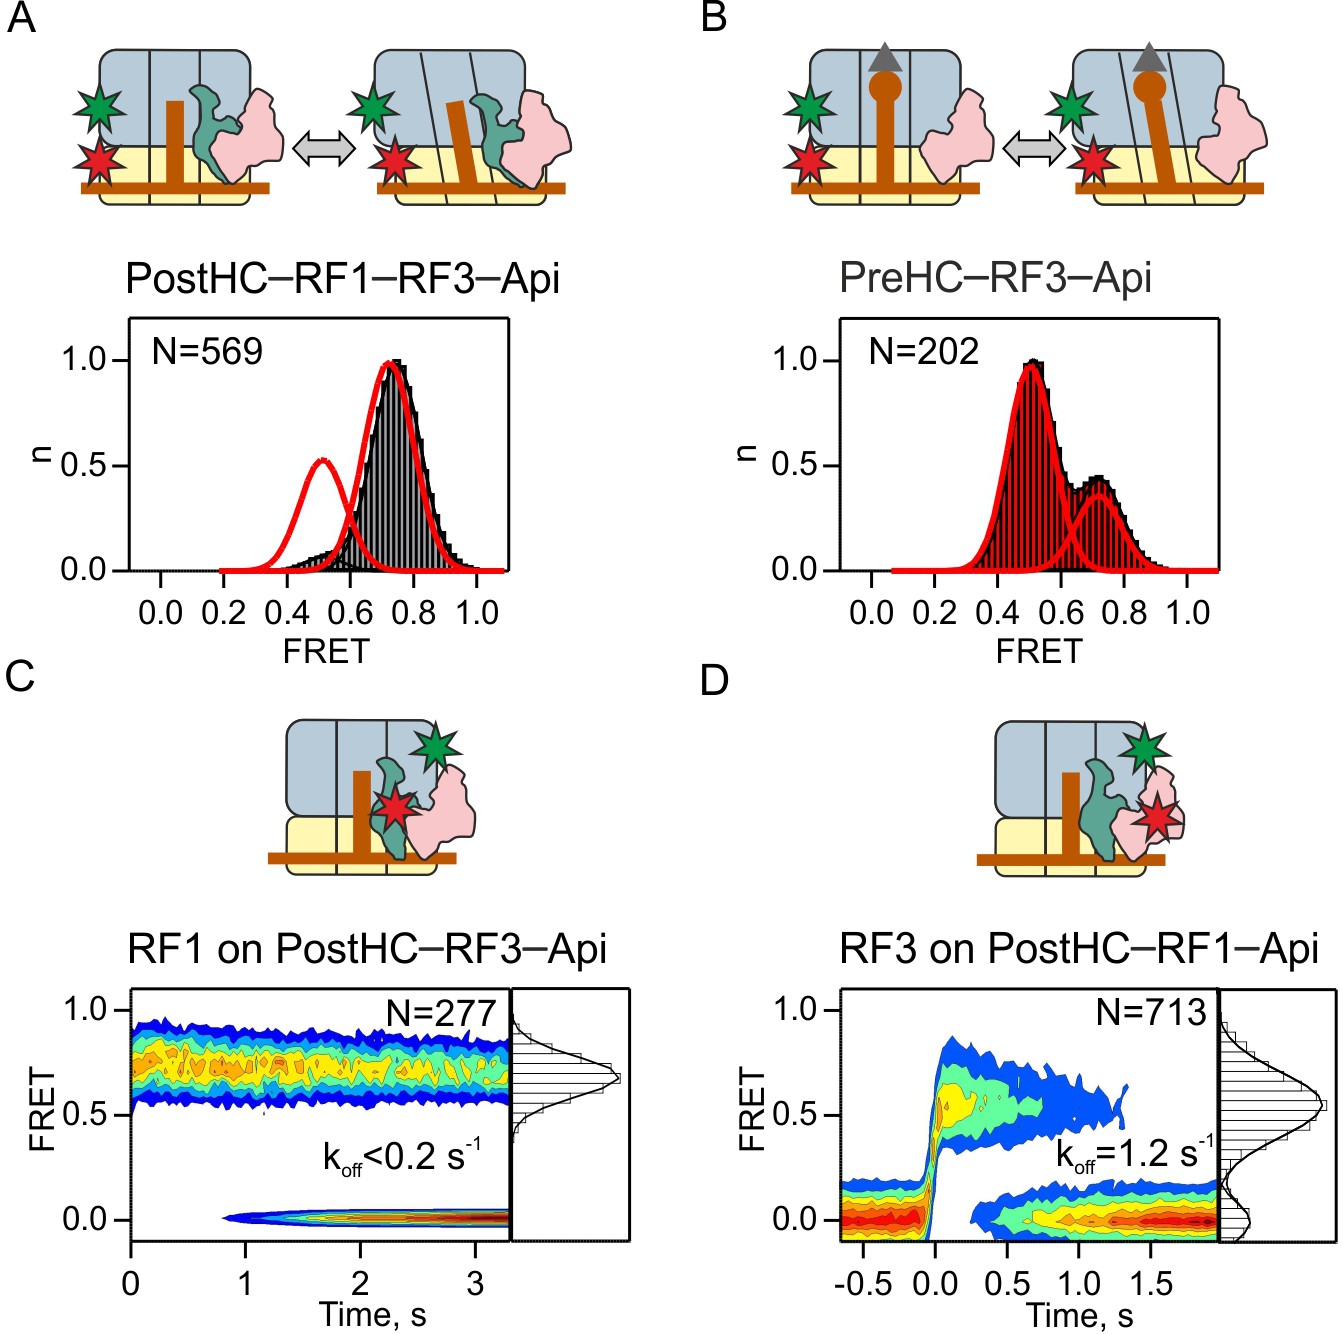
(A,B) Subunit rotation of S6/L9-labeled Pre- and PostHC with or without RF1 (1 µM), with saturating RF3 concentrations (1 µM) and Api (1 µM). Red lines in (A) and (B) represent FRET distribution in the absence of Api. (C) Contour plot representing the residence time of RF1-Cy5 on PostHC-Cy3 in the presence of saturating RF3 concentration (1 µM) and Api (1 µM). FRET values (mean ± sd) center at 0.71 ± 0.01. (D) Contour plot representing the residence time of RF3-Cy5 on PostHC-Cy3 in the presence of saturating RF1 concentration (1 µM) and Api (1 µM). FRET values (mean ± sd) center at 0.55 ± 0.04. All values are mean ± sd from three independent data sets. See also Supplementary file 1.
Figure 6 with 2 supplements
The role of GTP hydrolysis for RF1 and RF3 recycling.
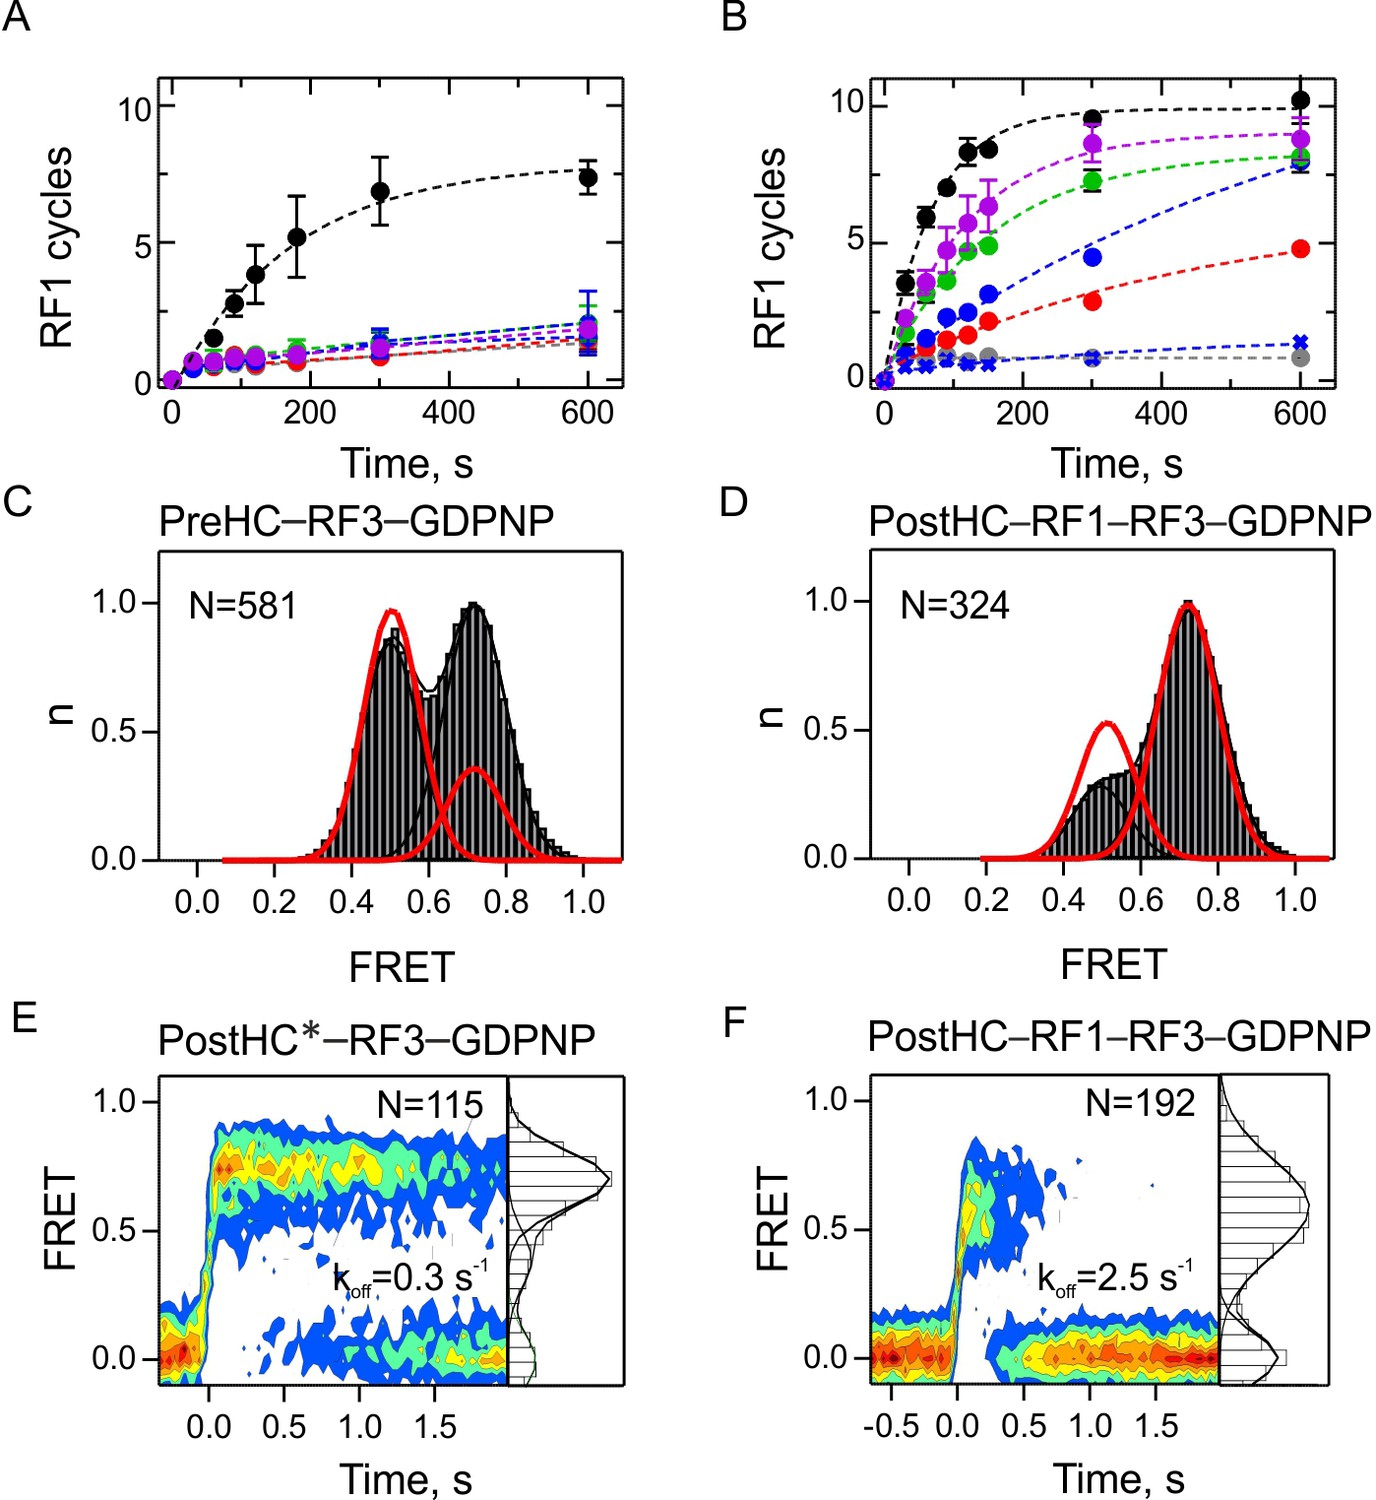
(A,B) Effect of different nucleotides on peptidyl-tRNA hydrolysis (GTP, black circles; GTPγS, green circles; GDPNP, blue circles; GDP, red circles; no nucleotide, grey circles) or in the presence of RF3(H92A) and GTP (purple circles). Control experiments are in the absence of RF3 (blue crosses). Error bars represent the range of two technical replicates. (A) Peptide hydrolysis was performed by incubating PreHC (100 nM) with RF3 (10 nM) and the respective nucleotides (1 mM); reactions were started with the addition of RF1 (10 nM). (B) Same as in (A), but at 1 µM RF3. (C,D) FRET distribution reporting on subunit rotation of S6/L9-labeled PreHC in the presence of saturating amounts of RF3–GDPNP (C) or RF1 with RF3–GDPNP (D) (1 µM RF each). Red lines represent the distribution of FRET states with RF3–GTP. (E,F) Contour plots representing the residence time of RF3-Cy5 (10 nM) on PostHC labeled at L11 by Cy3 in the presence of GDPNP (1 mM) without RF1 (E) or (F) in the presence of saturating RF1 concentration (1 µM). FRET values (mean ± sd) center at 0.71 ± 0.01 and 0.40 ± 0.01 (E) and 0.58 ± 0.03 (F). All values are mean ± sd from three independent data sets. See also Figure 6—figure supplement 1, Figure 6—figure supplement 2 and Supplementary file 1.
Figure 6—figure supplement 1
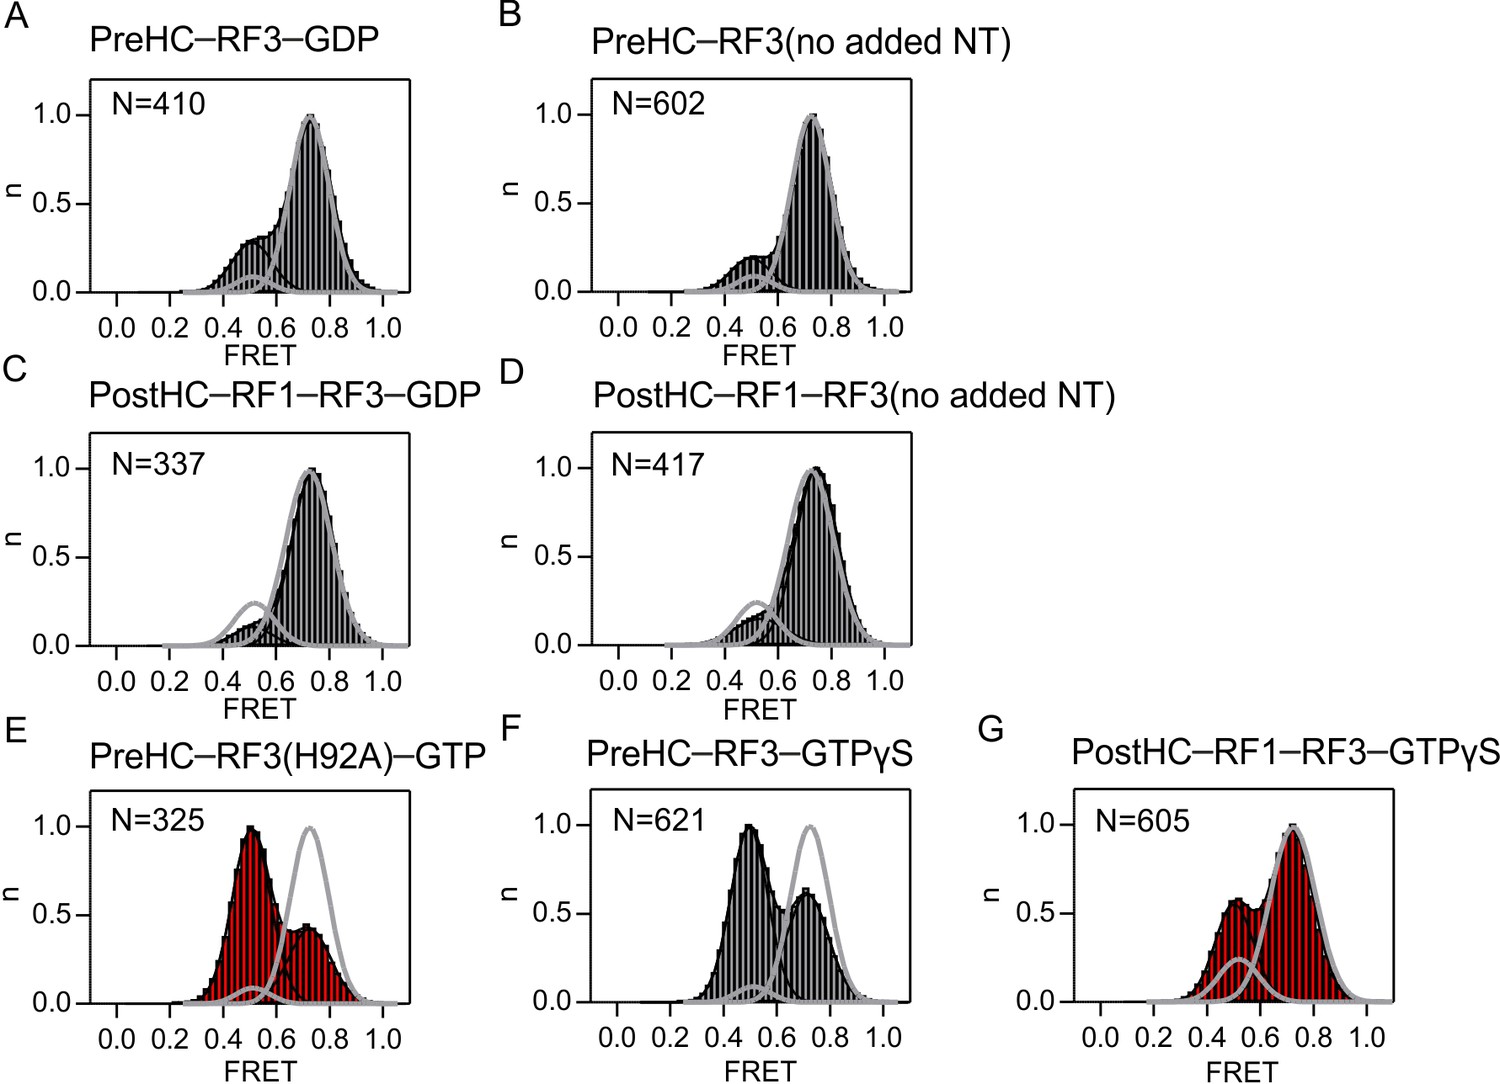
Effect of the nucleotide bound to RF3 on subunit rotation.
FRET distribution in the S6/L9-labeled PreHC in the presence of. (A) RF3 and GDP. (B) apo-RF3 in the absence of added nucleotide. (C) RF1, RF3 and GDP. (D) RF1 and apo-RF3. (E) RF3(H92A) and GTP. (F) RF3 and GTPγS. (G) RF1, RF3 and GTPγS. The concentration of RF1 and RF3 is 1 µM and of the nucleotide 1 mM. Grey lines represent the distribution of FRET states in the absence of RF3.
Figure 6—figure supplement 2
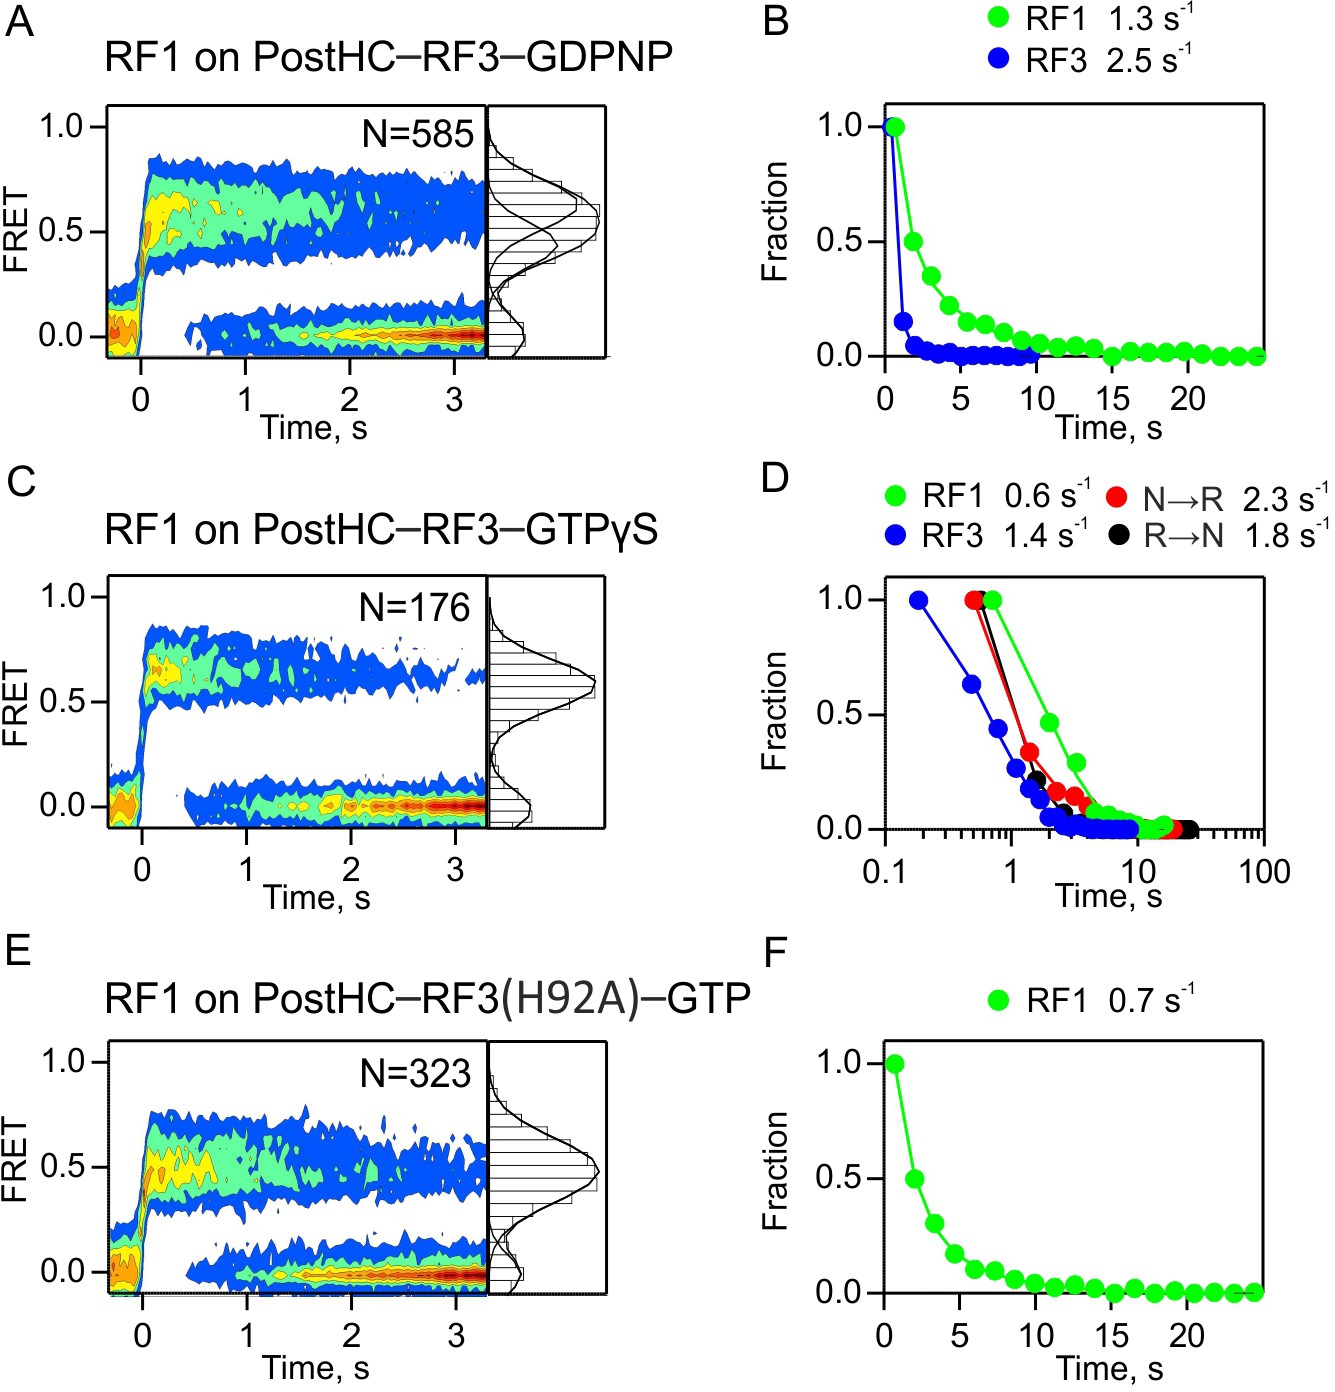
Dissociation of RF1 from PostHC mediated by RF3 in the absence of GTP hydrolysis.
(A,B) In the presence of GDPNP. (C,D) In the presence of GTPγS. (E,F) With RF3(H92A) and GTP. (A,C,E) Dissociation of RF1 monitored by FRET between RF1-Cy5 (10 nM) and L11-Cy3 in the presence of excess RF3 (1 µM). The nucleotide concentration is 1 mM. Time courses were synchronized to the onset of the FRET event and combined in contour plots. FRET values (mean ±sd, from three independent data sets) are 0.47 ± 0.04 and 0.67 ± 0.04 (A), 0.66 ± 0.04 (C), and 0.51 ± 0.03 (E). (B,D,F) Dwell time distributions and the rates of RF1 and RF3 dissociation and subunit rotation.
Figure 7
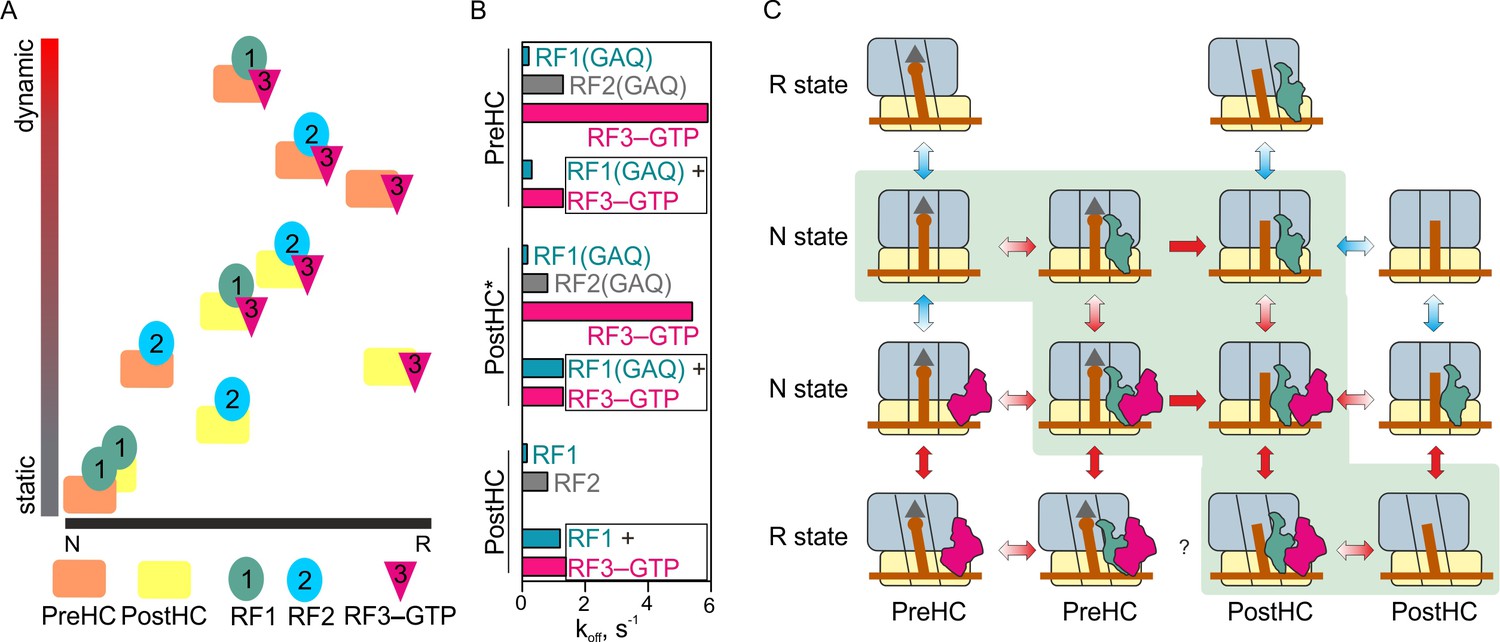
The mechanism of translation termination.
(A) Ribosome dynamics in the presence of RF1, RF2, and RF3. Ribosome fluctuations are color-coded from static (gray) to dynamic (red) and correlated to the fraction of N and R state in the respective complex. (B) Summary of the dissociation rate constants of RF1, RF2 and RF3 from different type of complexes. Bars representing the dissociation of RF1 are colored teal, RF2 gray, RF3 magenta. (C) The landscape of ribosome conformations with RF1 and RF3. The ribosome states (N and R, PreHC and PostHC) are indicated. Red arrows indicate rapid reaction, blue arrows static or slowly exchanging states, with the preferential direction indicated by color gradient; single-headed arrows indicate irreversible steps of peptidyl-tRNA hydrolysis. See also Supplementary file 1.
Tables
Key resources table
| Reagent type (species) or resource | Designation | Source or reference | Identifiers | Additional information |
|---|---|---|---|---|
| Strain, strain background (E. coli) | JW3947-1 | Keio collection | CGSC#: 12041 | E. coli rplA knockout strain |
| Sequence-based reagent | Start-stop mRNA | IBA (Göttingen) | N/A | RNA oligonucleotide: 5’-GGCAAGGAGGUAAAUAAU GUAAACGAUU-3’ |
| Sequence-based reagent | mMetStop | IBA (Göttingen) | N/A | RNA oligonucleotide: 5′-Biotin-CAACCUAAAACUUACACA CCCGGCAAGGAGGUAAAUAAU GUAAACGAUU-3′ |
| Sequence-based reagent | mMetPheStop | IBA (Göttingen) | N/A | RNA oligonucleotide: 5‘-Biotin-CAACCUAAAACUUACACACCC GGCAAGGAGGUAAAUAAUGUUU UAAACGAUU-3 ‘ |
| Sequence-based reagent | mMetLysStop | IBA (Göttingen) | N/A | RNA oligonucleotide: 5‘-Biotin-CAACCUAAAACUU ACACACCCGGCAAGGAGGUA AAUAAUGAAGUAAACGAUU-3 ‘ |
| Sequence-based reagent | mMetValStop | IBA (Göttingen) | N/A | RNA oligonucleotide: 5‘-Biotin-CAACCUAAAACUUAC ACACCCGGCAAGGAGGUAAAU AAUGGUUUAAACGAUU-3 ‘ |
| Peptide, recombinant protein | RF2(GAQ) (recombinant protein) | PMID: 12419223 | ||
| Peptide, recombinant protein | RF1(GAQ) (recombinant protein) | PMID: 12419223 | ||
| Peptide, recombinant protein | RF1(S167C) (recombinant protein) | PMID: 19597483 | Single-cysteine RF1 | |
| Peptide, recombinant protein | RF2(C273) (recombinant protein) | This paper | Single-cysteine RF2 | |
| Peptide, recombinant protein | RF3(L233C) (recombinant protein) | This paper | Single-cysteine RF3 | |
| Peptide, recombinant protein | L1(T202C) (recombinant protein) | PMID: 18471980 | Single-cysteine L1 | |
| Peptide, recombinant protein | Apidaecin137 (API) (peptide) | NovoPro Biosciences Inc. | N/A | |
| Chemical compound, drug | Cy3-maleimide | GE Healthcare | PA23031 | |
| Chemical compound, drug | Cy5-maleimide | GE Healthcare | PA25031 | |
| Software, algorithm | Matlab | MathWorks | ||
| Software, algorithm | Prism GraphPad | GraphPad Software, La Jolla California USA, www.graphpad.com | ||
| Software, algorithm | Matlab code vbFRET | http://vbfret.sourceforge.net/ | Described in Bronson et al. (2009) |
Additional files
-
Supplementary file 1
Quantitative analysis of conformational dynamics during termination.
- https://doi.org/10.7554/eLife.34252.019
-
Transparent reporting form
- https://doi.org/10.7554/eLife.34252.020
Download links
A two-part list of links to download the article, or parts of the article, in various formats.
Downloads (link to download the article as PDF)
Open citations (links to open the citations from this article in various online reference manager services)
Cite this article (links to download the citations from this article in formats compatible with various reference manager tools)
Dynamics of ribosomes and release factors during translation termination in E. coli
eLife 7:e34252.
https://doi.org/10.7554/eLife.34252


