Novel transgenic pigs with enhanced growth and reduced environmental impact
- South China Agricultural University, China
- Guangdong Wens Foodstuff Group Co., Ltd, China
- China Agricultural University, China
- University of Guelph, Canada
- University of Hawaii at Manoa, United States
Figures
Figure 1 with 5 supplements
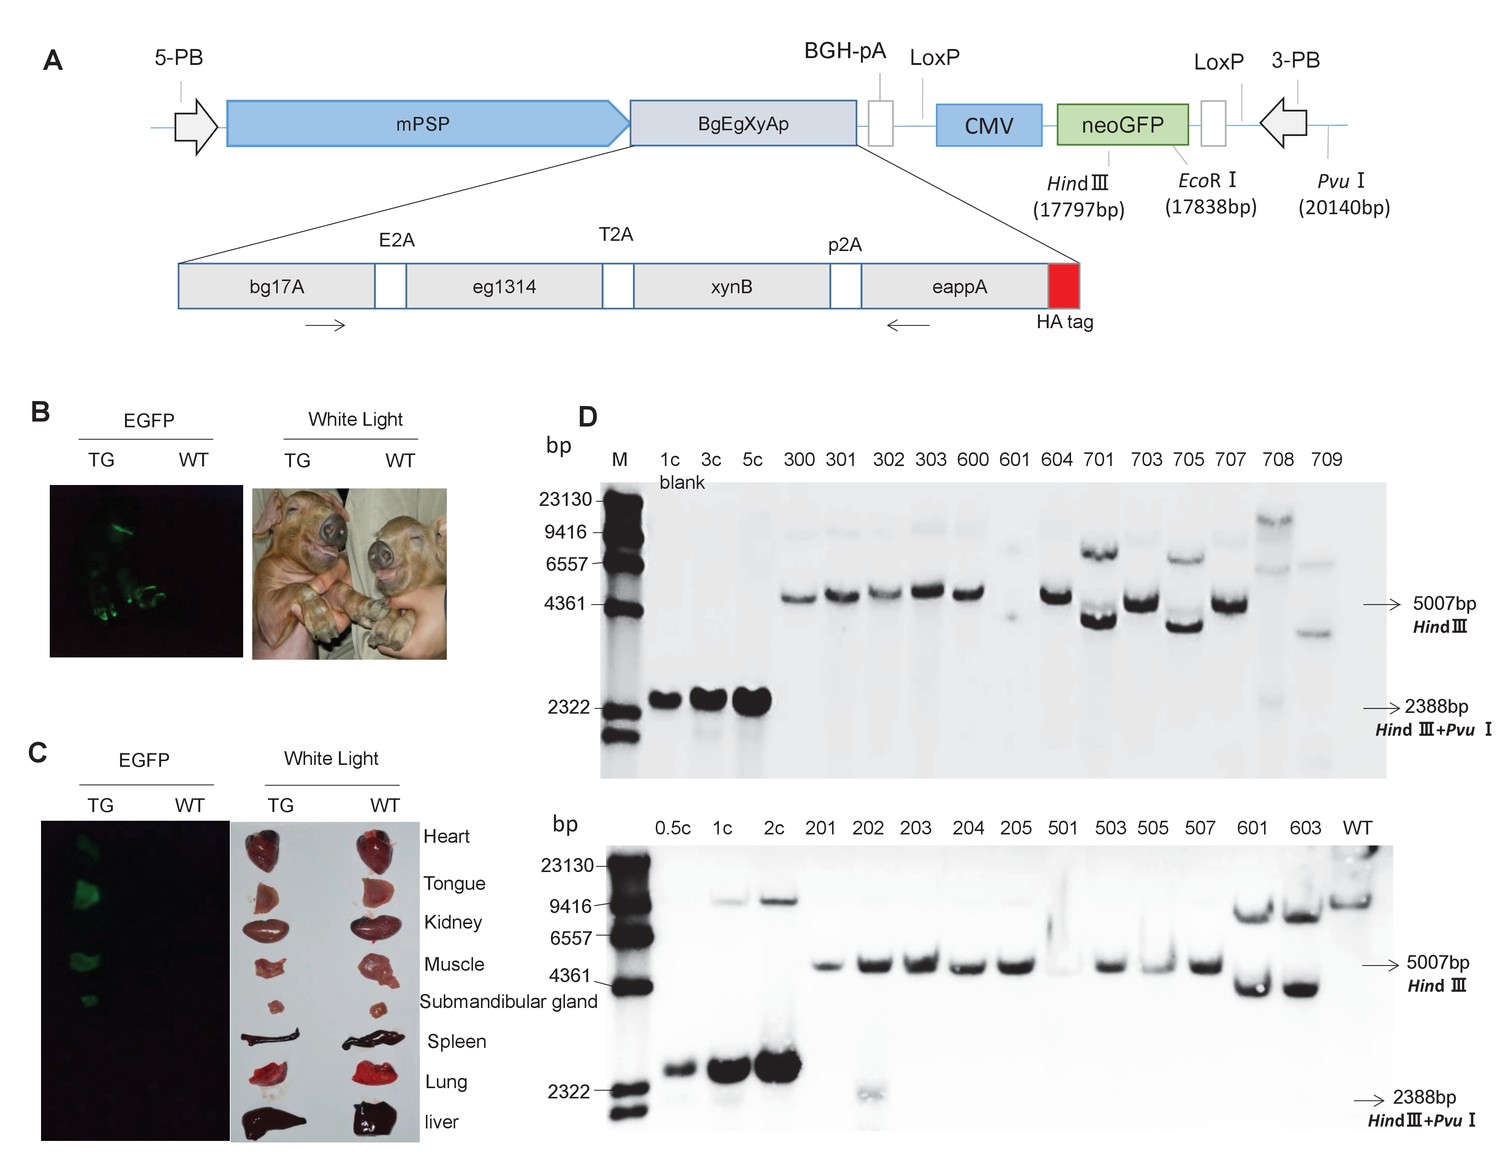
Presence of the transgene in TG pigs.
(A) DNA construct that was integrated into the pig genome for expression of the transgenic fusion enzyme in saliva. mPSP: Mouse parotid secretory protein promoter. BGH: Bovine growth hormone polyadenylation signal. Total length: 19,886 bp. (B) Expression of EGFP in the whole body of TG pigs. (C) Expression of EGFP in the heart, tongue, kidney, muscle, submandibular gland, spleen, lung, and liver of TG pigs. (D) Southern blot analysis of multi-enzyme transgene integration in TG pigs. 0.5 c, 1 c, 2 c, 3 c, and 5 c represent copy number of transgenic vector used as loading controls. The probe is shown in Figure 1A. Blank: Blank control (ddH2O).
Figure 1—figure supplement 1
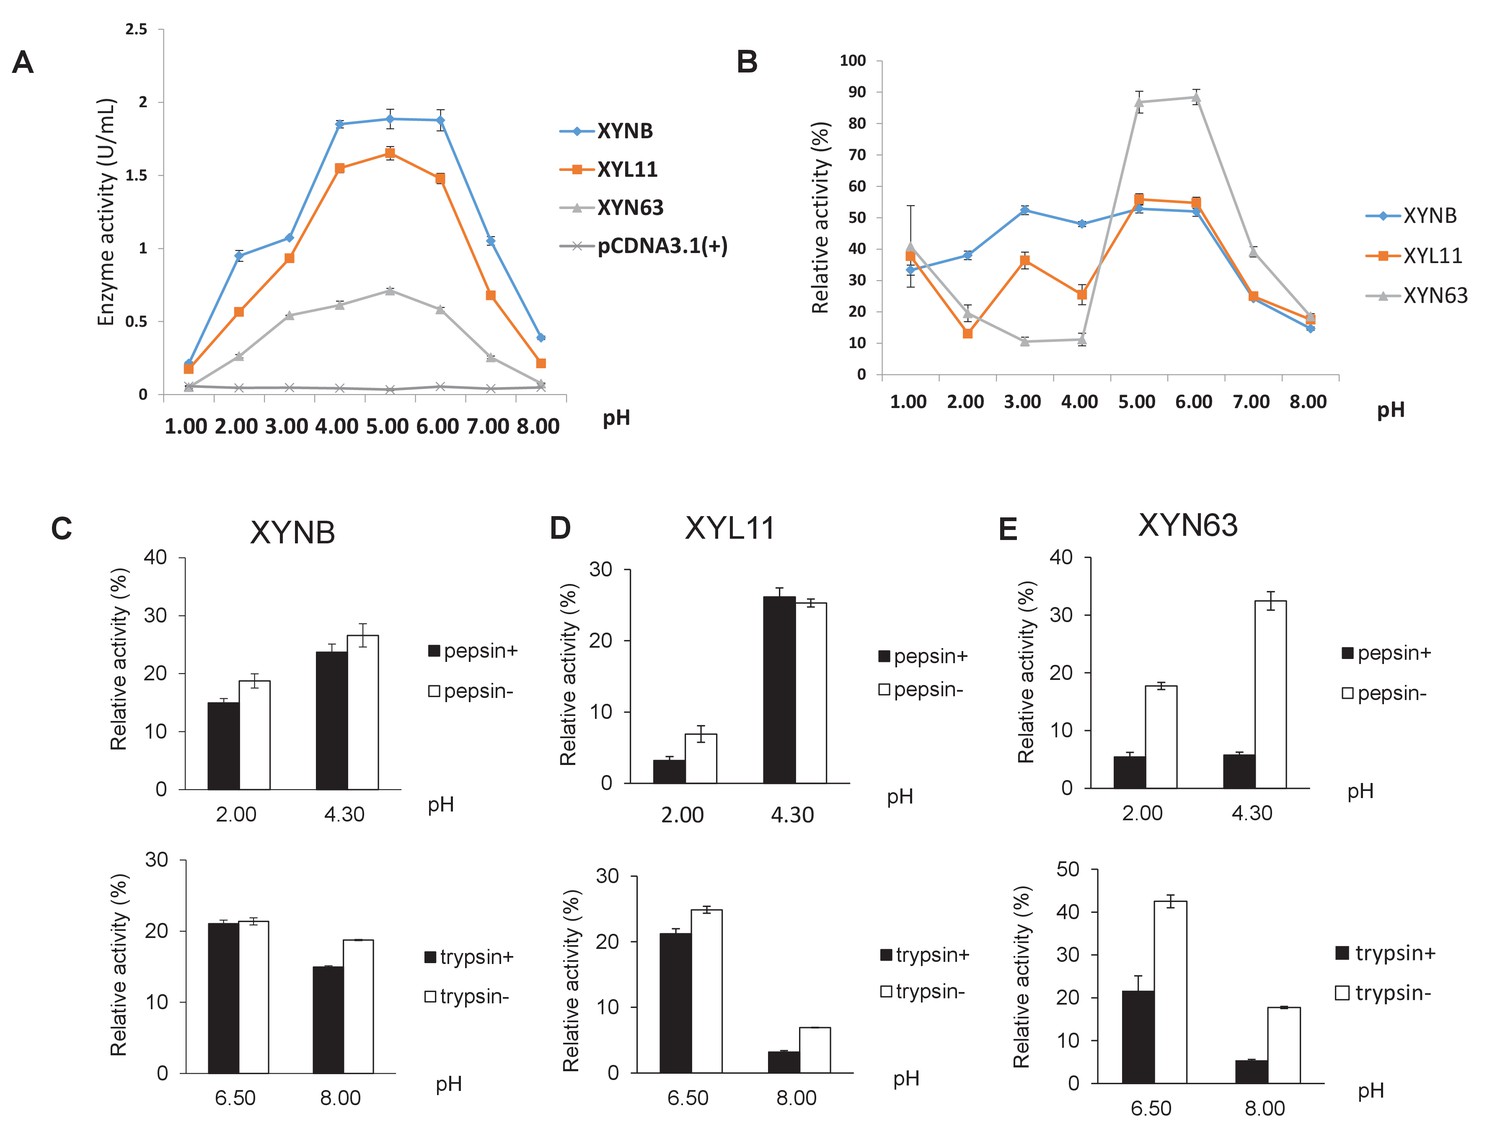
Characterization of three xylanases (XYNB, XYL11, and XYN63) expressed in the PK15 cells.
(A) Determination of the optimal pH for the activity of three xylanases. (B) The effect of pH on the stability of three xylanases. (C–E) The effects of pepsin and trypsin treatment on the stability of three xylanases. Data are expressed as the mean ±S.D. (n = 6).
Figure 1—figure supplement 2
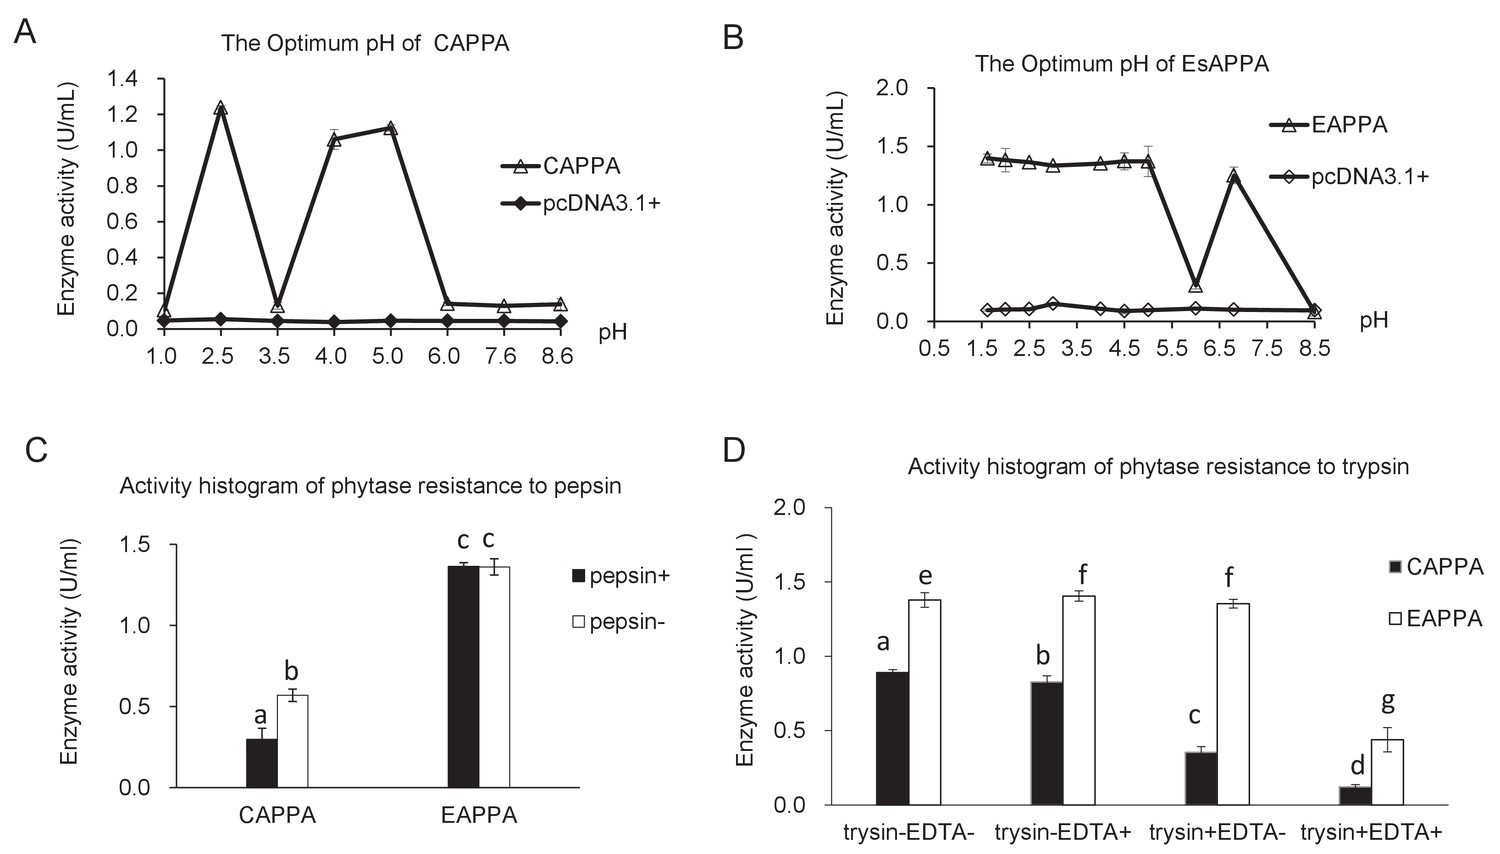
Characterization of two phytases (CAPPA and EAPPA) expressed in the PK15 cells.
(A) The optimal pH of CAPPA. (B) The optimal pH of EAPPA. (C) The effect of pepsin treatment on the stability of these two phytases. (D) The effect of trypsin treatment (with or without EDTA) on the stability of two phytases. Data are expressed as the mean ± S.D. (n = 3).
Figure 1—figure supplement 3

Construction of a BgEgXyAp polycistron and its enzymatic activity in PK15 cells.
(A) Vector construct for the expression of the BgEgXyAp fusion enzyme in PK15 cells. CMV: The promoters of cytomegaloviruses. BGH: Bovine growth hormone polyadenylation signal. (B) The relative expression level of each of the fusion enzymes compared to their respective monomeric enzyme in PK15 cells. The expression level of each monomeric enzyme is normalized to that of the corresponding fusion enzyme. (C) Difference in the activity of β-glucanase, xylanase, and phytase activity detected at the indicated pH between the fusion enzyme and monomeric enzyme in PK15 cells. The activity of each monomeric was normalized to that of the corresponding fusion enzyme. Mo: Monomeric enzyme. Re: Each recombinant enzyme of the fusion enzyme. Data are expressed as the mean ± S.D. (n = 3).
Figure 1—figure supplement 4
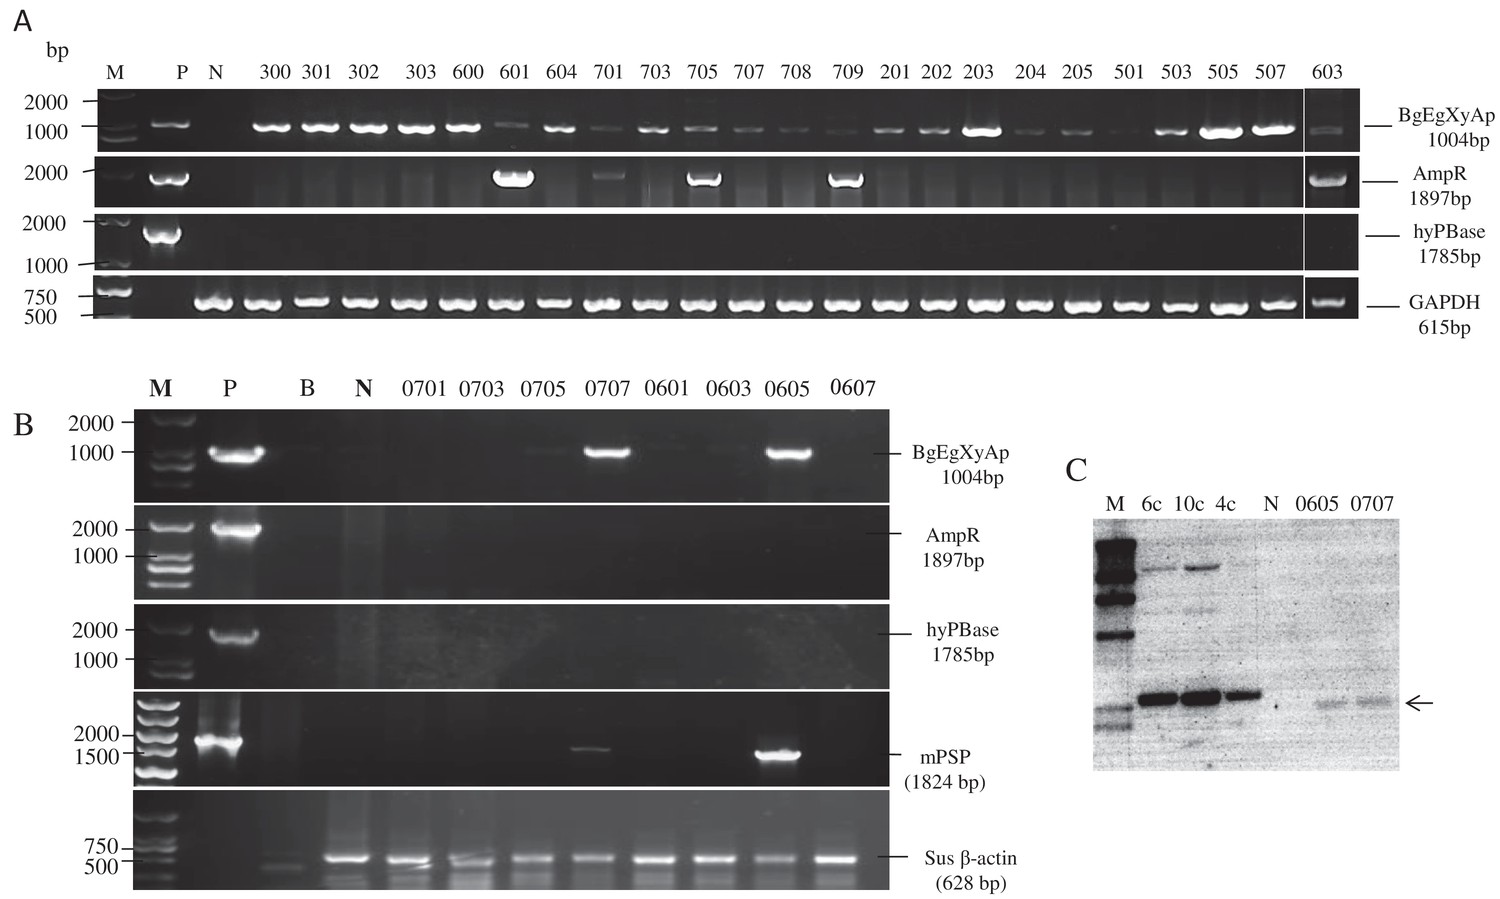
Genotyping analysis of founder TG pigs.
(A) and (B) PCR analysis of BgEgXyAp transgenic pig founders. AmpR: Ampicillin resistance gene in the TG vector. hyPBase: PiggyBac transposase gene. mPSP: Mouse parotid secretory protein promoter. B: Blank control (ddH2O). (C) Southern blotting analysis of the first batch of BgEgXyAp transgenic pig founders. M: Marker. 6 c, 10 c, and 4 c represent copy number of the transgenic vector that was used as loading control. N: negative control (genomic DNA of wild-type pig).
Figure 1—figure supplement 5

Determination of the linked transgene (BgEgXyAp) copy number in the transgenic (TG) founders vs wild (WT) pigs.
Blank: ddH2O. Primers for absolute quantitative real-time PCR: Eg1314-F/R, Data are expressed as the mean ± S.D. (3 ≤ n ≤ 9).
Figure 2 with 2 supplements
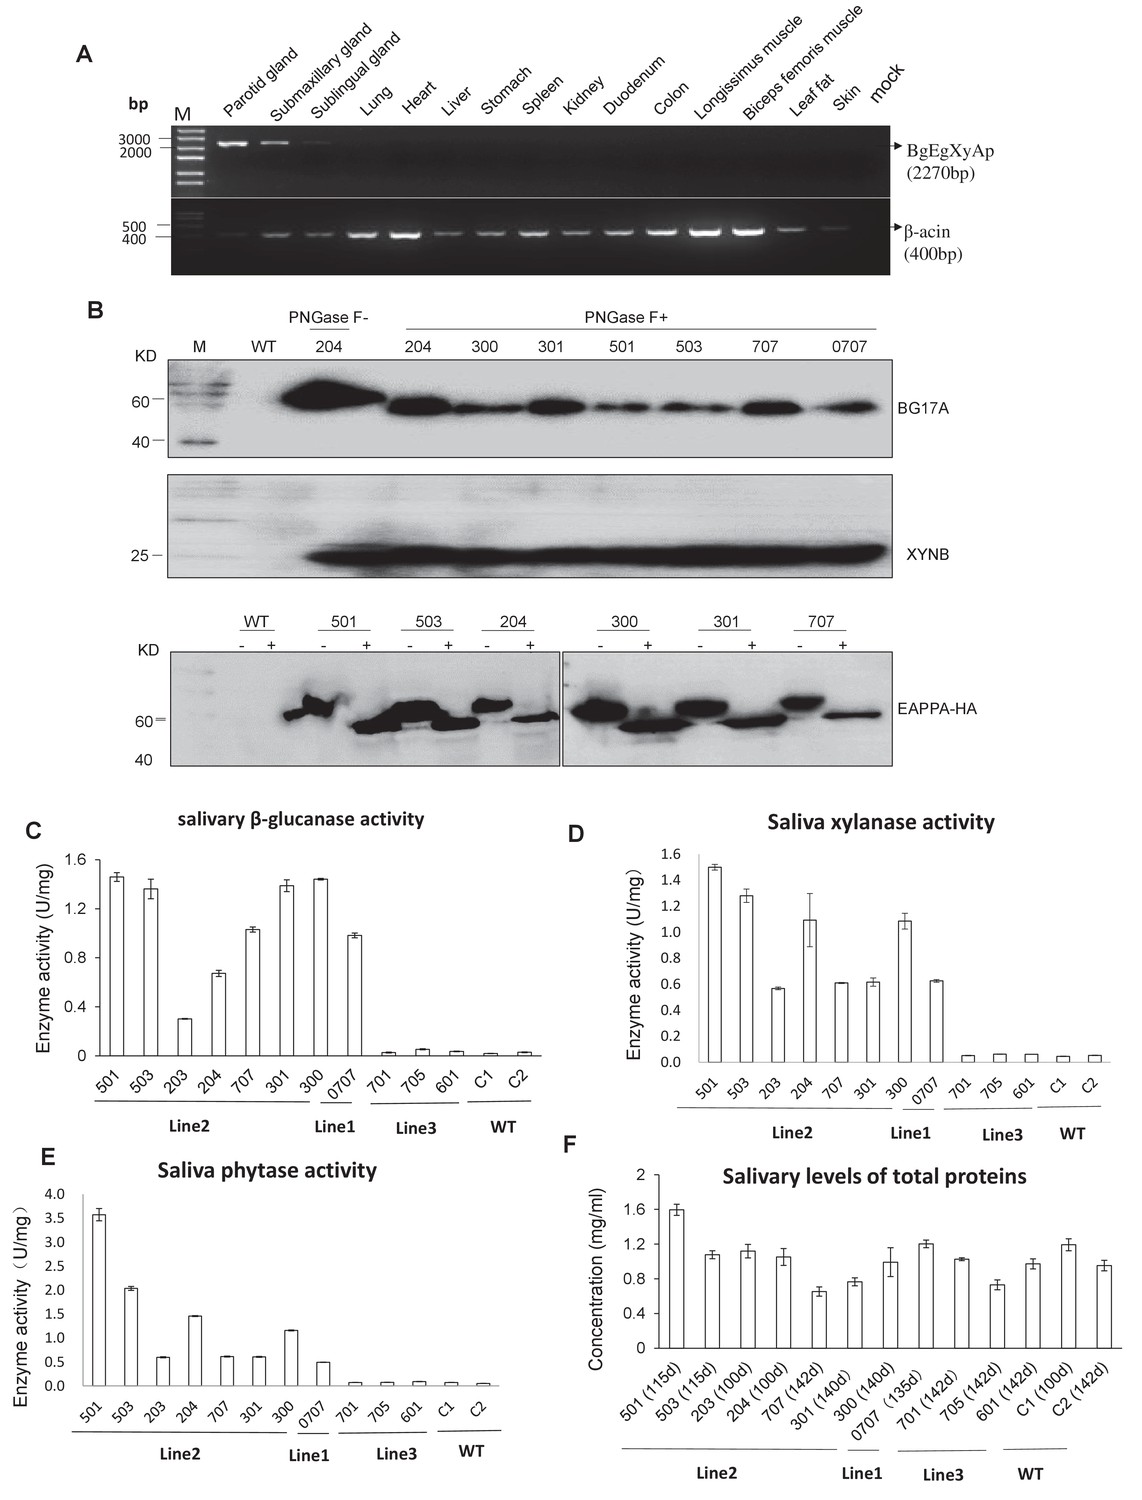
Expression and enzymatic activity of transgenes in TG pigs.
(A) RT-PCR assay for mRNA expression profiles of transgenes in different tissues. Forward primers and reverse primer are bound to the bg17A gene and eappA gene, respectively (arrows are shown in Figure 1A). Mock: Blank control (ddH2O). (B) Western blotting assay demonstrating the expression of BG17A, XYNB, and EAPPA in the saliva of TG pigs. Saliva samples were either incubated with PNGase F (+) or mock (-)-treated prior to western blotting to analyze the glycosylation status of the transgenic enzymes. PNGase F: Peptide N-glycosidase F. (C–E) Salivary β-glucanase, xylanase, and phytase activity assays of the TG pigs. (F) Concentration of total salivary protein of the TG and WT pigs. C1, C2: Age- and body weight-matched WT pigs. The data presented in the figure (C-E) can be found in Figure 2—source datas 1–4.
-
Figure 2—source data 1
Salivary β-glucanase activity assays of TG pigs.
- https://doi.org/10.7554/eLife.34286.012
-
Figure 2—source data 2
Salivary xylanase activity assays of TG pigs.
- https://doi.org/10.7554/eLife.34286.013
-
Figure 2—source data 3
Salivary phytase activity assays of TG pigs.
- https://doi.org/10.7554/eLife.34286.014
-
Figure 2—source data 4
Concentration of total salivary protein of TG and WT pigs.
- https://doi.org/10.7554/eLife.34286.015
Figure 2—figure supplement 1
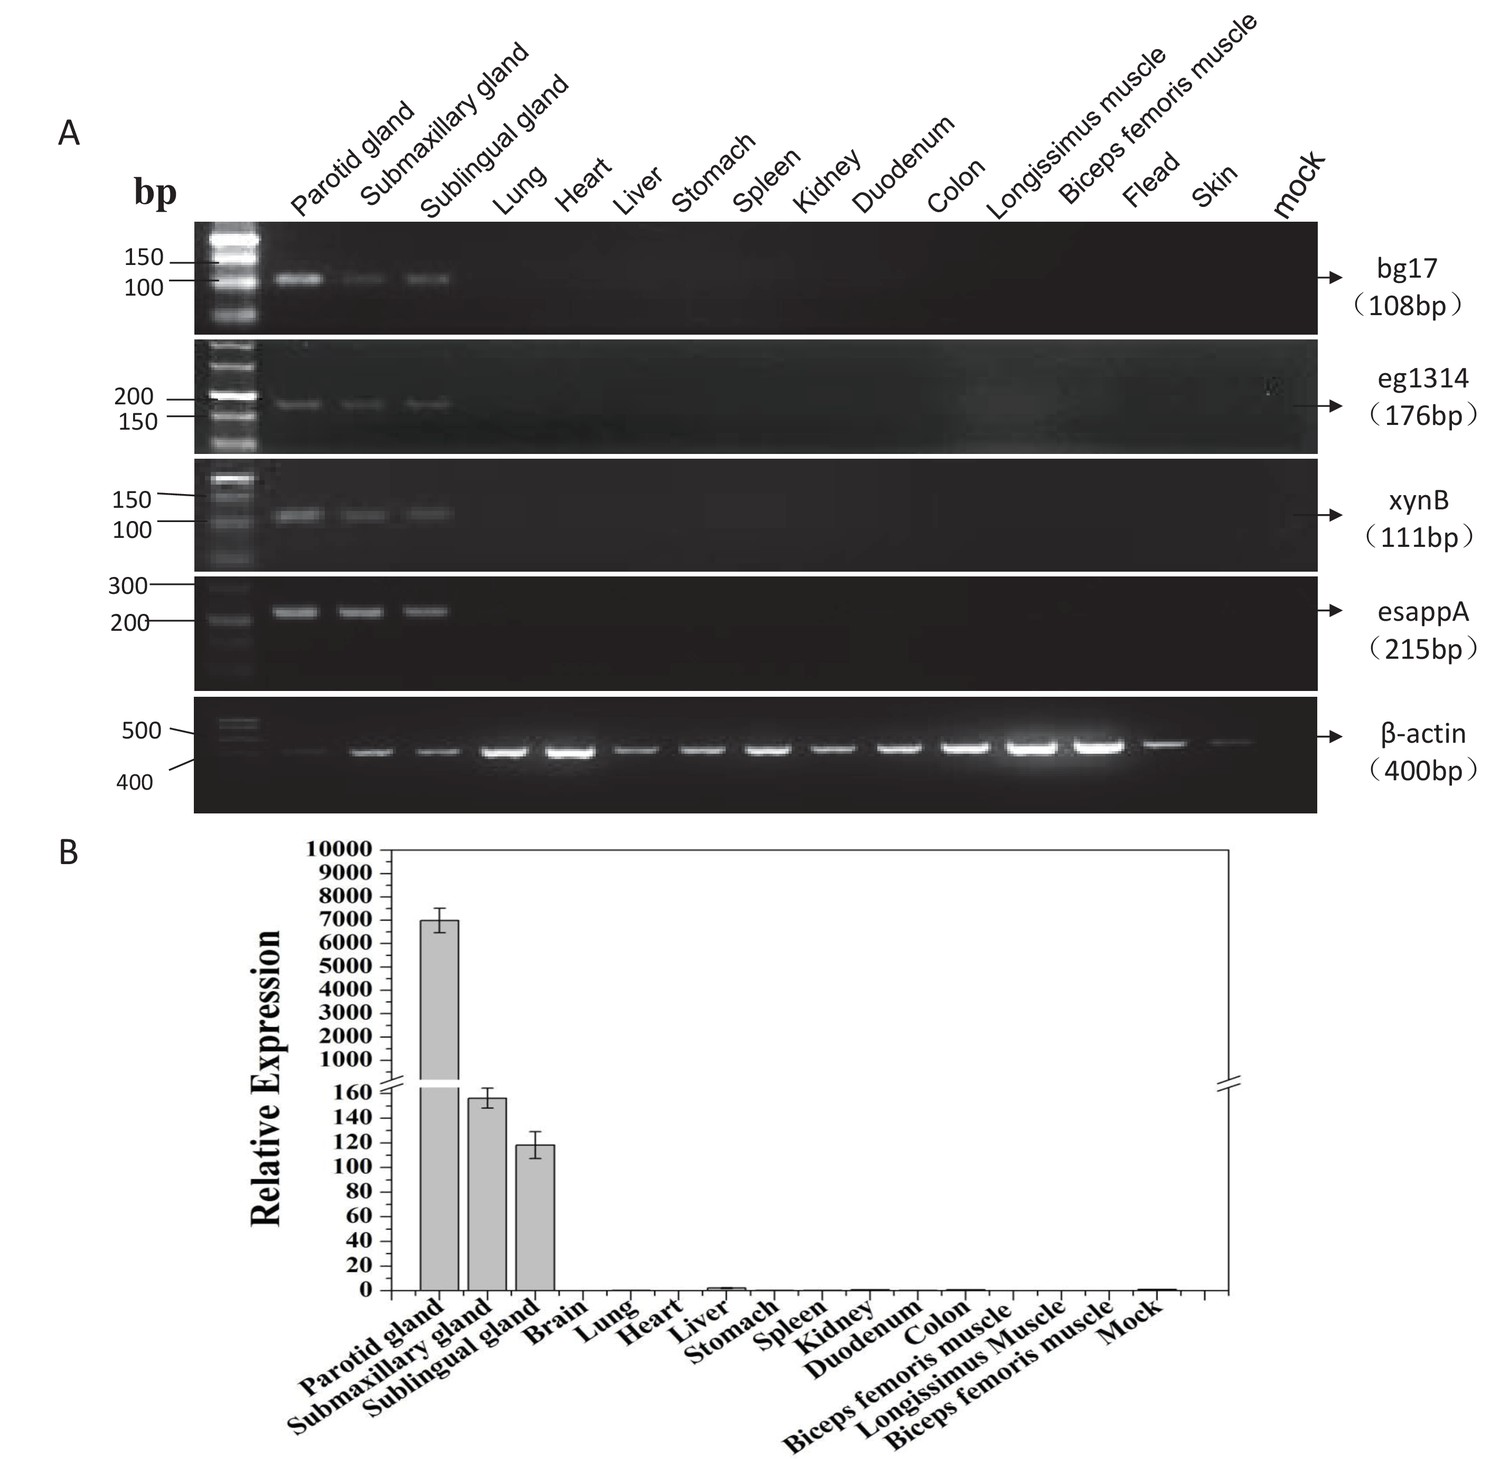
Assay for mRNA expression levels of the linked transgenes (BgEgXyAp) in different organs and tissues of transgenic founder pigs.
(A) RT-PCR assay for mRNA expression profiles of the transgene in different tissues. (B) Quantitative RT-PCR assay for mRNA expression levels of the linked transgenes (BgEgXyAp) in different organs and tissues of the transgenic founder pigs. Primers for relative quantitative real-time PCR: Eg1314-F/R; data are expressed as the mean ± S.D. (n = 6).
Figure 2—figure supplement 2
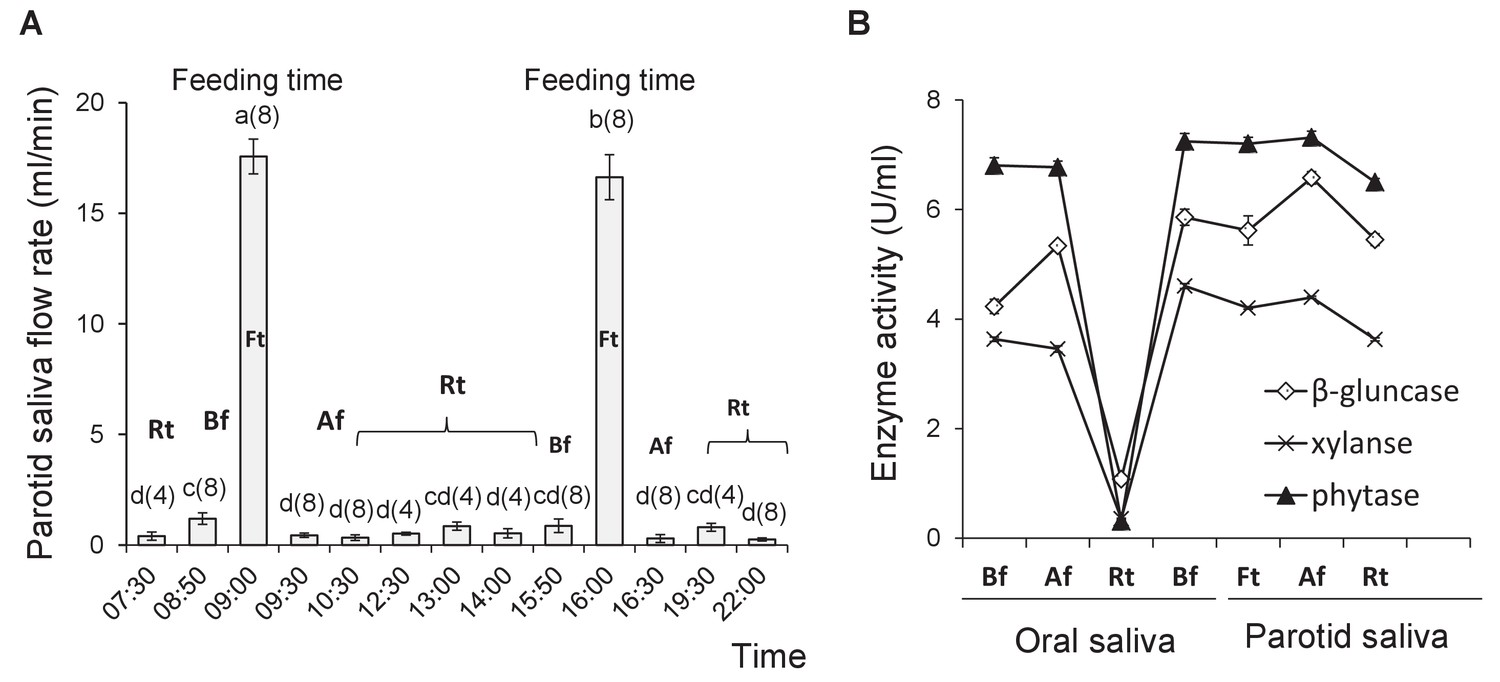
Characterization of transgenic (TG) (Line2) enzymes secreted in saliva.
(A) Pattern of salivary secretion from parotid gland at different time points. A–d, Data are expressed as the mean ± S.D. (4 ≤ n ≤ 8). Values at the top of the column with different superscript letters indicate statistically significant differences (one-way ANOVA, p<0.05). (B) TG enzyme production in oral and parotid saliva at different time points. Bf, before feeding; Af, after feeding; Rt, rest time; Ft: feeding time. Data are expressed as the mean ± S.D. (n = 6).
Figure 3
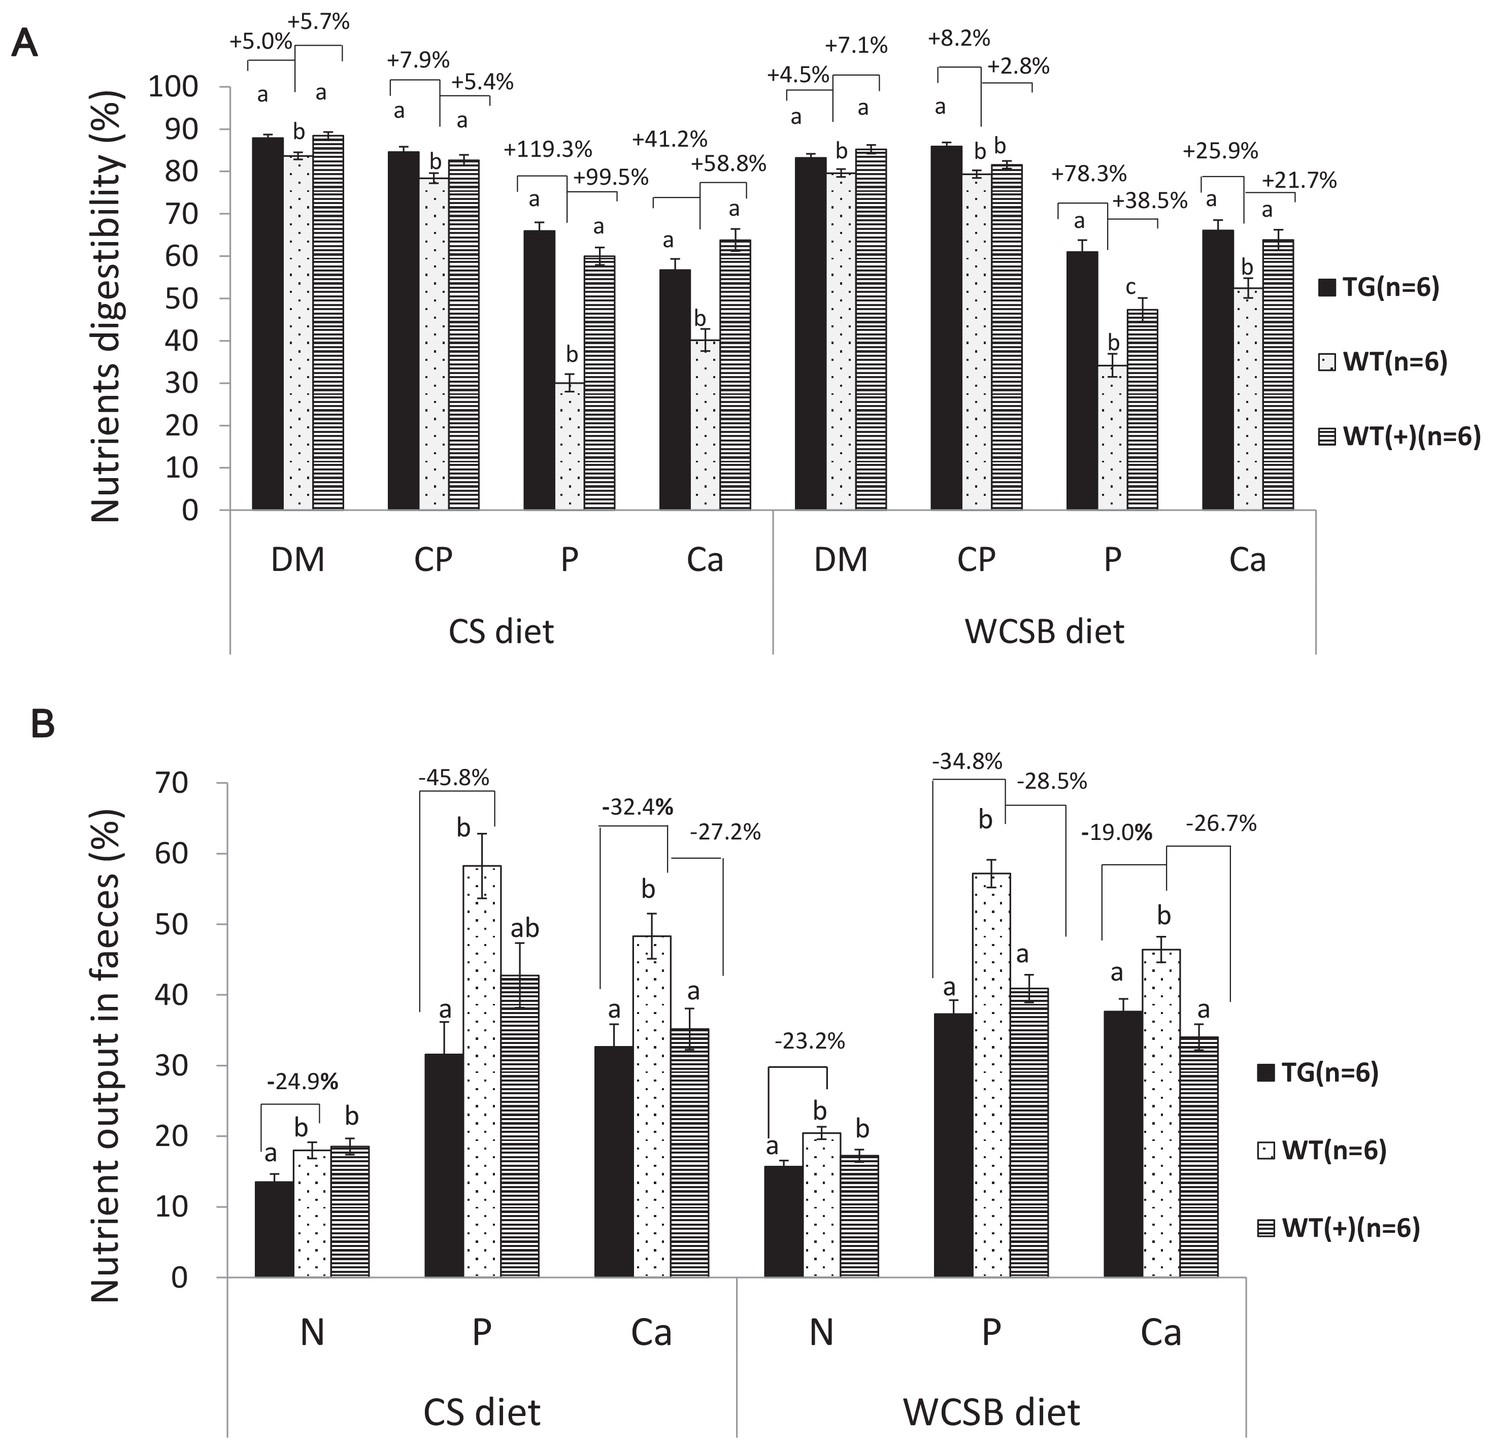
Comparison of the apparent total tract nutrient digestibility values (%) and fecal nutrient output (% of their dietary intake) between transgenic (TG) grower pigs (Line2) and their wild-type (WT) littermates fed on corn and soybean meal (CS) and wheat- and corn and soybean meal (WCSB)-based diets with and without exogenous feed enzymes.
(A) Comparison of the apparent total tract nutrient digestibility values (%) of dry matter (DM), crude protein (CP), phosphorus (P), and calcium (ca). (B) Comparison of fecal N, P, and Ca output. WT(+): WT grower pigs fed on the CS and WCSB diets supplemented with an optimal dose of β-glucanase, xylanase, and phytase. Data are expressed as the least square means (Lsmean ± SEM). a,b,c Values on the bar graph with different superscript letters differ significantly (ANCOVA, p<0.05). The source data are presented in Figure 3—source datas 1–6.
-
Figure 3—source data 1
Comparison of the apparent total tract nutrient digestibility values (%) of dry matter(DM), crude protein(CP), Phosphorus(P) and calcium(ca).
- https://doi.org/10.7554/eLife.34286.021
-
Figure 3—source data 2
Comparison of the apparent total tract nutrient digestibility values (%) between transgenic (TG) grower pigs and their wild-type (WT) littermates fed corn and soybean meal (CS diet).
- https://doi.org/10.7554/eLife.34286.022
-
Figure 3—source data 3
Comparison of the apparent total tract nutrient digestibility values (%) between transgenic (TG) grower pigs and their wild-type (WT) littermates fed wheat, corn and soybean meal (WCSB diet).
- https://doi.org/10.7554/eLife.34286.023
-
Figure 3—source data 4
Comparison of fecal N, fecal P and fecal Ca output.
- https://doi.org/10.7554/eLife.34286.024
-
Figure 3—source data 5
Source Data of fecal N, fecal P and fecal Ca output by transgenic (TG) grower pigs and their wild-type (WT) littermates fed corn and soybean meal (CS)based diets with and without exogenous feed enzymes.
- https://doi.org/10.7554/eLife.34286.025
-
Figure 3—source data 6
Source Data of fecal N, fecal P and fecal Ca output by transgenic (TG) grower pigs and their wild-type (WT) littermates fed wheat, corn and soybean meal (WCSB) based diets with and without exogenous feed enzymes.
- https://doi.org/10.7554/eLife.34286.026
Figure 4

Growth performance of F2 TG pigs (line2) and WT littermates during the growing period from 30 kg to 115 kg.
(A) Comparison of average daily feed intake (ADFI). (B) Comparison of average daily gain (ADG). (C) Comparison of feed/gain (F/G). (D) Comparison of days to market. Data are expressed as the least square means (Lsmean ± SEM), asterisks indicate significant differences between TG and WT pigs within one line (ANCOVA, **p<0.01). The source data are presented in Figure 4—source datas 1–3.
-
Figure 4—source data 1
Growth performance of F2 TG pigs (boars + gilts)and WT littermates during the growing period from 30 kg to 115 kg.
- https://doi.org/10.7554/eLife.34286.030
-
Figure 4—source data 2
Growth performance of F2 TG and WT boars during the growing period from 30 kg to 115 kg.
- https://doi.org/10.7554/eLife.34286.031
-
Figure 4—source data 3
Growth performance of F2 TG and WT gilts during the growing period from 30 kg to 115 kg.
- https://doi.org/10.7554/eLife.34286.032
Tables
Table 1
Salivary secretion and the transgene enzyme activities from the unilateral parotid gland of transgenic (TG) pigs (Line2) during the grower (92–96 days old; estimated body weight: 42–45 kg) and finisher (159–191 days old; estimated body weight: 100–115 kg) phases of growth.
https://doi.org/10.7554/eLife.34286.016| Item | Growth stages | Pooled SEM | P values | ||
|---|---|---|---|---|---|
| Grower | Finisher | ||||
| Saliva secreted * Saliva secretion rate (mL/min·pig) | |||||
| 8.48 | 16.97** | 0.25 | <0.0001 | ||
| Saliva secretion volume (mL/kg diet consumed) | 407.66** | 151.70 | 5.33 | <0.0001 | |
| Enzymes activity secreted (U/mL saliva)† | |||||
| β-glucanase | 5.72 | 6.07** | 0.05 | <0.0001 | |
| Xylanase | 5.92 | 6.19** | 0.05 | 0.0005 | |
| Phytase | 7.2 | 6.87 | 0.14 | 0.1033 | |
| Enzyme activity secreted (U/kg diet consumed)† | |||||
| β-glucanase | 2,331.84** | 920.82 | 30.7 | <0.0001 | |
| Xylanase | 2,413.38** | 939.03 | 31.73 | <0.0001 | |
| Phytase | 2,935.19** | 1,042.19 | 38.29 | <0.0001 | |
-
*Saliva samples were collected daily from two transgenic growing pigs and two transgenic finishing pigs at 9:00 and 16:00, respectively, over the four-day period. Values are expressed as the mean and pooled SEM (n = 16 repeated sampling and measurements).
†Means and pooled SEM (n = 16) repeated sampling and measurements). Asterisks indicate significant differences between the grower and the finisher phases within the same row (Unpaired t-test, **p<0.01).
-
Table 1–Source data 1
Salivary secretion from the unilateral parotid gland in the growing transgenic (TG) pigs and wild type (WT) pigs during the grower phase (92–96 days old; estimated body weight of 42–45 kg).
- https://doi.org/10.7554/eLife.34286.017
-
Table 1–Source data 2
Salivary secretion from the unilateral parotid gland in the transgenic (TG) pigs during the finisher phase (159–191 days old; estimated body weight of 100–115 kg).
- https://doi.org/10.7554/eLife.34286.018
-
Table 1–Source data 3
The transgene enzyme activities from the unilateral parotid gland in the transgenic (TG) pigs during the grower (92–96 days old; estimated body weight of 42–45 kg) and the finisher phases (159–191 days old; estimated body weight of 100–115 kg).
- https://doi.org/10.7554/eLife.34286.019
Table 2
Comparison of the serum biochemical endpoints in the F1 transgenic (TG) grower gilts (Line2) and the wild-type (WT) gilts (50 kg) fed on the LNHP diet in Supplementary file 5.
https://doi.org/10.7554/eLife.34286.027| Serum component | TG (n = 10) | WT (n = 22) | Pooled SEM | P value |
|---|---|---|---|---|
| Alkaline phosphatase (U/L) | 84.90** | 155.72 | 12.38 | <0.01 |
| Total phosphorus (Pi) (mmol/L) | 3.05** | 2.09 | 0.13 | <0.01 |
| Total calcium (Ca) (mmol/L) | 2.53 | 2.48 | 5.51 | 0.52 |
| Urea N (mmol/L) | 3.27 | 3.78 | 0.39 | 0.39 |
| Glucose (mmol/L) | 4.97** | 3.78 | 0.21 | <0.01 |
| Uric acid (µmol/L) | 6.30 | 7.45 | 0.54 | 0.13 |
| D-Xylose (mmol/L) | 0.39 | 0.35 | 0.01 | 0.07 |
| Total protein (g/L) | 59.87 | 56.55 | 2.16 | 0.35 |
| Zn (µmol/L) | 4.12 | 5.23 | 0.82 | 0.42 |
-
Samples were collected at the end of the experiment.Asterisks (**) indicate significant differences at p<0.01 (unpaired t-test) between TG and WT pigs within the same row.
-
Table 2–Source data 1
Comparison of the serum biochemical composition in the F1 transgenic (TG) grower gilts and the wild-type (WT) gilts (50 kg) fed the low non-starch polysaccharide (NSP) diet.
- https://doi.org/10.7554/eLife.34286.028
Additional files
-
Supplementary file 1
Integration site analysis of the TG pigs
- https://doi.org/10.7554/eLife.34286.033
-
Supplementary file 2
Ingredients and nutrient composition of corn-cottonseed meal-rapeseed meal-soybean meal-based (CS) and wheat-corn-soybean meal-based (WCSB) diets for examining the efficiency of nutrient utilization in transgenic grower pigs (weight range: 35–54 kg)
- https://doi.org/10.7554/eLife.34286.034
-
Supplementary file 3
Comparison of the apparent total tract nutrient digestibility values (%) between transgenic (TG) grower pigs (Line2) and their wild-type (WT) littermates fed on corn and soybean meal (CS)- and wheat, corn, and soybean meal (WCSB)- based diets with and without exogenous feed enzymes.
- https://doi.org/10.7554/eLife.34286.035
-
Supplementary file 4
Comparison of efficiency of dietary nitrogen (N), phosphorus (P), and calcium (Ca) retention (% of their dietary intake) between transgenic (TG) grower pigs (Line2) and their wild-type (WT) littermates fed on the CS and corn-soybean (CS) or wheat-corn-soybean-bran (WCSB) diets with and without exogenous feed enzymes.
- https://doi.org/10.7554/eLife.34286.036
-
Supplementary file 5
Ingredients and nutrient composition of the low nitrogen level and high proportion of phytate (78.4%) (LNHP) diet used to assess growth performances of the F1 transgenic (TG) grower gilts and the wild-type (WT) grower gilts (weight range: 30–50 kg).
- https://doi.org/10.7554/eLife.34286.037
-
Supplementary file 6
Comparison of the growth performances of the F1 transgenic (TG) gilts (Line2) and the wild-type (WT) gilts fed on a low non-starch polysaccharide (NSP) diet during the growing period (weight range: 30–50 kg)
- https://doi.org/10.7554/eLife.34286.038
-
Supplementary file 7
Ingredients and nutrient composition of the experimental diets that were formulated to determine the growth performance of the F2 transgenic (TG) grower-finisher pigs
- https://doi.org/10.7554/eLife.34286.039
-
Supplementary file 8
Primers used in PCR and probes in southern blotting
- https://doi.org/10.7554/eLife.34286.040
-
Supplementary file 9
Primers used in reverse transcription PCR, quantitative real-time PCR, and absolute quantitative real-time PCR
- https://doi.org/10.7554/eLife.34286.041
-
Supplementary file 10
Antibody used in western blotting
- https://doi.org/10.7554/eLife.34286.042
-
Supplementary file 11
Efficiency of piggyBac-mediated transgenisis to produce single-copy quad-cistronic transgenic pigs
- https://doi.org/10.7554/eLife.34286.043
-
Transparent reporting form
- https://doi.org/10.7554/eLife.34286.044
Download links
A two-part list of links to download the article, or parts of the article, in various formats.
Downloads (link to download the article as PDF)
Open citations (links to open the citations from this article in various online reference manager services)
Cite this article (links to download the citations from this article in formats compatible with various reference manager tools)
Novel transgenic pigs with enhanced growth and reduced environmental impact
eLife 7:e34286.
https://doi.org/10.7554/eLife.34286


