VEGF-C promotes the development of lymphatics in bone and bone loss
- UT Southwestern Medical Center, United States
- Texas A&M College of Dentistry, United States
- Eli Lilly and Company, United States
- Texas A&M College of Medicine, United States
- University of Helsinki, Finland
Figures
Figure 1 with 4 supplements
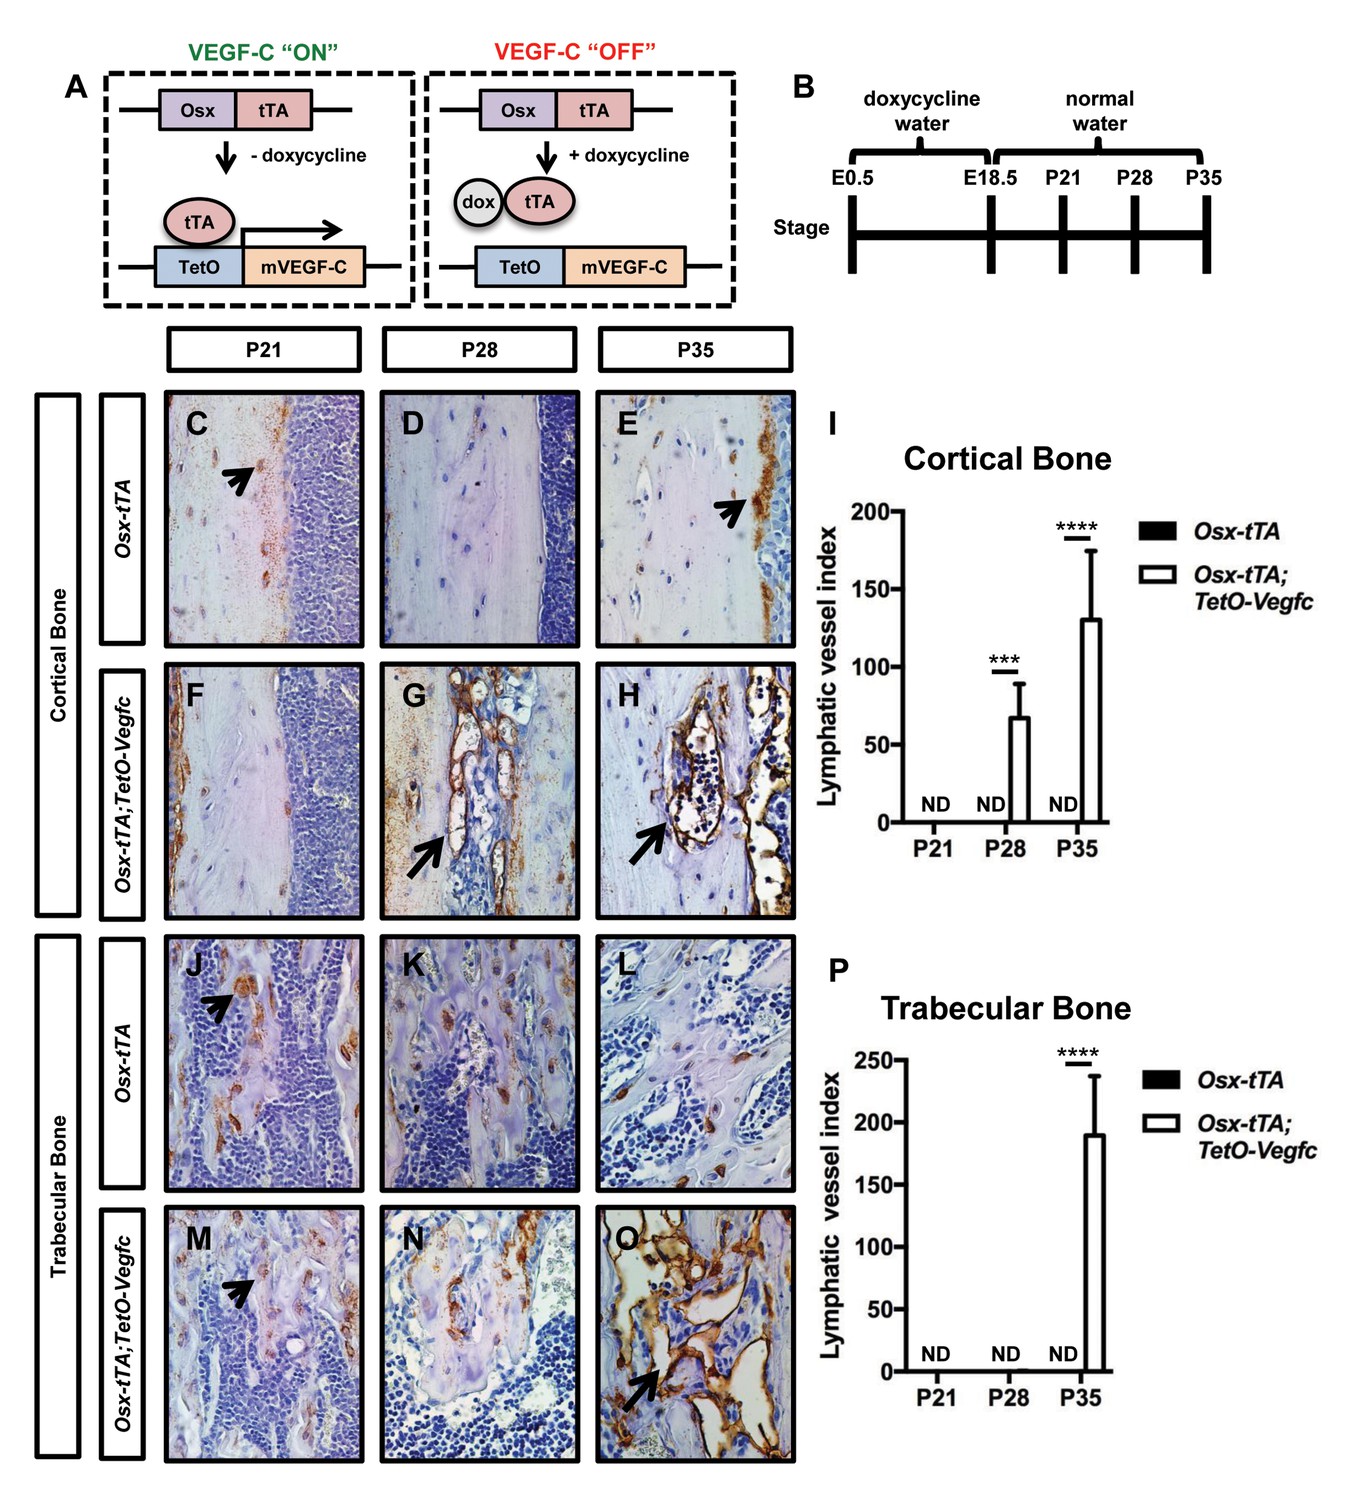
Osx-tTA;TetO-Vegfc mice develop lymphatics in their bones.
(A) Schematic of the Tet-Off system used to express VEGF-C in bone. Doxycycline inhibits the expression of VEGF-C. (B) Schematic showing when mice received normal water and doxycycline water. Osx-tTA and Osx-tTA;TetO-Vegfc mice received doxycycline water from E0.5 to E18.5 and then normal water from E18.5 to P35. (C–H) Representative images of cortical bone in Osx-tTA and Osx-tTA;TetO-Vegfc femurs. Sections were stained with an anti-podoplanin antibody. Arrowheads point to podoplanin-positive osteocytes. Arrows point to podoplanin-positive lymphatics. (I) Graph showing lymphatic vessel index values for cortical bone in P21 (0 ± 0.0; n = 3), P28 (0 ± 0.0; n = 5), and P35 (0 ± 0.0; n = 6) Osx-tTA mice and in P21 (0 ± 0.0; n = 4), P28 (67 ± 22.06; n = 4), and P35 (130.3 ± 44.35; n = 4) Osx-tTA;TetO-Vegfc mice. (J–O) Representative images of trabecular bone in Osx-tTA and Osx-tTA;TetO-Vegfc femurs. Sections were stained with an anti-podoplanin antibody. Arrowheads point to podoplanin-positive osteocytes. Arrow points to podoplanin-positive lymphatics. (P) Graph showing lymphatic vessel index values for trabecular bone in P21 (0 ± 0.0; n = 3), P28 (0 ± 0.0; n = 5), and P35 (0 ± 0.0; n = 6) Osx-tTA mice and P21 (0 ± 0.0; n = 4), P28 (0.167 ± 0.4082; n = 6), and P35 (189.5 ± 47.7; n = 4) Osx-tTA;TetO-Vegfc mice. (***p<0.001, ****p<0.0001, unpaired student’s T-test). ND = Not Detected.
Figure 1—figure supplement 1
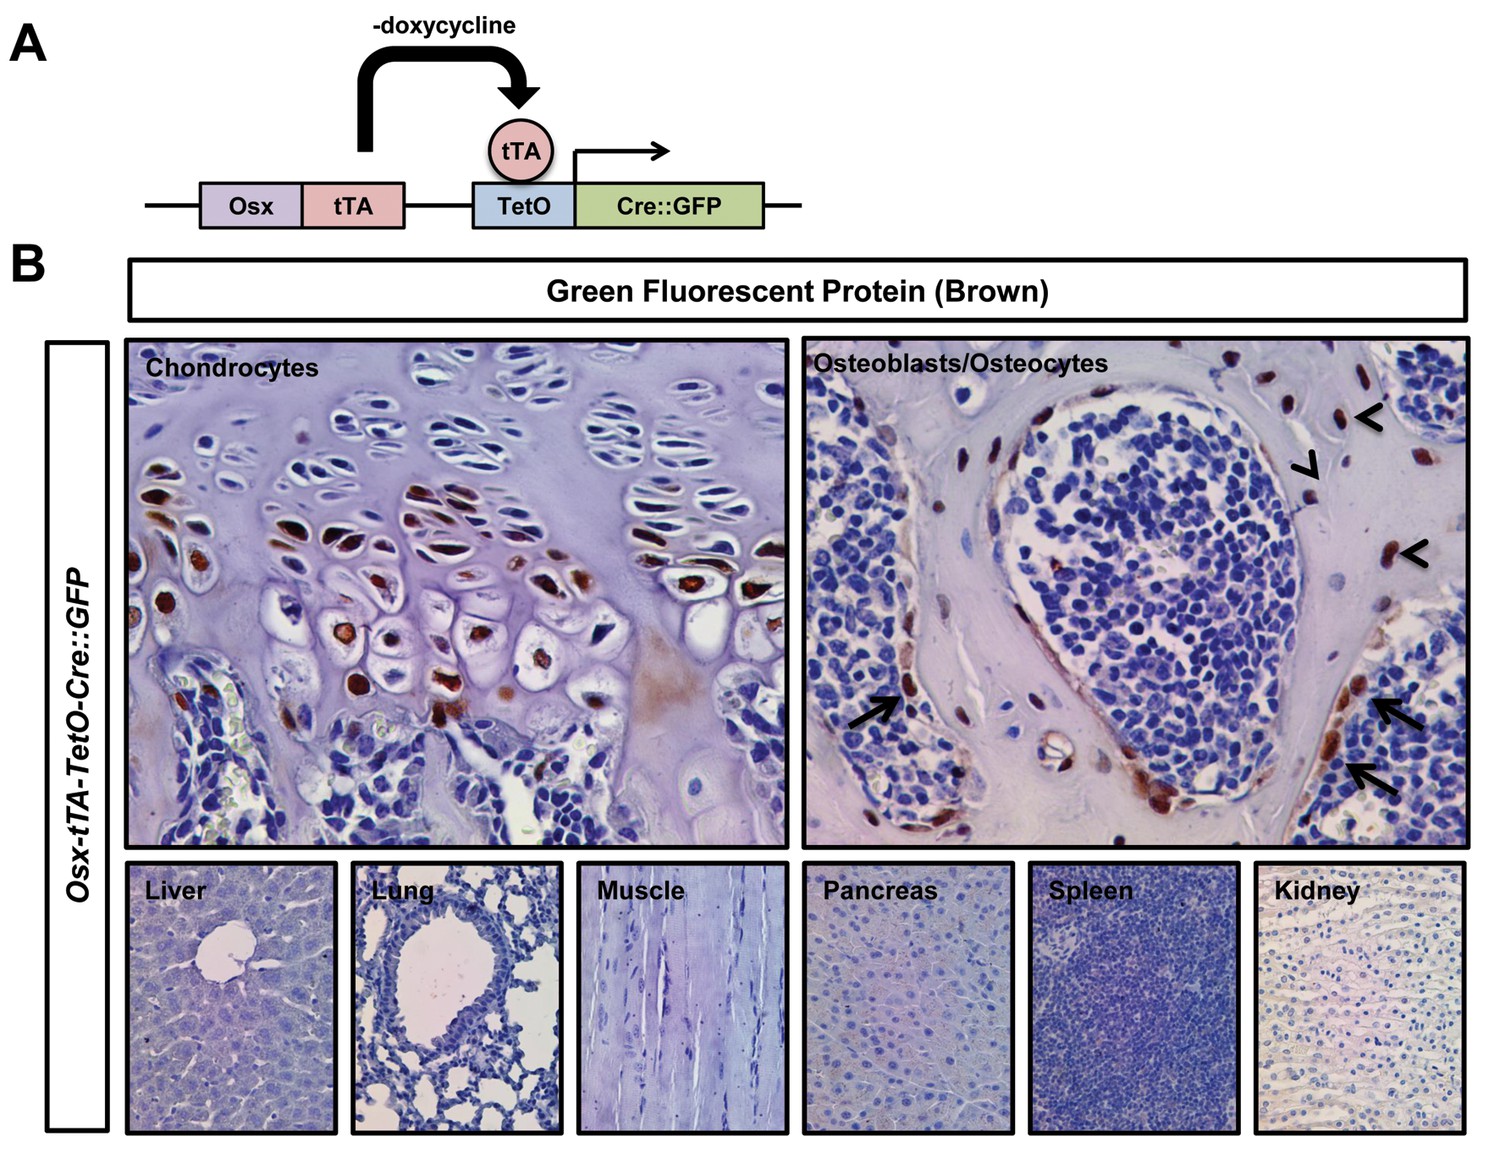
Expression pattern of GFP in Osx-tTA-TetO-tTA-Cre::GFP mice.
(A) Schematic of the Osx-tTA-TetO-tTA-Cre::GFP cassette. When doxycycline is absent, tetracycline transactivator (tTA) induces the expression of a Cre::GFP fusion protein. (B) Representative images of tissues stained with an anti-GFP antibody. Tissues were collected from P35 Osx-tTA-TetO-tTA-Cre::GFP mice that were maintained on normal water. Chondrocytes, osteocytes (arrowheads), and osteoblasts (arrows) expressed GFP. Cells in the liver, lung, muscle, pancreas, spleen, and kidney did not express GFP.
Figure 1—figure supplement 2
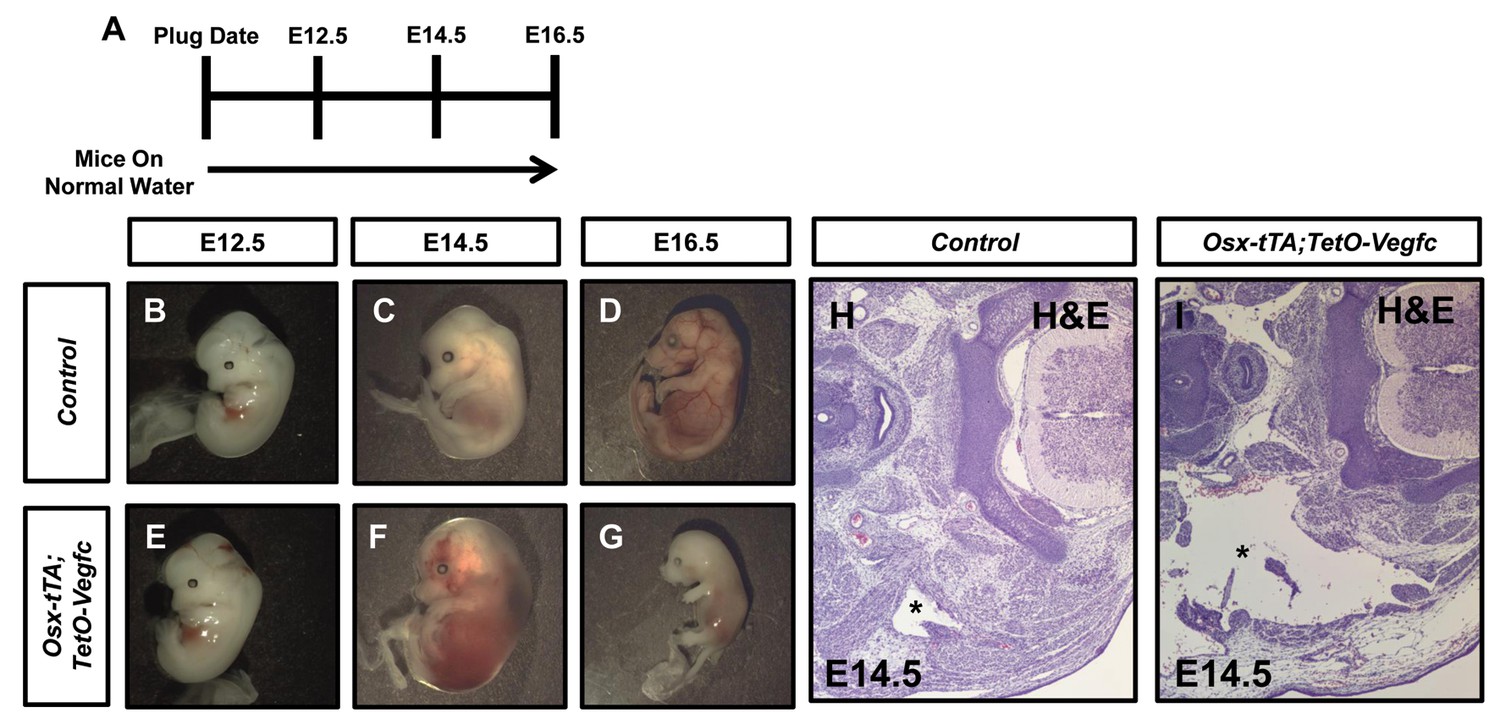
Expression of VEGF-C during embryonic development causes embryonic lethality.
(A) Schematic showing when mice received normal water. (B–C) Representative images of E12.5, E14.5 and E16.5 control embryos. (E–G) Representative images of E12.5, E14.5 and E16.5 Osx-tTA;TetO-Vegfc embryos. (H,I) Transverse sections of E14.5 embryos stained with hematoxylin and eosin. The jugular lymph sac (asterisk) in the control embryo appears normal. In contrast, the jugular lymph sac (asterisk) in the Osx-tTA;TetO-Vegfc embryo is enlarged.
Figure 1—figure supplement 3
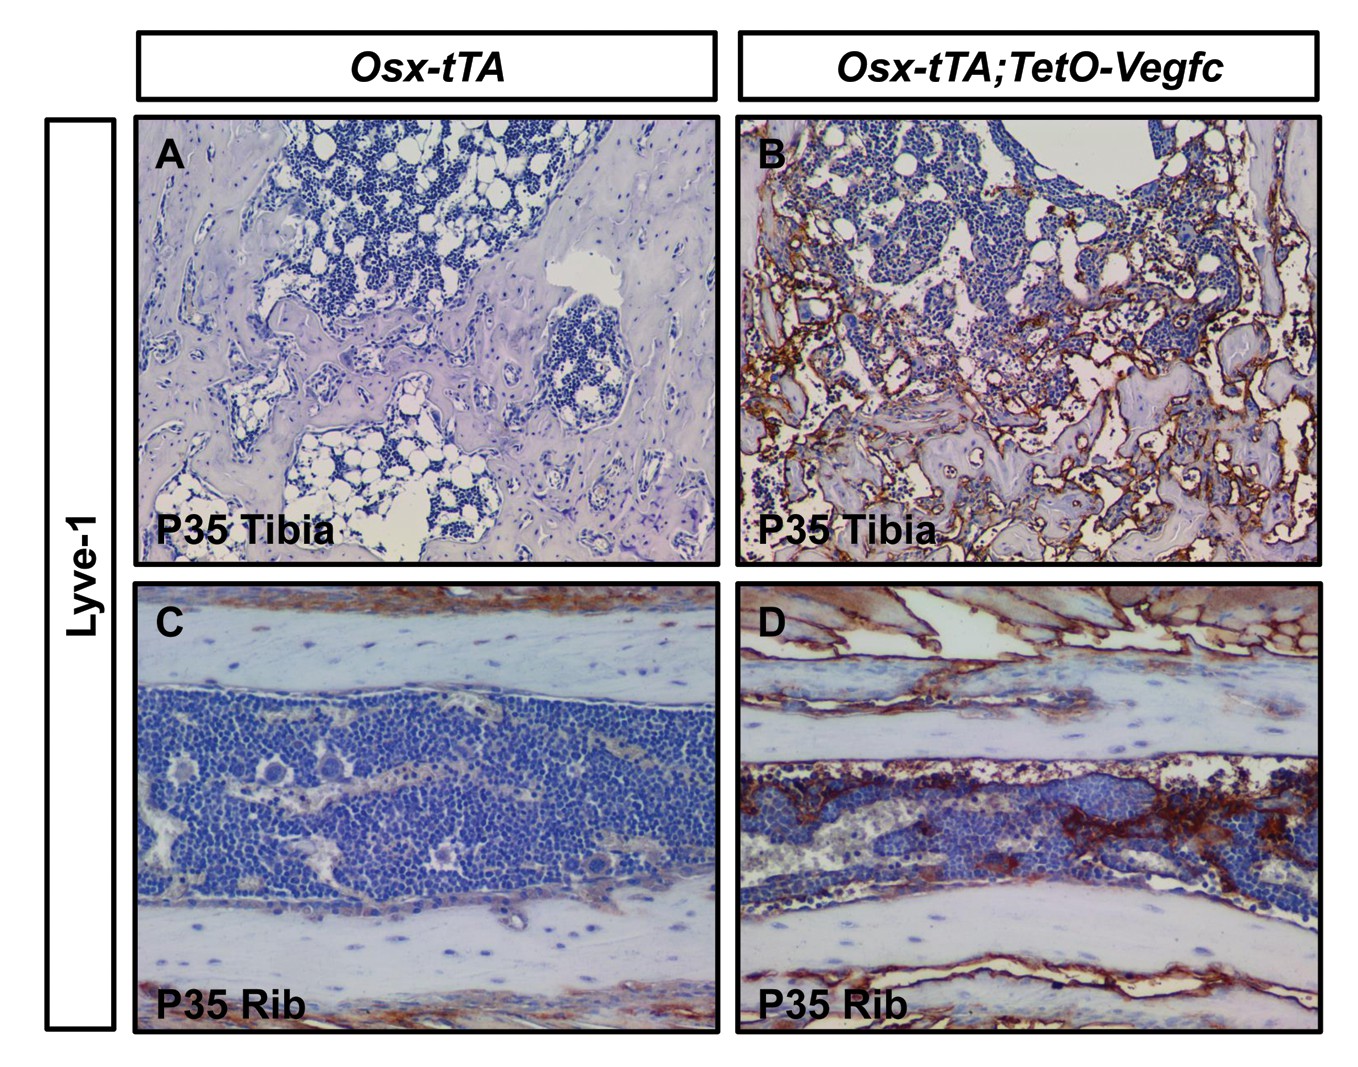
Bone lymphatics express Lyve-1.
(A) No Lyve-1-positive cells are in tibias from P35 Osx-tTA mice. (B) Numerous Lyve-1-positive lymphatics are in tibias from P35 Osx-tTA;TetO-Vegfc mice. (C) No Lyve-1-positive cells are in ribs from P35 Osx-tTA mice. (D) Numerous Lyve-1-positive lymphatics are in ribs from P35 Osx-tTA;TetO-Vegfc mice.
Figure 1—figure supplement 4
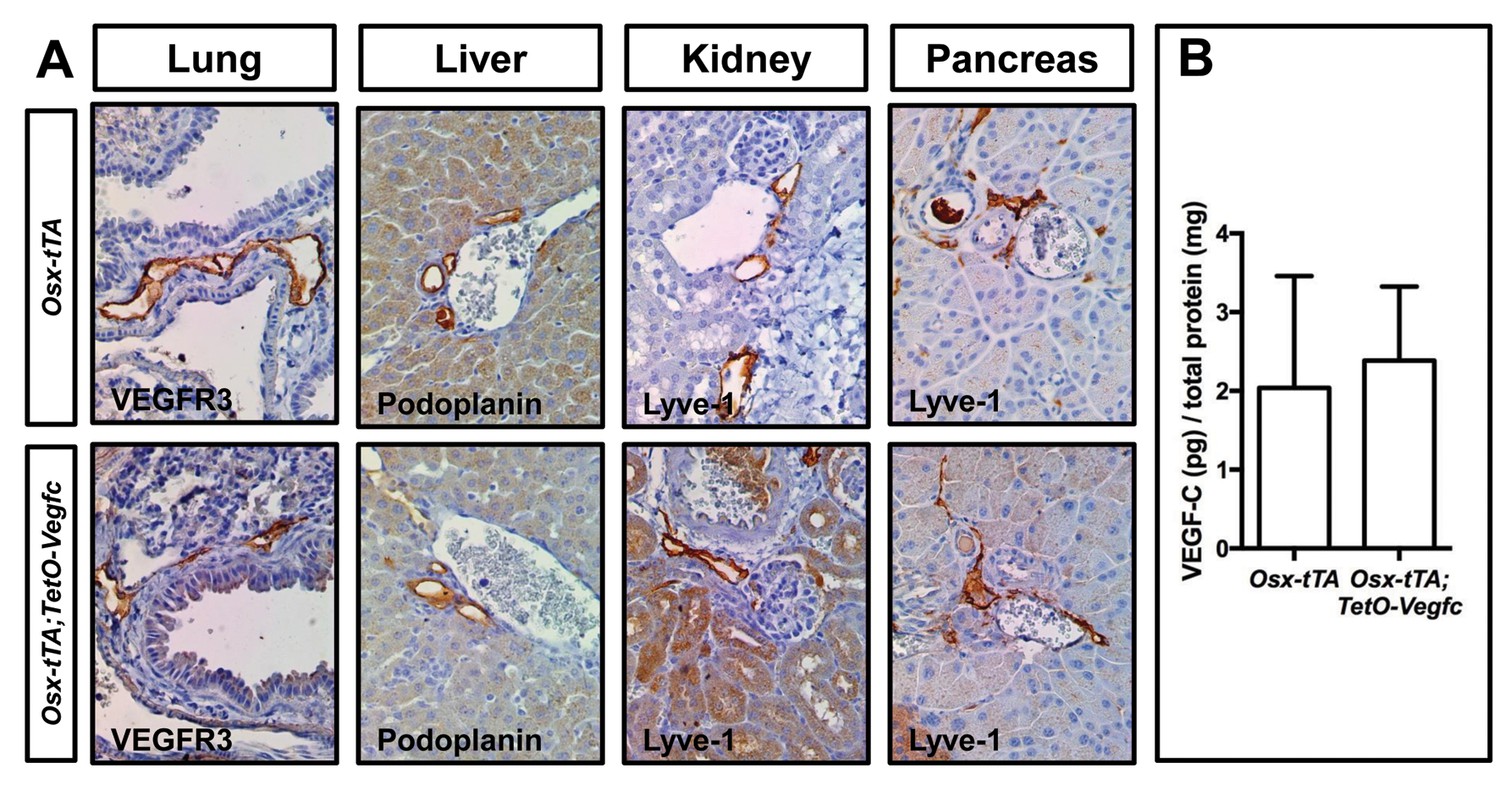
Lymphatics in soft tissues in Osx-tTA;TetO-Vegfc mice appear normal.
(A) Representative pictures of tissues collected from P35 Osx-tTA and Osx-tTA;TetO-Vegfc mice. Lymphatics in the lung, liver, kidney, and pancreas appeared normal in Osx-tTA;TetO-Vegfc mice. (B) Graph showing the circulating level of VEGF-C in P35 Osx-tTA (2.04 ± 1.42, n = 8) and Osx-tTA;TetO-Vegfc (2.387 ± 0.94, n = 7) mice.
Figure 2
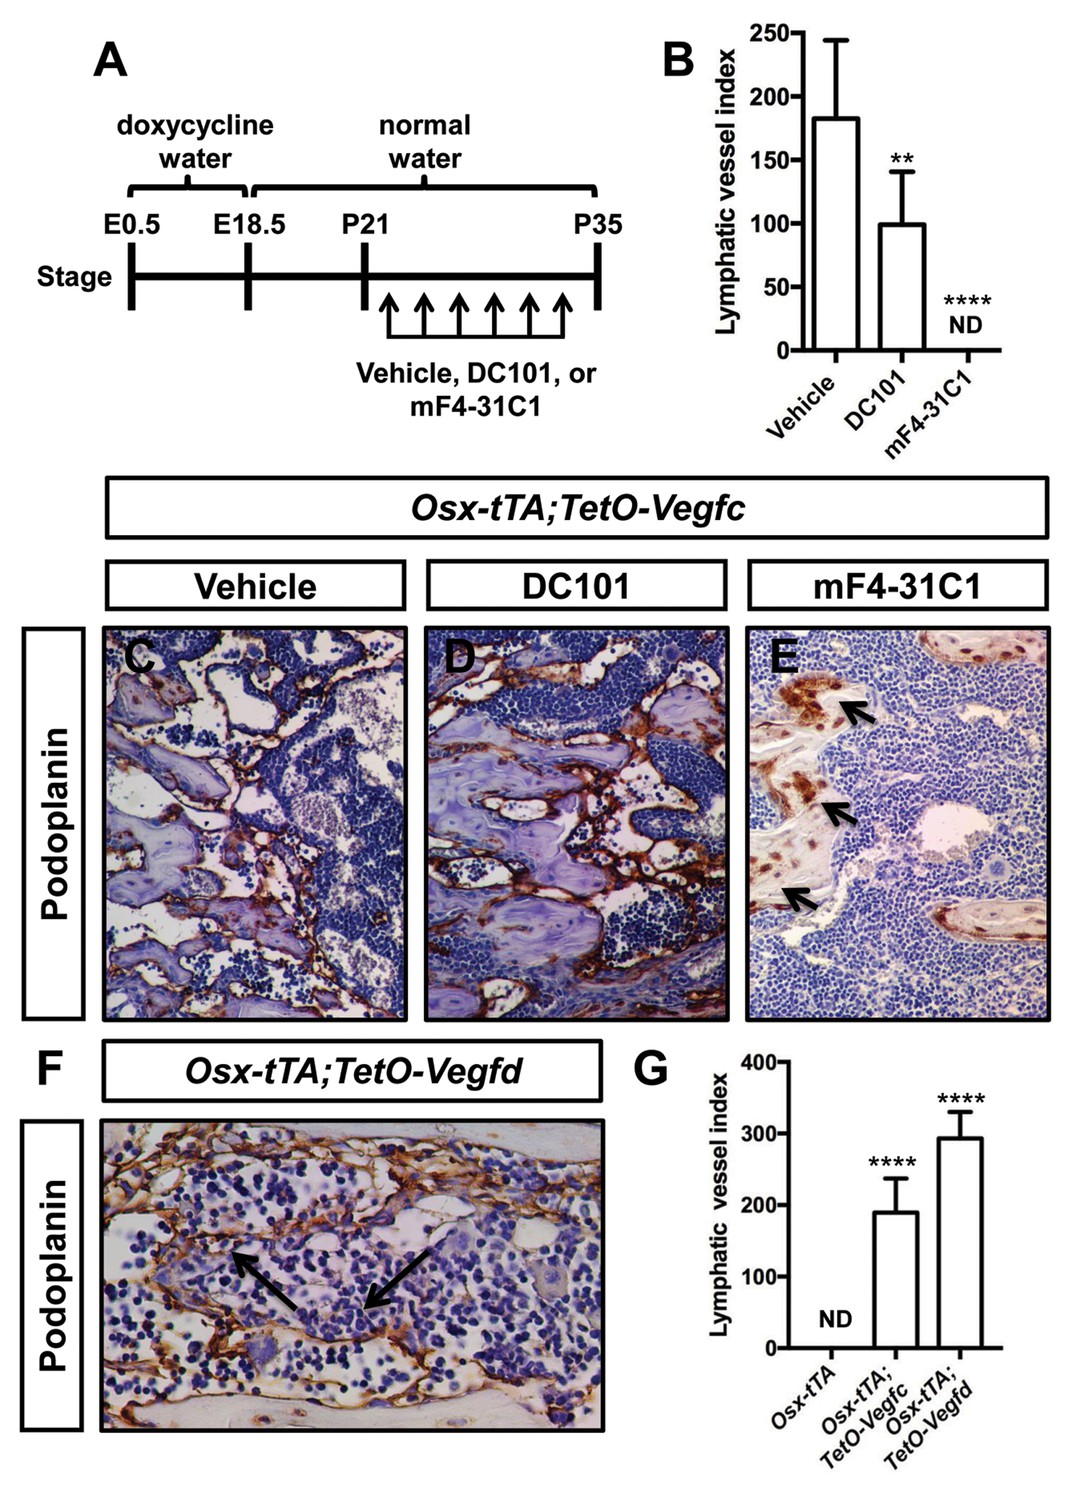
VEGFR3 signaling promotes the formation of bone lymphatics.
(A) Schematic showing when mice received normal water and doxycycline water. Osx-tTA;TetO-Vegfc mice were treated (3x/week) with vehicle, DC101 (VEGFR2 function-blocking antibody), or mF4-31C1 (VEGFR3 function-blocking antibody) from P21 to P35. (B) Graph showing lymphatic index values for vehicle-treated (182.6 ± 61.56; n = 7), DC101-treated (99 ± 41.68; n = 7), and mF4-31C1-treated mice (0 ± 0.0; n = 5). (**p<0.01, ****p<0.0001, ANOVA followed by Dunnett’s multiple comparisons test. Values were tested against values for vehicle-treated mice). (C–E) Representative images of femurs stained with an anti-podoplanin antibody. The femurs are from P35 mice. Arrows in panel E point to podoplanin-positive osteocytes. (F) Representative image of a femur from an Osx-tTA;TetO-Vegfd mouse that was stained with an anti-podoplanin antibody. Arrows point to podoplanin-positive lymphatics in the bone marrow. (G) Graph showing lymphatic vessel index values for trabecular bone in P35 Osx-tTA mice (0 ± 0; n = 6), Osx-tTA;TetO-Vegfc mice (189.5 ± 47.7; n = 4), and Osx-tTA;TetO-Vegfd mice (293 ± 37.24; n = 3). (****p<0.0001, ANOVA followed by Dunnett’s multiple comparisons test. Values were tested against values for Osx-tTA mice). ND = Not Detected.
Figure 3 with 2 supplements
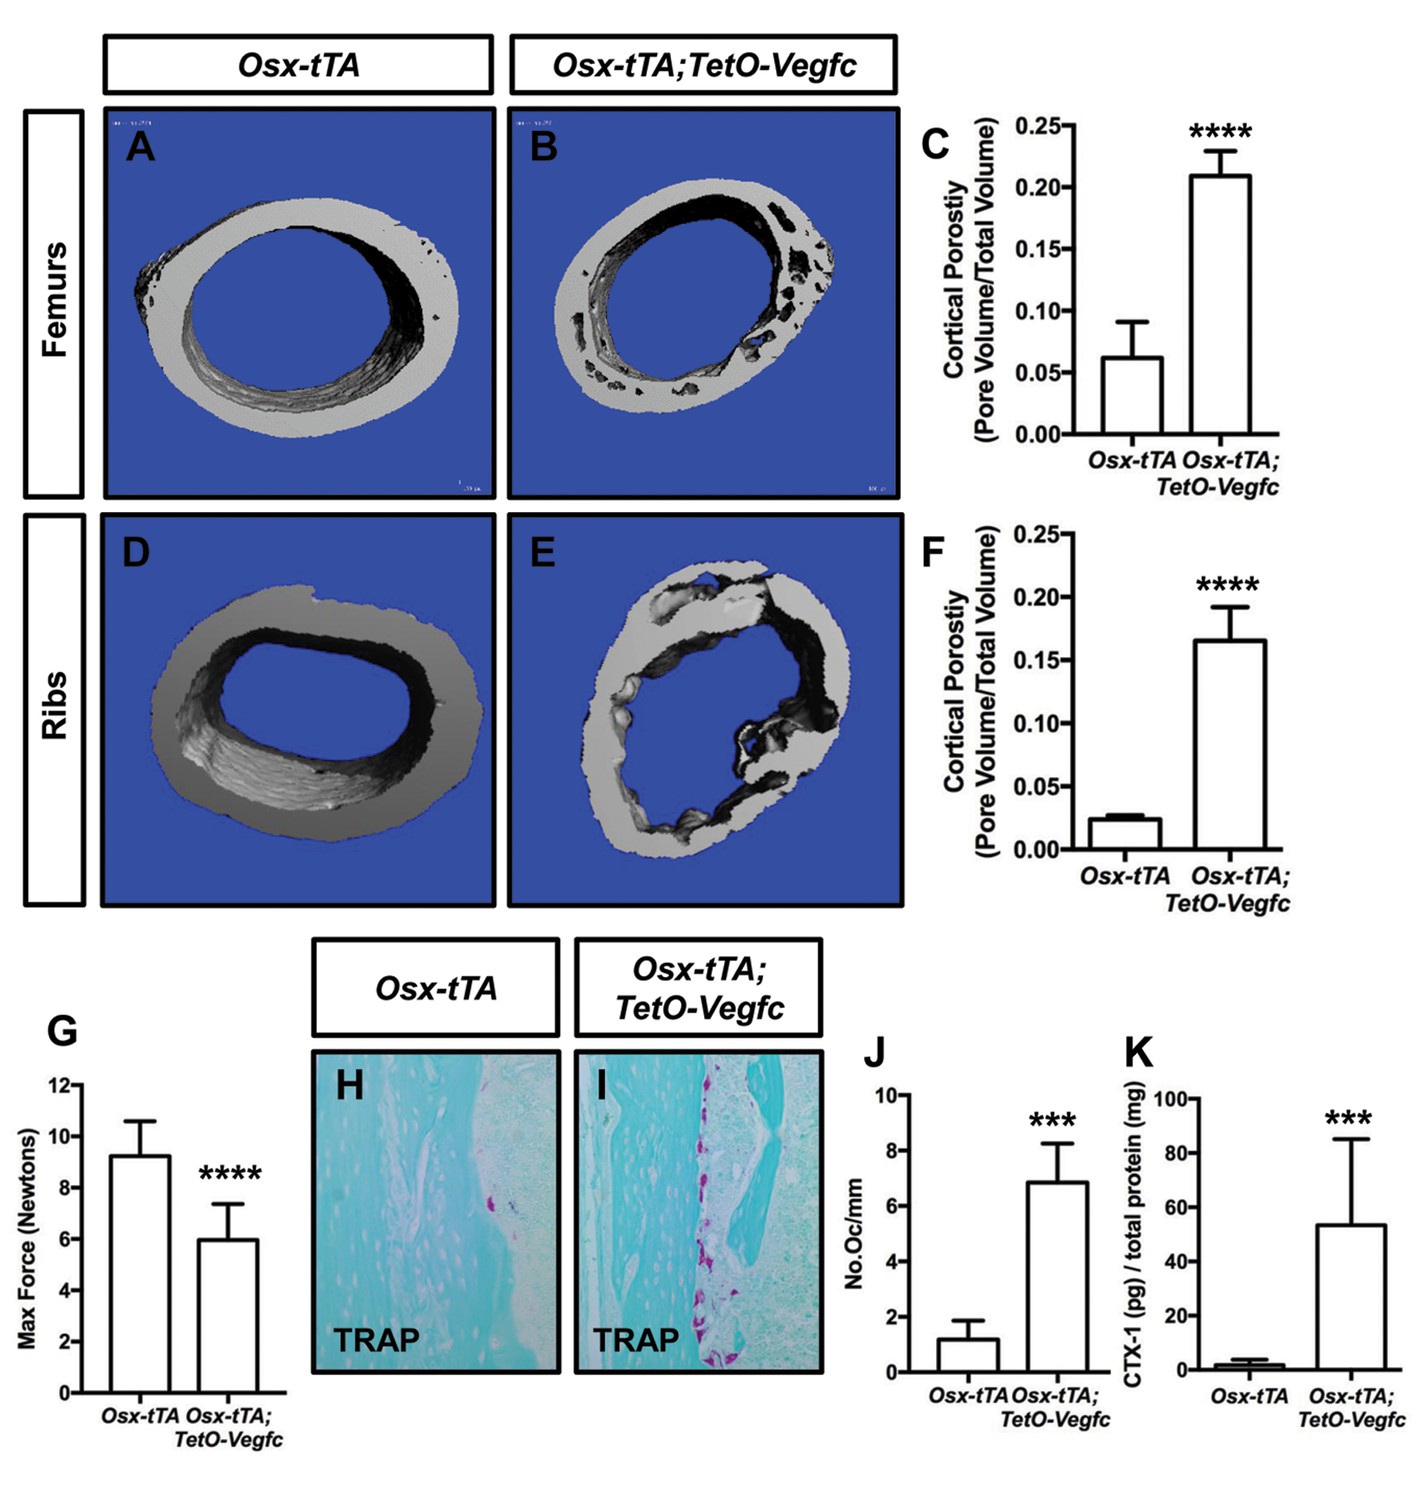
Osx-tTA;TetO-Vegfc mice have more porous bones and osteoclasts than Osx-tTA mice.
(A,B) Representative μCT images of femurs from Osx-tTA and Osx-tTA;TetO-Vegfc mice. (C) Graph showing cortical bone porosity for femurs from Osx-TA (0.062 ± 0.0292, n = 5) and Osx-tTA;TetO-Vegfc (0.209 ± 0.0204, n = 6) mice. (D,E) Representative μCT images of ribs from Osx-tTA and Osx-tTA;TetO-Vegfc mice. (F) Graph showing cortical bone porosity for ribs from Osx-TA (0.024 ± 0.00293, n = 4) and Osx-tTA;TetO-Vegfc (0.165 ± 0.0265, n = 4) mice. (G) Graph showing results from the three-point bending assay. Less force was required to break bones from Osx-TA;TetO-Vegfc mice (5.96 ± 1.404, n = 11) than Osx-tTA mice (9.231 ± 1.355, n = 9) mice. (H,I) Representative images of TRAP-stained femurs from Osx-tTA and Osx-tTA;TetO-Vegfc mice. (J) Graph showing the number of osteoclasts per mm of bone for Osx-tTA (1.18 ± 0.6818; n = 4) and Osx-tTA;TetO-Vegfc (6.84 ± 1.413; n = 4) mice. (K) Graph showing CTX-1 values for Osx-tTA (1.7 ± 2.045; n = 8) and Osx-tTA;TetO-Vegfc (53.3 ± 31.8; n = 7) mice. (***p<0.001, ****p<0.0001, unpaired student’s T-test).
Figure 3—figure supplement 1

Bones from Osx-tTA;TetO-Vegfc mice have a moth-eaten appearance.
Representative images of x-rayed femurs from Osx-tTA and Osx-tTA;TetO-Vegfc mice. (A–C) Femurs from P21, P28, and P35 Osx-tTA mice appear normal. (D–E) Femurs from P21 Osx-tTA;TetO-Vegfc mice appear normal, whereas femurs from P28 and P35 Osx-tTA;TetO-Vegfc mice have a moth-eaten appearance (arrows).
Figure 3—figure supplement 2
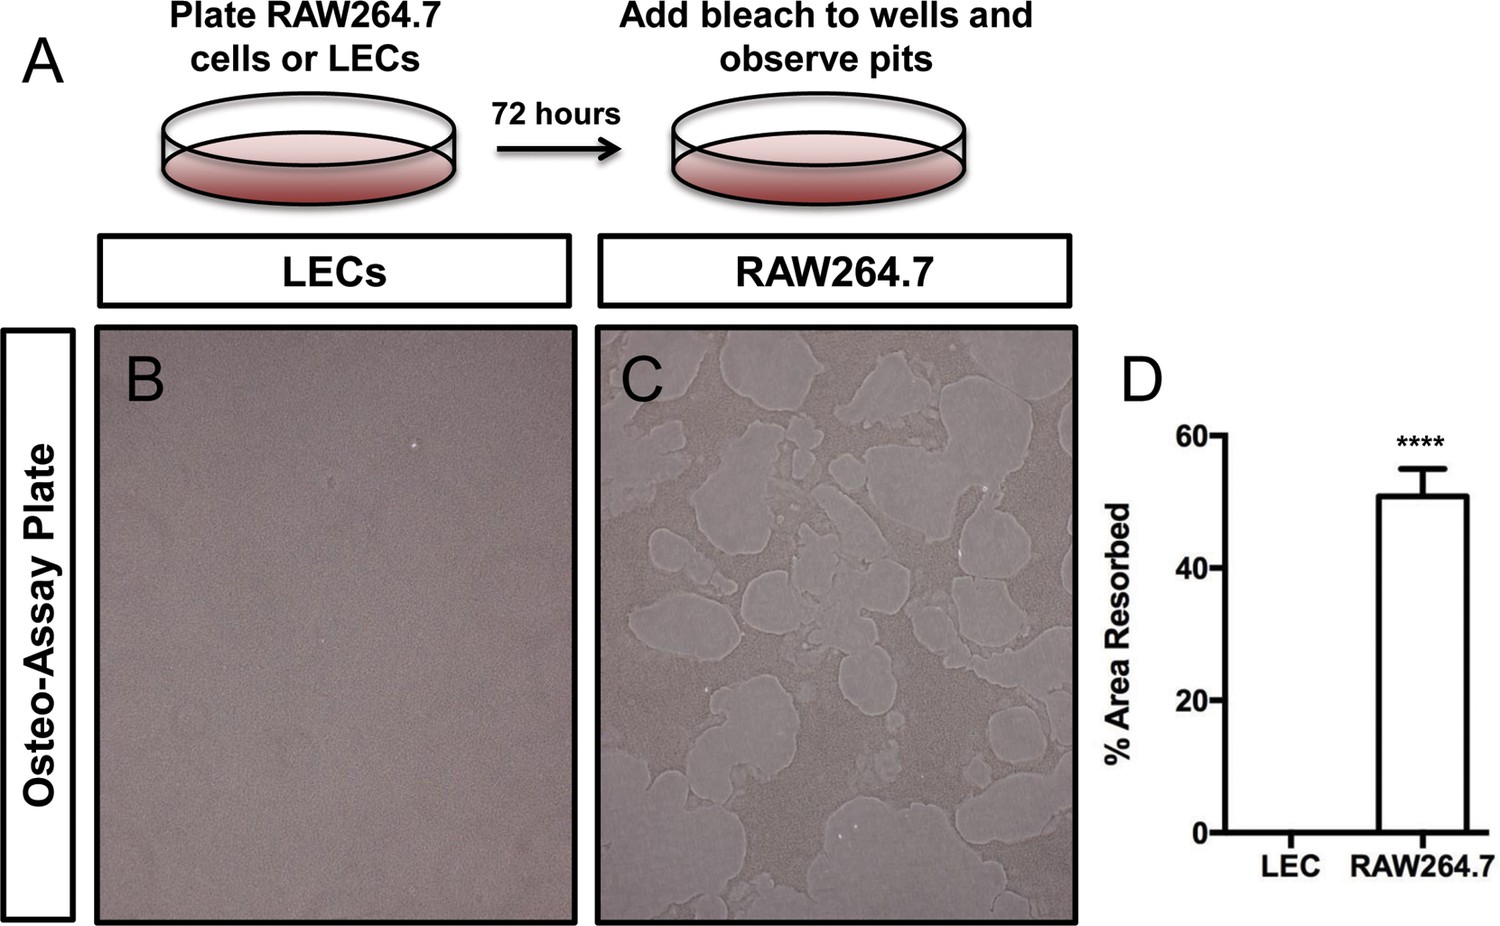
LECs do not degrade a calcium-phosphate matrix.
(A) Schematic for experiment with the Osteo-Assay plate. (B,C) Representative images of wells containing lymphatic endothelial cells or RAW64.7 cells (osteoclasts). (D) Graph showing the percent area resorbed by lymphatic endothelial cells (0 ± 0.0; n = 3) and RAW264.7 cells (50.83 ± 4.131, n = 3). ****p<0.0001.
Figure 4
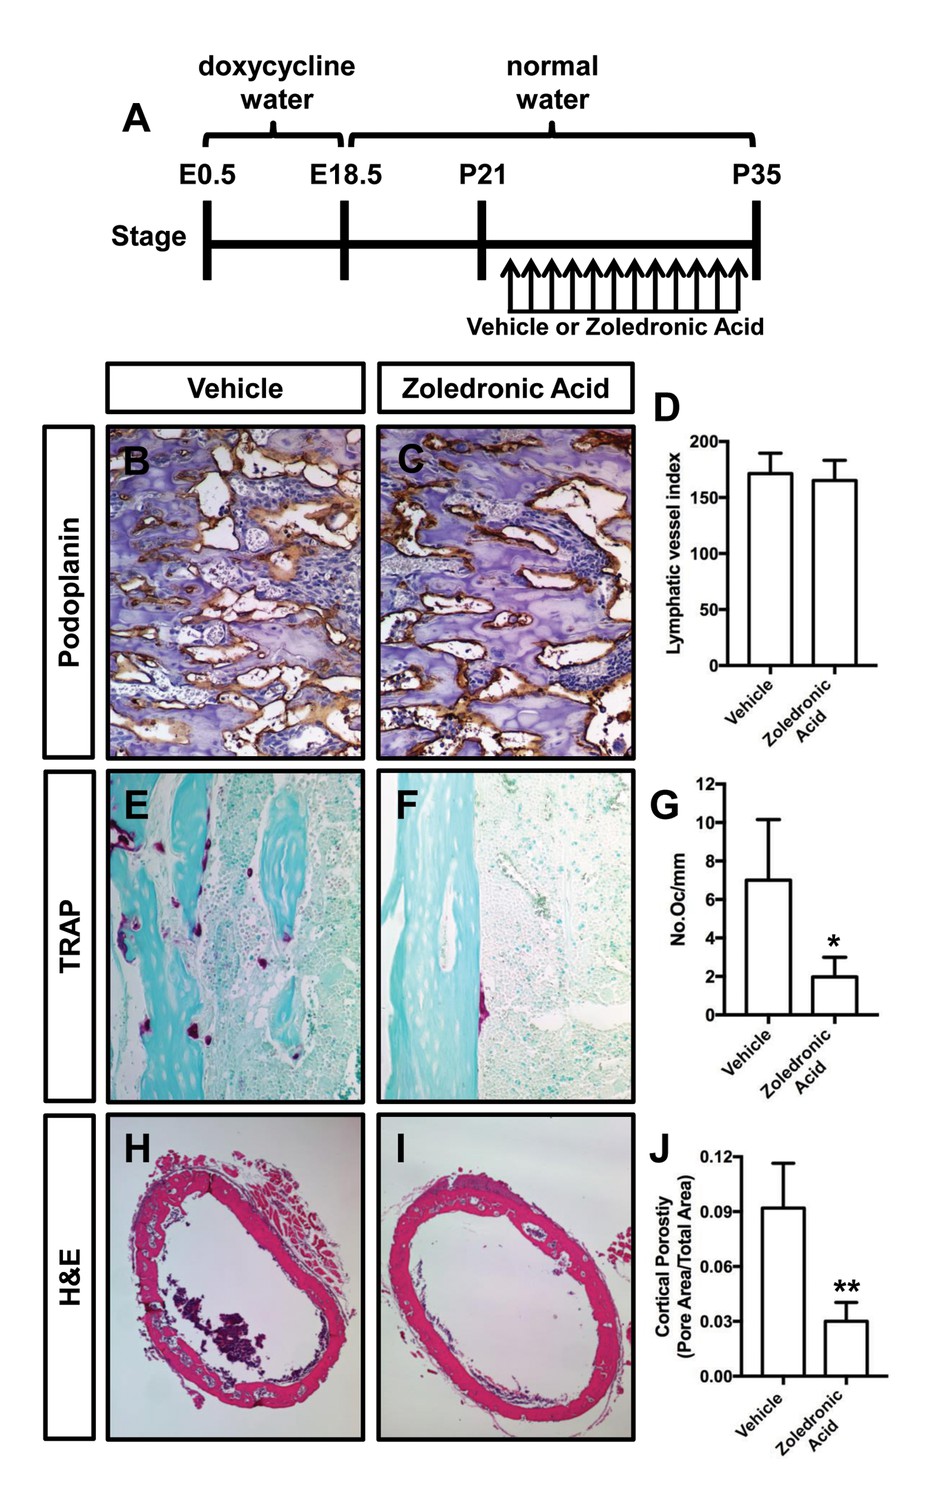
Zoledronic acid attenuates bone loss in Osx-tTA;TetO-Vegfc mice.
(A) Schematic showing when mice received normal water and doxycycline water. Osx-tTA;TetO-Vegfc mice were treated (q.a.d.) with vehicle or zoledronic acid from P21 to P35. (B,C) Representative images of femurs stained with an anti-podoplanin antibody. (D) Graph showing lymphatic vessel index values for vehicle-treated (171.5 ± 18.18, n = 3) and zoledronic acid-treated (165.2 ± 18.04, n = 5) mice. (E,F) Representative images of TRAP stained femurs from vehicle-treated and zoledronic acid-treated mice. (G) Graph showing the number of osteoclasts per mm of bone for vehicle-treated (7.0 ± 3.15, n = 3) and zoledronic acid-treated (1.9 ± 1.9, n = 5) mice. (H,I) Representative images of H and E stained femurs from vehicle-treated and zoledronic acid-treated mice. (J) Graph showing cortical bone porosity of femurs for vehicle-treated (0.092 ± 0.0245, n = 3) and zoledronic acid-treated (0.030 ± 0.0103, n = 5) mice. (*p<0.05, **p<0.01, unpaired student’s T-test).
Figure 5
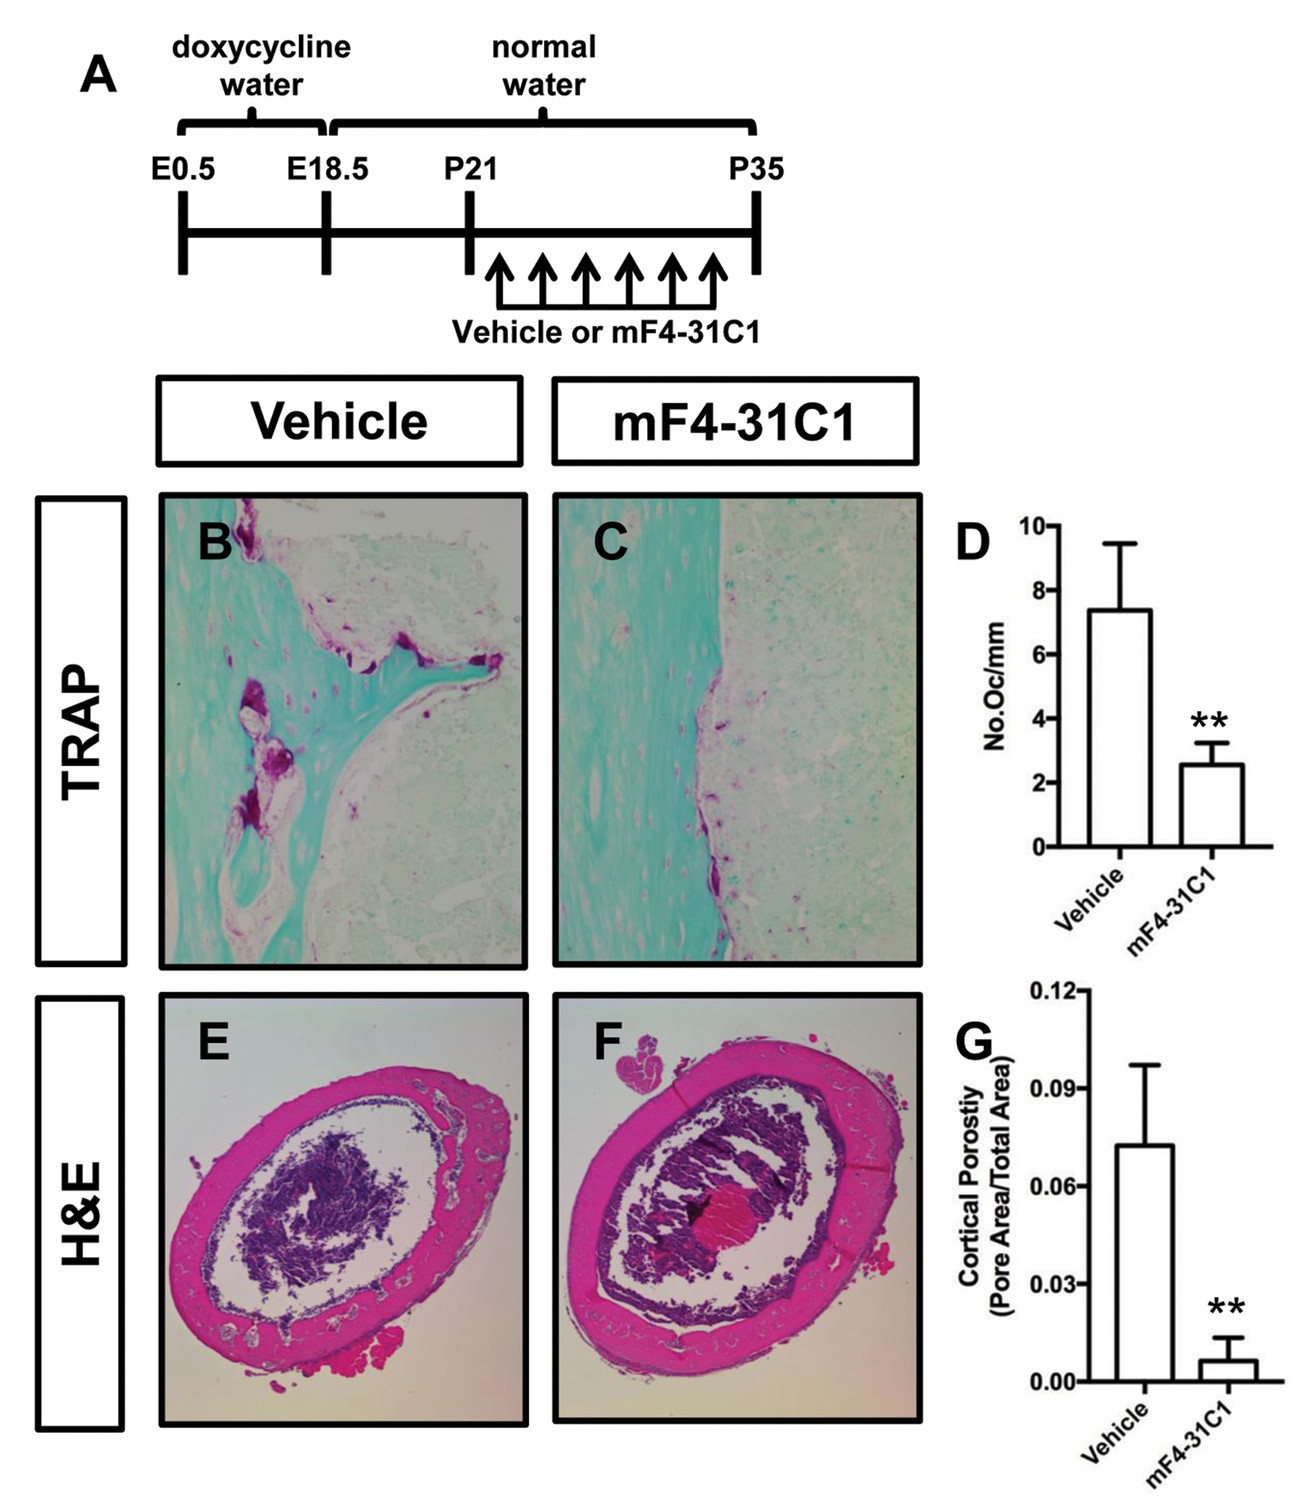
mF4-31C1 inhibits osteoclast formation and bone loss in Osx-tTA;TetO-Vegfc mice.
(A) Schematic showing when mice received normal water and doxycycline water. Osx-tTA;TetO-Vegfc mice were treated (3x/week) with vehicle or mF4-31C1 (VEGFR3 function-blocking antibody) from P21 to P35. (B,C) Representative images of TRAP stained femurs from vehicle-treated and mF4-31C1-treated mice. (D) Graph showing the number of osteoclasts per mm of bone for vehicle-treated (7.37 ± 2.088, n = 5) and mF4-31C1-treated (2.552 ± 0.6893, n = 5) mice. (E,F) Representative images of H and E stained femurs from vehicle-treated and mF4-31C1-treated mice. (G) Graph showing cortical bone porosity of femurs for vehicle-treated (0.07244 ± 0.02468, n = 5) and mF4-31C1-treated (0.006375 ± 0.007087, n = 4) mice. (**p<0.01, unpaired student’s T-test).
Figure 6
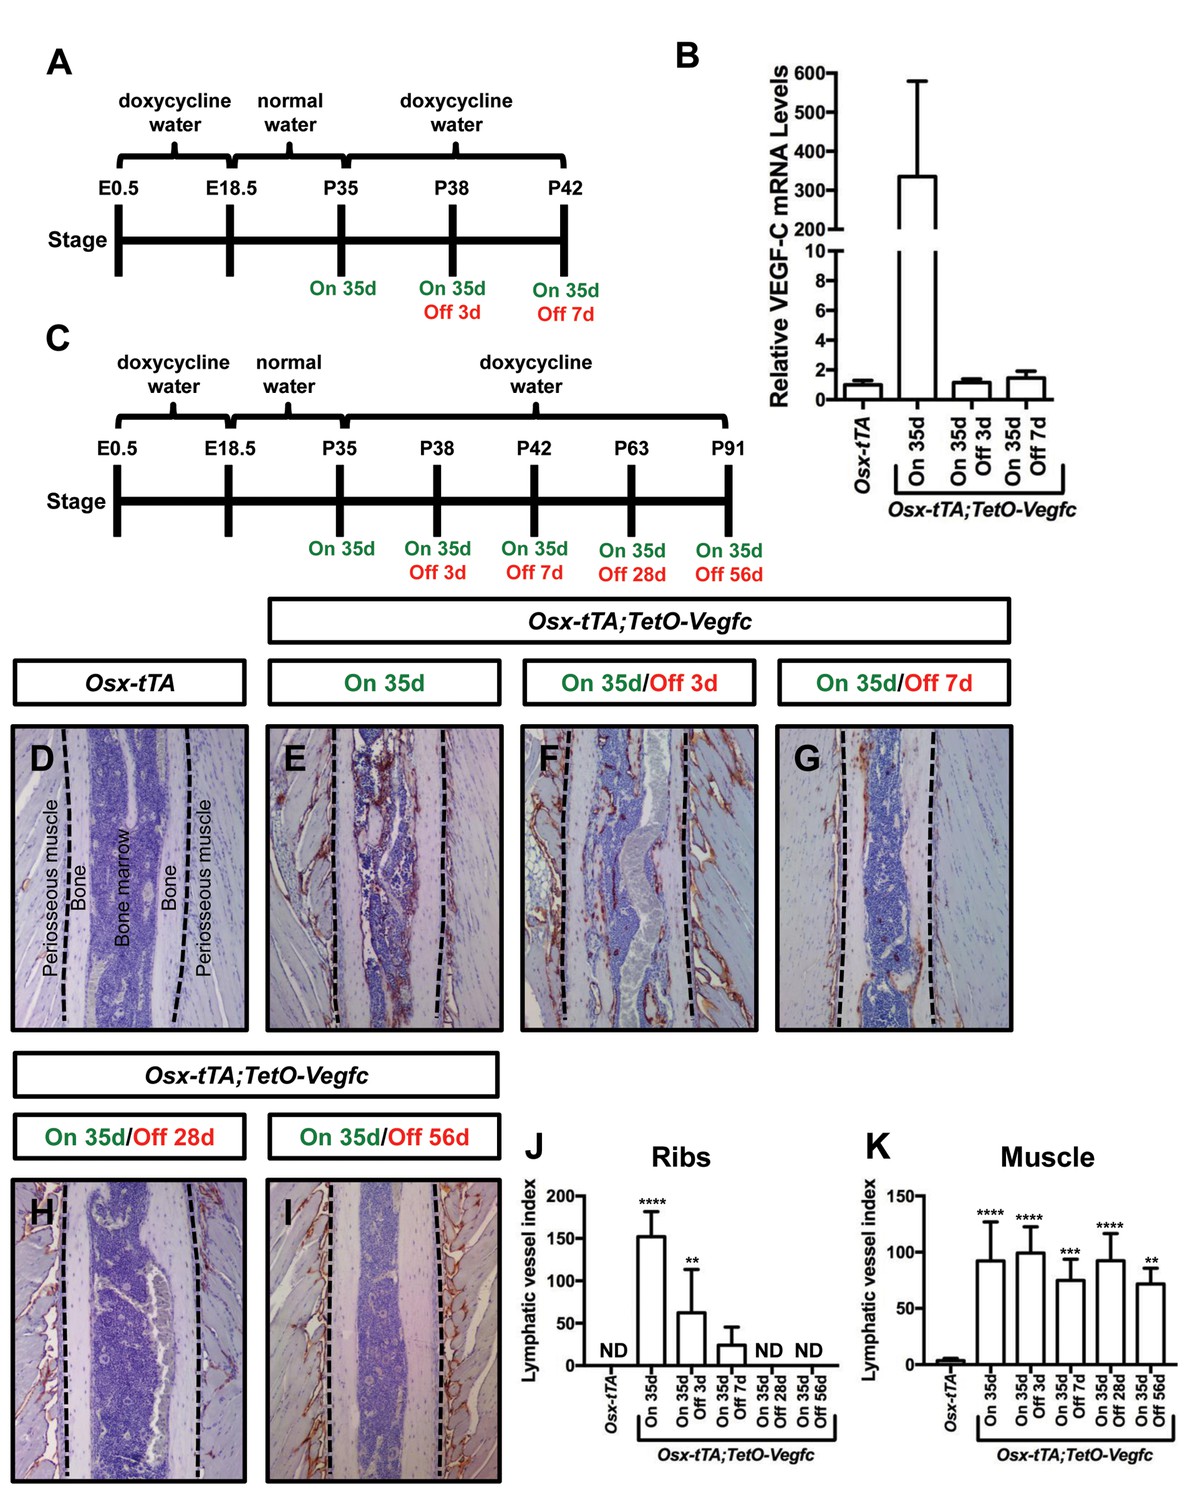
Bone lymphatics in Osx-tTA;TetO-Vegfc mice disappear following the withdrawal of VEGF-C.
(A) Schematic showing when mice received normal water and doxycycline water. One cohort of Osx-tTA;TetO-Vegfc mice received normal water from E18.5 to P35 (On 35d). A second cohort of Osx-tTA;TetO-Vegfc mice received normal water from E18.5 to P35 and then doxycycline water from P35 to P38 (On 35d/Off 3d). A third cohort of Osx-tTA;TetO-Vegfc mice received normal water from E18.5 to P35 and then doxycycline water from P35 to P42 (On 35d/Off 7d). (B) Graph showing the relative VEGF-C mRNA levels in tibias from mice. (C) Schematic showing when mice received normal water and doxycycline water. Osx-tTA;TetO-Vegfc mice received normal water from E18.5 to P35 (On 35d) or normal water from E18.5 to P35 and then doxycycline water for 3 (On 35d/Off 3d), 7 (On 35d/Off 7d), 28 (On 35d/Off 28d), or 56 days (On 35d/Off 56d). (D–I) Representative images of ribs stained with an anti-podoplanin antibody. The dashed lines separate the bone from the periosseous muscle. (J) Graph showing lymphatic vessel index values for ribs in Osx-tTA mice (0 ± 0.0; n = 5), Osx-tTA;TetO-Vegfc mice that received normal water for 35 days (152.5 ± 29.56; n = 5), and Osx-tTA;TetO-Vegfc mice that received normal water for 35 days and then doxycycline water for 3 (62.25 ± 51.7; n = 4), 7 (24.08 ± 21.26; n = 4), 28 (0 ± 0.0; n = 5) or 56 (0 ± 0.0; n = 3) days. (K) Graph showing lymphatic vessel index values for periosseous muscle in Osx-tTA mice (3.61 ± 1.974; n = 5), Osx-tTA;TetO-Vegfc mice that received normal water for 35 days (92.45 ± 34.63; n = 5), and Osx-tTA;TetO-Vegfc mice that received normal water for 35 days and then doxycycline water for 3 (99.29 ± 23.37; n = 4), 7 (74.84 ± 18.98; n = 4), 28 (92.67 ± 24.2; n = 5) or 56 (72.17 ± 14.05; n = 3) days. (**p<0.01, ***p<0.001, ****p<0.0001, ANOVA followed by Dunnett’s multiple comparisons test. Values were tested against values for Osx-tTA mice). ND = Not Detected.
Figure 7
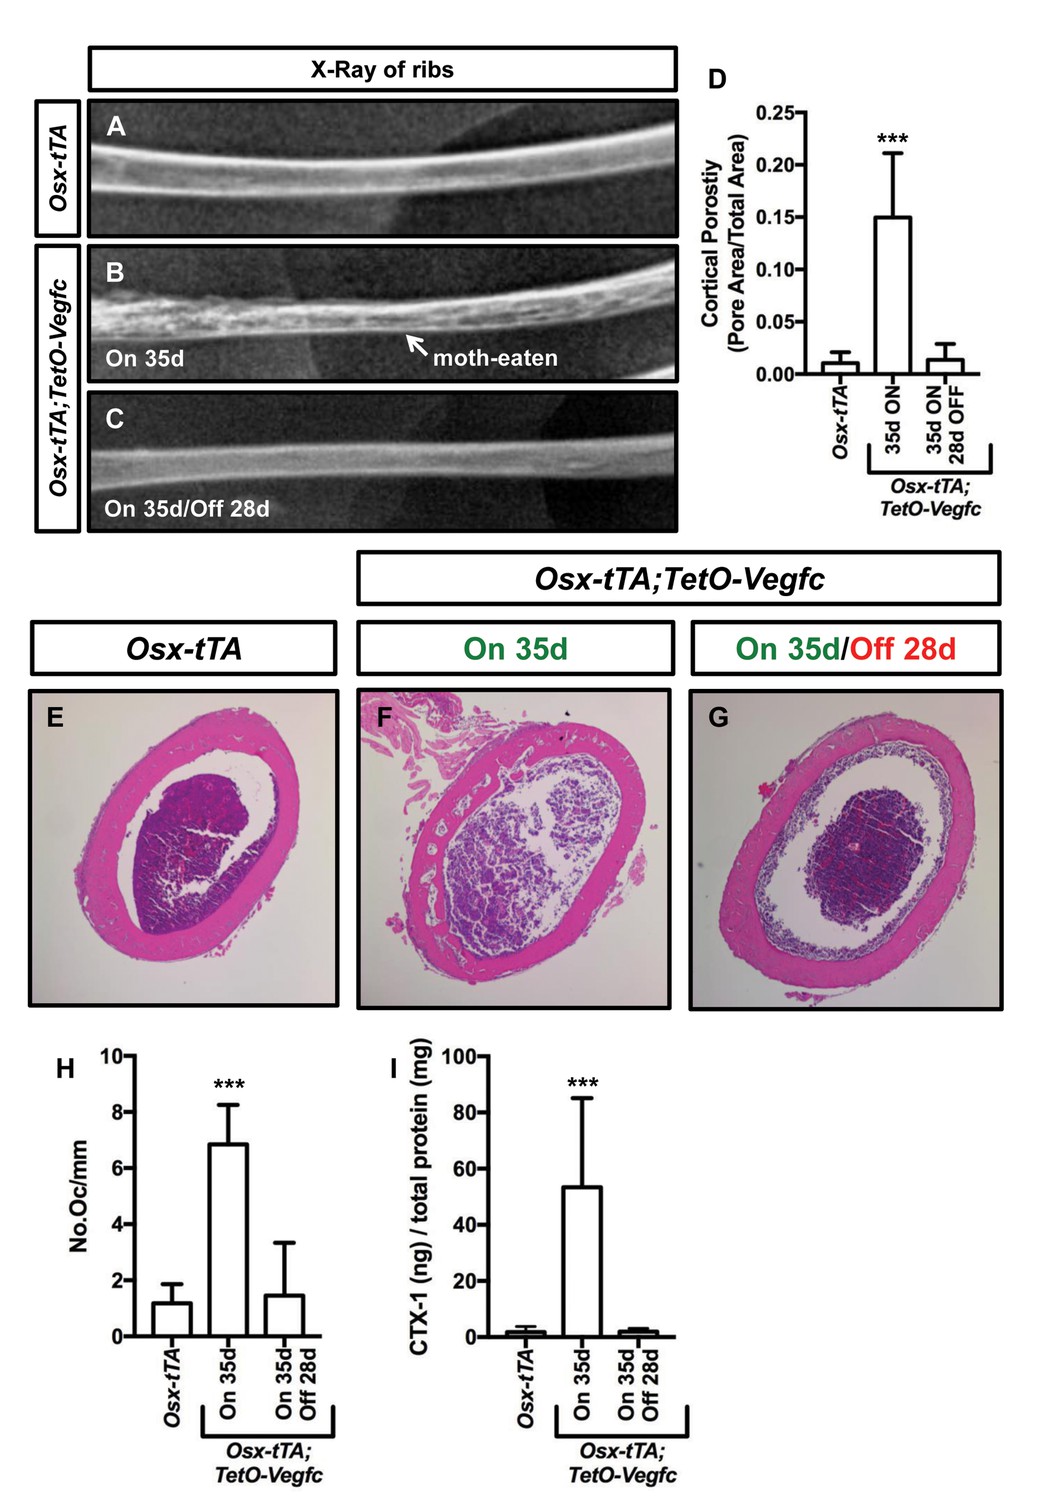
The bone phenotype of Osx-tTA;TetO-Vegfc mice is reversible.
(A–C) Representative x-ray images of femurs from Osx-tTA mice, Osx-tTA;TetO-Vegfc mice that received normal water from E18.5 to P35 (On 35d), and Osx-tTA;TetO-Vegfc mice that received normal water from E18.5 to P35 and then doxycycline water from P35 to P63 (On 35d/Off 28d). Osx-tTA;TetO-Vegfc femurs switched from a moth-eaten appearance to a normal appearance following exposure to doxycycline. (D) Graph showing cortical bone porosity values for femurs from Osx-tTA mice (0.011 ± 0.0103; n = 4), Osx-tTA;TetO-Vegfc mice that received normal water from E18.5 to P35 (0.149 ± 0.0615; n = 7), and Osx-tTA;TetO-Vegfc mice that received normal water from E18.5 to P35 and then doxycycline water from P35 to P63 (0.014 ± 0.0152; n = 5). (E–G) Representative images of H and E stained femurs. The femur from the Osx-tTA;TetO-Vegfc mouse that received normal water from E18.5 to P35 is filled with pores. (H) Graph showing the number of osteoclasts per mm of bone for Osx-tTA mice (1.18. ±0.6818; n = 4), Osx-tTA;TetO-Vegfc mice that received normal water from E18.5 to P35 (6.84 ± 1.41; n = 4), and Osx-tTA;TetO-Vegfc mice that received normal water from E18.5 to P35 and then doxycycline water from P35 to P63 (1.45 ± 1.88; n = 4). (I) Graph showing CTX-1 values for Osx-tTA mice (1.7 ± 2.045; n = 8), Osx-tTA;TetO-Vegfc mice that received normal water from E18.5 to P35 (53.3 ± 31.8; n = 7), and Osx-tTA;TetO-Vegfc mice that received normal water from E18.5 to P35 and then doxycycline water from P35 to P63 (1.9 ± 1.19; n = 4). (***p<0.001, ANOVA followed by Dunnett’s multiple comparisons test. Values were tested against values for Osx-tTA mice.).
Figure 8
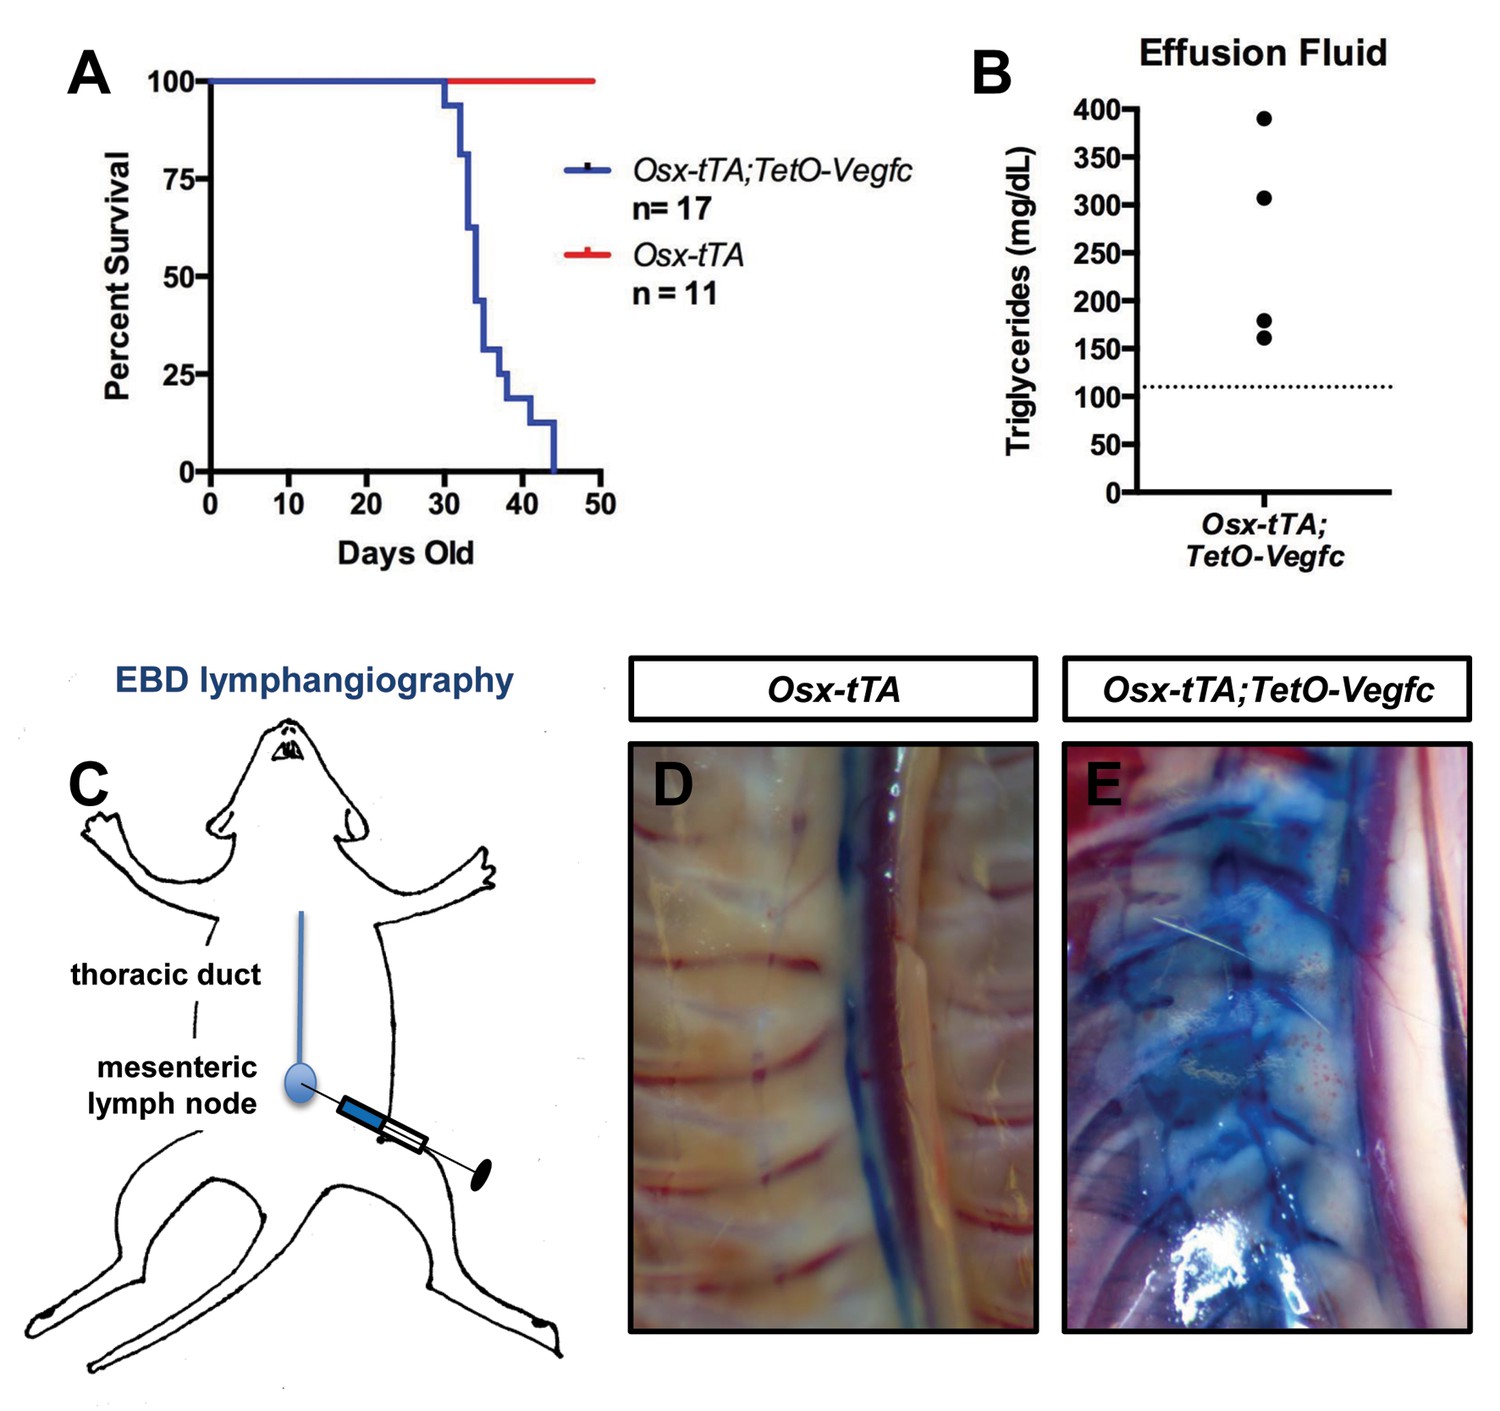
Osx-tTA;TetO-Vegfc mice develop chylothorax.
(A) Survival curve for Osx-tTA and Osx-tTA;TetO-Vegfc mice (p<0.0001 Log-rank (Mantel-Cox) test). (B) Graph showing triglyceride levels in effusion fluid collected from Osx-tTA;TetO-Vegfc mice (n = 4). The dashed line marks 110 mg/dl. (C) Overview of the Evans blue dye (EBD) lymphangiography method. EBD injected into the mesenteric lymph node is transported to the thoracic duct. (D) EBD is confined to the thoracic duct in Osx-tTA mice (n = 4). (E) In Osx-tTA;TetO-Vegfc mice, EBD spills from the thoracic duct into periosseous lymphatics in muscle (n = 4).
Tables
Key resources table
| Reagent type (species) or resource | Designation | Source or reference | Identifiers | Additional information |
|---|---|---|---|---|
| Genetic reagent (Mus musculus) | Osx-tTA | PMID: 16854976 | ||
| Genetic reagent (Mus musculus) | TetO-Vegfc | PMID: 18988807 | ||
| Genetic reagent (Mus musculus) | TetO-Vegfd | PMID: 27342876 | ||
| Antibody | anti-GFP (chicken polyclonal) | abcam, ab13970 | (1:1000) | |
| Antibody | anti-Lyve-1 (goat polyclonal) | R and D Systems, AF2125 | (1:250) | |
| Antibody | anti-Podoplanin (hamster monoclonal) | abcam, ab11936 | (1:1000) | |
| Antibody | anti-VEGFR2 (rat monoclonal) | Eli Lily | DC101 | Function blocking antibody |
| Antibody | anti-VEGFR3 (rat monoclonal) | Eli Lily | mF4-31C1 | Function blocking antibody |
| Commerical assay, kit | ELISA kit - CTX-1 | CUSABIO, CSB - E12782M | ||
| Commerical assay, kit | ELISA kit - VEGF-C | CUSABIO, CSB - E07361M | ||
| Commerical assay, kit | TRIzol | Life Technologies, 15596018 | ||
| Commerical assay, kit | Rneasy RNA Isolation kit | Qiagen, 74104 | ||
| Commerical assay, kit | cDNA synthesis kit | BioRad, 74104 | ||
| Commerical assay, kit | 2 ml phase lock gel tube | Quanta, 2302830 | ||
| Commerical assay, kit | beads for tissue homogenizing | Biospec Products, 11079124zx | ||
| Chemical compound, drug | Doxycyline | Sigma Aldrich, D9891 | ||
| Chemical compound, drug | Zoledronic acid | SAGENT Pharmaceuticals, 801–66 | ||
| Software, algorithm | ImageJ | ImageJ 1.48 v |
Additional files
-
Transparent reporting form
- https://doi.org/10.7554/eLife.34323.016
Download links
A two-part list of links to download the article, or parts of the article, in various formats.
Downloads (link to download the article as PDF)
Open citations (links to open the citations from this article in various online reference manager services)
Cite this article (links to download the citations from this article in formats compatible with various reference manager tools)
VEGF-C promotes the development of lymphatics in bone and bone loss
eLife 7:e34323.
https://doi.org/10.7554/eLife.34323


