Acyl chain asymmetry and polyunsaturation of brain phospholipids facilitate membrane vesiculation without leakage
- Université Côte d’Azur et CNRS, France
- Instituto Biofisika (UPV/EHU, CSIC), Spain
- Université Côte d’Azur, France
Figures
Figure 1 with 1 supplement
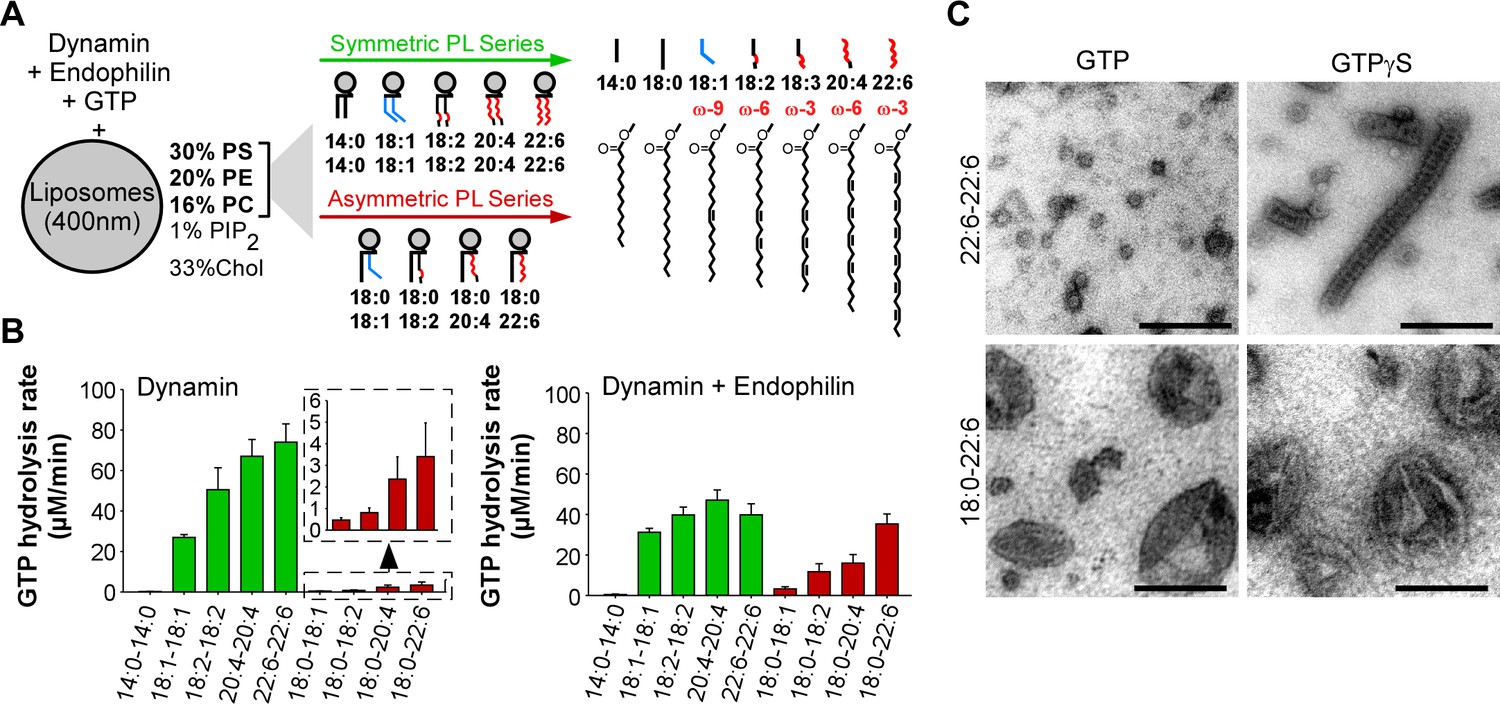
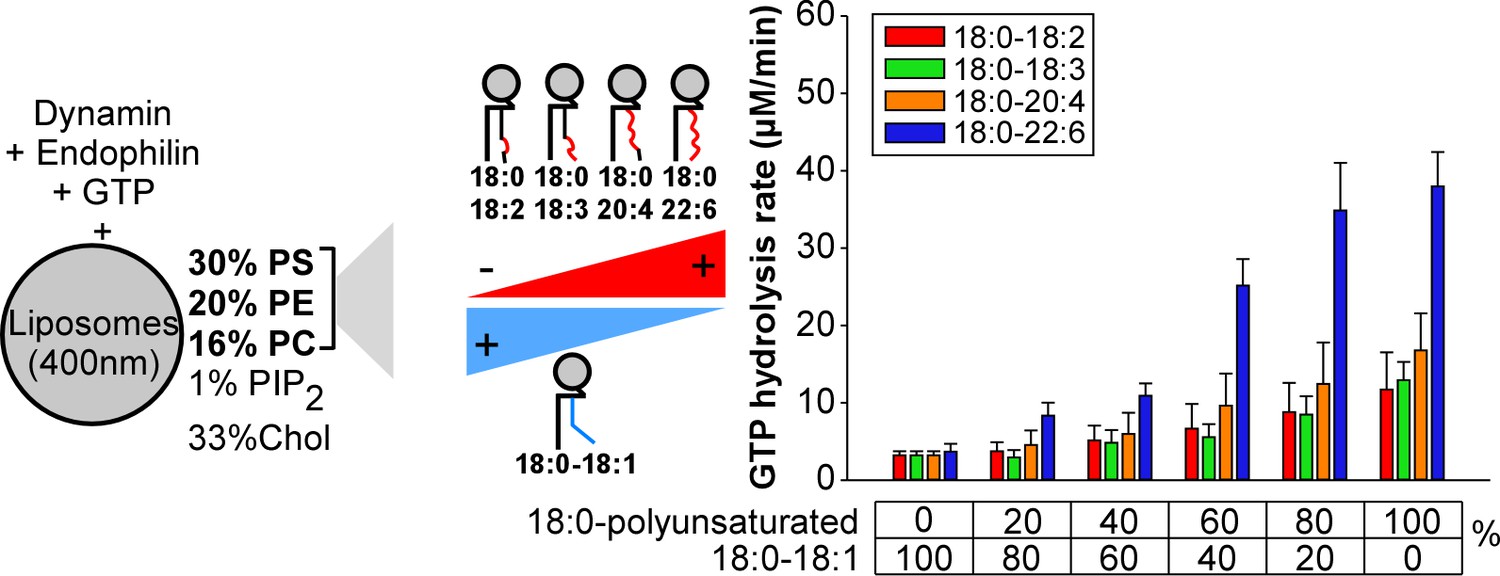
GTPase activity of dynamin on liposomes made of phospholipids with different combinations of acyl chains.
(A) Principle of the experiments and chemical structure of the various phospholipid species used in this study. (B) Rate of GTP hydrolysis by dynamin (0.3 µM) ±endophilin (0.6 µM) with large liposomes (400 nm extrusion) containing phospholipids with symmetric (green) or asymmetric (red) acyl chains at positions sn1 and sn2 as shown in A. Data are mean ± SD from three independent experiments. All lipid compositions are detailed in Supplementary file 1. (C) Electron microscopy analysis of 22:6-22:6 or 18:0-22:6 liposomes after incubation with dynamin (0.5 µM) and with GTP or GTPγS. With GTPγS, numerous dynamin spirals formed on 22:6-22:6 liposomes but not on 18:0-22:6 liposomes. With GTP, almost all 22:6-22:6 liposomes were transformed into very small (radius <20 nm) structures, whereas large parental profiles were still abundant in the case of 18:0-22:6 liposomes. Scale bar, 200 nm.
Figure 1—figure supplement 1
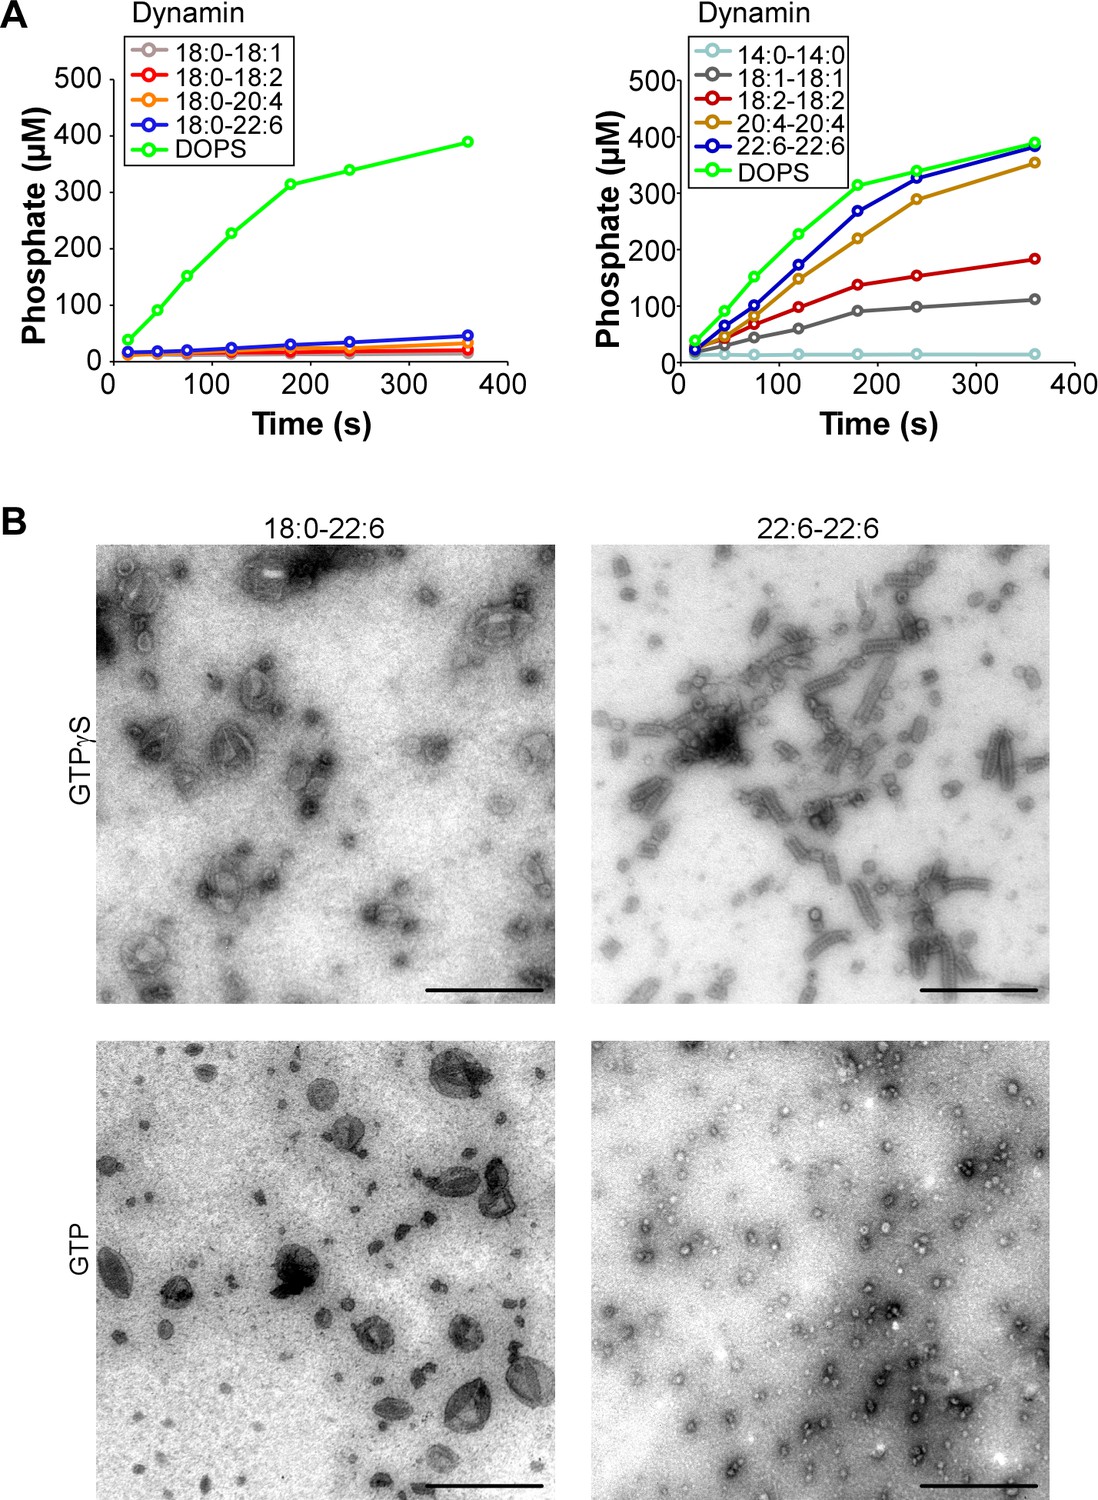
Time course of GTP hydrolysis by dynamin in the presence of phospholipids with different acyl chains and EM analysis.
(A) Time course of GTP hydrolysis by dynamin (0.3 µM) with large liposomes (400 nm extrusion) containing phospholipids with asymmetric (left panel) or symmetric (right panel) acyl chains at positions sn-1 and sn-2 as shown in Figure 1A. (B). Electron microscopy analysis of 22:6-22:6 or 18:0-22:6 liposomes after incubation with dynamin and with GTP or GTPγS. With GTPγS, numerous dynamin spirals formed and tubulated 22:6-22:6 liposomes but not in the presence of 18:0-22:6 liposomes. With GTP, dynamin extensively vesiculated 22:6-22:6 liposomes into very small (radius < 20 nm) structures, whereas large parental profiles were still abundant in the case of 18:0-22:6 liposomes. Scale bar, 500 nm. All lipid compositions are shown in Supplementary file 1.
Figure 2 with 1 supplement
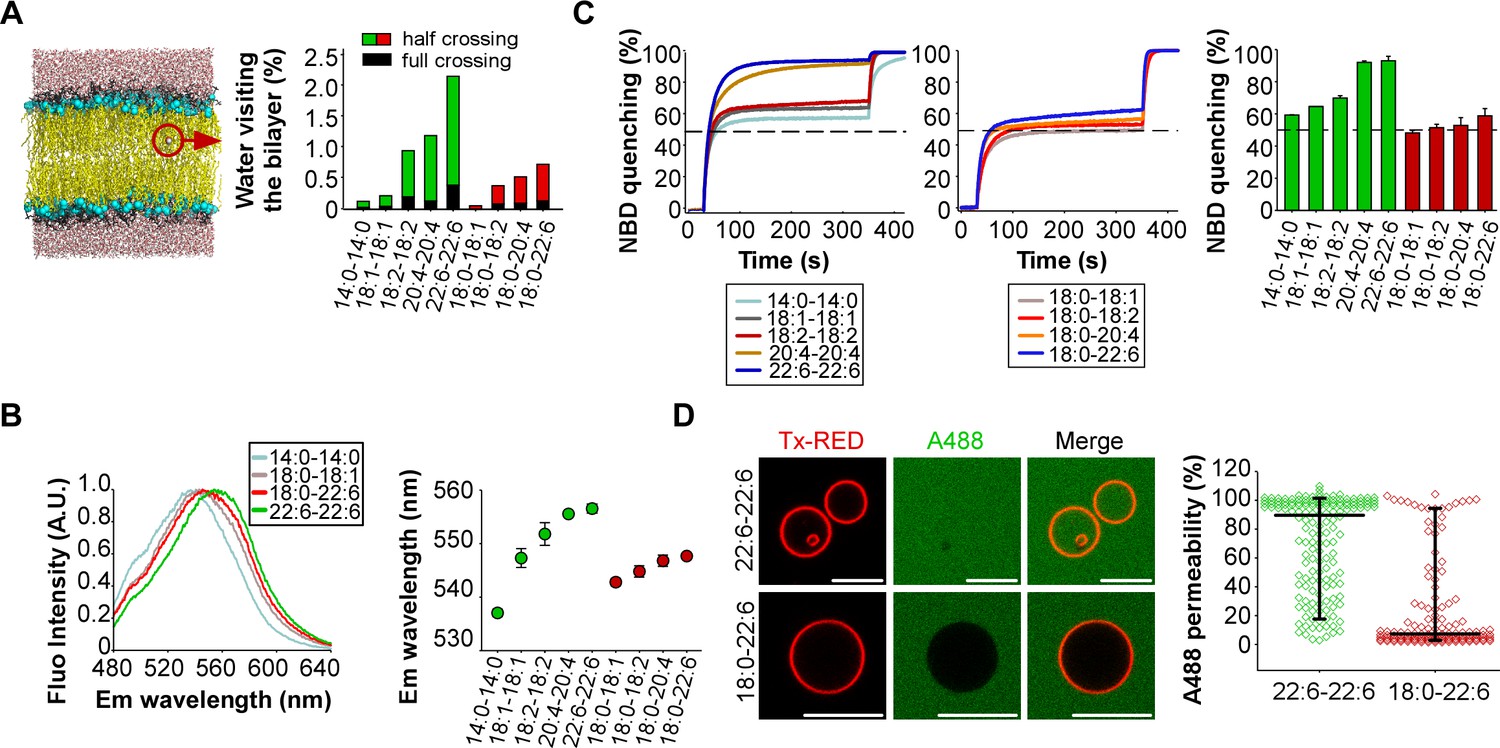
Membranes with symmetrical but not asymmetrical polyunsaturated phospholipids are highly permeable.
(A) Left: snapshot of a lipid bilayer with the same composition as that used in the dynamin GTPase assay. The red circle highlights a water molecule in the membrane hydrophobic region. Right: % of water molecules visiting the membrane hydrophobic region during a 100 ns simulation as a function of phospholipid acyl chain composition. (B) Hydratation of the interfacial region of the same liposomes as that used in Figure 1 as measured by the fluorescence of the push-pull pyrene dye PA. Left: typical emission fluorescence spectra. Right: emission wavelength as a function of phospholipid acyl chain composition. (C) Dithionite-mediated NBD quenching assay. At t = 30 s, dithionite was added to the same liposomes as that used in the GTPase assay but also containing PE-NBD. The dotted line indicates 50% of quenching, which is the expected value if only externally orientated PE-NBD molecules are quenched by dithionite. At t = 350 s, 0.1% Triton X-100 was added to allow the quenching of all PE-NBD molecules. Data on the right bar plot are mean ±variation from two independent experiments. (D) GUVs permeability measurements. GUVs containing the 55 mol % of the indicated polyunsaturated phospholipids were incubated with soluble Alexa488 and imaged by confocal microscopy. Data show all GUVs measured from six independent experiments and from two independent GUV preparations (large horizontal bar: mean; vertical bar SD). All lipid compositions are detailed in Supplementary file 1.
Figure 2—figure supplement 1
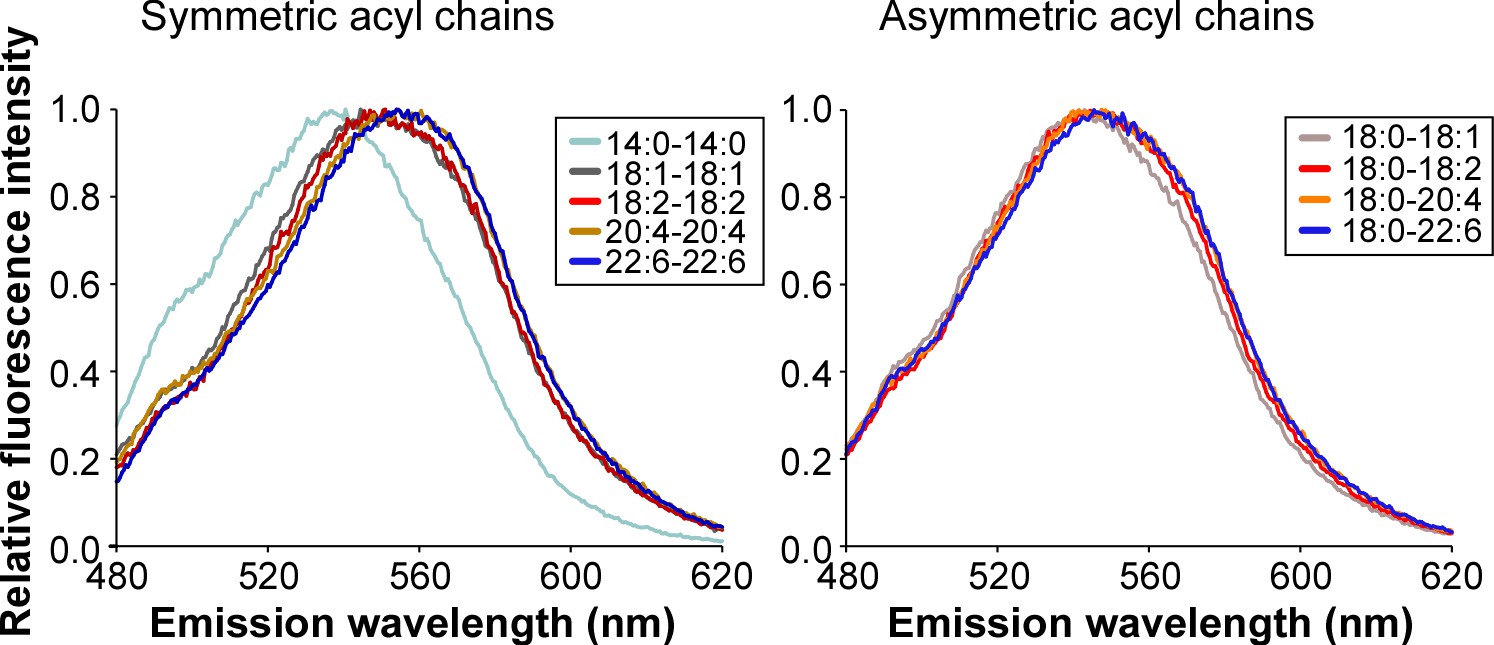
Emission fluorescence spectrum of the push-pull pyrene dye PA.
The experiment was performed in the presence of the same liposomes as that used in Figure 1 to determine the hydratation of the membrane interfacial region.
All lipid compositions are shown in Supplementary file 1.
Figure 3 with 1 supplement
Higher activity of dynamin on liposomes containing 18:0-22:6 phospholipids as compared to other polyunsaturated phospholipids.
GTPase activity of dynamin (0.3 µM) in the presence of endophilin (0.6 µM) and with large liposomes (400 nm extrusion) containing increasing amounts of the indicated asymmetric polyunsaturated phospholipids at the expense of 18:0-18:1 phospholipids. Data are mean ±SD from three independent experiments. All lipid compositions are shown in Supplementary file 1.
Figure 3—figure supplement 1

Dynamin activity at different PIP2 levels or with different BAR domains on polyunsaturated membranes.
(A) GTPase rate of dynamin (0.3 µM)±endophilin (0.6 µM) with large liposomes (400 nm extrusion) containing PS, PE, and PC with the indicated acyl chains, cholesterol and supplemented with 0% to 5% PIP2 at the expense of PC (see Supplementary file 1 for the exact lipid composition). (B) GTPase rate of dynamin (0.3 µM) in the absence of in the presence of endophilin (0.6 µM) or SNX9 (0.6 µM) and with liposomes of fixed polar head composition but different acyl chain profiles.
Figure 4 with 1 supplement

Higher vesiculation activity of dynamin and endophilin on liposomes containing 18:0-22:6 phospholipids compared to 18:0-20:4 phospholipids.
(A) Electron micrographs of 18:0-18:1, 18:0-20:4 and 18:0-22:6 liposomes (400 nm extrusion) before or after incubation with dynamin (0.5 µM), endophilin (1 µM), and GTP or GTPγS (500 µM). Scale bar, 500 nm. (B–C) Quantification of membrane tubulation (B) and vesiculation (C) from three independent experiments similar to that shown in A. In B, the tube radius and the protein spiral pitch was determined after 5 or 15 min incubations of the liposomes with dynamin, endophilin and GTPγ (see also Figure 4—figure supplement 1). In C, the size distribution of the membrane profiles was determined after 30 min incubation of the liposomes with dynamin, endophilin and GTP. All lipid compositions are showed in Supplementary file 1.
Figure 4—figure supplement 1
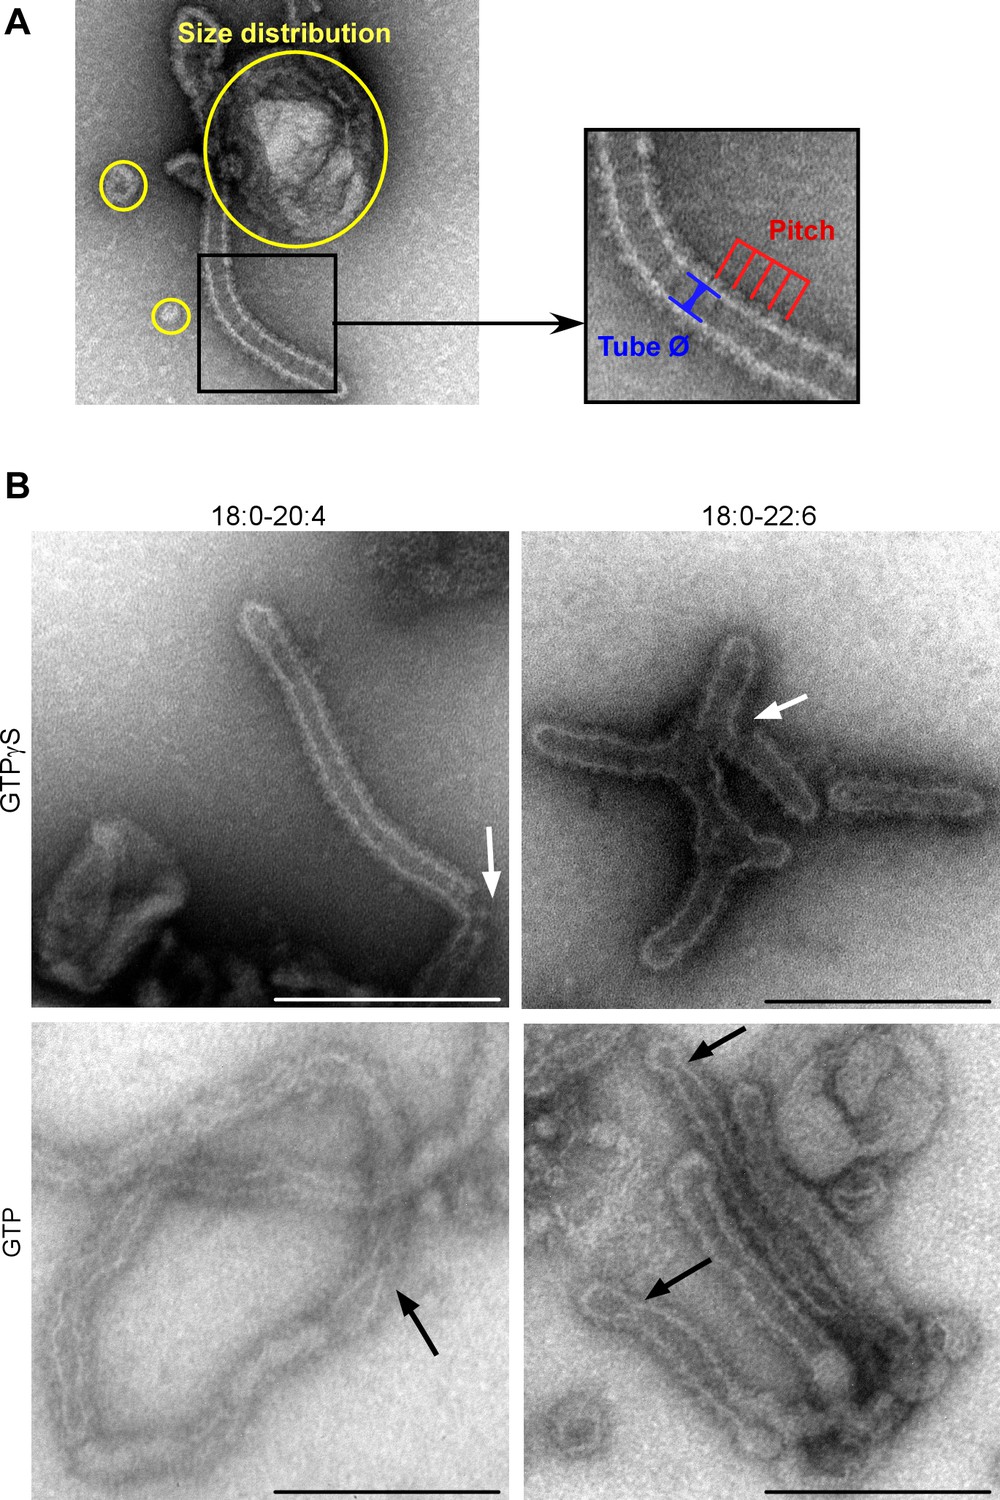
EM analysis of the dynamin, endophilin and liposome mixtures.
(A) Illustration of the measurements used to quantify the effect of dynamin and endophilin on liposomes in TEM experiments. These include the tube radius, the pitch of the dynamin + endophilin spiral and the size of the circular profiles. (B) Electron micrographs of C18:0-C20:4 or C18:0-C22:6 liposomes (400-nm extrusion) after 15 min incubation with dynamin (0.5 µM), endophilin (1 µM), and GTP or GTPγS (500 µM) at room temperature. Black arrows show membrane constructions; white arrows show tube breakages. Scale bar, 200 nm. All lipid compositions are shown in Supplementary file 1.
Figure 5 with 1 supplement
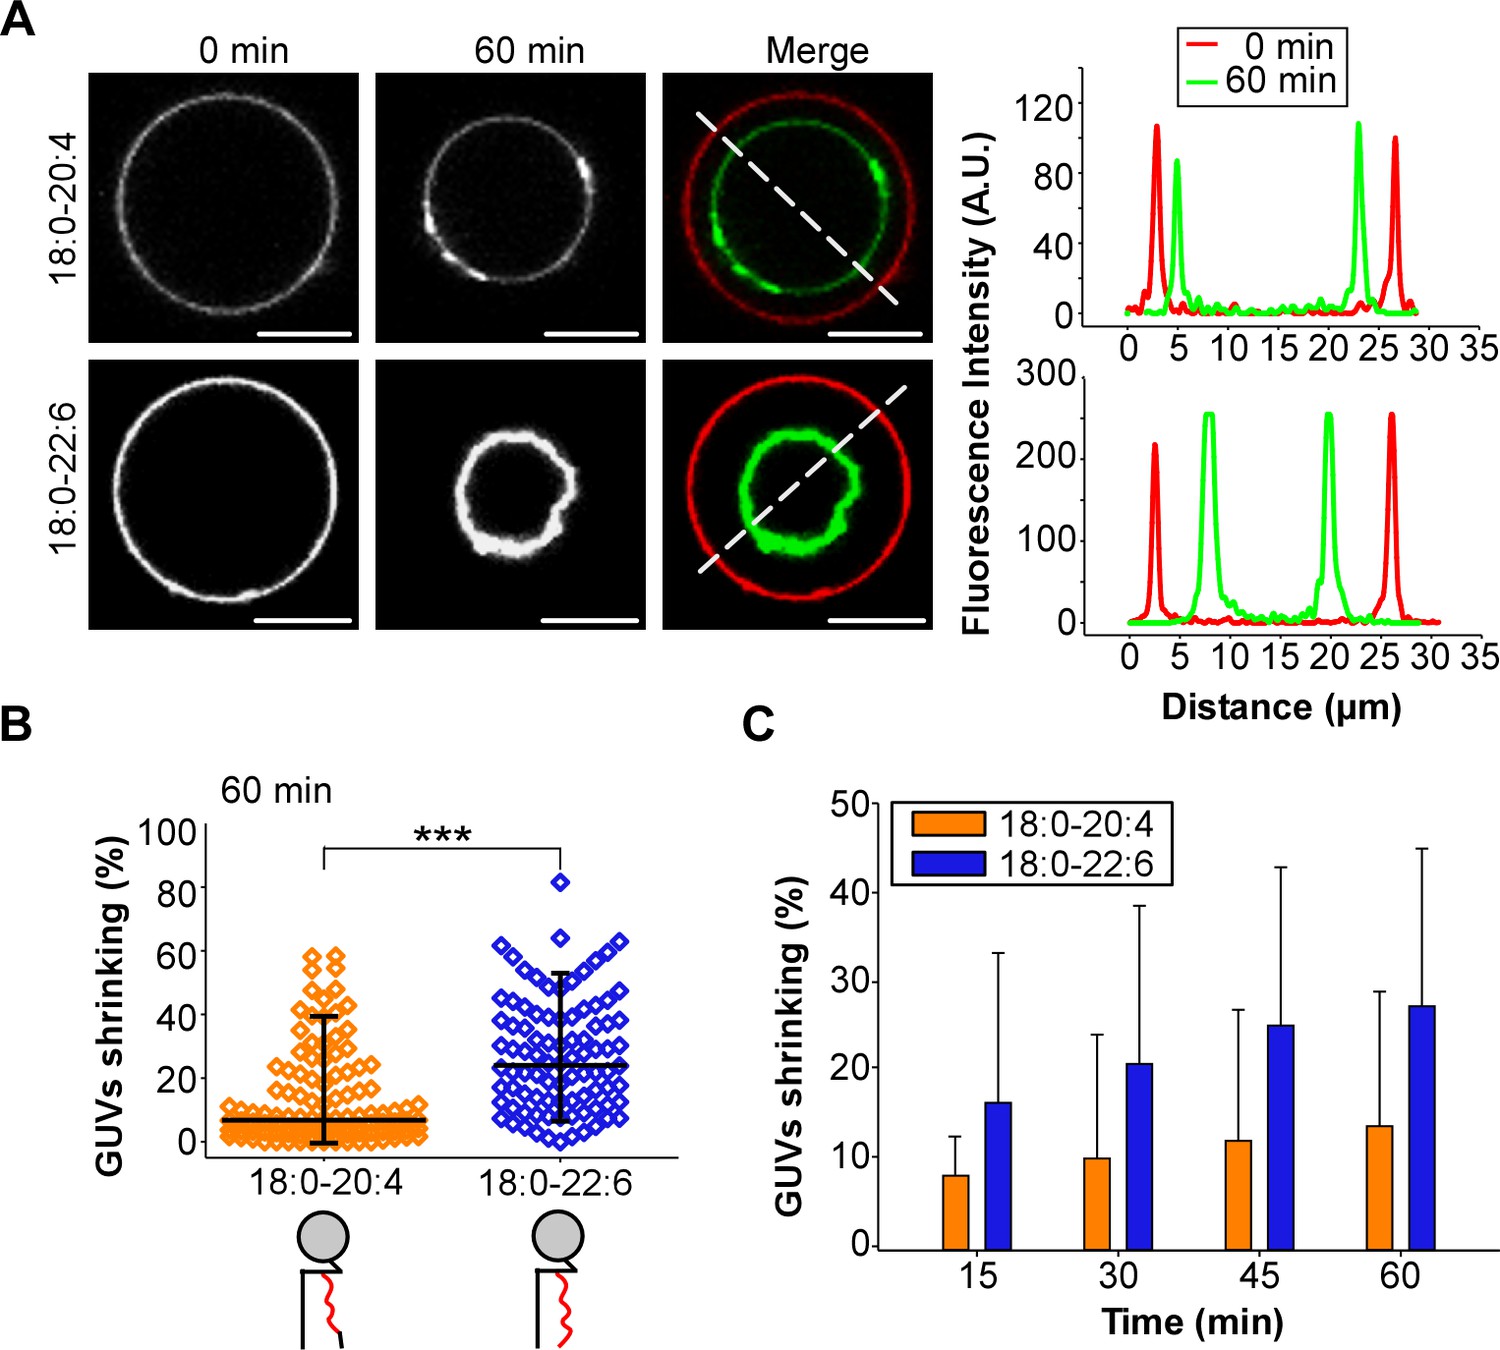
GUV shrinkage assay.
GUVs containing 18:0-20:4 or 18:0-22:6 phospholipids were incubated with dynamin (0.5 µM) and endophilin (1 µM) in presence of GTP (500 µM) for 60 min at 37°C. (A) Colored images showing overlays of the GUVs at time 0 (red) and after 60 min incubation (green). Note the collapse of the GUV containing 18:0-22:6 after 60 min incubation with the protein-nucleotide mixture. (B–C) Quantification of the experiment shown in (A) showing the GUV shrinking distribution after 60 min and mean ±SD over the time. Data are obtained from ~100 GUVs from five independent preparations. All lipid compositions are showed in Supplementary file 1.
Figure 5—figure supplement 1
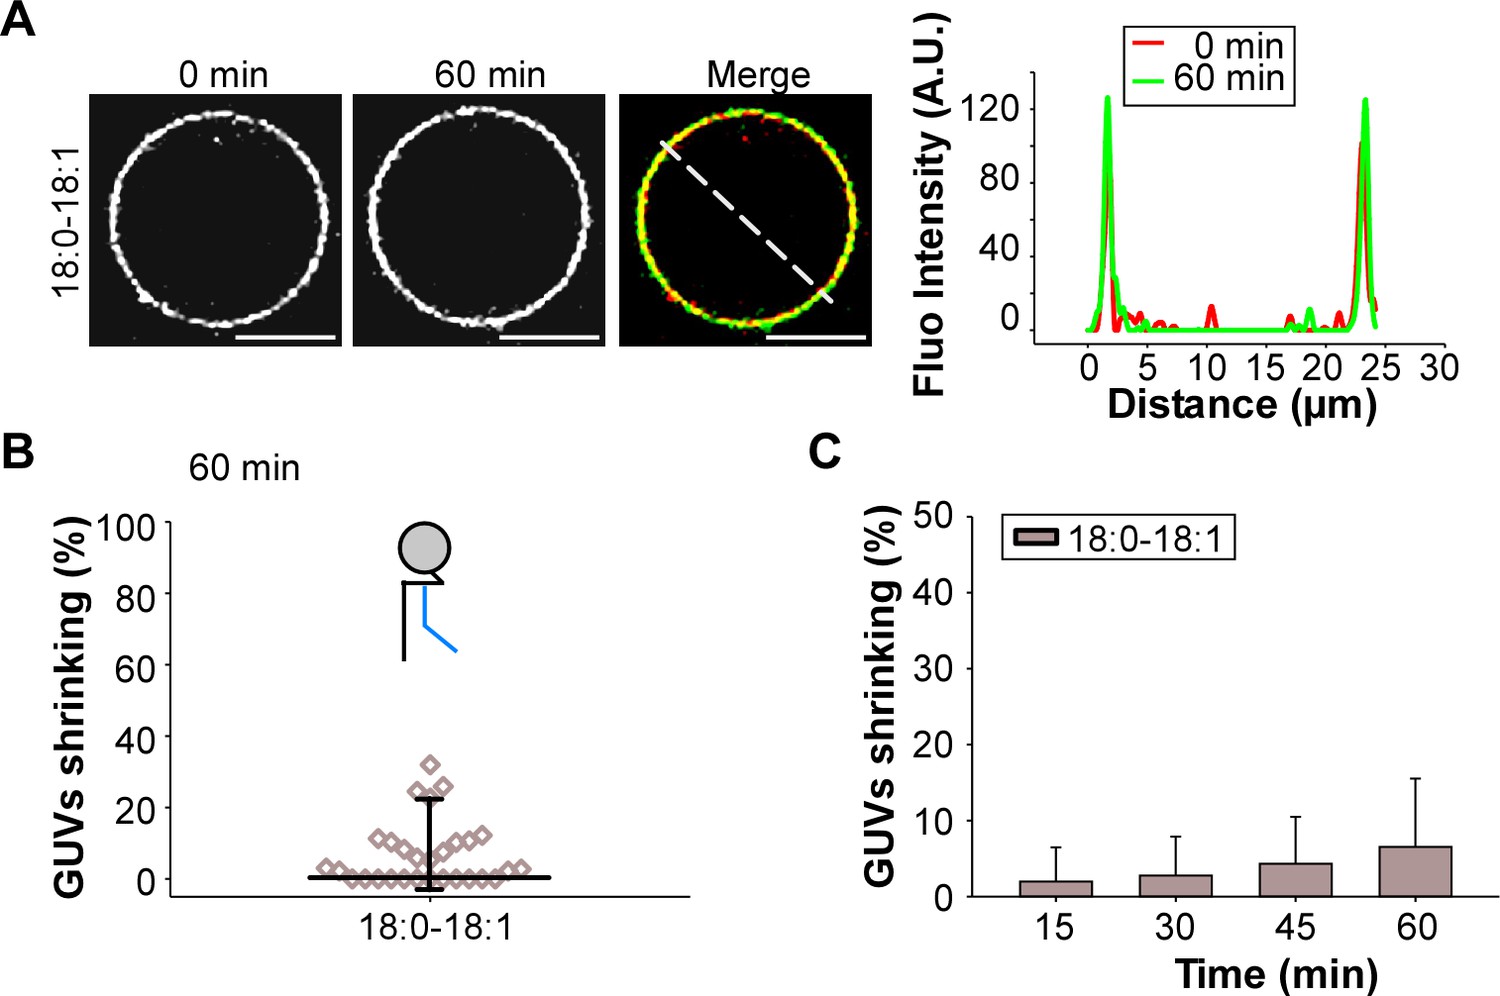
GUV shrinking assay with control monounsaturated membranes.
GUVs containing the indicated amounts of C18:0-C18:1 were incubated with dynamin (0.5 µM) and endophilin (1 µM) in presence of GTP (500 µM) for 60 min at 37°C. (A) The colored images show overlays of the GUVs at time 0 (red) and after 60 min incubation (green). No significant effect was detected on these GUVs as compared to GUVs with polyunsaturated phospholipids (see Figure 5). (B–C) Quantification of the experiment shown in (A) showing the GUV shrinking distribution after 60 min and mean ±SD over the time. Data are obtained from ~20 GUVs from one preparation. Lipid composition is shown in Supplementary file 1.
Figure 6 with 3 supplements
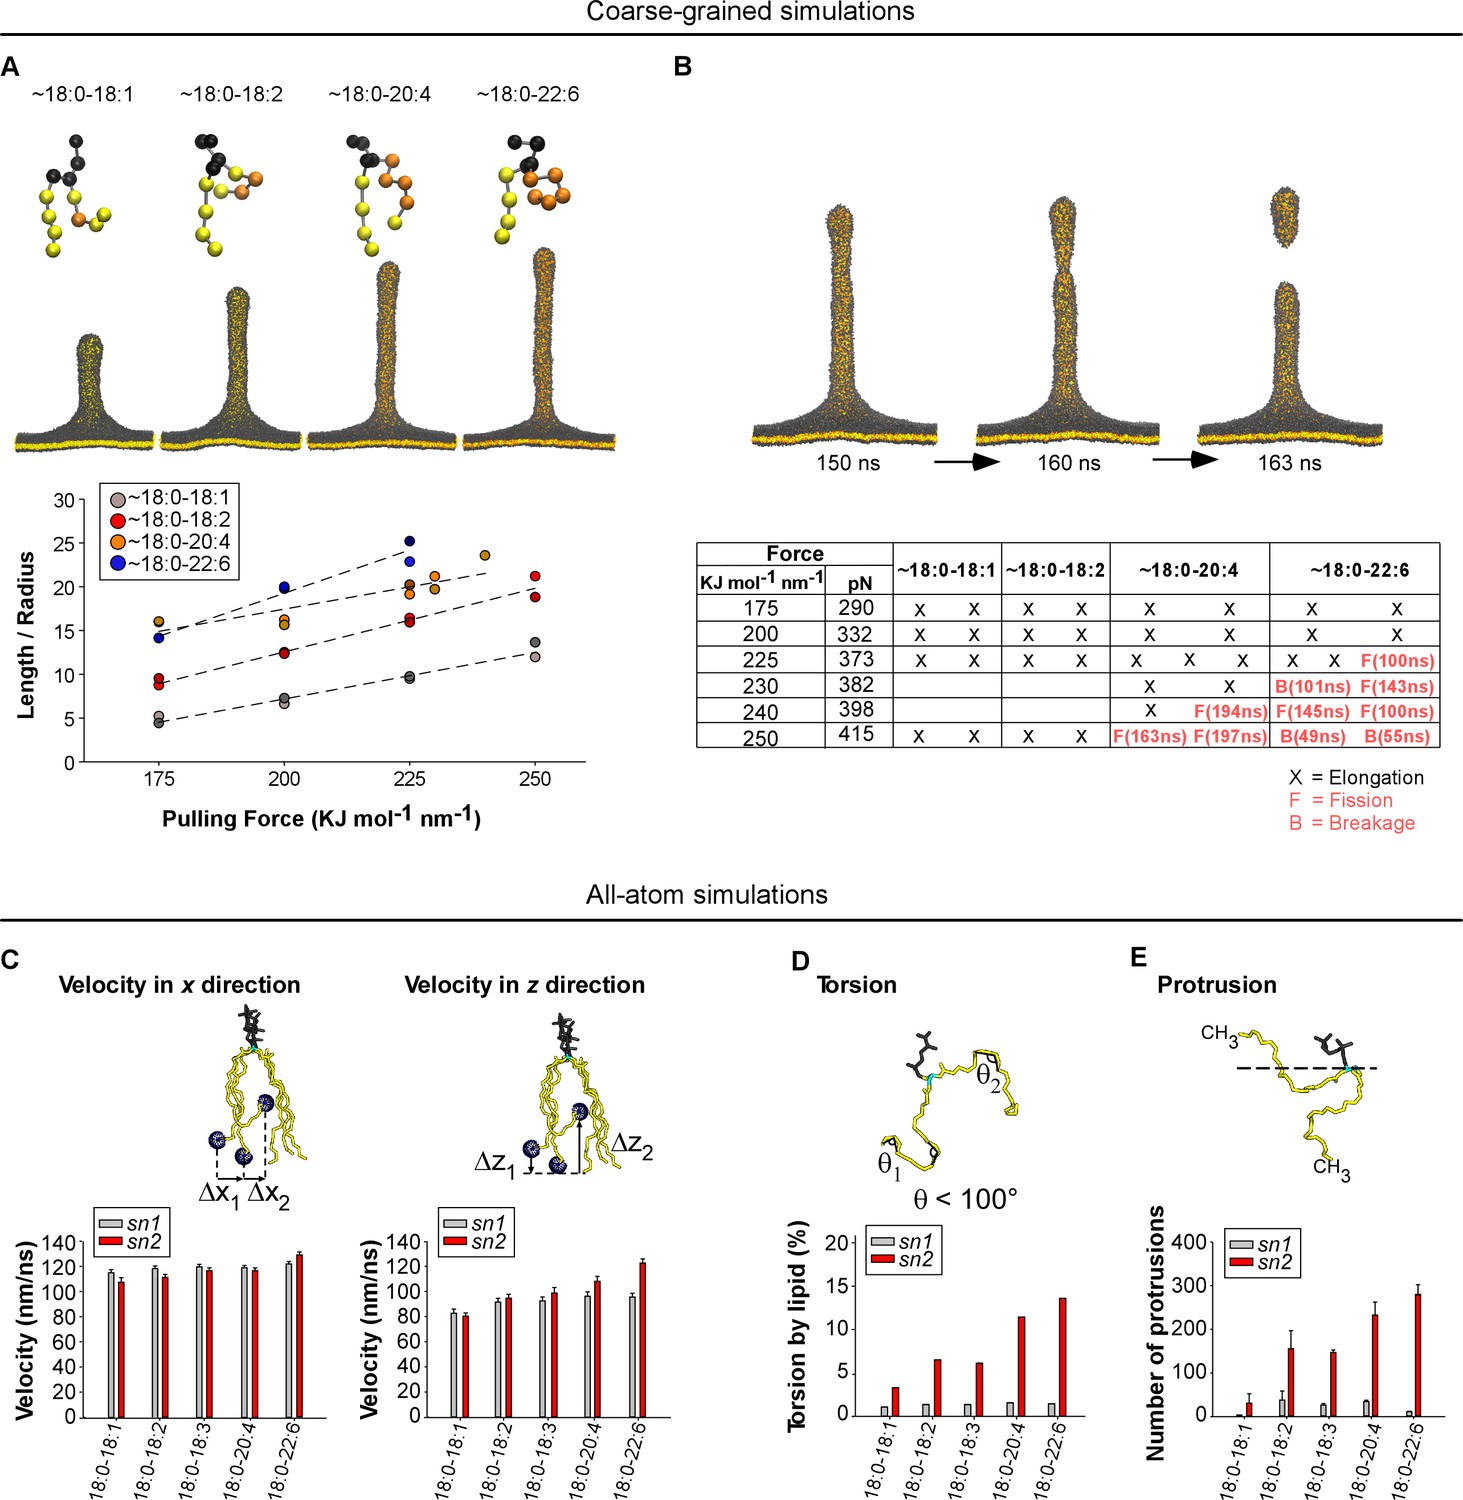
Molecular dynamics simulations.
(A) Top: snapshots at t = 200 ns of tubes as pulled with a 200 KJ mol−1 nm−1 force from coarse-grained models of membranes with the indicated asymmetric polyunsaturated PC. Bottom: plot of L/R as a function of the pulling force. The tube geometry was analyzed at t = 200 ns. (B) Top: snapshots of a tube pulling coarse-grained simulation (Force = 250 KJ mol−1 nm−1) obtained from a membrane with 18:0-20:4 PC and showing elongation and fission. See also Video 1. Bottom: summary of all simulations. Elongation, fission (F) and breakage events (B) are indicated. In contrast to fission, a breakage event corresponds to a rupture at the level of the lipids where the pulling force is applied. (C–F) Dynamics of the acyl chains of asymmetric polyunsaturated phospholipids from all-atom simulations. The analysis was performed on flat membrane patches with the same composition as that used in the experiments. (C) Velocity rate of the terminal CH3 group of the acyl chain along either the membrane normal (z velocity) or in the membrane plane (x-y velocity). (D) Frequency of acyl chain torsions as defined as conformations for which the acyl chain displays an angle <100°. (E) Number of protrusions of the CH3 group above the glycerol group of phospholipids. Color code for coarse-grained simulations: grey: lipid polar head and glycerol; orange: acyl chain regions with double carbon bonds; yellow: acyl chain regions with single carbon bonds. Color code for all-atom simulations: Grey: lipid polar head; cyan: glycerol; yellow: sn1 or sn2 acyl chains.
Figure 6—figure supplement 1
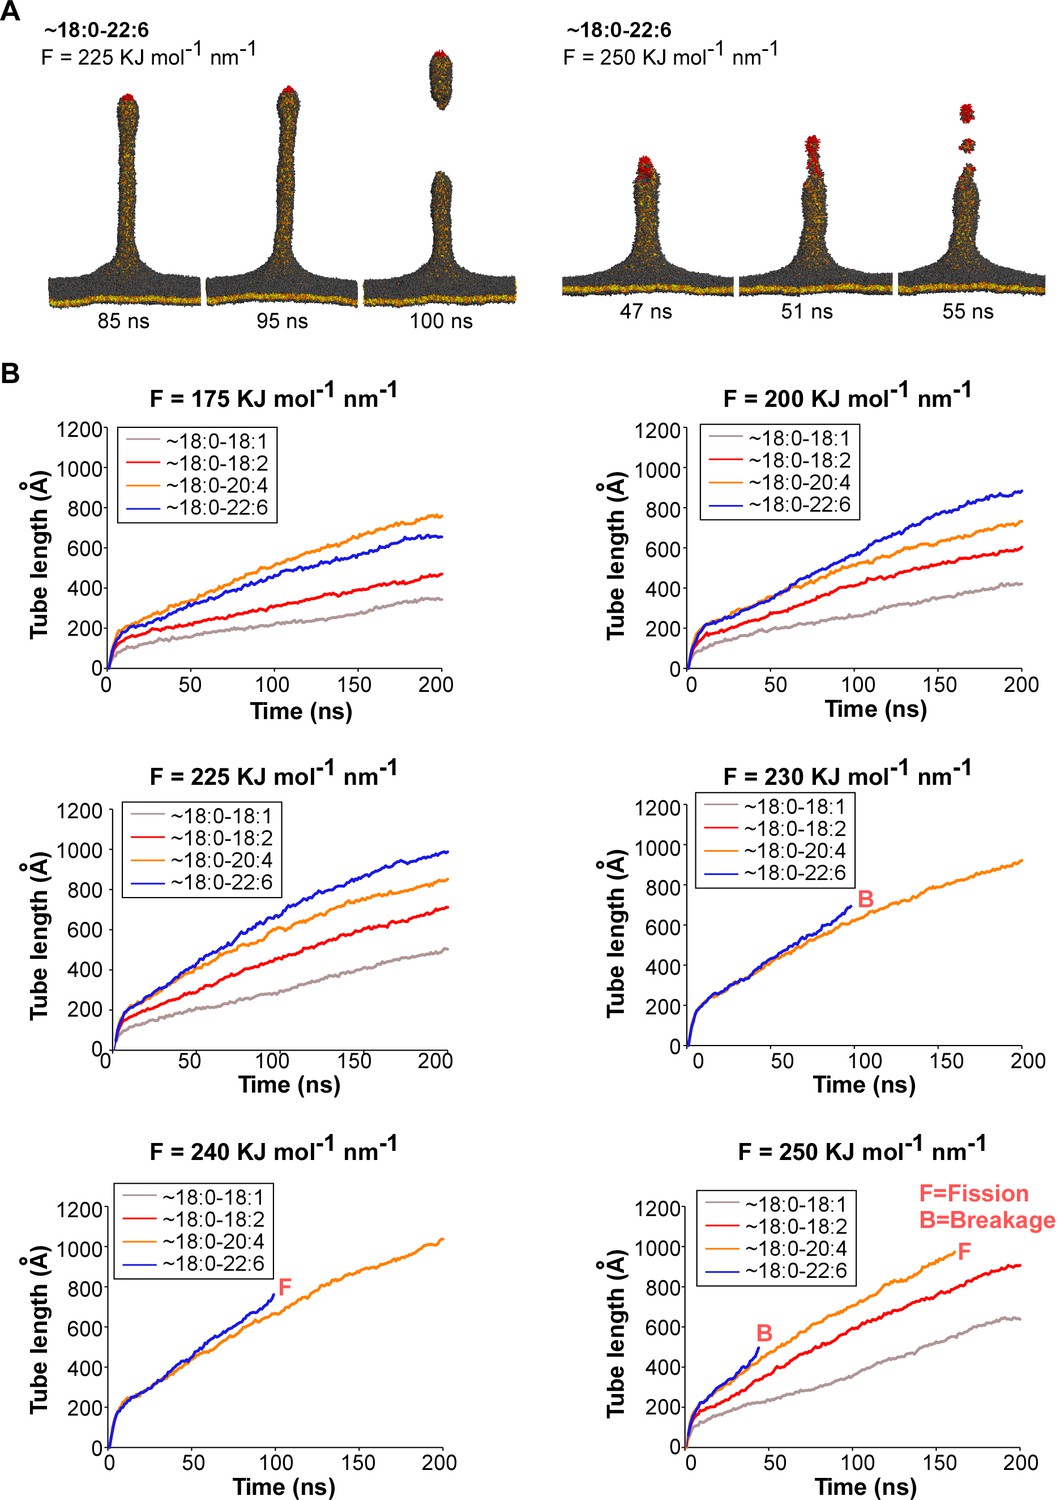
Coarse-grained molecular dynamics simulations of membrane deformation and fission.
(A) Comparison of an authentic fission event and a breakage event. In the first case, the membrane divides below the phospholipid patch (red) that endures the pulling force. In the second case, the membrane divides within the phospholipid patch (red) that endures the pulling force (B) Time course of tube pulling from coarse-grained models of membranes with asymmetric polyunsaturated phospholipids. Traces ending before 200 ns correspond to tubes that underwent breakage (B) or fission (F). See also Figure 6A–B.
Figure 6—figure supplement 2
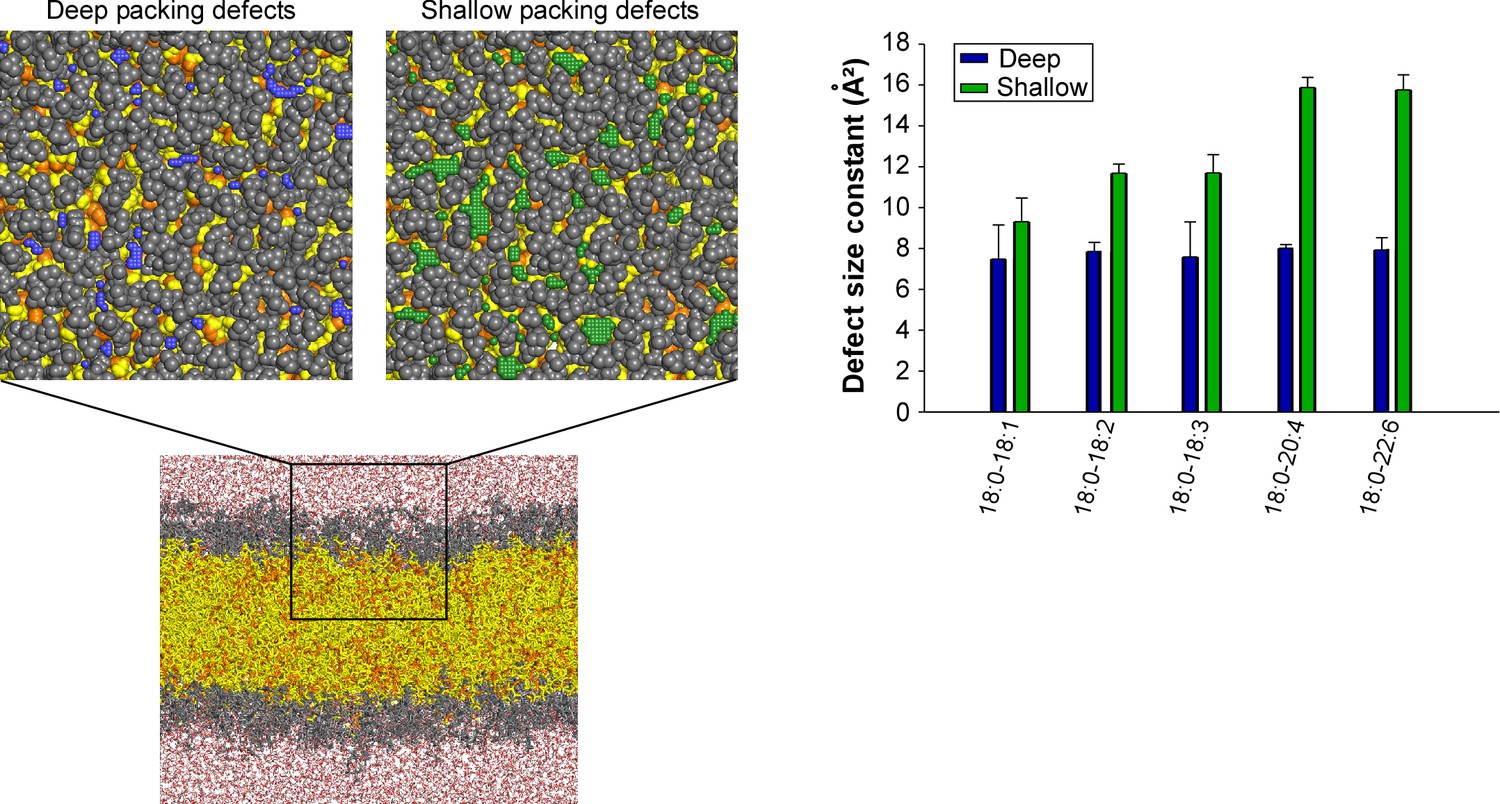
Distribution of deep and shallow lipid packing defects in all-atom simulations of membranes with the same composition as that used in the experiments of Figure 1 and detailed in Supplementary file 1.
https://doi.org/10.7554/eLife.34394.015
Figure 6—figure supplement 3
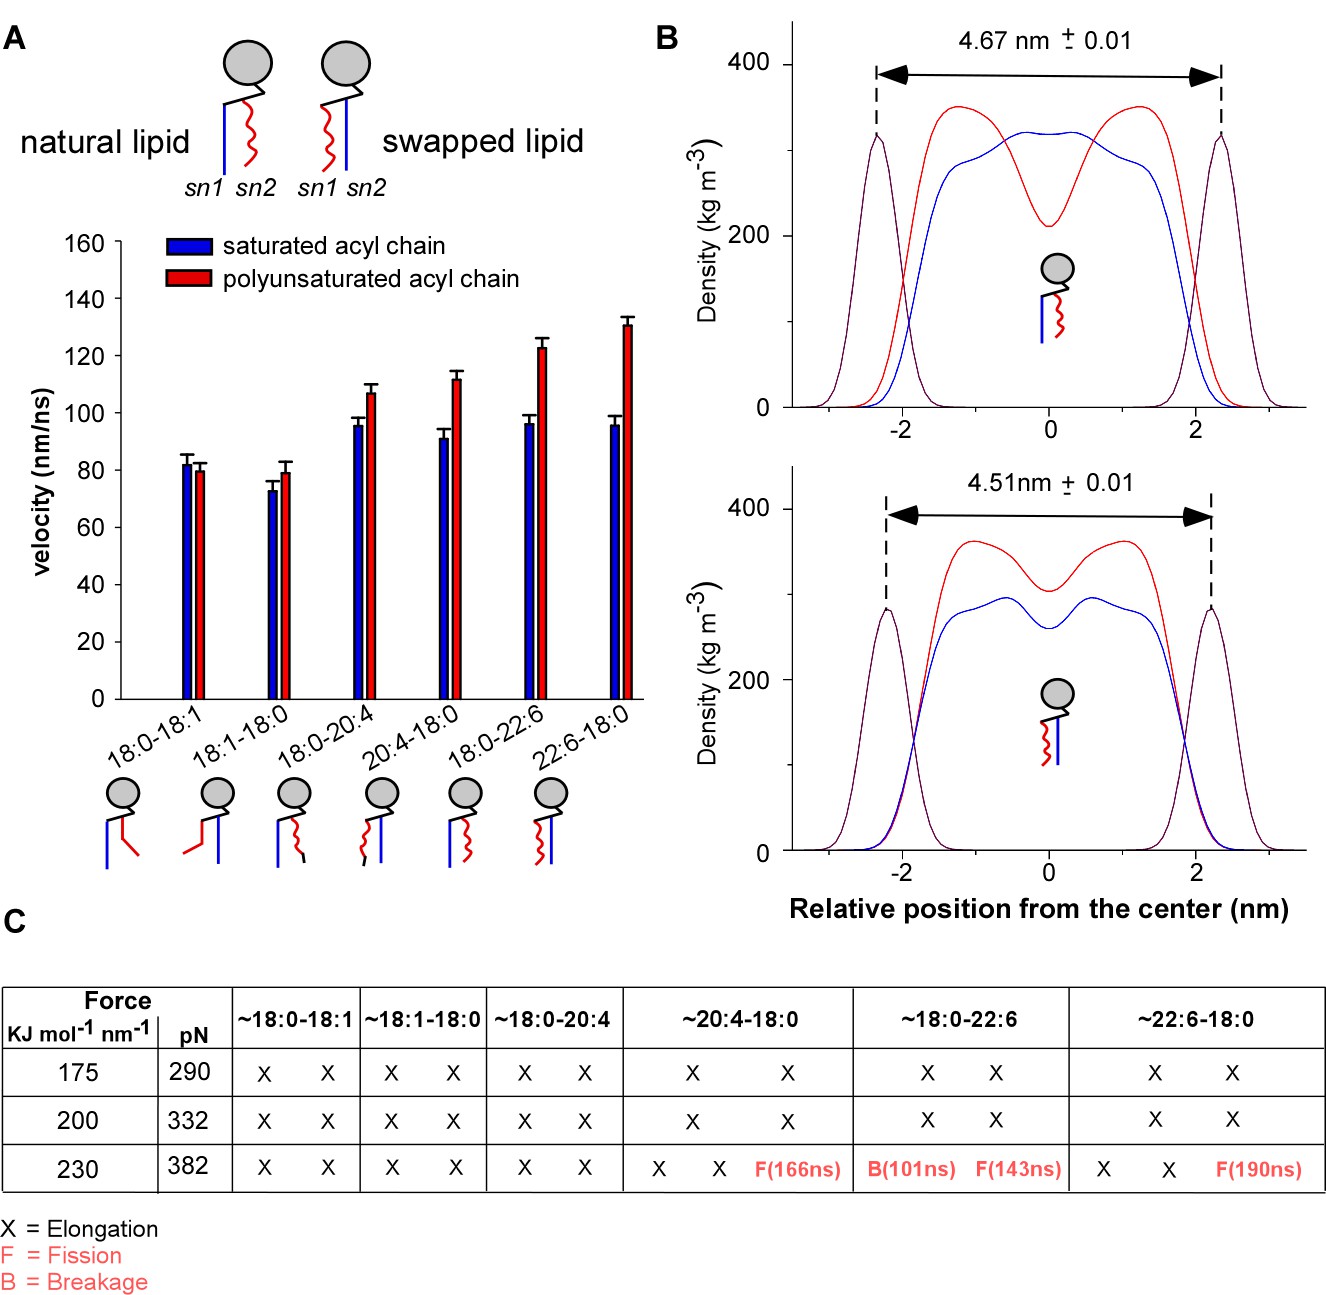
Comparison of phospholipids with a natural sn1-saturated-sn2-polyunsaturated profile and with a swapped sn1-polyunsaturated-sn2-saturated profile.
(A) Velocity rate of the terminal CH3 group of the acyl chains along the membrane normal (z velocity). For comparison, the values shown in Figure 6 for natural phospholipids have been reported. (B) Density profile of the acyl chains across the membrane bilayer. Also shown are the density profiles of the phosphate group, which were used to estimate the bilayer thickness. (C) Summary of the membrane tether pulling simulations. See also Video 2.
Videos
Video 1
Simulation of the formation of a tubule and its subsequent fission from a coarse-grained model of a membrane containing 18:0-20:4 phospholipids (see also Figure 6B) and submitted to a pulling force of 250 KJ mol−1 nm−1.
https://doi.org/10.7554/eLife.34394.017
Video 2
Simulation of the formation of a tubule from a coarse-grained bilayer containing 18:0-22:6 or 22:6-18:0 phospholipids (see also Figure 6—figure supplement 3C) and submitted to a pulling force of 200 KJ mol−1 nm−1.
https://doi.org/10.7554/eLife.34394.018Tables
Key resources table
| Reagent type (species) or resource | Designation | Source or reference | Identifiers | Additional information |
|---|---|---|---|---|
| Phosphatidylcholine | 1-stearoyl-2-oleoyl-sn-glycero-3-phosphocholine | Avanti Polar Lipids | Ref 18:0-18:1 PC | 850467 | |
| Phosphatidylcholine | 1-stearoyl-2-linoleoyl-sn-glycero-3-phosphocholine | Avanti Polar Lipids | Ref 18:0-18:2 PC | 850468 | |
| Phosphatidylcholine | 1-stearoyl-2-linolenoyl-sn-glycero-3-phosphocholine | Avanti Polar Lipids | 18:0-18:3 PC Custom | |
| Phosphatidylcholine | 1-stearoyl-2-arachidonoyl-sn-glycero-3-phosphocholine | Avanti Polar Lipids | Ref 18:0-20:4 PC | 850469 | |
| Phosphatidylcholine | 1-stearoyl-2-docosahexaenoyl-sn-glycero-3-phosphocholine | Avanti Polar Lipids | Ref 18:0-22:6 PC | 850472 | |
| Phosphatidylcholine | 1,2-dimyristoyl-sn-glycero-3-phosphocholine | Avanti Polar Lipids | Ref 14:0 PC (DMPC) | 850345 | |
| Phosphatidylcholine | 1,2-dioleoyl-sn-glycero-3-phosphocholine | Avanti Polar Lipids | Ref 18:1 (Δ9-Cis) PC (DOPC) | 850375 | |
| Phosphatidylcholine | 1,2-dilinoleoyl-sn-glycero-3-phosphocholine | Avanti Polar Lipids | Ref 18:2 (Cis) PC (DLPC) | 850385 | |
| Phosphatidylcholine | 1,2-diarachidonoyl-sn-glycero-3-phosphocholine | Avanti Polar Lipids | 20:4 (Cis) PC | 850397 | |
| Phosphatidylcholine | 1,2-didocosahexaenoyl-sn-glycero-3-phosphocholine | Avanti Polar Lipids | 22:6 (Cis) PC | 850400 | |
| Phosphoethanolamine | 1-stearoyl-2-oleoyl-sn-glycero-3-phosphoethanolamine | Avanti Polar Lipids | 18:0-18:1 PE | 850758 | |
| Phosphoethanolamine | 1-stearoyl-2-linoleoyl-sn-glycero-3-phosphoethanolamine | Avanti Polar Lipids | 18:0-18:2 PE | 850802 | |
| Phosphoethanolamine | 1-stearoyl-2-linolenoyl-sn-glycero-3-phosphoethanolamine | Avanti Polar Lipids | 18:0-18:3 PE Custom | |
| Phosphoethanolamine | 1-stearoyl-2-arachidonoyl-sn-glycero-3-phosphoethanolamine | Avanti Polar Lipids | Ref 18:0-20:4 PE | 850804 | |
| Phosphoethanolamine | 1-stearoyl-2-docosahexaenoyl-sn-glycero-3-phosphoethanolamine | Avanti Polar Lipids | Ref 18:0-22:6 PE | 850806 | |
| Phosphoethanolamine | 1,2-dimyristoyl-sn-glycero-3-phosphoethanolamine | Avanti Polar Lipids | Ref 14:0 PE | 850745 | |
| Phosphoethanolamine | 1,2-dioleoyl-sn-glycero-3-phosphoethanolamine | Avanti Polar Lipids | Ref 18:1 (Δ9-Cis) PE (DOPE) | 850725 | |
| Phosphoethanolamine | 1,2-dilinoleoyl-sn-glycero-3-phosphoethanolamine | Avanti Polar Lipids | Ref 18:2 PE | 850755 | |
| Phosphoethanolamine | 1,2-diarachidonoyl-sn-glycero-3-phosphoethanolamine | Avanti Polar Lipids | Ref 20:4 PE | 850800 | |
| Phosphoethanolamine | 1,2-didocosahexaenoyl-sn-glycero-3-phosphoethanolamine | Avanti Polar Lipids | Ref 22:6 PE | 850797 | |
| Phosphatidylserine | 1-stearoyl-2-oleoyl-sn-glycero-3-phospho-L-serine | Avanti Polar Lipids | Ref 18:0-18:1 PS | 840039 | |
| Phosphatidylserine | 1-stearoyl-2-linoleoyl-sn-glycero-3-phospho-L-serine | Avanti Polar Lipids | Ref 18:0-18:2 PS | 840063 | |
| Phosphatidylserine | 1-stearoyl-2-linolenoyl-sn-glycero-3-phospho-L-serine | Avanti Polar Lipids | 18:0-18:3 PS Custom | |
| Phosphatidylserine | 1-stearoyl-2-arachidonoyl-sn-glycero-3-phospho-L-serine | Avanti Polar Lipids | Ref 18:0-20:4 PS | 840064 | |
| Phosphatidylserine | 1-stearoyl-2-docosahexaenoyl-sn-glycero-3-phospho-L-serine | Avanti Polar Lipids | Ref 18:0-22:6 PS | 840065 | |
| Phosphatidylserine | 1,2-dimyristoyl-sn-glycero-3-phospho-L-serine | Avanti Polar Lipids | Ref 14:0 PS | 840033 | |
| Phosphatidylserine | 1,2-dioleoyl-sn-glycero-3-phospho-L-serine | Avanti Polar Lipids | Ref 18:1 PS (DOPS) | 840035 | |
| Phosphatidylserine | 1,2-dilinoleoyl-sn-glycero-3-phospho-L-serine | Avanti Polar Lipids | Ref 18:2 PS | 840040 | |
| Phosphatidylserine | 1,2-diarachidonoyl-sn-glycero-3-phospho-L-serine | Avanti Polar Lipids | Ref 20:4 PS | 840066 | |
| Phosphatidylserine | 1,2-didocosahexaenoyl-sn-glycero-3-phospho-L-serine | Avanti Polar Lipids | Ref 22:6 PS | 840067 |
Additional files
-
Supplementary file 1
Tables of the lipid composition of the various bilayers used in this study.
- https://doi.org/10.7554/eLife.34394.019
-
Supplementary file 2
Mdp input file of the all atom simulations.
- https://doi.org/10.7554/eLife.34394.020
-
Supplementary file 3
Mdp input file of the coarse-grained simulations
- https://doi.org/10.7554/eLife.34394.021
-
Transparent reporting form
- https://doi.org/10.7554/eLife.34394.022
Download links
A two-part list of links to download the article, or parts of the article, in various formats.
Downloads (link to download the article as PDF)
Open citations (links to open the citations from this article in various online reference manager services)
Cite this article (links to download the citations from this article in formats compatible with various reference manager tools)
Acyl chain asymmetry and polyunsaturation of brain phospholipids facilitate membrane vesiculation without leakage
eLife 7:e34394.
https://doi.org/10.7554/eLife.34394


